

ABSTRACT
Strong evidence supports the idea that fatty acids rather than carbohydrates are the main energy source of Mycobacterium tuberculosis during infection and latency. Despite that important role, a complete scenario of the bacterium’s metabolism when lipids are the main energy source is still lacking. Here we report the development of an in vitro model to analyze adaptation of M. tuberculosis during assimilation of long-chain fatty acids as sole carbon sources. The global lipid transcriptome revealed a shift toward the glyoxylate cycle, the overexpression of main regulators whiB3, dosR, and Rv0081, and the increased expression of several genes related to reductive stress. Our evidence showed that lipid storage seems to be the selected mechanism used by M. tuberculosis to ameliorate the assumed damage of reductive stress and that concomitantly the bacilli acquired a slowed-growth and drug-tolerant phenotype, all characteristics previously associated with the dormant stage. Additionally, intergenic regions were also detected, including the unexpected upregulation of tRNAs that suggest a new role for these molecules in the acquisition of a drug-tolerant phenotype by dormant bacilli. Finally, a set of lipid signature genes for the adaptation process was also identified. This in vitro model represents a suitable condition to illustrate the participation of reductive stress in drugs’ activity against dormant bacilli, an aspect scarcely investigated to date. This approach provides a new perspective to the understanding of latent infection and suggests the participation of previously undetected molecules.
IMPORTANCE
Mycobacterium tuberculosis establishes long-lasting highly prevalent infection inside the human body, called latent tuberculosis. The known involvement of fatty acids is changing our understanding of that silent infection; however, question of how tubercle bacilli globally adapt to a lipid-enriched environment is still an unanswered. With the single change of providing fatty acids as carbon sources, the bacilli switch on their program related to dormant stage: slowed growth, accumulation of lipid bodies, and development of drug tolerance. In this stage, unexpected and previously unknown participants were found to play putatively important roles during the process. For the first time, this work compares the global transcriptomics of bacteria by using strand-specific RNA sequencing under two different growth conditions. This study suggests novel targets for the control of tuberculosis and provides a new straightforward in vitro model that could help to test the activity of drugs against dormant bacilli from a novel perspective.
INTRODUCTION
It is estimated that 2 billion people are latently infected with Mycobacterium tuberculosis, representing potential cases of reactivation and transmission and hampering better control of the disease (1). As tuberculosis (TB) infection progresses, the bacilli face adverse environmental conditions to which they respond by entering into a silent phase known as dormancy. In this phase, the bacteria are able to survive for the entire life of the host causing latent infection. Eventually, they can also reactivate and cause active disease when the host’s immune system becomes weakened (2). Bacterial adaptation to the different stages of the infection involves fine regulation of gene expression. Global transcriptome analysis has identified critical regulators of gene expression such as the phoP virulence regulator (3), the kstR cholesterol regulator (4), the dosR hypoxia regulator (5), or Rv0081, which was also recently proposed as a hypoxia regulator (6). The identification of noncoding RNAs in M. tuberculosis also suggests that these molecules could regulate microbial adaptation (7, 8). During latency, M. tuberculosis is presumed to reside in lipid-rich foamy macrophages (9) and accumulate internal lipid droplets full of triacylglycerols (TAGs) that are used subsequently as an energy source for persistence (10). Nevertheless, the bacilli continue replication (11) and retain low but detectable metabolic activity (12). It has also been shown that M. tuberculosis uses host lipids, in particular, fatty acids and cholesterol, as energy sources during intracellular growth and persistence (13–15).
Although several in vitro models have been used to mimic the environment of dormant bacilli during latency (16–18), cultures grown in the presence of lipids, the most abundant molecules surrounding bacilli in vivo, have not been extensively analyzed.
To gain insight into the process of M. tuberculosis adaptation to a fatty acid environment, we developed an in vitro model where bacilli were grown in even-length long-chain fatty acids (LC-FAs) as the sole carbon source. Even-length LC-FAs were selected because they are the main LC-FAs found in human cells (19) and are a major component of TAGs (20). Although other in vivo lipid energy sources cannot be ignored, it is possible that for long-term infection, bacilli might benefit by selecting even-length LC-FAs, avoiding the toxicity associated with other lipid sources (21).
We analyzed changes in the global transcriptome of M. tuberculosis by using high-throughput methods such as strand-specific RNA sequencing (ss-RNA-seq) (22).
RESULTS AND DISCUSSION
The global transcriptome of M. tuberculosis in the LC-FA in vitro model.
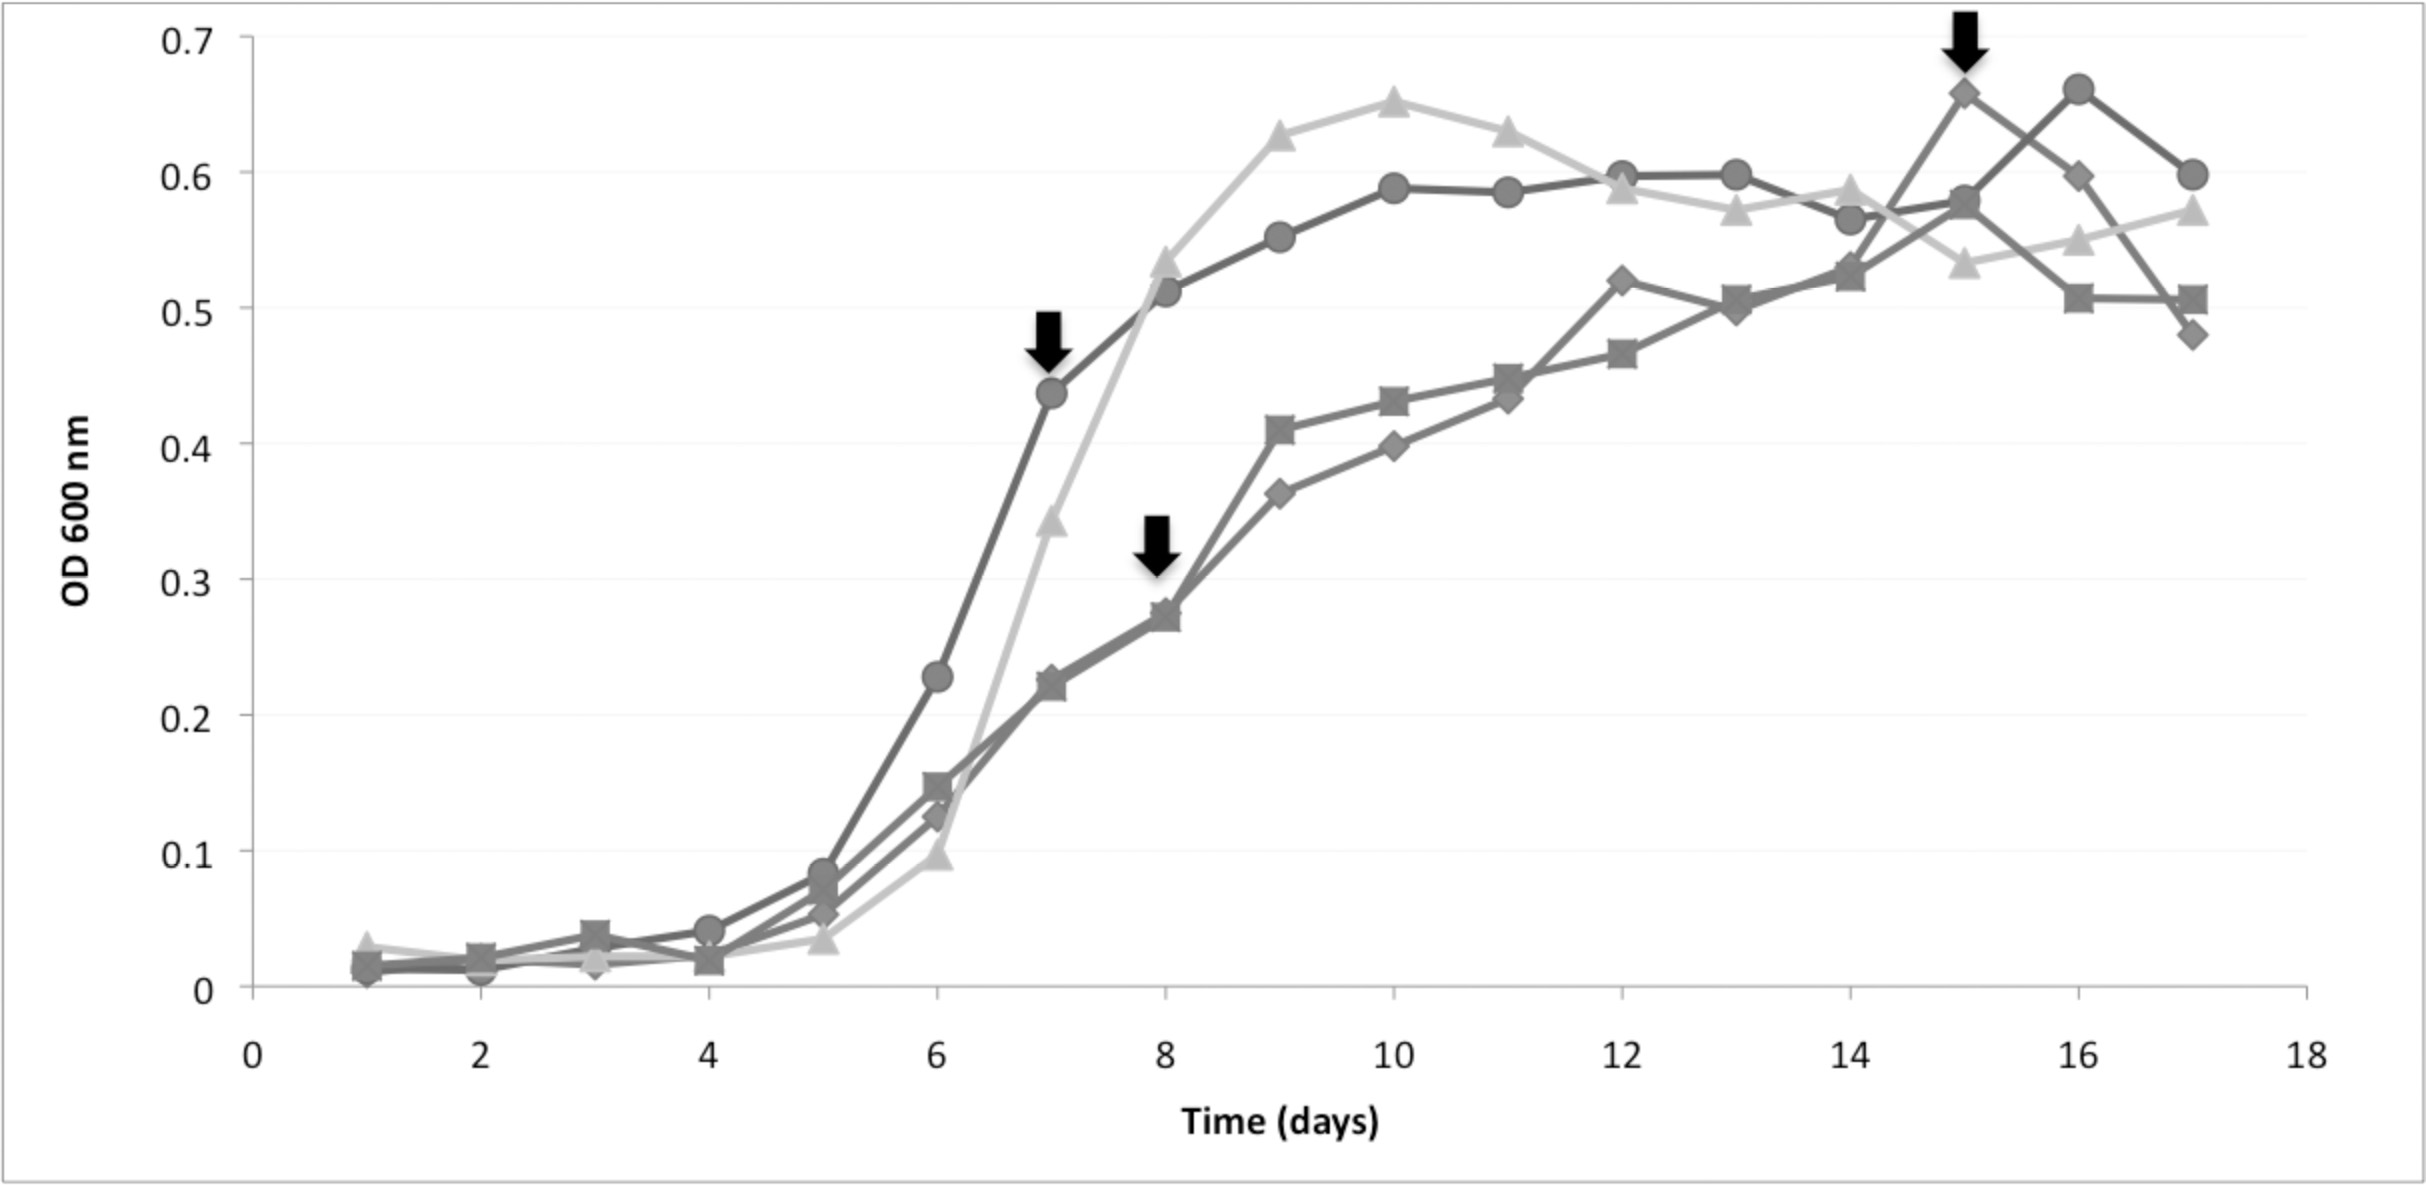
In order to mimic the nutrient conditions presumed to be encountered by M. tuberculosis during in vivo infection (23), we cultured M. tuberculosis H37Rv in a medium supplemented with a mixture of even-length LC-FAs as the sole carbon source. Growth in LC-FAs was compared to growth in dextrose as a control. We found that growth in LC-FAs was slower than growth in dextrose but reached similar saturation points (see Fig. S1 in the supplemental material).
RNA was analyzed by ss-RNA-seq with material from bacilli grown in dextrose to the exponential (DE) and stationary (DS) phases and in LC-FA to the exponential (FE) and stationary (FS) phases (see Fig. S1). The sequence depth obtained showed good coverage of the M. tuberculosis genome, as indicated by the plateaus reached in all instances by mapping reads against coding sequences (CDS) (see Fig. S2A). A normal distribution of the data was achieved in all cases (see Fig. S2B) (24). The number of sequences retained after processing for quality was 13.1 to 19.3 million reads (Table 1). To facilitate the comparison of gene expression, the data were normalized as reads per kilobase per million reads (RPKM). Only genes showing ≥1 RPKM were considered for analysis. Statistical analysis for significant differential gene expression was performed with Fisher exact test (see Table S1A and B in the supplemental material). That analysis gave results consistent with those obtained with the DEGseq package for biological replicates (see Table S1C and D) (see Materials and Methods).
TABLE 1 .
Transcriptomic profile of M. tuberculosis in different carbon sourcesa
| Reads | No. (%) of reads in following growth phase: |
|||
|---|---|---|---|---|
| DE | DS | FE | FS | |
| All | 13.12 | 19.29 | 18.314 | 16.054 |
| All mapped | 8.17 (62.3) | 10.78 (55.9) | 9.56 (53.4) | 8.01 (51.2) |
| Mapped without rRNA | ||||
| Mapped to CDS | 0.52 (71.3) | 0.51 (57.6) | 0.28 (61.6) | 0.10 (13.4) |
| Mapped to IGRs | 0.17 (22.4) | 0.25 (28.0) | 0.149 (32.9) | 0.62 (83.0) |
| Mapped to antisense CDS | 0.05 (6.4) | 0.13 (14.4) | 0.02 (5.4) | 0.03 (3.6) |
Total numbers (in millions) of reads determined under the different conditions tested (upper part) and numbers (percentages) of reads determined by excluding those corresponding to rRNA (lower part) are shown.
We identified all 45 tRNAs (25) (see Table S2A), all of the most highly expressed small RNAs (7), and most of the previously identified noncoding RNAs (8) (see Table S2B). During growth in LC-FAs, gene expression (reads mapped to CDS) was greatly reduced compared with the control, particularly in the stationary phase (Table 1). This low gene expression contrasts with the high number of reads that mapped to intergenic regions (IGRs), suggesting close control mediated by small RNAs in cultures grown with LC-FAs.
Consistent with the high number of reads mapping to IGRs in the FS culture, the four most highly expressed IGRs corresponded to this sample (see Table S2B and C). Two of them, namely, MTS2823 and MTS0977 (see Table S2C), have also shown increased expression during infection (7), suggesting that they might be important regulators and highlighting the association of the conditions used in our model with the conditions encountered by the bacilli in vivo.
More remarkable was the overexpression of tRNAs in FS (see Table S2A), which contrasts with the few transcripts mapped to CDS in FS and which, presumably, was a reflection of low translation activity (Table 1). Aminoacyl tRNAs are involved in cellular processes other than protein synthesis, such as the modification of bacterial membrane lipids via the multiple-peptide resistance factor (MprF) protein (26). MprF attaches positively charged amino acids to the polar heads of phosphatidylglycerol, effectively neutralizing the negative charge of the membrane (27) and thus decreasing membrane permeability and susceptibility to antibacterial peptides and cationic antibiotics (28). The tRNAs involved in these changes are tRNA-Lys, tRNA-Ala, and less frequently tRNA-Arg (26, 29), the same tRNAs that were expressed more in FS than in DS in our model (Fig. 1). We hypothesize that, in the presence of FA, bacilli modify their envelope by aminoacyl-tRNAs, conferring adaptation to stress and possibly increasing tolerance to antibiotics, a process associated with the dormant stage of M. tuberculosis (17). Whether this attractive mechanism to modify the cell envelope is, in fact, involved in the adaptation and survival of the bacilli during long-term infection remains to be investigated.
FIG 1 .
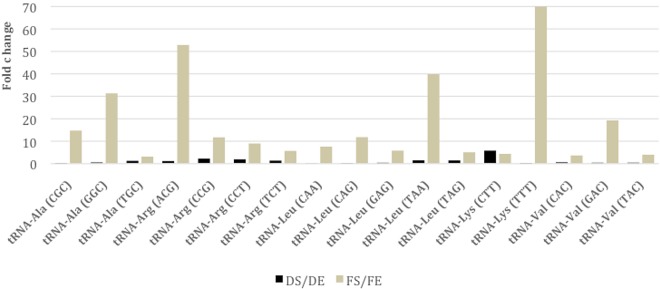
Differential expression of tRNAs in the fatty acid model. Fold change comparison of tRNAs between the stationary and exponential phases under both culture conditions. Fold changes were calculated by calculating DS/DE (black bars) and FS/FE (light brown bars) RPKM ratios.
Comparative analysis of CDS between growth in dextrose and LC-FA showed that majority of genes had similar expression levels, both at exponential and stationary phases (see Fig. S3A and B in the supplemental material), with only 10% of the potential CDS being differentially expressed (Fig. 2; see Table S3). This analysis identified genes with differential expression in all of the functional categories of TubercuList (http://www.tuberculist.epfl.ch), with the exception of genes belonging to the PE/PPE category in the exponential phase (Fig. 2; see Table S3). On the contrary, the PE/PPE category was overrepresented in the stationary phase (Fig. 2 and Table S3), suggesting that when M. tuberculosis grows in a fatty acid environment, these abundant proteins (25) might play an additional role in antigenic variation and immune evasion (30, 31). Contrary to our expectations, genes belonging to the functional category “lipid metabolism” were not overrepresented in either the exponential or the stationary phase (Fig. 2; see Table S3), a result that could be attributed to the gene redundancy present within this category (25). Among the most highly differentially expressed genes in FS, we identified pckA (P = 4−14) and tgs-1 (P = 2−13) (see Table S1F), both of which play critical roles in the lipid metabolic pathways of M. tuberculosis (10, 32). As happens with pckA, the gene icl-1 was also upregulated within the trichloroacetic acid (TCA) cycle (see Table S1E and F), consistent with the central role of these enzymes in M. tuberculosis lipid metabolism (13). Because of the use of only even-length LC-FAs, we did not expect production of propionyl coenzyme A (CoA) from lipid degradation. In agreement with this, we did not detect increased expression of genes belonging to the methylcitrate and methylmalonate pathways (33).
FIG 2 .
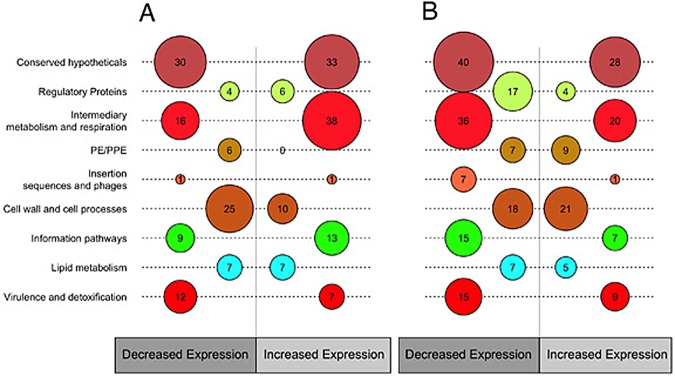
Genes differentially expressed in the fatty acid model. Numbers of genes differentially expressed by functional categories according to TubercuList (http://www.tuberculist.epfl.ch/) are shown. Circle sizes correspond to the numbers of genes with significant differential expression in fatty acid medium versus dextrose medium. (A) Exponential phase. (B) Stationary phase.
The functional category of “regulatory proteins” was underrepresented in the stationary phase, highlighting the involvement of four genes upregulated in the same phase (FS) (Fig. 2; see Table S3). Two of these correspond to the known regulators WhiB3, which is associated with redox balance (34), and DosR, which is related to redox balance, and a major regulator of hypoxia in M. tuberculosis (5). As a result, a large number of DosR-regulated genes were also expressed more in FS than in DS (Table 2; see Table S1F). We also identified the recently reported regulator Rv0081, which is considered a global hypoxic response regulator (6) and the presumptive transcriptional regulator nrdR (http://www.tuberculist.epfl.ch).
TABLE 2 .
Member genes of the dormancy regulon with significantly increased expression in the fatty acid model
| Gene tag | Gene name |
Functional categorya |
Function (reference) | RPKM ratiob |
P valuec |
||
|---|---|---|---|---|---|---|---|
| FE/DE | FS/DS | FE vs DE | FS vs DS | ||||
| Rv0079 | 10 | Unknown; probable transduction regulatory protein (42) |
1.59 | 2.10 | 1.09 E-12 | 3.37 E-07 | |
| Rv0080 | 10 | —d | 9.00 | — | 1.19 E-09 | ||
| Rv0081 | 9 | Global regulator in hypoxia | — | 1.10 | — | 0.014 | |
| Rv0243 | fadA2 | 1 | Lipid degradation | — | 1.60 | — | 9.87 E-05 |
| Rv0569 | 10 | — | 3.07 | — | 0.90 E-14 | ||
| Rv0570 | nrdZ | 2 | Ribonucleoside-diphosphate reductase | — | 2.67 | — | 0.004 |
| Rv1436 | gap | 7 | 1.15 | — | 0.028 | — | |
| Rv1652 | argC | 7 | Arginine biosynthesis | — | 3.00 | — | 8.33 E-05 |
| Rv1733c | 3 | Unknown; probable conserved transmembrane protein |
2.77 | 1.50 | 2.62 E-08 | 0.012 | |
| Rv1738 | 10 | — | 1.15 | — | 0.90 E-14 | ||
| Rv1813c | 10 | 3.53 | — | 1.09 E-12 | — | ||
| Rv1996 | 0 | Unknown; universal stress family protein | 1.93 | 1.19 | 1.09 E-12 | 6.27 E-06 | |
| Rv2005c | 0 | Unknown; universal stress family protein | — | 6.50 | — | 3.15 E-13 | |
| Rv2007c | fdxA | 7 | Ferredoxin FdxA | — | 2,18 | — | 1.09 E-12 |
| Rv2030c | 10 | — | 5.25 | — | 3.88 E-10 | ||
| Rv2031c | hspX | 0 | Stress protein induced in hypoxia | — | 6.05 | — | 0.90 E-14 |
| Rv2623 | TB31.7 | 0 | Unknown; universal stress family protein | — | 3.08 | — | 0.90 E-14 |
| Rv2625c | 3 | Unknown; probable conserved transmembrane protein |
— | 3.20 | — | 1.44 E-06 | |
| Rv2626c | hrp-1 | 10 | — | 4.67 | — | 0.90 E-14 | |
| Rv2627c | 10 | — | 2.43 | — | 2.96 E-06 | ||
| Rv2628 | 10 | — | 1.40 | — | 1.18 E-05 | ||
| Rv2629 | 10 | — | 1.13 | — | 4.16 E-08 | ||
| Rv3127 | 10 | — | 1.33 | — | 0.003 | ||
| Rv3130c | tgs-1 | 1 | TAG | — | 2.31 | — | 2.07 E-13 |
| Rv3131 | 10 | Unknown; putative NAD(P)H nitroreductase | 2.89 | 4.00 | 1.09 E-12 | 9.04 E-13 | |
| Rv3133c | devR | 9 | Regulator part of the Dos TCSe | — | 2.60 | — | 6.54 E-05 |
| Rv3134c | 0 | Unknown; universal stress protein family | 1.03 | 3.43 | 5.99 E-06 | 3.19 E-10 | |
Functional categories based on http://www.tuberculist.epfl.ch: 0, virulence, detoxification, and adaptation; 1, lipid metabolism; 2, information pathways; 3, cell wall and cell processes; 7, intermediary metabolism and respiration; 9, regulatory proteins; 10, conserved hypothetical proteins.
RPKM ratio according to phase of growth: exponential (FE/DE) or stationary (FS/DS). See Table S1A and B in the supplemental material for the complete set of data. The gene is overexpressed in FE or FS if the ratio is above 1.
Determined by Fisher exact test, in which statistically significant differential expression between two conditions was determined by looking at genes with FDRs of <0.05 (see Materials and Methods for details).
—, gene with a ratio of <1 or with no significantly increased expression under those conditions.
TCS, two-component regulatory system.
Given that WhiB3 and DosR, two heme sensor proteins related to intracellular redox balance (34, 35), were identified as key components of the adaptation of M. tuberculosis to growth in LC-FA, we searched for significantly overexpressed genes involved in redox balance. Independently of the phase of growth, bacilli cultured in LC-FAs had a higher percentage of significantly overexpressed genes associated with reductive stress (see Table S4A). These results suggest that growing M. tuberculosis in a fatty acid medium putatively causes a burst in reductive stress and thus the required molecules to maintain redox balance would be induced in order to allow cell growth under these conditions. An imbalance of the redox equilibrium leads to either reductive or oxidative stress responses, the latter well documented to be involved in M. tuberculosis infection (36). However, the contribution of its counterpart, namely, reductive stress, has barely been considered thus far and occurs when reducing equivalents, such as NADH, FADH, or NADPH, are abnormally increased (34, 37). In our LC-FA cultures, the reducing equivalents that could be generated by both β-oxidation of LC-FAs and TCA metabolic activities would result in reductive stress that must be cleared for survival via reductive sinks, such as polymer deposition, reverse TCA, or nitrate reductase activity, among others (35, 37). The induced expression of 11 genes with allegedly reductive sink activity, 8 of which are involved in polymer deposition, might indicate the participation of reductive stress during growth of M. tuberculosis in LC-FA (Table 3). Our results suggest that polymer deposition, which includes TAG accumulation, as well as the formation of other complex lipids, such as SL-1, PAT, DAT, and PDIM (Table 3), was the main reductive sink mechanism used by M. tuberculosis when grown on fatty acids as carbon sources. This is consistent with the observed lipid droplets inside M. tuberculosis during the stationary phase of growth in LC-FA medium (Fig. 3A) and agrees with the suggestion that lipid accumulation could be a reputed marker of M. tuberculosis during latent infection (17, 38). The accumulation of lipid droplets inside M. tuberculosis in our LC-FA in vitro model, together with the high expression of tgs-1, prompted us to test for drug tolerance, another dormancy-related characteristic of the bacilli. To do this, we determined the drug susceptibility of M. tuberculosis to a mixture of four drugs known to be active against replicating and nonreplicating bacilli (39). Our results showed that M. tuberculosis manifested greater drug tolerance in the presence of lipids than during growth in dextrose (Fig. 3B and 3C). The relationship between the detected overexpression of tRNAs and drug tolerance deserves further investigation, as it represents an attractive idea regarding the participation of tRNAs in the dormant stage of M. tuberculosis.
TABLE 3 .
Genes with significantly increased expression and their putative relation to reductive stress
| Gene tag | Gene name |
Growth phase |
Functional categoryb |
Function | Putative influence on reductive stressc |
RPKM ratiod |
P valuee |
|---|---|---|---|---|---|---|---|
| Rv0243a | fadA2 | FS | 1 | Lipid degradation | 1.60 | 9.87 E-05 | |
| Rv0570a | nrdZ | FS | 2 | Ribonucleoside-diphosphate reductase | NADH/NADPH
|
2.67 | 0.004 |
| Rv0694 | lldD1 | FE | 7 | l-Lactate dehydrogenase | 1.09 | 0.029 | |
| Rv0697 | FE | 7 | Unknown; probable dehydrogenase | 4.33 | 0.001 | ||
| Rv1180 | pks-3 | FE | 1 | Probable polyketide synthase | Polymer deposition
|
3.20 | 5.9 E-04 |
| Rv1436a | gap | FE | 7 | Probable GADPHf | NADH
|
1.15 | 0.028 |
| Rv1652a | argC | FS | 7 | Arginine biosynthesis | NADH/NADPH
|
3.00 | 8.33 E-05 |
| Rv1908c | katG | FE | 0 | Catalase/peroxidase | 1.57 | 0.004 | |
| Rv2382c | mbtC | FE | 1 | Polyketide synthase | Polymer deposition
|
4.00 | 0.032 |
| Rv2590 | fadD9 | FE | 1 | Lipid degradation | NADH/NADPH
|
3.71 | 5.68 E-07 |
| Rv2781 | FE | 7 | Oxidoreductase | 3.80 | 1.94 E-10 | ||
| Rv2794c | pptT | FE | 1 | 4′-Phosphopantetheinyl transferase | Polymer deposition
|
1.18 | 0.041 |
| FS | 3.00 | 8.33 E-05 | |||||
| Rv2931 | ppsA | FS | 1 | PDIM biosynthesis | Polymer deposition
|
2.00 | 0.041 |
| Rv2995c | leuB | FS | 7 | Leucine synthesis | NADH/NADPH
|
2.60 | 6.54 E-05 |
| Rv2996c | serA1 | FS | 7 | l-Serine synthesis | NADH/NADPH
|
3.00 | 0.019 |
| Rv3130ca | tgs-1 | FS | 1 | TAG synthase | Polymer deposition
|
2.31 | 2.07 E-13 |
| Rv3131a | FE | 10 | Unknown | Reductant collector
|
2.89 | 1.09 E-12 | |
| FS | Putative NAD(P)H nitroreductase | 4.00 | 9.04 E-13 | ||||
| Rv3145 | nuoA | FE | 7 | Probable NADH-dehydrogenase | Reductant collector
|
1.03 | 0.008 |
| Rv3229c | desA3 | FE | 1 | Lipid desaturase | Polymer deposition
|
3.80 | 1.09 E-12 |
| Rv3230 | FE | 7 | Oxidoreductase | 1.32 | 0.006 | ||
| Rv3371 | FS | 1 | TAG synthesis | Polymer deposition
|
2.00 | 0.041 | |
| Rv3825c | pks-2 | FE | 1 | Probable polyketide synthase | Polymer deposition
|
1.27 | 1.34 E-04 |
Member of the DosR regulon.
Functional categories based on http://www.tuberculist.epfl.ch: 0, virulence, detoxification, and adaptation; 1, lipid metabolism; 2, information pathways; 7, intermediary metabolism and respiration; 10, conserved hypothetical proteins.
RPKM ratio according to phase of growth: exponential (FE/DE) or stationary (FS/DS). The gene is overexpressed in FE or FS if the ratio is >1. See Table S1A and B in the supplemental material for the complete set of data.
Arrows indicate the putative contributions of genes to the increase (up arrow) or decrease (down arrow) in reductive equivalents. Absence of an arrow indicates a gene that could contribute to both an increase and a decrease in reductive equivalents, for example, an oxidoreductase-encoding gene.
Determined by Fisher exact test, in which statistically significant differential expression between two conditions was determined by looking at genes with FDRs of <0.05 (see Materials and Methods for details).
GAPDH, glyceraldehyde 3-phosphate dehydrogenase.
FIG 3 .

Dormancy-related phenotype of M. tuberculosis grown in the fatty-acid model. (A) Electron micrographs of M. tuberculosis grown under different carbon sources. White arrows indicate presumed lipid bodies identified in LC-FA at stationary phase. Magnification: ×60,000 (DE, DS, and FE) or ×12,000 (FS). Exponential- and stationary-phase cultures were incubated with drugs in the presence of dextrose or fatty acids. Cultures were collected after 7, 14, or 21 days of exposure to drugs as estimated by CFU counting (B) or by calculating the MPN/ml (C) (see Materials and Methods for details). The R, MX, MZ, and AK concentrations used were 8, 4, 8, and 8 µg/ml, respectively. Means and standard deviations of four experiments are shown.
Comparison of the LC-FA model with other dormancy-related in vitro models.
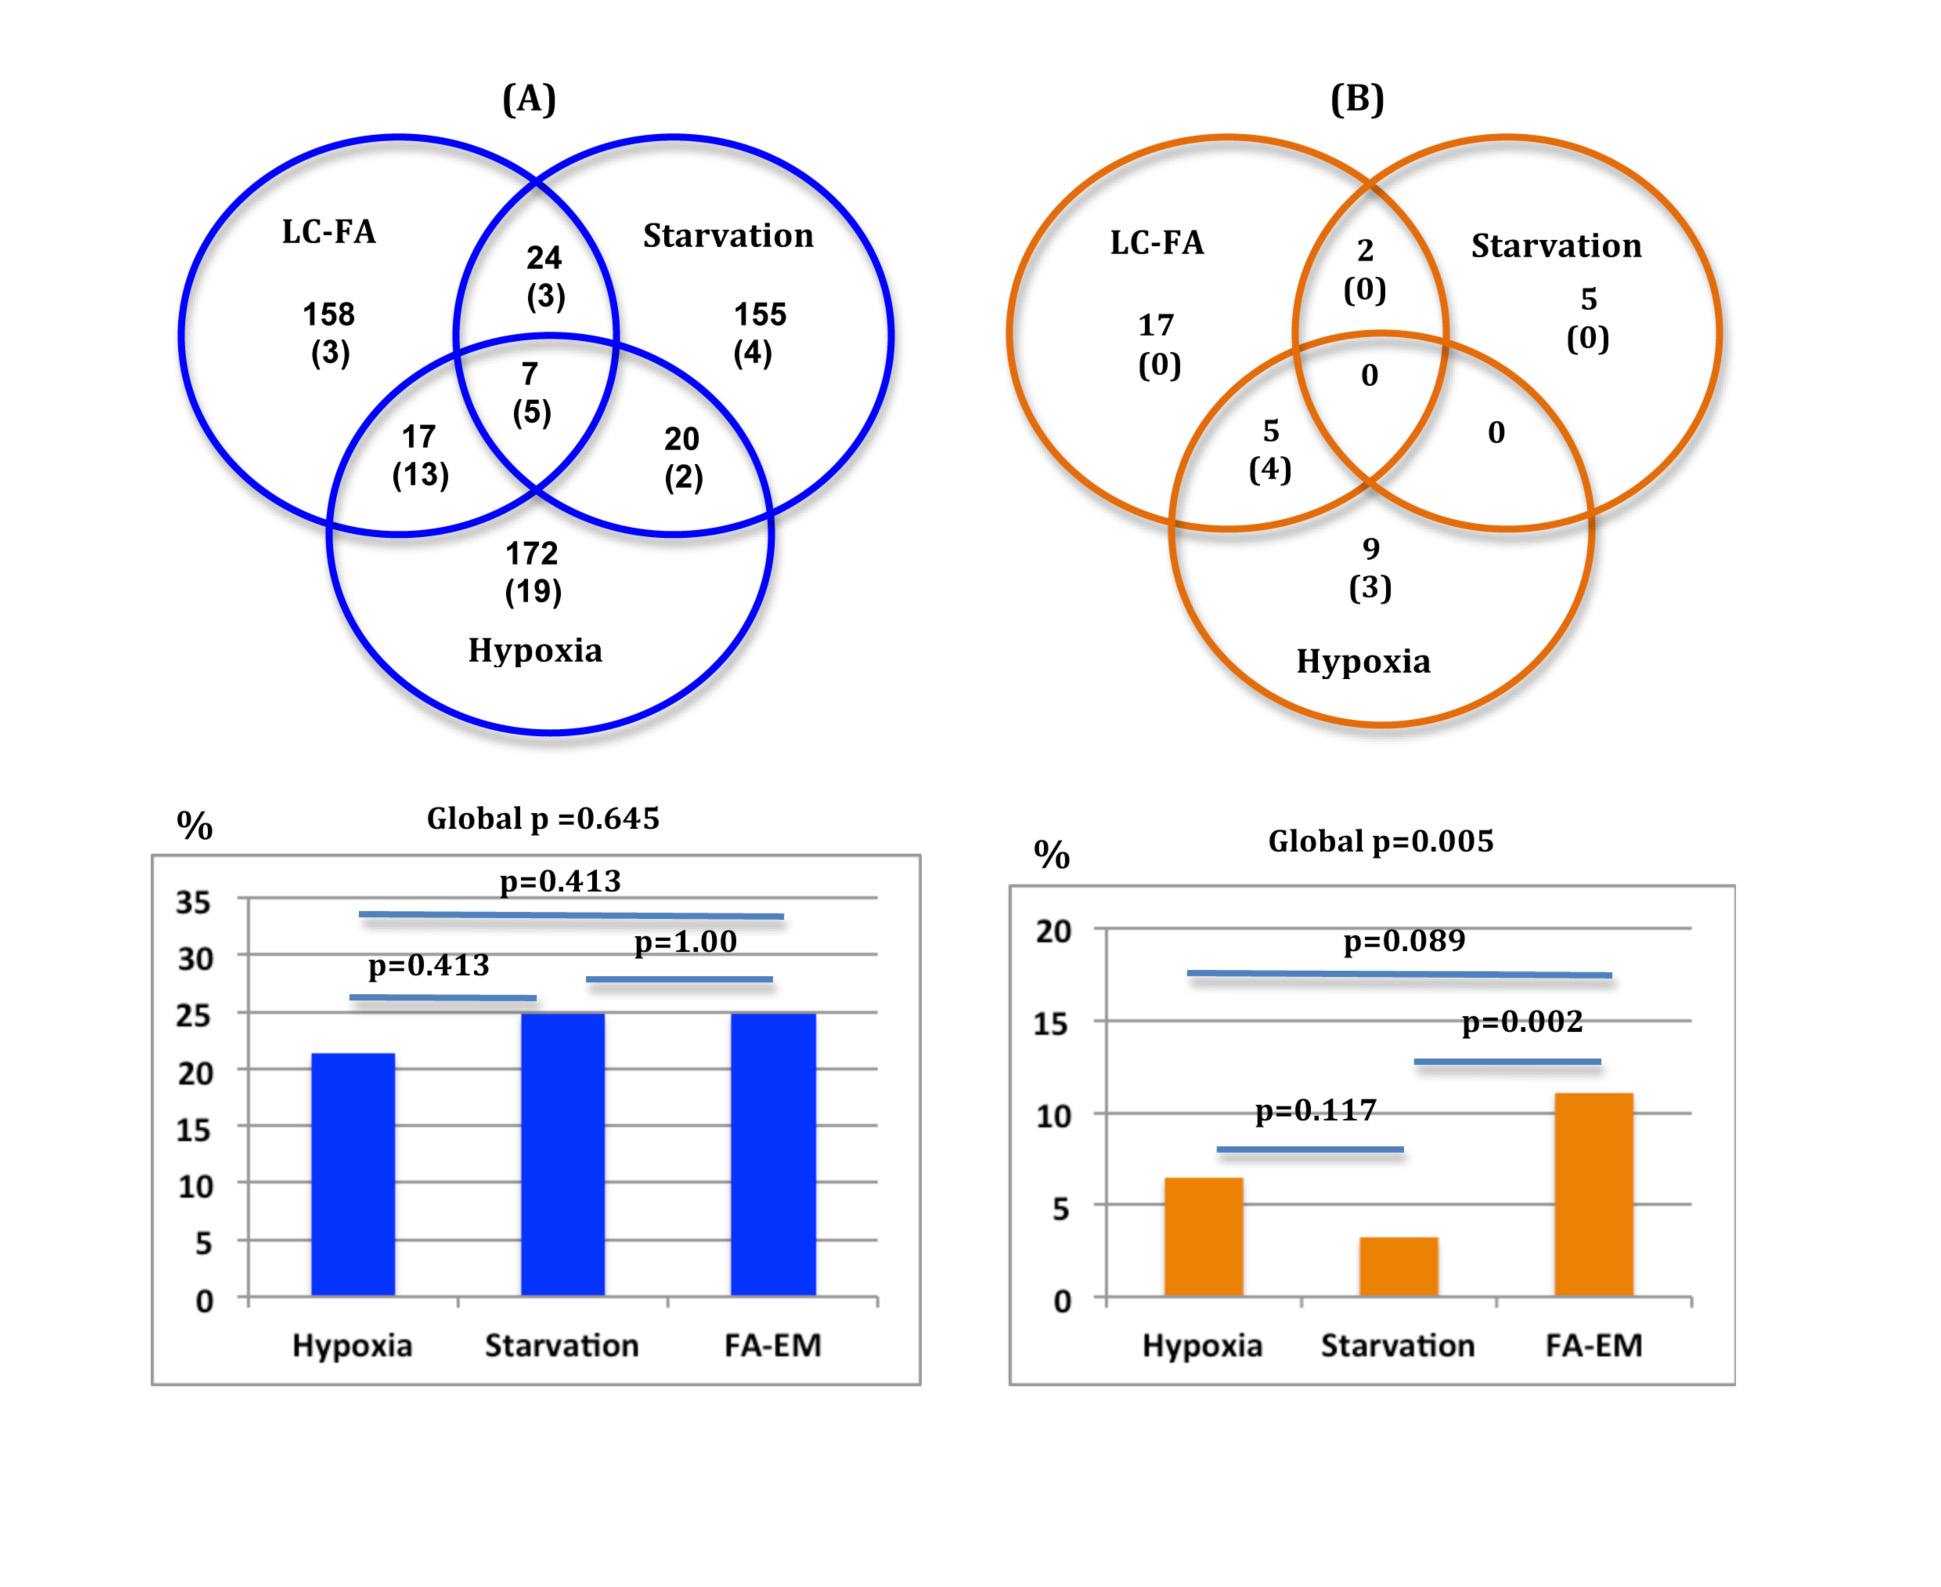
The host environmental cues that trigger the M. tuberculosis dormant stage or long-term infection are not fully elucidated, although changes associated with hypoxia, starvation, and low pH have been shown to be important (17). To test the suitability of growth in LC-FA as an in vitro model, we compared the gene expression profile of our lipid-enriched condition with other well-established in vitro models designed to mimic the hypoxic and starvation conditions faced by the pathogen within the host. Genes with significantly higher expression during growth in LC-FAs (see Table S1E and F in the supplemental material) were compared with the highest-scoring genes derived from array data obtained from the meta-analysis published by Murphy and Brown (40). The total number of genes shared by any two conditions was very similar, with no significant differences in percentages (see Fig. S4A). Therefore, growth in LC-FA can be another suitable in vitro model for the analysis of genes related to the dormant stage of M. tuberculosis. It is noteworthy that growth in LC-FAs and growth under hypoxia conditions shared more genes belonging to the DosR regulon than either condition compared to growth during starvation (see Fig. S4A). Interestingly, one of the LC-FAs used was palmitate, a fatty acid present in the culture medium used in one of the classical in vitro models of persistence (41).
Because of the suggested involvement of reductive stress in the growth of M. tuberculosis in a lipid-enriched medium, we sought to identify genes related to reductive stress in the same hypoxia and starvation data set used for the above analysis (40). Of the 371 genes associated with reductive stress in the M. tuberculosis genome (http://www.tuberculist.epfl.ch), we excluded genes belonging to the functional category of “lipid metabolism” to avoid bias toward the fatty acid model. We compared the remaining 216 genes with the 206 highest-scoring genes for all three data sets (see Fig. S4B). The number of genes related to reductive stress identified in each case was different, with the highest represented by LC-FA (24/206 genes, 11.1%), followed by hypoxia (14/206 genes, 6.5%), and the lowest represented by starvation (7/206 genes, 3.2%). The differences among percentages were close to significant between hypoxia and LC-FA and clearly significant between starvation and LC-FA (see Fig. S4B). Recently, it has been shown that reductive stress could play a role during long-term mycobacterial infection and that lipids could be stakeholders in this process (37). Our results also indicate that growth in LC-FAs might be a more suitable in vitro model to better test the putative involvement of reductive stress during the long-term infection of M. tuberculosis.
Genes involved in the adaptation of M. tuberculosis to a lipid environment.
The global analysis of the M. tuberculosis transcriptome showed increased expression of genes involved in various metabolic processes and identified specific genes that provide insight into cellular adaptation during growth with fatty acids as the sole carbon sources (Fig. 2; see Table S1E and F). Searching for a set of genes related to the pathways used by M. tuberculosis to adapt to a lipid environment, we identified 14 genes that had significantly increased expression in FE and FS than in DE and DS, respectively (Table 4) (42, 43). These genes therefore characterized the adaptation of the bacilli to growth in LC-FA medium and thus provide a lipid signature for M. tuberculosis; this overexpression was confirmed by quantitative reverse transcription (qRT)-PCR (see Fig. S5).
TABLE 4 .
Lipid signature of M. tuberculosis grown in the fatty acid model
| Gene tag | Gene name | Functional categoryb | Function (reference) | RPKM ratioc |
P valued |
||
|---|---|---|---|---|---|---|---|
| FE/DE | FS/DS | FE vs DE | FS vs DS | ||||
| Rv0079a | 10 | Unknown; probable transduction regulatory protein (42) | 1.59 | 2.10 | 01.09 E-12 | 3.37 E-07 | |
| Rv0211 | pckA | 7 | Phosphoenolpyruvate carboxykinase | 1.03 | 1.83 | 0.021 | 4.03 E-14 |
| Rv0467 | icl-1 | 7 | Isocitrate lyase | 3.88 | 1.52 | 1.58 E-08 | 3.89 E-09 |
| Rv1066 | 10 | Unknown; rhodanase like domaine | 2.11 | 4.10 | 1.28 E-07 | 9.04 E-13 | |
| Rv1184c | 3 | Unknown; possible exported protein, probable lipase, esterase or quitinase (43) | 4.80 | 5.00 | 3.69 E-07 | 0.024 | |
| Rv1733ca | 3 | Unknown; probable conserved transmembrane protein | 2.77 | 1.50 | 2.62 E-08 | 0.012 | |
| Rv1996a | 0 | Unknown; universal stress protein family | 1.93 | 1.19 | 1.09 E-12 | 6.27 E-06 | |
| Rv2794c | pptT | 1 | 4′-Phosphopantetheinyl transferase | 1.18 | 3.00 | 0.041 | 8.33 E-05 |
| Rv3131a | 10 | Unknown; putative NAD(P)H nitroreductase | 2.89 | 4.00 | 1.09 E-12 | 9.04 E-13 | |
| Rv3134ca | 10 | Unknown; universal stress protein family | 1.03 | 3.43 | 5.99 E-06 | 3.19 E-10 | |
| Rv3416 | whiB3 | 9 | Redox sensor; transcriptional regulatory protein | 2.50 | 1.09 | 0.003 | 0.009 |
| Rv3612c | 10 | Unknown | 2.00 | 1.10 | 0.029 | 0.014 | |
| Rv3614c | espD | 3 | Unknown; ESX-1 secretion associated protein | 2.81 | 1.50 | 1.09 E-12 | 9.04 E-13 |
| Rv3686c | 10 | Unknown | 1.82 | 3.00 | 1.60 E-08 | 3.26 E-07 | |
Member of the DosR regulon.
Functional categories based on http://www.tuberculist.epfl.ch: 0, virulence, detoxification, and adaptation; 1, lipid metabolism; 3, cell wall and cell processes; 7, intermediary metabolism and respiration; 9, regulatory proteins; 10, conserved hypothetical proteins.
RPKM ratio according to phase of growth: exponential (FE/DE) or stationary (FS/DS). The gene is overexpressed in FE or FS if the ratio is >1. See Table S1A and B in the supplemental material for the complete set of data.
Determined by Fisher exact test, in which statistically significant differential expression between two conditions was determined by looking at genes with FDRs of <0.05 (see Materials and Methods for details).
http://genome.tbdb.org, accessed December 2012.
Several of these lipid signature genes are involved in cellular intermediary metabolism. This includes the genes pckA and icl, indicating that bacteria are actively using the glyoxylate shunt, consistent with the central role of these enzymes in M. tuberculosis lipid metabolism (13, 32). The gene pckA is required for growth in fatty acids, and mutants defective in pckA are attenuated in both macrophage and mouse infections (32). Moreover, icl and pckA are also upregulated in nongrowing bacilli in murine models (13, 15).
Two lipid signature genes belong to the functional category of “lipid metabolism” (http://www.tuberculist.epfl.ch): Rv1184, which codes for an exported protein that is able to perform lipid degradation and pptT, which encodes a phosphopantetheinyl transferase that activates the polyketide synthases (44). Two additional genes are related to membrane activity allegedly involved in either the transport of metabolites (Rv1733) or associated with the ESX-1 secretion system of M. tuberculosis (Rv3614c), the latter coding for EspD.
WhiB3 was the single transcriptional regulator detected as part of the signature. This heme-based sensor, which is associated with intracellular redox balance, links environmental signaling with cellular metabolism (34). Interestingly, five of the members of the lipid signature belong to the DosR hypoxia regulon. This suggests that induction of the DosR transcriptional regulator could result from cotranscription from the upstream Rv3134c gene (45, 46), which is part of the lipid signature. The Rv3134c gene harbors a usp domain, as does another gene of the lipid signature, Rv1996. One of the DosR-regulated genes, Rv0079c, has recently been reported as a dormancy-associated translation inhibitor (DATIN) that inhibits in vitro protein synthesis. Overexpression of a recombinant DATIN in Escherichia coli and in Mycobacterium bovis BCG decreased the growth rate of these microorganisms (42). We therefore suggest that the overexpression of this gene in both the exponential and stationary phases could be the responsible for the observed slower growth of M. tuberculosis in LC-FA (see Fig. S1 in the supplemental material). Many of the genes included in the lipid signature are of unknown function, showing our scarce knowledge of how M. tuberculosis adapts to a lipid-enriched condition. One of these genes, Rv1733c, codes for a hypothetical protein reported to be induced by hypoxia and starvation (5).
To investigate whether these genes could be coregulated at the transcriptional level, we searched for a possible consensus motif 500 nucleotides (nt) upstream of each open reading frame (ORF) (47). We identified a DNA motif in 12 of the 14 genes analyzed (Fig. 4). The probability that this motif could be present in these genes by chance was 1E-07, thus suggesting a biological function of the motif in genes of the lipid signature. Interestingly, the motif was not found upstream of whiB3, opening the possibility that this gene product could be involved in transcriptional regulation of the lipid signature genes. The identification of an antisense transcript of the whiB3 gene in DS (Fig. 4B.2) strongly suggests the involvement of noncoding RNA in whiB3 gene regulation under lipid-enriched conditions.
FIG 4 .

Features of lipid signature genes. (A) Sequence logo of the lipid signature motif. The nucleotide sequence was determined by performing Gibbs sampling of the 500 bp upstream of the initiation codon of the lipid signature genes (see Materials and Methods for details). In the representation of the consensus sequence shown in the graph, the height of each nucleotide indicates the level of conservation. (B) Differential transcription of the whiB3 gene. Artemis view of the reads mapped to the whiB3 gene under the conditions tested. The blue arrow indicates the orientation of whiB3 transcription. (B.1) Exponential phase: red, dextrose; purple, LC-FA. (B.2) Stationary phase: green, dextrose; blue, LC-FA. Antisense transcription is identified in the stationary phase of growth in dextrose.
To assess the relevance of these genes for M. tuberculosis growth, we next compared this list with previously reported studies aimed at identifying essential genes. Interestingly, none of the 14 lipid signature genes were found to contain IS6110 insertions in the in vivo survey of 533 isolates worldwide, with the exception of Rv1733, which had an IS6110 insertion in 2 of the 533 isolates analyzed (48). In contrast, 10 of the 14 genes are considered nonessential for in vitro M. tuberculosis growth, based on transposon mutagenesis (49). These data support our proposal that the LC-FA model could be more closely related to the conditions that the bacilli confront in vivo during TB infection.
Final remarks.
On the basis of the results presented here, we propose the following scenario for M. tuberculosis growing on even-length LC-FAs (Fig. 5). Lipids surrounding the bacilli, TAG or LC-FAs, are hydrolyzed by lipases (such as Rv1184) and then internalized through receptors (Rv1733c). The lipids are subsequently converted to acetyl-CoA by β-oxidation and consumed by the glyoxylate cycle (Icl1). At this point, PckA can regenerate phosphoenolpyruvate to continue the cycle. As a consequence, both CO2 and the reducing equivalents NADH and NADPH increase and are sensed by the DosR, Rv0081, and WhiB3 transcriptional regulators. These and probably other stress conditions induce the expression of genes such as pptT, pks-2, pks-3, and tgs-1, which are responsible for the synthesis of complex lipids that balance the redox state of the cell by polymer deposition. The detection of espD suggests secretion, possibly of toxic compounds. On the other hand, several genes of the DosR regulon are induced: stress proteins (Rv1996, and Rv3134c, which are cotranscribed with dosR) and other reductive sinks (Rv3131), inhibitors of protein synthesis (Rv0079), and heme stabilization proteins (fdxA). Proteins required for porphyrin synthesis (HemA and HemC) are also induced (see Table S4B). Finally, the high expression of tRNAs could modify membrane properties, resulting in tolerance to environmental stresses and antibiotics. We propose that when M. tuberculosis grows on LC-FAs as sole carbon sources, the cells change their gene expression profile by inducing genes required for stress protection, as well as genes required for its survival during long-term infection. Our results therefore provide insight into the physiological responses of tubercle bacilli when grown in a lipid-rich environment, a poorly studied aspect of TB infection.
FIG 5 .

Proposed scenario of M. tuberculosis growth in the fatty acid model. Growth of M. tuberculosis during the in vitro model of even-LC-FA is shown. See the text (final remarks) for details.
Studying the metabolic activity of M. tuberculosis during latent infection is not an easy task (50). TB was recently described as a continuum, from active disease to latent infection, and the accumulation of data indicates that latency might not be considered a single condition either (50). Although it is still unclear, it appears that dormant bacilli include cells with different metabolic activities, from slowly growing to nondividing stages that vary in terms of redox balance and require responses to oxidative stress or reductive stress, balanced by the cooperation of main regulators, such as WhiB3, DosR, and the recently identified Rv0081 (6). The development of new drugs against dormant bacilli has been difficult probably because of our poor knowledge of real metabolic activity of M. tuberculosis during the complex period of latency. The data derived from the use of the LC-FA in vitro model represent a novel tool suitable for the study of the susceptibility of M. tuberculosis to drugs during latency from a new perspective.
In summary, our results show a new scenario for the adaptation of M. tuberculosis to a lipid-rich environment, presenting evidence of the role of reductive stress and giving insights into the participation of novel molecules such as noncoding RNAs and tRNAs. These could play important roles in the adaptation of the bacteria for long-term survival. During the coevolution of the human host and the tubercle bacilli, these adaptations have probably been crucial for bacterial survival and the establishment of a balanced coexistence, represented by a successful infection without disease, which we know as latent TB.
MATERIALS AND METHODS
Bacterial strain and culture conditions.
M. tuberculosis H37Rv (donated by The Pasteur Institute, Paris, France) was grown at 37°C in 100 ml of Dubos broth (Difco) supplemented with 10% ADC (Middlebrook) in a 1-liter flask to an optical density at 600 nm (OD600) of 0.5. The culture was divided in two, and cells were pelleted by centrifugation and resuspended in (i) Dubos broth base (without glycerol) (BD Difco) containing 0.5% albumin (Sigma Fraction V, fatty acid free) and supplemented with a mixture of 0.003% FA with even an number of carbon atoms (0.001% each oleic [18 carbon atoms], palmitic [16 carbon atoms], and stearic [18 carbon atoms] acids) or (ii) Dubos medium with 0.5% albumin–0.75% dextrose–0.04% catalase (ADC enrichment). Cultures were grown with agitation at 200 rpm at 37°C, and growth was monitored by measuring the OD600.
RNA isolation.
Total RNA was isolated from cultures in the exponential and stationary phases as previously described (51). Basically, cultures were harvested by centrifugation and pellets were resuspended in guanidinium chloride buffer (6 M guanidinium chloride, 0.1% Tween 80, 1 mM 2-mercaptoethanol, 10 mM EDTA) in a proportion of 1 ml of buffer/100 ml of culture. Cells were lysed mechanically in a FastPrep (Thermo Scientific) with 150- to 200-µm glass beads (Sigma-Aldrich) by performing four lysis cycles of 15 s each at high speed (6.5 m/s). Nucleic acids were purified with phenol-chloroform-isoamyl alcohol (25:24:1), and RNA was differentially precipitated with 0.4 volume of absolute ethanol (added drop by drop). Finally, RNA was washed three times with Trizol reagent (Invitrogen). RNA integrity was analyzed with a bioanalyzer (Agilent Technologies) and quantified by spectrophotometry with the NanoDrop ND-1000 (Thermo Scientific).
Library preparation and sequencing.
Strand-specific RNA-seq libraries were prepared in accordance with the protocol described by Waldbauer and coworkers (52). Briefly, The DNase-treated RNA (100 ng) was fragmented by divalent-cation hydrolysis (Fragmentation Buffer; Ambion, Austin, TX) at 70°C for 12 min to yield fragment sizes between 50 and 300 nt. After precipitation with ethanol, fragments were subjected to poly(A) tailing and end repairing (NEB Reagents). RNA was treated with Antarctic phosphatase (New England Biolabs) and then phosphorylated at the 5′ RNA end with T4 polynucleotide kinase. The transcribing strand was labeled by ligation of a 5′ hybrid DNA-RNA primer and after purification with RNA clean XP beads (Beckman Coulter Genomics), the first-strand cDNA synthesis reaction was carried out with SuperScript II reverse transcriptase (Invitrogen) and Illumina’s poly(T) primer and deoxynucleoside triphosphates (20 mM). Reaction components were removed with Agencourt AMPure XP SPRI beads (Beckman), and primary transcripts were enriched with Pfu Hi Fidelity polymerase (Invitrogen) and the Illumina spacers as primers. Illumina adaptors and bar codes were ligated by PCR in accordance with the manufacturer’s instructions. Libraries were purified with SPRI beads (Beckman) and quantified with a NanoDrop (Bio-Rad). Sequencing was performed with the Illumina technology at Ambry Genetics.
RNA-seq data analysis.
Sequence reads were processed to remove poly(A) and spacer sequences, and only those with quality scores of >30 (Illumina 1.3+) and a minimal length of 50 bases were used for analysis. Assessment of read quality was done with the FASTX toolkit v. 0.0.13 (http://hannonlab.cshl.edu/fastx_toolkit/index.html). The reads were mapped against the M. tuberculosis H37Rv reference genome (accession no. NC000962.2) with Bow tie v. 0.12.7 (53) and visualized with the Artemis sequence visualization and annotation tool (54). Reads that mapped to more than one site where excluded. For the analysis, only those reads for which 50% of the sequence length fell within the annotated ORF were considered part of the ORF. For the identification of novel expressed IGRs in the transcriptome, clean reads were analyzed with an in-house algorithm that identifies genomic regions with a minimum depth of 10 reads and a minimum length of 50 nt. These zones were then annotated by comparison with the reference genome, with annotation coming from literature and the TubercuList database (http://www.tuberculist.epfl.ch). For example, transcripts are annotated as novel intergenic if they show expression according to the criteria mentioned and they do not overlap any previously annotated feature in the genome.
Measurement of drug activity.
The activity of a drug mixture containing rifampin (R), moxifloxacin (MX), metronidazole (MZ) and amikacin (AK) against exponential- and stationary-phase cultures of M. tuberculosis grown in dextrose or FA medium was tested. R, MZ, and AK were purchased from Sigma Chemicals (United States); MX was obtained from Bayer (Mexico). R was dissolved in ethanol; MZ, AK, and MX were dissolved in distilled water. To determine drug activity, 4- to 6-day-old (exponential-phase) cultures and 15-day-old (stationary-phase) cultures (containing at least 1 × 10⁶ CFU/ml) were incubated with the drug combination for 0, 7, 14, or 21 days; R, MX, MZ, and AK were used at their maximum drug concentration in serum at 8, 4, 8, and 8 µg/ml, respectively (39). After incubation, culture CFU counts per milliliter were determined by plating appropriate dilutions as described previously (55). In parallel, 1 ml of each culture was taken to perform 10−1 to 10−3 dilutions with Dubos broth. One milliliter of every dilution was transferred to each of three tubes containing 9 ml of Dubos broth with or without the fatty acid mixture, accordingly. These broth cultures were examined for visible turbidity every 7 days over a 3-week period of incubation at 37°C. The most probable number (MPN) of viable bacilli was then estimated while taking in account the patterns of positive and negative tubes (http://www.fda.gov/food/foodscienceresearch/laboratorymethods/ucm109656.htm; accessed January 2013). Plating of different culture samples on blood agar medium showed the absence of bacteria other than mycobacteria. Growth of M. tuberculosis in turbid tubes was confirmed by Ziehl-Neelsen staining and colonial morphology on Middlebrook 7H11
Analysis of the upstream regions of the genes belonged to the lipid signature.
For each gene, 500 nt were taken upstream of the initiation codon. These regions were fed into the Gibbs sampling algorithm, and the sequences were analyzed to detect any possible bias in their composition. This was done by means of the program “unifiedcpp.” Once corrected for possible bias, the samples were run with the following parameters: k-mer, 12 to 24 nt; -n, for nucleic acid alphabet; -E 3, maximum number of sites to find; -S 20, number of seeds to try; -i 1,000, number of iterations. The probability of the motif arising by chance was determined by means of the hypergeometric distribution (56). For this, the number of genes in which the motif was present in the 500-nt upstream region in H37Rv was calculated. It turned out that 767 of the 4,060 genes had the motif (this is the population distribution), so we wanted to calculate the probability of drawing 12 out of 14 genes given the population distribution (767/4,060).
qRT-PCR of selected genes.
The total transcripts of selected genes were measured by real-time qRT-PCR. Quantification was performed with gene-specific primers (see Table S5) and SYBR green (Molecular Probes, Inc.). Samples were subjected to 40 cycles of amplification (denaturation at 95°C for 30 s, specific annealing temperature for 15 s, and extension at 72°C for 15 s) with a final extension at 72°C for 5 min. To ensure that the fluorescence levels detected were due to the amplification of a specific product, a melting curve analysis was performed. Absolute analysis was carried out. To do this, a standard curve was obtained for each set of primers by using 10-fold dilutions of known amounts of M. tuberculosis H37RV chromosomal DNA (1,000, 10,000, 100,000, and 1,000,000 theoretical copies). Threshold cycle values of each RNA quantitation were interpolated to standard curve to obtain gene expression (number of gene copies per microliter). Normalization of these data was performed by using 16S rRNA expression levels.
Transmission electron microscopy.
Cells were harvested by centrifugation at 16,000 × g, washed in sterile phosphate-buffered saline (PBS), and fixed in 2.5% (vol/vol) glutaraldehyde–0.1 M sodium phosphate for 1 h. Cells were recovered and resuspended in 1% (wt/vol) osmium tetroxide for 1 h. Cells were then dehydrated through treatment with a series of ethanol solutions (30, 40, 50, 60, 70, 80, and 90%); each treatment was performed twice for 10 min each time. A final dehydration step was done twice with 100% ethanol for 15 min. Samples were embedded in EPON 812 resin (EMS). This resin was polymerized at 60°C for 24 h. Resin blocks were cut in a Leica Ultracut UCT Ultratome to a 70-nm thickness, placed on 200-mesh copper grids (EMS), and stained with 30% (wt/vol) uranyl acetate–70% (vol/vol) methanol and counterstained with Reynolds lead citrate buffer. Samples were examined with a JEOL JEM-1010 transmission electron microscope with an acceleration voltage of 60 kV.
Statistical analysis.
Statistical analysis for differential gene expression was evaluated by using RPKMs as expression values and Fisher’s exact test on a two-by-two contingency table (57) on a per-gene basis in which the two columns of the table were separated by reads that overlap the gene’s ORF and reads that do not overlap the ORF, and the two rows were separated by the two compared samples (FE versus DE or FS versus DS). Significant differences were determined with Fisher’s exact test with the additional criteria of a false-discovery rate (FDR) of <5%. The results were consistent with those obtained with the DEGseq package for biological replicates (58).
Nucleotide sequence accession number.
The RNA-seq data sets have been deposited in the NCBI Gene Expression Omnibus (59) under accession number GSE47863.
SUPPLEMENTAL MATERIAL
Growth of M. tuberculosis in LC-FAs. Growth curves of M. tuberculosis cultured in the presence of dextrose (Dubos ADC media 1 [circles] and 2 [triangles]) or LC-FA (Dubos LC-FA media 1 [large squares] and 2 [small squares]). The results of two independent experiments (1 and 2, respectively) are shown. The arrows indicate that the exponential-phase RNA samples were taken when cultures reached OD600 of ~0.3 and 0.4 (which correspond to day 7 in Dubos ADC medium and day 8 in LC-FAs) and that stationary-phase RNA samples were taken when cultures reached an OD600 of ~0.6 (which corresponds to day 15). Download
RNA-seq library data. (A) Saturation curves showing a cumulative plot of reads from each individual condition versus the number of genes covered at different sequencing depths. Saturation was reached under all of the conditions since an increase in the number of reads did not result in the detection of additional genes. (B) Data were transformed by the method proposed by Huber et al. (24) by means of the vsn R Bioconductor package (R Development Core Team, 2008), which is available at http://www.bioconductor.org. Transformation and calibration of data were carried out as follows: hx = arsinhxs hx = arsinhx/s, where x is the number of RPKMs and s is the standard deviation of these RPKMs in the replicates of each experiment. Download
Genes differentially expressed in the LC-FA model of M. tuberculosis. Volcano plots showing each functional category that is represented as indicated in the panel. Significant differences were determined with Fisher’s exact test. See Tables S2 and S3 in the supplemental material for the complete set of data. (A) Exponential phase of growth. (B) Stationary phase of growth. Download
Comparison of LC-FA, hypoxia, and starvation in vitro models. Shown is a Venn diagram comparison of genes overexpressed in the three in vitro models: hypoxia, starvation (40), and LC-FA (this work). (Top) the 206 highest-scoring genes identified in the in vitro models were compared to each other (A) or for the presence of genes related to reductive stress according to TubercuList (http://tuberculist.epfl.ch/), excluding those of the functional category “lipid metabolism” to avoid bias toward the fatty acid model (B). Genes that belong to the DosR regulon are in parentheses. (Bottom) The percentage of shared genes (A) and the percentage of genes related to reductive stress (B) are compared. The P values for comparisons of two percentages, as well as all three percentages, are shown. Download
Validation of lipid signature genes by qRT-PCR. Genes belonging to the lipid signature (Table 2) were selected for validation by qRT-PCR with RNA isolated in the stationary phase of growth under both dextrose (blue bars) and fatty acid (red bars) conditions. Data were normalized to the number of copies of the rrs gene (16S rRNA). Results are expressed as log2 of the number of copies per microgram of RNA. In some cases, the expression of the genes was below the minimum level of detection of the technique (e.g., Rv1184, Rv1733, Rv2794, Rv3416, and Rv3614). Download
Excel file showing statistical analysis with Fisher’s exact test (A and B). (A) DE RPKM, values for dextrose in exponential phase; FE RPKM, values for fatty acids in exponential phase. (B) DS RPKM, values for dextrose in stationary phase; FS RPKM, values for fatty acids in stationary phase. FDRs were determined by Fisher’s exact test. Statistically significant differential expression between two conditions was determined by looking at genes with FDRs of <0.05. From the top to the bottom, genes are ordered from the highest to the lowest FDRs. Top, genes with significantly higher expression in FE than in DE (A) or in FS than in DS (B); middle, genes with significantly lower expression in FE than in DE (A) or in FS than in DS (B); bottom genes with no significant differential expression among the conditions compared. (C, D) DEGseq package. (C) DE (reads), read count mapping to sense strand of gene (exponential phase in dextrose); FE (reads), read count mapping to sense strand of gene (exponential phase in fatty acids); (D) DS (reads), read count mapping to sense strand of gene (stationary phase in dextrose); FS (reads), read count mapping to sense strand of gene (stationary phase in fatty acids). Top, true significant; bottom, false significant. (E, F) Genes significantly overexpressed in the presence of LC-FA. Shown are the genes significantly overexpressed in the presence of fatty acids during exponential phase (E) and during stationary phase (F). From the top to the bottom, genes are ordered according to their tag numbers.
Excel file showing RPKM data of noncoding RNAs. RPKM values of tRNAs (A) and other intergenic regions (B) and a comparison of the 21 intergenic regions with higher RPKM values (C) are shown.
Functional categories with significantly increased or decreased expression in the fatty acid model. Genes were organized by functional categories (FC) according to TubercuList (http://tuberculist.epfl.ch/). % FC is the percentage of genes in each functional category related to the total number of genes. Total FC is the number of genes in a functional category with significantly increased or decreased expression in each phase of growth. % Total is the percentage of genes in a functional category with respect to the total number of genes with significantly increased or decreased expression in each phase of growth. % Total/% FC is the ratio of the percentages of genes with increased or decreased expression in each functional category and phase of growth. Overrepresented ratios are in bold, and underrepresented ratios are in italics.
Genes related to reductive stress during growth of M. tuberculosis in fatty acids. (A) Number of genes related to reductive stress with significant expression during growth in different carbon sources. Genes with significantly increased or decreased expression during growth in fatty acids (FE, FS) (see Table S3E and F in the supplemental material) were checked against 371 genes related to reductive stress (http://www.tuberculist.epfl.ch). The list of genes related to reductive stress includes those in the functional category of “lipid metabolism,” as well as genes participating in heme group synthesis and stabilization. Growth phase: FE, Dubos medium with LC-FA in exponential phase; FS, Dubos medium with LC-FA in stationary phase. (B) Genes related to the heme prosthetic group with significantly increase expression during growth in LC-FAs. Gene tags with asterisks indicate those genes that are members of the DosR regulon.
Primers used for qRT-PCR. The information provided on the primers used for qRT-PCR includes the target gene tag, the sequence, the annealing temperature, and the size of the amplified product.
ACKNOWLEDGMENTS
We thank Robert A. Cox for his helpful advice and comments and Juan Carlos Palomino for his critical reading of the manuscript. We are also grateful to Liliana López, Department of Statistic of the Universidad Nacional de Colombia for her contribution with statistical analysis. We thank Oliver Ornelas-Lopez and Esther Ramirez-Espindola, from the Microscopy Unit of ENCB, IPN, for their help with electron microscopy. We thank Miguel Bernabe for his assistance in figure preparation.
This work was supported by the StopLatent-TB Collaborative Project, which is supported by the European Commission under the Health Cooperation Work Programme of the 7th Framework Programme (GA no. 200999); International Cooperation UAM-Banco Santander and Latin America (Centro de Estudios de America Latina, CEAL), UAM, Spain; and the Colombian Agency to Support Science and Technology, COLCIENCIAS (GA no. 439-2012). This work was partially supported by grants 156347 and 169063, CONACYT, Mexico, and SIP 20130951 and 20131271, IPN, Mexico. J. González-y-Merchand and C. Helguera-Repetto are fellows of COFAA and EDI, IPN, Mexico.
Footnotes
Citation Rodríguez JG, Hernández AC, Helguera-Repetto C, Aguilar Ayala D, Guadarrama-Medina R, Anzóla JM, Bustos JR, Zambrano MM, González-y-Merchand J, García MJ, Del Portillo P. 2014. Global adaptation to a lipid environment triggers the dormancy-related phenotype of Mycobacterium tuberculosis. mBio 5(3):e01125-14. doi:10.1128/mBio.01125-14.
REFERENCES
- 1. Dye C, Scheele S, Dolin P, Pathania V, Raviglione MC. 1999. Consensus statement. Global burden of tuberculosis: estimated incidence, prevalence, and mortality by country. WHO Global Surveillance and Monitoring Project. JAMA 282:677–686 [DOI] [PubMed] [Google Scholar]
- 2. Gengenbacher M, Kaufmann SH. 2012. Mycobacterium tuberculosis: success through dormancy. FEMS Microbiol. Rev. 36:514–532. 10.1111/j.1574-6976.2012.00331.x [DOI] [PMC free article] [PubMed] [Google Scholar]
- 3. Gonzalo-Asensio J, Mostowy S, Harders-Westerveen J, Huygen K, Hernández-Pando R, Thole J, Behr M, Gicquel B, Martín C. 2008. PhoP: a missing piece in the intricate puzzle of Mycobacterium tuberculosis virulence. PLoS One 3:e3496. 10.1371/journal.pone.0003496 [DOI] [PMC free article] [PubMed] [Google Scholar]
- 4. Kendall SL, Withers M, Soffair CN, Moreland NJ, Gurcha S, Sidders B, Frita R, Ten Bokum A, Besra GS, Lott JS, Stoker NG. 2007. A highly conserved transcriptional repressor controls a large regulon involved in lipid degradation in Mycobacterium smegmatis and Mycobacterium tuberculosis. Mol. Microbiol. 65:684–699. 10.1111/j.1365-2958.2007.05827.x [DOI] [PMC free article] [PubMed] [Google Scholar]
- 5. Voskuil MI, Visconti KC, Schoolnik GK. 2004. Mycobacterium tuberculosis gene expression during adaptation to stationary phase and low-oxygen dormancy. Tuberculosis (Edinb) 84:218–227. 10.1016/j.tube.2004.02.003 [DOI] [PubMed] [Google Scholar]
- 6. Galagan JE, Minch K, Peterson M, Lyubetskaya A, Azizi E, Sweet L, Gomes A, Rustad T, Dolganov G, Glotova I, Abeel T, Mahwinney C, Kennedy AD, Allard R, Brabant W, Krueger A, Jaini S, Honda B, Yu WH, Hickey MJ, Zucker J, Garay C, Weiner B, Sisk P, Stolte C, Winkler JK, Van de Peer Y, Iazzetti P, Camacho D, Dreyfuss J, Liu Y, Dorhoi A, Mollenkopf HJ, Drogaris P, Lamontagne J, Zhou Y, Piquenot J, Park ST, Raman S, Kaufmann SH, Mohney RP, Chelsky D, Moody DB, Sherman DR, Schoolnik GK. 2013. The Mycobacterium tuberculosis regulatory network and hypoxia. Nature 499:178–183. 10.1038/nature12337 [DOI] [PMC free article] [PubMed] [Google Scholar]
- 7. Arnvig KB, Comas I, Thomson NR, Houghton J, Boshoff HI, Croucher NJ, Rose G, Perkins TT, Parkhill J, Dougan G, Young DB. 2011. Sequence-based analysis uncovers an abundance of non-coding RNA in the total transcriptome of Mycobacterium tuberculosis. PLoS Pathog. 7:e1002342. 10.1371/journal.ppat.1002342 [DOI] [PMC free article] [PubMed] [Google Scholar]
- 8. Miotto P, Forti F, Ambrosi A, Pellin D, Veiga DF, Balazsi G, Gennaro ML, Di Serio C, Ghisotti D, Cirillo DM. 2012. Genome-wide discovery of small RNAs in Mycobacterium tuberculosis. PLoS One 7:e51950. 10.1371/journal.pone.0051950 [DOI] [PMC free article] [PubMed] [Google Scholar]
- 9. Peyron P, Vaubourgeix J, Poquet Y, Levillain F, Botanch C, Bardou F, Daffé M, Emile JF, Marchou B, Cardona PJ, de Chastellier C, Altare F. 2008. Foamy macrophages from tuberculous patients’ granulomas constitute a nutrient-rich reservoir for M. tuberculosis persistence. PLoS Pathog. 4:e1000204. 10.1371/journal.ppat.1000204 [DOI] [PMC free article] [PubMed] [Google Scholar]
- 10. Daniel J, Maamar H, Deb C, Sirakova TD, Kolattukudy PE. 2011. Mycobacterium tuberculosis uses host triacylglycerol to accumulate lipid droplets and acquires a dormancy-like phenotype in lipid-loaded macrophages. PLoS Pathog. 7:e1002093. 10.1371/journal.ppat.1002093 [DOI] [PMC free article] [PubMed] [Google Scholar]
- 11. Gill WP, Harik NS, Whiddon MR, Liao RP, Mittler JE, Sherman DR. 2009. A replication clock for Mycobacterium tuberculosis. Nat. Med. 15:211–214. 10.1038/nm.1915 [DOI] [PMC free article] [PubMed] [Google Scholar]
- 12. Cubero N, Esteban J, Palenque E, Rosell A, Garcia MJ. 2013. Evaluation of the detection of Mycobacterium tuberculosis with metabolic activity in culture-negative human clinical samples. Clin. Microbiol. Infect. 19:273–278. 10.1111/j.1469-0691.2012.03779.x [DOI] [PubMed] [Google Scholar]
- 13. Muñoz-Elías EJ, McKinney JD. 2005. Mycobacterium tuberculosis isocitrate lyases 1 and 2 are jointly required for in vivo growth and virulence. Nat. Med. 11:638–644. 10.1038/nm1252 [DOI] [PMC free article] [PubMed] [Google Scholar]
- 14. Ouellet H, Johnston JB, de Montellano PR. 2011. Cholesterol catabolism as a therapeutic target in Mycobacterium tuberculosis. Trends Microbiol. 19:530–539. 10.1016/j.tim.2011.07.009 [DOI] [PMC free article] [PubMed] [Google Scholar]
- 15. Schnappinger D, Ehrt S, Voskuil MI, Liu Y, Mangan JA, Monahan IM, Dolganov G, Efron B, Butcher PD, Nathan C, Schoolnik GK. 2003. Transcriptional adaptation of Mycobacterium tuberculosis within macrophages: insights into the phagosomal environment. J. Exp. Med. 198:693–704. 10.1084/jem.20030846 [DOI] [PMC free article] [PubMed] [Google Scholar]
- 16. Betts JC, Lukey PT, Robb LC, McAdam RA, Duncan K. 2002. Evaluation of a nutrient starvation model of Mycobacterium tuberculosis persistence by gene and protein expression profiling. Mol. Microbiol. 43:717–731. 10.1046/j.1365-2958.2002.02779.x [DOI] [PubMed] [Google Scholar]
- 17. Deb C, Lee CM, Dubey VS, Daniel J, Abomoelak B, Sirakova TD, Pawar S, Rogers L, Kolattukudy PE. 2009. A novel in vitro multiple-stress dormancy model for Mycobacterium tuberculosis generates a lipid-loaded, drug-tolerant, dormant pathogen. PLoS One 4:e6077. 10.1371/journal.pone.0006077 [DOI] [PMC free article] [PubMed] [Google Scholar]
- 18. Voskuil MI, Schnappinger D, Visconti KC, Harrell MI, Dolganov GM, Sherman DR, Schoolnik GK. 2003. Inhibition of respiration by nitric oxide induces a Mycobacterium tuberculosis dormancy program. J. Exp. Med. 198:705–713. 10.1084/jem.20030205 [DOI] [PMC free article] [PubMed] [Google Scholar]
- 19. Lehninger A, Nelson D, Cox M. 2008. Lehninger principles of biochemistry, 5th ed. W. H. Freeman, New York, NY. [Google Scholar]
- 20. Jackson SK, Stark JM, Taylor S, Harwood JL. 1989. Changes in phospholipid fatty acid composition and triacylglycerol content in mouse tissues after infection with bacille Calmette-Guérin. Br. J. Exp. Pathol. 70:435–441 [PMC free article] [PubMed] [Google Scholar]
- 21. Lee W, VanderVen BC, Fahey RJ, Russell DG. 2013. Intracellular Mycobacterium tuberculosis exploits host-derived fatty acids to limit metabolic stress. J. Biol. Chem. 288:6788–6800. 10.1074/jbc.M112.445056 [DOI] [PMC free article] [PubMed] [Google Scholar]
- 22. Wang Z, Gerstein M, Snyder M. 2009. RNA-Seq: a revolutionary tool for transcriptomics. Nat. Rev. Genet. 10:57–63. 10.1038/nrg2484 [DOI] [PMC free article] [PubMed] [Google Scholar]
- 23. Ehrt S, Schnappinger D. 2007. Mycobacterium tuberculosis virulence: lipids inside and out. Nat. Med. 13:284–285. 10.1038/nm0307-284 [DOI] [PubMed] [Google Scholar]
- 24. Huber W, von Heydebreck A, Sueltmann H, Poustka A, Vingron M. 2003. Parameter estimation for the calibration and variance stabilization of microarray data. Stat. Appl. Genet. Mol. Biol. 2:Article3. 10.2202/1544-6115.1008 [DOI] [PubMed] [Google Scholar]
- 25. Cole ST, Brosch R, Parkhill J, Garnier T, Churcher C, Harris D, Gordon SV, Eiglmeier K, Gas S, Barry CE, III, Tekaia F, Badcock K, Basham D, Brown D, Chillingworth T, Connor R, Davies R, Devlin K, Feltwell T, Gentles S, Hamlin N, Holroyd S, Hornsby T, Jagels K, Krogh A, McLean J, Moule S, Murphy L, Oliver K, Osborne J, Quail MA, Rajandream MA, Rogers J, Rutter S, Seeger K, Skelton J, Squares R, Squares S, Sulston JE, Taylor K, Whitehead S, Barrell BG. 1998. Deciphering the biology of Mycobacterium tuberculosis from the complete genome sequence. Nature 393:537–544. 10.1038/31159 [DOI] [PubMed] [Google Scholar]
- 26. Roy H, Ibba M. 2008. RNA-dependent lipid remodeling by bacterial multiple peptide resistance factors. Proc. Natl. Acad. Sci. U. S. A. 105:4667–4672. 10.1073/pnas.0800006105 [DOI] [PMC free article] [PubMed] [Google Scholar]
- 27. Maloney E, Stankowska D, Zhang J, Fol M, Cheng QJ, Lun S, Bishai WR, Rajagopalan M, Chatterjee D, Madiraju MV. 2009. The two-domain LysX protein of Mycobacterium tuberculosis is required for production of lysinylated phosphatidylglycerol and resistance to cationic antimicrobial peptides. 5:e1000534. 10.1371/journal.ppat.1000534 PLoS Pathog [DOI] [PMC free article] [PubMed]
- 28. Francklyn CS, Minajigi A. 2010. tRNA as an active chemical scaffold for diverse chemical transformations. FEBS Lett. 584:366–375. 10.1016/j.febslet.2009.11.045 [DOI] [PMC free article] [PubMed] [Google Scholar]
- 29. Ernst CM, Peschel A. 2011. Broad-spectrum antimicrobial peptide resistance by MprF-mediated aminoacylation and flipping of phospholipids. Mol. Microbiol. 80:290–299. 10.1111/j.1365-2958.2011.07576.x [DOI] [PubMed] [Google Scholar]
- 30. Flores J, Espitia C. 2003. Differential expression of PE and PE_PGRS genes in Mycobacterium tuberculosis strains. Gene 318:75–81. 10.1016/S0378-1119(03)00751-0 [DOI] [PubMed] [Google Scholar]
- 31. McEvoy CR, Cloete R, Müller B, Schürch AC, van Helden PD, Gagneux S, Warren RM, Gey van Pittius NC. 2012. Comparative analysis of Mycobacterium tuberculosis pe and ppe genes reveals high sequence variation and an apparent absence of selective constraints. PLoS One 7:e30593. 10.1371/journal.pone.0030593 [DOI] [PMC free article] [PubMed] [Google Scholar]
- 32. Marrero J, Rhee KY, Schnappinger D, Pethe K, Ehrt S. 2010. Gluconeogenic carbon flow of tricarboxylic acid cycle intermediates is critical for Mycobacterium tuberculosis to establish and maintain infection. Proc. Natl. Acad. Sci. U. S. A. 107:9819–9824. 10.1073/pnas.1000715107 [DOI] [PMC free article] [PubMed] [Google Scholar]
- 33. Rhee KY, Carvalho LP, Bryk R, Ehrt S, Marrero J, Park SW, Schnappinger D, Venugopal A, Nathan C. 2011. Central carbon metabolism in Mycobacterium tuberculosis: an unexpected frontier. Trends Microbiol. 19:307–314. 10.1016/j.tim.2011.03.008 [DOI] [PMC free article] [PubMed] [Google Scholar]
- 34. Singh A, Crossman DK, Mai D, Guidry L, Voskuil MI, Renfrow MB, Steyn AJ. 2009. Mycobacterium tuberculosis WhiB3 maintains redox homeostasis by regulating virulence lipid anabolism to modulate macrophage response. PLoS Pathog. 5:e1000545. 10.1371/journal.ppat.1000545 [DOI] [PMC free article] [PubMed] [Google Scholar]
- 35. Honaker RW, Dhiman RK, Narayanasamy P, Crick DC, Voskuil MI. 2010. DosS Responds to a Reduced electron transport system to induce the Mycobacterium tuberculosis DosR regulon. J. Bacteriol. 192:6447–6455. 10.1128/JB.00978-10 [DOI] [PMC free article] [PubMed] [Google Scholar]
- 36. Mukhopadhyay S, Nair S, Ghosh S. 2012. Pathogenesis in tuberculosis: transcriptomic approaches to unraveling virulence mechanisms and finding new drug targets. FEMS Microbiol. Rev. 36:463–485. 10.1111/j.1574-6976.2011.00302.x [DOI] [PubMed] [Google Scholar]
- 37. Farhana A, Guidry L, Srivastava A, Singh A, Hondalus MK, Steyn AJ. 2010. Reductive stress in microbes: implications for understanding Mycobacterium tuberculosis disease and persistence. Adv. Microb. Physiol. 57:43–117. 10.1016/B978-0-12-381045-8.00002-3 [DOI] [PubMed] [Google Scholar]
- 38. Garton NJ, Waddell SJ, Sherratt AL, Lee SM, Smith RJ, Senner C, Hinds J, Rajakumar K, Adegbola RA, Besra GS, Butcher PD, Barer MR. 2008. Cytological and transcript analyses reveal fat and lazy persister-like bacilli in tuberculous sputum. PLoS Med. 5:e75. 10.1371/journal.pmed.0050075 [DOI] [PMC free article] [PubMed] [Google Scholar]
- 39. Piccaro G, Giannoni F, Filippini P, Mustazzolu A, Fattorini L. 2013. Activities of drug combinations against Mycobacterium tuberculosis grown in aerobic and hypoxic acidic conditions. Antimicrob. Agents Chemother. 57:1428–1433. 10.1128/AAC.02154-12 [DOI] [PMC free article] [PubMed] [Google Scholar]
- 40. Murphy DJ, Brown JR. 2007. Identification of gene targets against dormant phase Mycobacterium tuberculosis infections. BMC Infect. Dis. 7:84. 10.1186/1471-2334-7-84 [DOI] [PMC free article] [PubMed] [Google Scholar]
- 41. Wallis RS, Patil S, Cheon SH, Edmonds K, Phillips M, Perkins MD, Joloba M, Namale A, Johnson JL, Teixeira L, Dietze R, Siddiqi S, Mugerwa RD, Eisenach K, Ellner JJ. 1999. Drug tolerance in Mycobacterium tuberculosis. Antimicrob. Agents Chemother. 43:2600–2606 [DOI] [PMC free article] [PubMed] [Google Scholar]
- 42. Kumar A, Majid M, Kunisch R, Rani PS, Qureshi IA, Lewin A, Hasnain SE, Ahmed N. 2012. Mycobacterium tuberculosis DosR regulon gene Rv0079 encodes a putative, “dormancy associated translation inhibitor (DATIN).” PLoS One 7:e38709. 10.1371/journal.pone.0038709 [DOI] [PMC free article] [PubMed] [Google Scholar]
- 43. Sultana R, Tanneeru K, Guruprasad L. 2011. The PE-PPE domain in mycobacterium reveals a serine α/β hydrolase fold and function: an in-silico analysis. PLoS One 6:e16745. 10.1371/journal.pone.0016745 [DOI] [PMC free article] [PubMed] [Google Scholar]
- 44. Leblanc C, Prudhomme T, Tabouret G, Ray A, Burbaud S, Cabantous S, Mourey L, Guilhot C, Chalut C. 2012. 4′-Phosphopantetheinyl transferase PptT, a new drug target required for Mycobacterium tuberculosis growth and persistence in vivo. PLoS Pathog. 8:e1003097. 10.1371/journal.ppat.1003097 [DOI] [PMC free article] [PubMed] [Google Scholar]
- 45. Rodriguez JG, Burbano CS, Nuñez C, González CE, Zambrano MM, García MJ, Del Portillo P. 2008. Rv3134c/devR/devS operon of Mycobacterium bovis BCG is differentially transcribed under “in vitro” stress conditions. Tuberculosis (Edinb) 88:273–282. 10.1016/j.tube.2007.11.011 [DOI] [PubMed] [Google Scholar]
- 46. Uplekar S, Rougemont J, Cole ST, Sala C. 2013. High-resolution transcriptome and genome-wide dynamics of RNA polymerase and NusA in Mycobacterium tuberculosis. Nucleic Acids Res. 41:961–977. 10.1093/nar/gks1260 [DOI] [PMC free article] [PubMed] [Google Scholar]
- 47. Thompson WA, Newberg LA, Conlan S, McCue LA, Lawrence CE. 2007. The Gibbs centroid sampler. Nucleic Acids Res. 35:W232–W237. 10.1093/nar/gkm265 [DOI] [PMC free article] [PubMed] [Google Scholar]
- 48. Reyes A, Sandoval A, Cubillos-Ruiz A, Varley KE, Hernández-Neuta I, Samper S, Martín C, García MJ, Ritacco V, López L, Robledo J, Zambrano MM, Mitra RD, Del Portillo P. 2012. IS-seq: a novel high throughput survey of in vivo IS6110 transposition in multiple Mycobacterium tuberculosis genomes. BMC Genomics 13:249. 10.1186/1471-2164-13-249 [DOI] [PMC free article] [PubMed] [Google Scholar]
- 49. Griffin JE, Gawronski JD, Dejesus MA, Ioerger TR, Akerley BJ, Sassetti CM. 2011. High-resolution phenotypic profiling defines genes essential for mycobacterial growth and cholesterol catabolism. PLoS Pathog. 7:e1002251. 10.1371/journal.ppat.1002251 [DOI] [PMC free article] [PubMed] [Google Scholar]
- 50. Barry CE, Boshoff HI, Dartois V, Dick T, Ehrt S, Flynn J, Schnappinger D, Wilkinson RJ, Young D. 2009. The spectrum of latent tuberculosis: rethinking the biology and intervention strategies. Nat. Rev. Microbiol. 7:845–855. 10.1038/nrmicro2236 [DOI] [PMC free article] [PubMed] [Google Scholar]
- 51. Gonzalez-y-Merchand JA, Garcia MJ, Gonzalez-Rico S, Colston MJ, Cox RA. 1997. Strategies used by pathogenic and nonpathogenic mycobacteria to synthesize rRNA. J. Bacteriol. 179:6949–6958 [DOI] [PMC free article] [PubMed] [Google Scholar]
- 52. Waldbauer JR, Rodrigue S, Coleman ML, Chisholm SW. 2012. Transcriptome and proteome dynamics of a light-dark synchronized bacterial cell cycle. PLoS One 7:e43432. 10.1371/journal.pone.0043432 [DOI] [PMC free article] [PubMed] [Google Scholar]
- 53. Langmead B, Trapnell C, Pop M, Salzberg SL. 2009. Ultrafast and memory-efficient alignment of short DNA sequences to the human genome. Genome Biol. 10:R25. 10.1186/gb-2009-10-3-r25 [DOI] [PMC free article] [PubMed] [Google Scholar]
- 54. Rutherford K, Parkhill J, Crook J, Horsnell T, Rice P, Rajandream MA, Barrell B. 2000. Artemis: sequence visualization and annotation. Bioinformatics 16:944–945. 10.1093/bioinformatics/16.10.944 [DOI] [PubMed] [Google Scholar]
- 55. Gonzalez-Y-Merchand JA, Zaragoza-Contreras R, Guadarrama-Medina R, Helguera-Repetto AC, Rivera-Gutierrez S, Cerna-Cortes JF, Santos-Argumedo L, Cox RA. 2012. Evaluation of the cell growth of mycobacteria using Mycobacterium smegmatis mc2 155 as a representative species. J. Microbiol. 50:419–425. 10.1007/s12275-012-1556-0 [DOI] [PubMed] [Google Scholar]
- 56. Rivals I, Personnaz L, Taing L, Potier MC. 2007. Enrichment or depletion of a GO category within a class of genes: which test? Bioinformatics 23:401–407. 10.1093/bioinformatics/btl633 [DOI] [PubMed] [Google Scholar]
- 57. Carlson J, Heckerman D, Shani G. 2009. Estimating false discovery rates for contingency tables. Microsoft Research, Redmond, WA: http://research.microsoft.com/pubs/80571/fdr%20for%20contingency%20tables.pdf [Google Scholar]
- 58. Wang L, Feng Z, Wang X, Zhang X. 2010. DEGseq: an R package for identifying differentially expressed genes from RNA-seq data. Bioinformatics 26:136–138. 10.1093/bioinformatics/btp612 [DOI] [PubMed] [Google Scholar]
- 59. Edgar R, Domrachev M, Lash AE. 2002. Gene Expression Omnibus: NCBI gene expression and hybridization array data repository. Nucleic Acids Res. 30:207–210. 10.1093/nar/30.1.207 [DOI] [PMC free article] [PubMed] [Google Scholar]
Associated Data
This section collects any data citations, data availability statements, or supplementary materials included in this article.
Supplementary Materials
Growth of M. tuberculosis in LC-FAs. Growth curves of M. tuberculosis cultured in the presence of dextrose (Dubos ADC media 1 [circles] and 2 [triangles]) or LC-FA (Dubos LC-FA media 1 [large squares] and 2 [small squares]). The results of two independent experiments (1 and 2, respectively) are shown. The arrows indicate that the exponential-phase RNA samples were taken when cultures reached OD600 of ~0.3 and 0.4 (which correspond to day 7 in Dubos ADC medium and day 8 in LC-FAs) and that stationary-phase RNA samples were taken when cultures reached an OD600 of ~0.6 (which corresponds to day 15). Download
RNA-seq library data. (A) Saturation curves showing a cumulative plot of reads from each individual condition versus the number of genes covered at different sequencing depths. Saturation was reached under all of the conditions since an increase in the number of reads did not result in the detection of additional genes. (B) Data were transformed by the method proposed by Huber et al. (24) by means of the vsn R Bioconductor package (R Development Core Team, 2008), which is available at http://www.bioconductor.org. Transformation and calibration of data were carried out as follows: hx = arsinhxs hx = arsinhx/s, where x is the number of RPKMs and s is the standard deviation of these RPKMs in the replicates of each experiment. Download
Genes differentially expressed in the LC-FA model of M. tuberculosis. Volcano plots showing each functional category that is represented as indicated in the panel. Significant differences were determined with Fisher’s exact test. See Tables S2 and S3 in the supplemental material for the complete set of data. (A) Exponential phase of growth. (B) Stationary phase of growth. Download
Comparison of LC-FA, hypoxia, and starvation in vitro models. Shown is a Venn diagram comparison of genes overexpressed in the three in vitro models: hypoxia, starvation (40), and LC-FA (this work). (Top) the 206 highest-scoring genes identified in the in vitro models were compared to each other (A) or for the presence of genes related to reductive stress according to TubercuList (http://tuberculist.epfl.ch/), excluding those of the functional category “lipid metabolism” to avoid bias toward the fatty acid model (B). Genes that belong to the DosR regulon are in parentheses. (Bottom) The percentage of shared genes (A) and the percentage of genes related to reductive stress (B) are compared. The P values for comparisons of two percentages, as well as all three percentages, are shown. Download
Validation of lipid signature genes by qRT-PCR. Genes belonging to the lipid signature (Table 2) were selected for validation by qRT-PCR with RNA isolated in the stationary phase of growth under both dextrose (blue bars) and fatty acid (red bars) conditions. Data were normalized to the number of copies of the rrs gene (16S rRNA). Results are expressed as log2 of the number of copies per microgram of RNA. In some cases, the expression of the genes was below the minimum level of detection of the technique (e.g., Rv1184, Rv1733, Rv2794, Rv3416, and Rv3614). Download
Excel file showing statistical analysis with Fisher’s exact test (A and B). (A) DE RPKM, values for dextrose in exponential phase; FE RPKM, values for fatty acids in exponential phase. (B) DS RPKM, values for dextrose in stationary phase; FS RPKM, values for fatty acids in stationary phase. FDRs were determined by Fisher’s exact test. Statistically significant differential expression between two conditions was determined by looking at genes with FDRs of <0.05. From the top to the bottom, genes are ordered from the highest to the lowest FDRs. Top, genes with significantly higher expression in FE than in DE (A) or in FS than in DS (B); middle, genes with significantly lower expression in FE than in DE (A) or in FS than in DS (B); bottom genes with no significant differential expression among the conditions compared. (C, D) DEGseq package. (C) DE (reads), read count mapping to sense strand of gene (exponential phase in dextrose); FE (reads), read count mapping to sense strand of gene (exponential phase in fatty acids); (D) DS (reads), read count mapping to sense strand of gene (stationary phase in dextrose); FS (reads), read count mapping to sense strand of gene (stationary phase in fatty acids). Top, true significant; bottom, false significant. (E, F) Genes significantly overexpressed in the presence of LC-FA. Shown are the genes significantly overexpressed in the presence of fatty acids during exponential phase (E) and during stationary phase (F). From the top to the bottom, genes are ordered according to their tag numbers.
Excel file showing RPKM data of noncoding RNAs. RPKM values of tRNAs (A) and other intergenic regions (B) and a comparison of the 21 intergenic regions with higher RPKM values (C) are shown.
Functional categories with significantly increased or decreased expression in the fatty acid model. Genes were organized by functional categories (FC) according to TubercuList (http://tuberculist.epfl.ch/). % FC is the percentage of genes in each functional category related to the total number of genes. Total FC is the number of genes in a functional category with significantly increased or decreased expression in each phase of growth. % Total is the percentage of genes in a functional category with respect to the total number of genes with significantly increased or decreased expression in each phase of growth. % Total/% FC is the ratio of the percentages of genes with increased or decreased expression in each functional category and phase of growth. Overrepresented ratios are in bold, and underrepresented ratios are in italics.
Genes related to reductive stress during growth of M. tuberculosis in fatty acids. (A) Number of genes related to reductive stress with significant expression during growth in different carbon sources. Genes with significantly increased or decreased expression during growth in fatty acids (FE, FS) (see Table S3E and F in the supplemental material) were checked against 371 genes related to reductive stress (http://www.tuberculist.epfl.ch). The list of genes related to reductive stress includes those in the functional category of “lipid metabolism,” as well as genes participating in heme group synthesis and stabilization. Growth phase: FE, Dubos medium with LC-FA in exponential phase; FS, Dubos medium with LC-FA in stationary phase. (B) Genes related to the heme prosthetic group with significantly increase expression during growth in LC-FAs. Gene tags with asterisks indicate those genes that are members of the DosR regulon.
Primers used for qRT-PCR. The information provided on the primers used for qRT-PCR includes the target gene tag, the sequence, the annealing temperature, and the size of the amplified product.