Abstract
Purpose: Digital breast tomosynthesis (DBT) offers poor image quality along the depth direction. This paper presents a new method that improves the image quality of DBT considerably through the a priori information from automated ultrasound (AUS) images.
Methods: DBT and AUS images of a complex breast-mimicking phantom are acquired by a DBT/AUS dual-modality system. The AUS images are taken in the same geometry as the DBT images and the gradient information of the in-slice AUS images is adopted into the new loss functional during the DBT reconstruction process. The additional data allow for new iterative equations through solving the optimization problem utilizing the gradient descent method. Both visual comparison and quantitative analysis are employed to evaluate the improvement on DBT images. Normalized line profiles of lesions are obtained to compare the edges of the DBT and AUS-corrected DBT images. Additionally, image quality metrics such as signal difference to noise ratio (SDNR) and artifact spread function (ASF) are calculated to quantify the effectiveness of the proposed method.
Results: In traditional DBT image reconstructions, serious artifacts can be found along the depth direction (Z direction), resulting in the blurring of lesion edges in the off-focus planes parallel to the detector. However, by applying the proposed method, the quality of the reconstructed DBT images is greatly improved. Visually, the AUS-corrected DBT images have much clearer borders in both in-focus and off-focus planes, fewer Z direction artifacts and reduced overlapping effect compared to the conventional DBT images. Quantitatively, the corrected DBT images have better ASF, indicating a great reduction in Z direction artifacts as well as better Z resolution. The sharper line profiles along the Y direction show enhancement on the edges. Besides, noise is also reduced, evidenced by the obviously improved SDNR values.
Conclusions: The proposed method provides great improvement on the quality of DBT images. This improvement makes it easier to locate and to distinguish a lesion, which may help improve the accuracy of the diagnosis using DBT imaging.
Keywords: cross modality image enhancement, limited angle tomography artifacts, ultrasound imaging, loss function, image registration
INTRODUCTION
X-ray mammography is the best simple method to detect early stage breast cancer.1 However, since it is a two-dimensional imaging modality, accuracy of x-ray mammography is limited by overlying tissue structure.2, 3, 4 This overlap effect can be reduced and in some cases essentially eliminated by using digital breast tomosynthesis (DBT) (Refs. 5, 6, 7, 8) since this limited angle tomography enables a partial three-dimensional (3D) reconstruction. This reduction of overlap effects may result in earlier detection and better interpretation of breast cancer particularly in dense breasts.9, 10, 11 Projections are acquired by keeping the breast and detector stationary, while the x-ray source moves over a limited angle above the breast. A 3D volume of the breast is reconstructed from these projections using one of the several classes of reconstruction algorithms. However, due to the limited-angle acquisition, the in-slice resolution is much higher than the resolution between slices (depth resolution).9 Severe image artifacts radiate in directions parallel to the x-ray beam paths. These artifacts result in lower lesion contrast and blurred borders of the lesions in off-focus planes that are not in the plane of the largest cross section of a lesion. This problem has been investigated extensively before, mainly focusing on the generation, the evaluation, and reduction of artifacts along the Z axis.12, 13, 14, 15, 16 Perhaps almost as important, particularly to lesion contrast and future quantitative accuracy, are fan-shaped artifacts that are present in planes well removed from the planes of large, high-contrast objects, but those artifacts are not addressed specifically by this algorithm that we propose here.
Ultrasound (US) is commonly employed as a valuable adjunct to mammography. Conventionally, scanned and automated ultrasound (AUS) imaging help improve the sensitivity of cancer detection, especially for younger women with dense breasts for whom mammography is less effective.17, 18, 19, 20 However, conventional US imaging is performed freehand in a different geometry than mammography, making it difficult and time-consuming to correlate suspicious lesions detected in either of the two modalities.21 The resulting misidentification in the ultrasound of approximately 10% of mammographic lesions in which ultrasound diagnosis is sought can lead to an incorrect diagnosis of solid or cystic lesion.22 It is reasonable to assume that in situations where mammography or DBT and ultrasound are used in screening, that difficulty and uncertainty in finding a possible ultrasound mass in the x-ray images will lead to less aggressive detection of cancer by ultrasound and/or a higher call back rate for diagnosis. In an attempt to solve this problem, a 3D-AUS imaging system is used in this study so that the DBT and AUS images of the breast can be acquired in the same geometry. With such a system, each of six experienced breast imaging radiologists in a diagnostic reader study indicated increased confidence in using DBT for hypothetical screening when 3D-AUS was added.23 The imaging slices of the AUS are parallel to the central x-ray beam and DBT axis of rotation. In other words, the AUS slices are perpendicular to slices of DBT. Consequently, the high depth resolution in the AUS imaging slices can be appropriately applied to improve the poor quality of DBT in that depth direction.
There are many algorithms for x-ray reconstruction, such as filtered back projection (FBP) and iterative reconstruction algorithms.24, 25, 26, 27, 28, 29, 30 SART (Simultaneous Algebraic Reconstruction Technique) is an iterative method that enables a fairly good result using limited angle projection data.31, 32, 33 Because of this property, SART was selected as the basic DBT reconstruction algorithm for this study. A new loss function based on SART was written to include AUS information. By solving this new optimization problem, the new recursive formula can be used to achieve high quality DBT images.
METHODS AND MATERIALS
Principle of the proposed method
Simultaneous algebraic reconstruction technique
SART is a reconstruction algorithm by iteratively updates the value of each voxel using projection images.34, 35 The imaging system can be expressed by the following algebraic equation:
| (1) |
where x = (x1, …, xj, …, xN)T ∈ RN is a N × 1 column vector that denotes the unknown values of all the N voxels. b = (b1, …, bi, …, bM)T ∈ RM represents the M projection elements acquired by the DBT system. A = (Aij) is a nonzero M × N system matrix in which the element Aij denotes the influence that voxel xj has on projection element bi. Equation 1 transforms all the voxels to the projections.The loss function36L(x) for conventional SART is defined as
| (2) |
where W is a weighting matrix. For a vector a ∈ RN, the canonical Euclidean inner product is represented by ⟨a, a⟩, then the weighted norm is defined as
| (3) |
The optimization problem can be solved using the gradient descent method. Then the SART iterative formula for each voxel becomes
| (4) |
where λ is the relaxation coefficient and is set to 0.1 to ensure convergence in this study. A+, j and Ai, + are given by
| (5) |
Every iteration using all the projection data once is called an order-subset (OS) cycle.37 Using SART, along with the DBT projection image data, the reconstruction volume of the breast can be acquired after several OS cycles.
Detailed introduction on the novel method
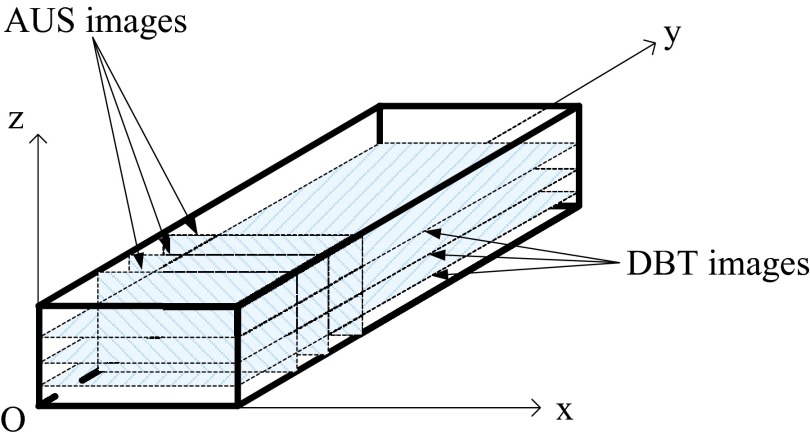
As noted above, reconstructed images of AUS are perpendicular to those of DBT. Except for modest refraction artifacts in the AUS imaging of this rigid phantom, these AUS images are nearly perfectly registered to the DBT images. Therefore, gradient information of the images in AUS can be used to improve the image quality of DBT from the same view. In this paper, the DBT slices are parallel to the XY plane and AUS slices are parallel to the XZ plane (see Fig. 1). The depth direction of DBT and AUS is along the Z direction.
Figure 1.
Imaging slices of DBT and AUS.
Gradient information extraction for AUS images
For simplicity of this demonstration, the 2D gradient information is taken in each imaging plane along two axes (X and Z axes in this paper). Gradient information along Y is not used here since the resolution of the AUS is poor along that axis. Suppose f(x0, z0) to be a pixel in an AUS image, the gradient information can be calculated following Eq. 6,
| (6) |
Specifically, the italic letter G represents this gradient at a pixel. Subscript x and z denote the axis along which we extract gradient information. For the pixels in the top row, the gradient along the Z axis is set to zero. Similarly, the gradient along the X axis of pixels in the rightmost column is zero as well.
Since the DBT images are optimized using AUS edge information, effectively extracted gradient information of AUS images becomes extremely important for good combined reconstruction images. This requires, for example, clear borders and only slight artifacts. Therefore, we employed some image processing methods, such as median filtering, total variation (TV) denoising to the raw AUS images. Also, we applied median filtering and morphological methods to the calculated gradient images so that they can best describe the useful gradient information of AUS images.
Derivation of the new iterative formula
We use the gradient information of AUS images to improve the quality of DBT images by conceiving a new loss function as
| (7) |
In Eq. 7, A is a nonzero M × N system matrix that transforms voxels to projections.34x = (x1, …, xj, …, xN)T ∈ RN consists of all the N undetermined voxels in the reconstruction volume. b = (b1, …, bi, …, bM)T ∈ RM represents the M projection elements acquired by the DBT system. The weighting matrix W is a diagonal matrix defined as
| (8) |
The second and third terms of Eq. 7 is the constraint we have added. θ1 and θ3 are the parameters to control the degree of AUS effects on the new DBT images. G ∈ RN represents the gradient of all the voxels. To avoid confusion, we use subscripts “1” and “3” to represent the two directions (X axis and Z axis). Subscript “us” represents AUS imaging and X represents DBT imaging. Gus1 and Gus3 are the gradient information of AUS images along the X and Z axes, respectively, that we calculated in Eq. 6. Likewise, the gradient of the new reconstruction images (GX1 and GX3) should also be calculated in the same way. However, since x is changing all the time along with the progress of the iteration, GX1 and GX3 need to be calculated during iterations. We use matrix B and C to calculate the gradient along the X and Z axes, respectively,
| (9) |
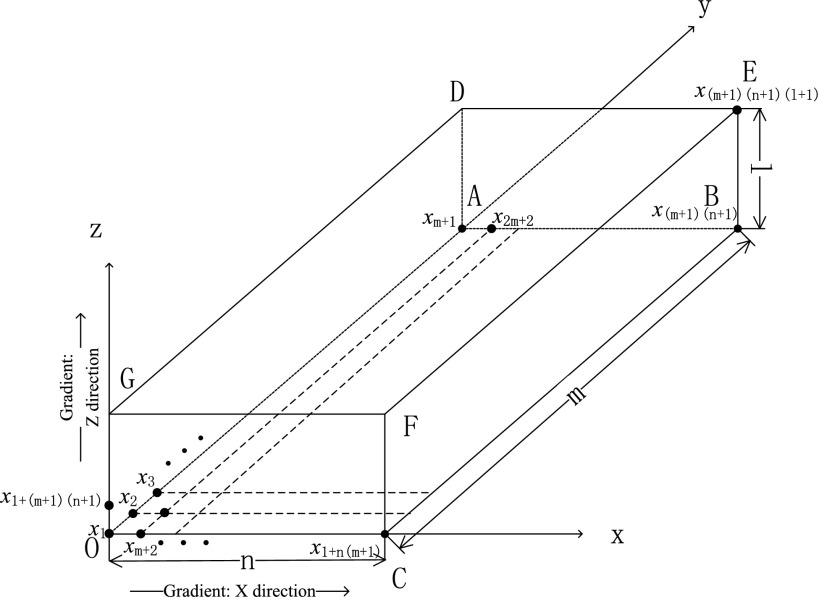
For illustrative purposes, we will number all the voxels in the reconstructed volume according to the following rules: The first voxel at the origin is described as x1. After that, the number order goes along the Y axis, then the X axis, and finally the Z axis (see Fig. 2). The size of the volume is m in length (y), n in width (x), l in height (z), and the total number of voxels is N = (m + 1)(n + 1)(l + 1). The 3D coordinate is therefore transformed to a 1D coordinate.
Figure 2.
Numbered voxels in reconstruction volume.
The N × N matrix B and C are defined as
| (10) |
where Bj (j = 1, 2, …, N), Cj (j = 1, 2, …, N) are N-dimensional row vectors. To get the gradient information of x in the same way, Bj and Cj are constructed satisfying the following two conditions:
Bj: If j ∈ plane CBEF (see Fig. 2), Bj = 0;
Else, the jth element is set to 1, the [j + (m + 1)]th element is set to −1, and the rest elements are set to 0.
Cj: If j ∈ plane DEFG (see Fig. 2), Cj = 0;
Else, the jth element is set to 1, the [j + (m + 1)(n + 1)]th element is set to −1, and the rest elements are set to 0.
Bj and Cj are constructed so that
| (11) |
Put Eq. 10 into Eq. 7, then the loss function can be written as
| (12) |
Now we will use the gradient descent method to solve this optimization problem. The gradient of L(x) can be calculated as
| (13) |
The iterative scheme is
| (14) |
where ω is defined as the step size according to the gradient descent method.38 Define ωθ1 and ωθ3 as two new parameters λ1 and λ3. Replace ω with λ and matrix V−1 is attached to the iteration process according to SART. Then Eq. 14 can be expressed as
| (15) |
where matrix V is defined as
| (16) |
For each voxel, Eq. 16 can be expressed as
| (17) |
where is the value of the jth voxel after (t + 1) iterations, i is the number of the projection element, bi is the value of the ith projection element, and (Ax(t))i is the ith estimated projection value. and satisfies
| (18) |
| (19) |
where Gus1, j represents the gradient of the jth voxel of AUS images along X axis, and Gus3, j represents the gradient of the jth voxel of AUS images along Z axis. GX1, j represents the gradient of the jth voxel of combined DBT images along X axis after t iterations, and GX3, j represents the gradient of the jth voxel of combined DBT images along Z axis after t iterations. GX1, j and GX3, j can be calculated by
| (20) |
| (21) |
Breast-mimicking phantom
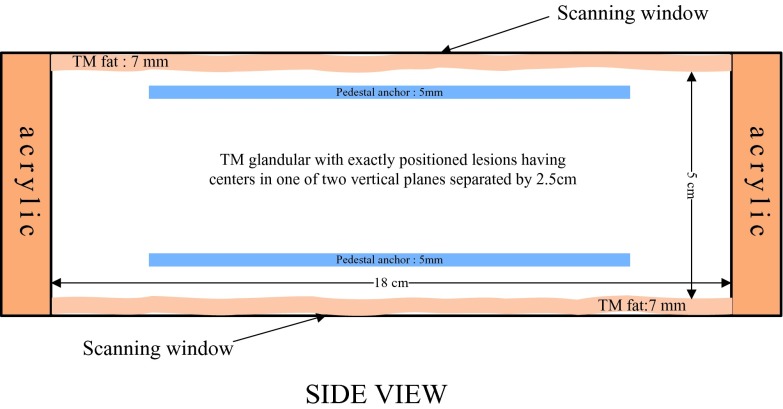
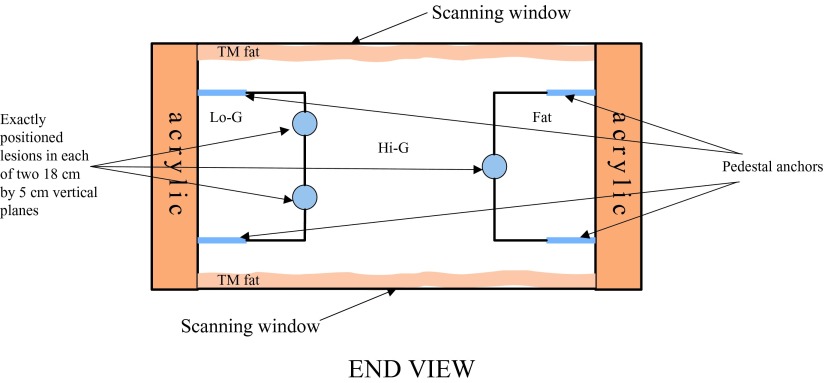
This phantom simulates the breast compressed in the mammographic cranio-caudal geometry and was designed by our group in cooperation with Madsen and built by Madsen and Frank at the University of Wisconsin, Madison.39, 40 The breast-mimicking phantom contains 39 lesions in all, 21 of which simulate cancers and 18 of which simulate cysts. It is a rectangular solid (length = 22.23 cm, width = 12.70 cm, height = 6.40 cm), with a thick lesion-embedded slab (length = 18.00 cm, width = 8.50 cm, height = 5.00 cm) sandwiched between two approximately 7 mm thick aberrating layers of tissue-mimicking subcutaneous fat. This slab has rectangular sections simulating fat and a medium speed, mixed fat, and glandular tissue, labeled as low speed glandular tissue. An H-shaped central section simulates high-speed glandular tissue. The two 18 × 3.9 cm lesion-embedded, vertical boundaries in this slab lie between the central glandular and side tissues. The phantom is bounded by acrylic walls and the scanning windows on the top and bottom are covered with 25 μm thick Saran wrap (Figs. 34). Pedestal anchors have been inserted for structural stability and do not interfere with the central volume to be scanned.
Figure 3.
Schematic of phantom: Side view.
Figure 4.
Schematic of phantom: End View. The black lines that are attached to the lesions are the borders of different central breast mimicking materials. The two 18 × 3.9 cm lesion-embedded, vertical boundaries in this slab lie between the central glandular and side tissues.
The fat and glandular-mimicking materials are oil-in-gelatin dispersions, while the lesions contain no oil. The oil produces a lowered propagation speed and density and contributes to attenuation. The single hyperechoic lesion contains water-based gelatin with powdered graphite and glass beads (45–53 μm in diameter).41 Additionally, the tissue-mimicking fat has an even lower speed of sound. There are five tissue mimicking background regions plus lesions in the phantom with speeds of sound given (see Table 1). The lesions are exactly positioned in the borders of the tissue-mimicking glandular region to make a challenging environment for ultrasound beamforming. Each 1.25 cm thick depth zone contains at least 4 “cancers” and 4 “cysts.” Besides the 35 smaller (5 mm diameter) spherical “cancers” and “cysts,” one large (8 mm diameter) spherical “cyst” and one large hyperechoic spherical “cancer,” the sharp points or even spiculations of some cancers are simulated here by connecting two cones symmetrically at their 10 mm diameter bases.
Table 1.
Speed of sound of the materials in the breast-mimicking phantom.
| Tissue-mimicking material | Fat | Mixed fat and glandular, Lo-G in Fig. 4 | High speed of sound glandular | Hypoechoic lesions | Hyperechoic lesions |
|---|---|---|---|---|---|
| Speed of sound(m/s) | 1412 | 1423 | 1455 | 1539 | 1550 |
Imaging system
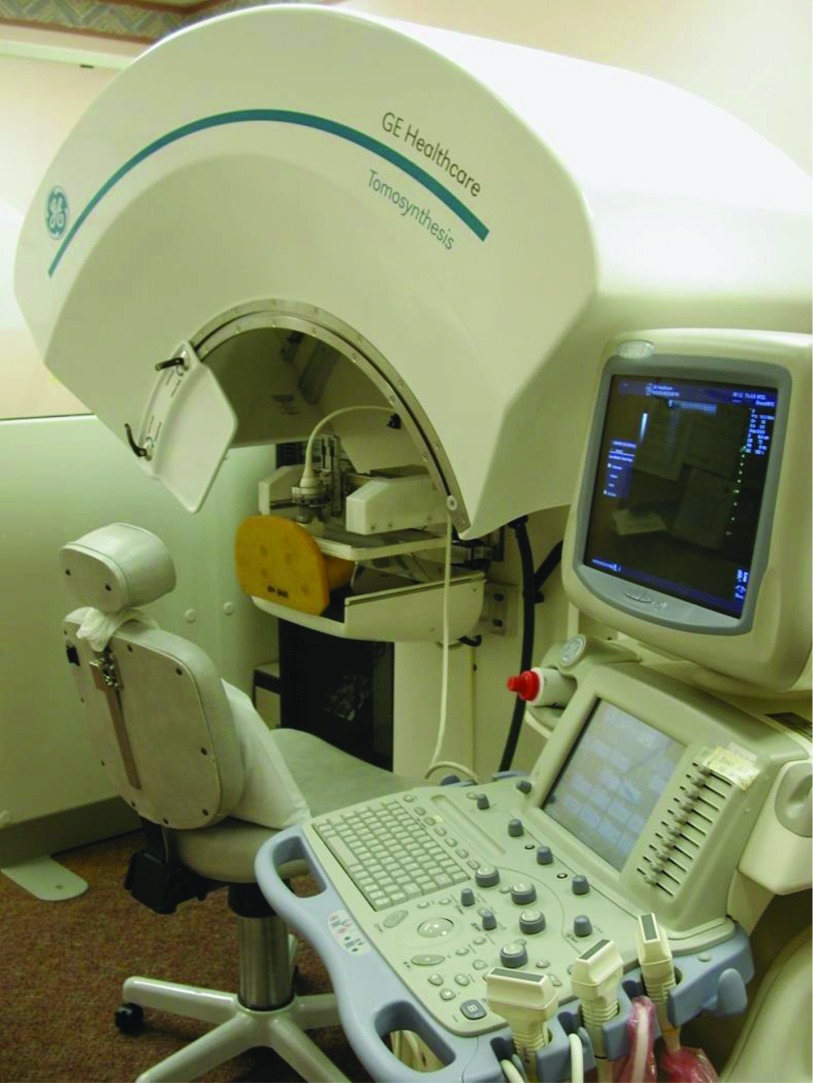
We have utilized in this study a combined DBT/AUS imaging system (see Fig. 5), developed by GE Global Research with our collaboration and modifications.21 Image planes of the DBT are parallel to the detector, while planes of the AUS images are perpendicular to it, XY and XZ planes of Fig. 2, respectively. The breast phantom is imaged sequentially with DBT and AUS in the same mammographic geometry which makes nearly exact registration between the two modalities possible,23 except for distortion by acoustic refraction in this case, as well as motion when imaging in vivo.
Figure 5.
Photograph of the combined DBT/AUS system.
DBT imaging subsystem
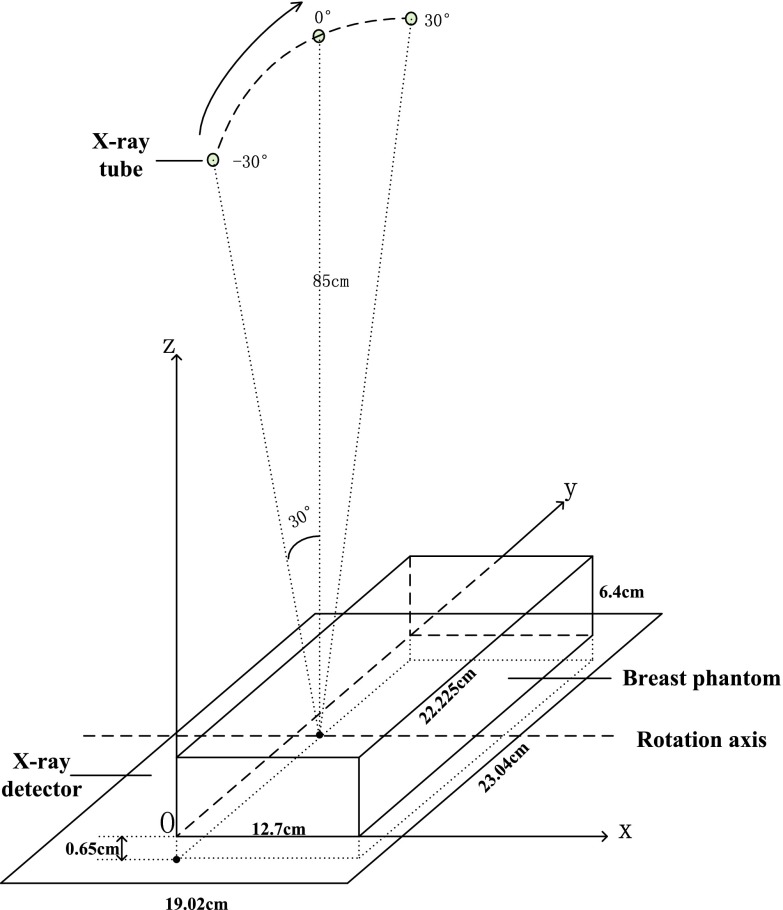
The DBT imaging subsystem includes the x-ray source, which moves in the large, curved cowling along Y direction, and the x-ray detector, in black under the brown urethane breast phantom. The detector consists of a matrix of 1920 × 2304 pixel elements at a pitch of 0.1 mm. During the DBT acquisition (see Fig. 6), the tube traverses an arc above the stationary breast or phantom and detector. The system acquires 21 projection images, equally spaced over a wide angular range of 60° (−30° to +30°) with ∼3° angular spacing. The source moves in the lateral plane of the phantom with a perpendicular source to detector distance of 85 cm. The distance from the source to XZ plane is about 11 cm, half of the length of the phantom.
Figure 6.
Schematic of the DBT imaging subsystem.
AUS imaging subsystem
The AUS imaging subsystem in the combined system includes an ultrasound transducer, its 2D scanning mechanism, and a compression paddle. Whenever possible, patients imaged with AUS and DBT in the combined system, are also scanned with a separate, dual sided ultrasound imaging system with two transducers and two compression paddles to achieve higher quality AUS.42 For ultrasound, there is a trade-off between imaging depth and resolution since higher frequencies, which provide better resolution, are attenuated disproportionately. In this second system we employ interleaved, compound B mode imaging from the top and bottom of the phantom as the transducers move in synchrony in the mammographic geometry. For each transducer, two sweeps along the Y axis are performed in order to cover the two rows of lesions (see Fig. 7). AUS resolution along the Y axis depends on the step size of the transducer which is set to 0.1 mm in this study. Results of the two sweeps are combined and images of the phantom from top and bottom views are achieved. After that, registration and fusion of the two opposed views are implemented so that a combined AUS imaging volume is achieved.41 Compared to one-sided scanning in the combined system, AUS images achieved with the dual-sided system have higher resolution and less artifacts, which is beneficial for extracting good gradient information. The dual sided AUS system is employed in this study, as the DBT and AUS image volumes of the rigid phantom can be registered well. The AUS in future combined systems can be designed for dual-sided scanning.
Figure 7.
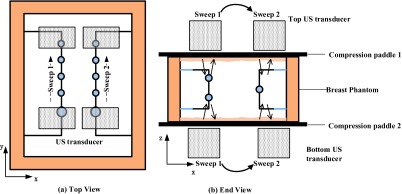
Schematic of the dual-sided ultrasound system: (a). Top view. (b). End view. Arrows inside the phantom in (b) indicate the process of transmitting and receiving ultrasound.
In this study, the inplane resolution (parallel to XZ plane) of the AUS images is 0.14 × 0.14 mm. This does not match the correspondent resolution of DBT images and hence registration between DBT and AUS is required.
Registration between DBT and AUS images and segmentation of the AUS
For the DBT image improvement presented here, the DBT image volume and AUS image volume should be registered precisely. That is, the AUS volume should be aligned with the DBT image volume so that the lesions and all other structures have the same sizes and locations. This alignment is accomplished by image-based registration software, a task that is trivial with this rigid phantom and usually is so with real breasts in the combined system in the absence of motion between or during DBT and AUS.21 Registration of real breast scans in different compressions, as between the combined and dual-sided scanners is less consistent, but is made easier when there are lesions and other identifiable structures to aid the registration. This latter registration task is still under investigation43, 44 and the field of image volume registration is progressing rapidly.
Evaluation metrics
Signal difference to noise ratio
To compare the image quality of DBT and AUS-corrected DBT in terms of contrast and noise, we define SDNR as
| (22) |
where is the average pixel intensity of the lesion, is the average intensity of the image background, σbg is the standard deviation (STD) of the background pixel intensity.45 In this study, SDNR is calculated as a function of the distance between the in-focus and the off-focus planes of a lesion in order to investigate the improvement in those off-focus imaging planes. For a certain slice, the region of interest (ROI) is located approximately 1 mm inside the lesions. Meanwhile, the H-shaped high-speed glandular tissue is chosen as the background because compared to the low-speed glandular, the reconstructed pixel intensity of high-speed glandular is closer to the lesions.
Artifact spread function (ASF)
The ASF is a metric which is intended to evaluate the Z direction artifact and depth resolution of the reconstructed images and is a common method to investigate tomosynthesis image quality.46, 47 It is a function of the distance (in the Z direction) between the in-focus and off-focus planes and is defined by
| (23) |
where z0 is the slice location of the in-focus plane of the lesion and z is the location of an off-focus plane. and are the average pixel intensities of the lesion in the center slice and the blurred area in the off-focus planes. and are the average pixel intensities of the background at different planes. and are measured in ROIs at the same X-Y location of the in-focus slice.
RESULTS
In this study, the physical size of the virtual image volume we reconstruct is 20.16 cm in length, 10.48 cm in width and 3.20 cm in thickness, which includes the first and second lesion layers of the phantom. The distance from the bottom of the virtual image volume to the bottom of the phantom is 1 mm. In order to investigate the performance of our method in the depth direction, the slice interval is set to 0.1 mm instead of 1 mm. Meanwhile, voxel size in the image plane (planes parallel to the detector) is set to be 0.1 mm as well. Therefore, the size of the volume we reconstruct is 2016 × 1048 × 320. As we mentioned in Sec. 2.A.1, the DBT reconstruction using SART needs about 3 OS cycles, which means updating the value of each voxel 63 times. However, we have found that the gradient update process needs about 1000 iterations for each voxel. Since it is time consuming to calculate matrix A during the iteration process, we execute our algorithm by splitting Eq. 17. That means after one update for a voxel using the first term of the right side of Eq. 17, the same voxel is updated 15–20 times using the second and third term. With this strategy, the algorithm converges to a fairly good result, which will be presented and quantitatively analyzed further in Secs. 3A, 3B.
Reconstruction results
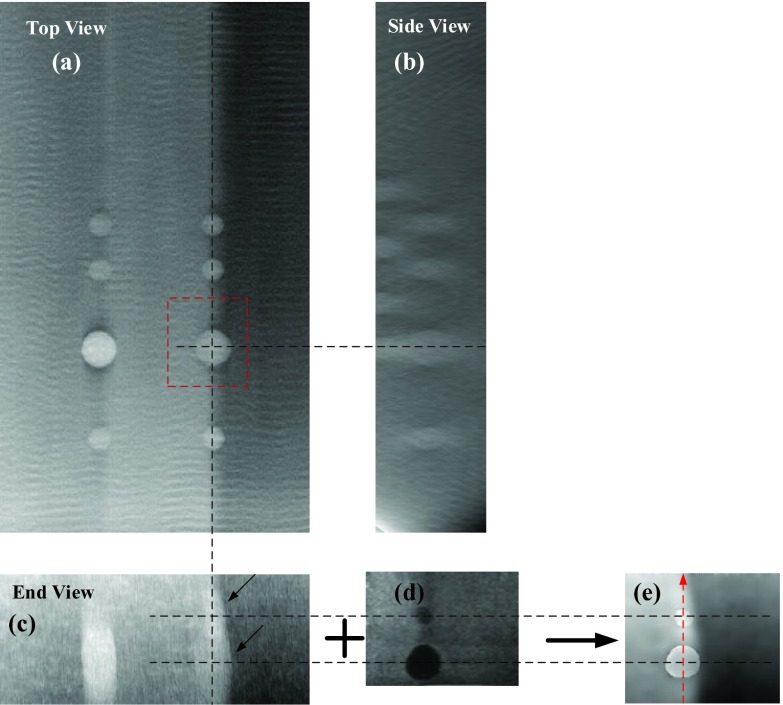
Figure 8 shows the comparison between the DBT images using traditional SART method and our proposed method. In-focus DBT plane of the first layer where the lesions have the clearest boundaries is shown in Fig. 8a. It should be noticed that the rippling in the DBT images can be removed with appropriate refinements of the reconstruction algorithm. However, tracking down those refinements was not considered necessary for this study and was not pursued.
Figure 8.
Comparison between the DBT and AUS-corrected DBT images in Z direction. (a)–(c) are all slice images showing different views of the 8 mm cyst reconstructed using the conventional SART. (d) shows the corresponding perfectly registered AUS slice. (e) shows the corresponding AUS-corrected DBT image. Voxel size in the image plane and slice interval of all the images are 0.1 mm. The DBT and AUS images are all shown in the same scale to make a better comparison. Distance from the center slice (a) to the bottom of the phantom is 13.3 mm.
As we mentioned above, the DBT images have poor quality along the Z axis, such as blurry edges, serious artifacts, and low resolution. Note the overlapping effect of the 5 mm lesion and 8 mm lesion in Z direction reconstructed by conventional SART [marked by the arrows in Fig. 8c]. The artifact of the 8 mm cyst and the 5 mm cancer connected with each other makes it difficult to distinguish the two lesions. However, with the aid of AUS images [Fig. 8d], the reconstruction image of the two lesions using the proposed algorithm has sharp and clear edges [see Fig. 8e]. Additionally, the high-speed glandular region [left side of Fig. 8e] is still sharply delineated from the low speed glandular region compared to Fig. 8d, keeping the advantages of DBT imaging.
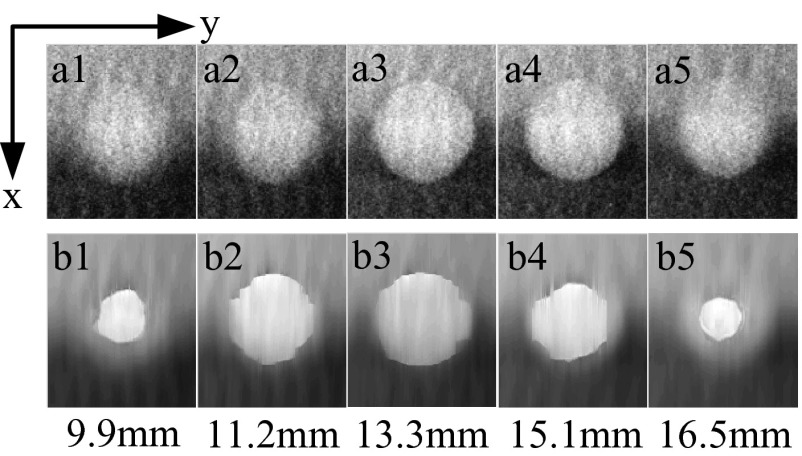
If we observe that in the images that are parallel to the detector, the poor Z axis resolution is embodied as the fuzzy boundary when the slice number deviates from the center slice [Figs. 9(a1)–9(a5)]. The edge of the lesion in the off-focus planes gets blurred rather than just shrinking. In contrast, using the deduced iterative formula introduced in Sec. 2.A.2, the corrected DBT images have much clearer edges compared to the conventional one [Figs. 9(b1)–9(b5)].
Figure 9.
Comparison of 5 slice images through the 8 mm cyst [marked with the dotted box in Fig. 8a] for original DBT (top row) vs AUS-corrected DBT (bottom row). The third row shows the physical distance from the observed slice to the bottom of the phantom. Voxel size is 0.1 × 0.1 mm.
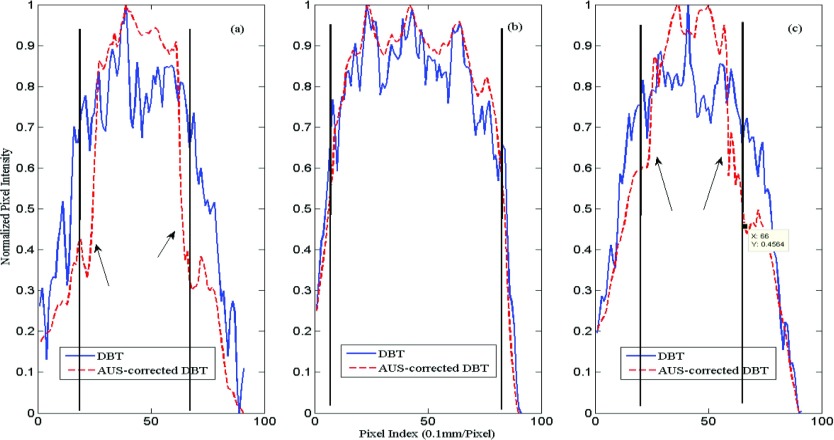
To describe quantitatively, normalized line profiles along the Y direction are obtained for both DBT and AUS-corrected DBT images. Here, the line profiles of both the in-focus and the off-focus planes are plotted in order to compare the edge enhancement (Fig. 10). As indicated by the arrows in Fig. 10, the AUS-corrected DBT clearly gives a much sharper profile.
Figure 10.
Normalized line profiles of the 8 mm cyst along Y direction. Distance from the bottom of the phantom to slice: (a) 9.9 mm (b) 13.3 mm, and (c) 16.5 mm. The black vertical lines show the actual limits of the 8 mm cyst in each plot.
Quantitative evaluation
In the Y direction of Figs. 910, sharper edges are shown on the images and the profiles (a) and (b), which are off the central axis. However, the ultrasound, with its lowest, elevational, resolution, guided the edges to be closer together than expected. The measured and expected lesion diameters at the full width at half max for these pixel value profiles are given in Table 2.
Table 2.
Measured diameters in Fig. 10.
| Image plane | Dist to center (mm) | Expected dia (mm) | Measured corrected (mm) | Measured original (mm) |
|---|---|---|---|---|
| a | 3.4 | 4.52 | 3.89 | 6.82 |
| b | 0 | 8.00 | 7.77 | 8.06 |
| c | 3.2 | 4.80 | 5.17 | 6.73 |
Signal difference to noise ratio
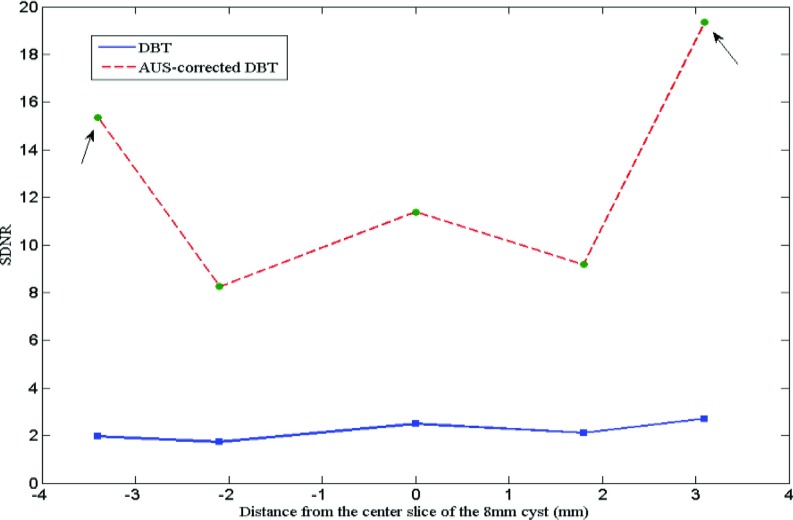
The SDNR is calculated as a function of the distance between the center slice and off-focus slices of the 8 mm cyst (see Fig. 11). ROI size inside the cyst decreases as the cyst shrinks in the off-focus slices, both for the calculation of DBT and AUS-corrected DBT images.
Figure 11.
SDNR of the 8 mm cyst reconstructed in different slices. The solid line indicates the traditional DBT and the dashed line indicates the proposed AUS-corrected DBT. “0” in the x-axis denotes the center slice and the left side of “0” is the slices under the center slice.
Artifact spread function
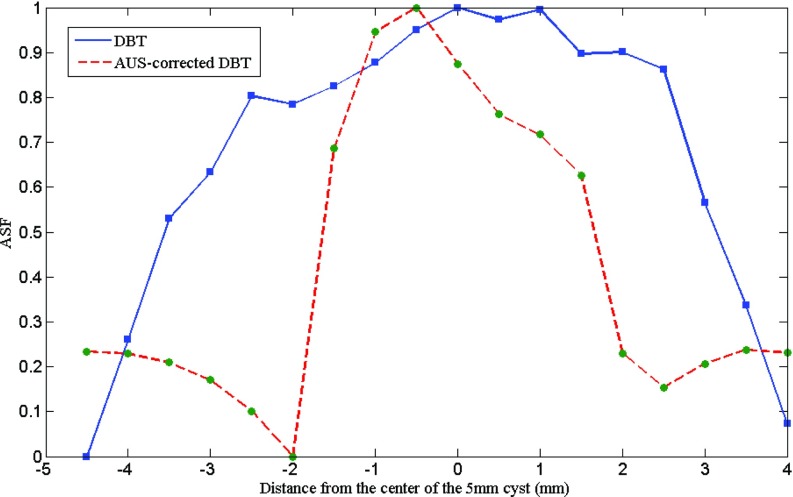
The ASFs of the DBT and corrected DBT are measured using the method introduced in Sec. 2D2. Figure 12 shows the ASFs of a 5 mm cyst in the second layer reconstructed by the two methods. The diameter of the ROIs inside the center slices of the 5 mm cyst and inside off-focus blur and the background is 4 mm (40 pixels). The proposed method gives much better ASF than the traditional method, indicating less Z artifact. The FWHM Z length of the AUS peak is 3.3 mm corrected and 6.7 mm uncorrected.
Figure 12.
ASFs of the 5 mm cyst measured from the traditional DBT and AUS-corrected DBT. The solid line indicates the traditional DBT and the dashed line indicates the AUS-corrected DBT.
DISCUSSION
In comparing the reconstructed DBT results (Figs. 89), visual improvements using the proposed method are obvious. The artifact along the Z-axis is highly reduced, minimizing or eliminating the overlapping effect on the two nearby lesions presented. The long tail of the ASF for the uncorrected reconstruction (Fig. 12) no longer exists. Its uncorrected FWHM is twice that of the ASF peak of the corrected reconstruction. The almost sixfold improvement in lesion SDNR shown in Fig. 11 is perhaps the most important improvement made possible by this partial correction for the reduced information available in limited angle tomography. This is from the higher brightness in the lesion as well as reduced noise in the lesion and background (Figs. 89). This is true for the in-focus, center, but particularly for the off-center planes of the lesion.
Despite the advantages discussed above, the proposed method still exhibits some limitations. High quality AUS images will yield better AUS-corrected images using the proposed method. However, some kinds of lesions such as cancers show irregular margins and posterior shadowing. Also, availability of coregistration between the two modalities is still limited. More image processing can and should be applied to the AUS images to make sure that the gradient information gained from the AUS images is as accurate as possible. Anatomical noise may also complicate the problem by making it more difficult to extract the gradient information. Although it can be chosen manually, automatic selection of the optimum gradient information needs further study.
Furthermore, the proposed method is intended to bring useful information from AUS images to DBT images, so it is also important to decide whether the information from AUS images is actually useful. For example, for small microcalcifications that often do not appear in AUS, the proposed method may result in a conspicuity reduction. A local application of the proposed method may be helpful in minimizing this problem. Other reconstruction techniques may also be helpful to improve DBT using the proposed method as long as accurate edge information can be acquired.
Although this unique prototype system has the potential to present better image reconstructions compared to a conventional, single modality system, there remains unresolved issues regarding the clinical utility and commercial potential of such a hybrid system.
CONCLUSIONS
This study proposes a new method to improve the quality of DBT images. By using the a priori information from corresponding AUS images and introducing a new loss function, the new reconstruction result of DBT images does much better than the traditional SART in noise reduction, edge preservation, increased resolution, and decreased artifacts along the Z axis, as evaluated through quantitative analysis. Furthermore, the signal to noise ratio of the glandular materials and the tissue-mimicking fat between and around lesions are increased to benefit identifying the lesions and determining their boundaries. By improving the resolution of possible cancers from the over- or underlying areas of dense fibroglandular or scar tissue, this method is of potential significance for the development and application of DBT imaging in clinical diagnosis.
ACKNOWLEDGMENTS
This research was supported by the National Institutes of Health of the United States under Grant Nos. R01AR060350, R01CA91713, and R01AR055179, the National Natural Science Foundation of China under Grant No. 61201425, and the Chinese National Natural Science Foundation of Jiangsu Province under Grant No. BK20131280. The study of improving out of plane resolution in DBT using coregistered ultrasound was proposed by Bernhard Claus, GE Global Research Center, Niskayuna. The support of GE GRC in developing and maintaining the research DBT system under R01CA91713 is appreciated as are the contributions of Mitchell M. Goodsitt, Ph.D. and Heang-Ping Chan, Ph.D., in calibrating the DBT system and acquiring the DBT data. Fong Ming Hooi, Ph.D., advised on initial correction algorithms.
References
- Fang Q., Selb J., Carp S. A., Boverman G., Miller E. L., Brooks D. H., Moore R. H., Kopans D. B., and Boas D. A., “Combined optical and x-ray tomosynthesis breast imaging,” Radiology 258(1), 89–97 (2011). 10.1148/radiol.10082176 [DOI] [PMC free article] [PubMed] [Google Scholar]
- Nothacker M., Duda V., Hahn M., Warm M., Degenhardt F., Madjar H., Weinbrenner S., and Albert U., “Early detection of breast cancer: Benefits and risks of supplemental breast ultrasound in asymptomatic women with mammographically dense breast tissue,” Syst. Rev., Bmc Cancer 9(1), 335–343 (2009). 10.1186/1471-2407-9-335 [DOI] [PMC free article] [PubMed] [Google Scholar]
- Kerlikowske K., Cook A. J., Buist D. S. M., Cummings S. R., Vachon C., Vacek P., and Miglioretti D. L., “Breast cancer risk by breast density, menopause, and postmenopausal hormone therapy use,” J. Clin. Oncol. 28(24), 3830–3837 (2010). 10.1200/JCO.2009.26.4770 [DOI] [PMC free article] [PubMed] [Google Scholar]
- Helvie M. A., “Digital mammography imaging: Breast tomosynthesis and advanced applications,” Radiol. Clin. N. Am. 48(5), 917–929 (2010). 10.1016/j.rcl.2010.06.009 [DOI] [PMC free article] [PubMed] [Google Scholar]
- Sechopoulos I., “A review of breast tomosynthesis. Part I. The image acquisition process,” Med. Phys. 40(1), 014301 (12pp.) (2013). 10.1118/1.4770279 [DOI] [PMC free article] [PubMed] [Google Scholar]
- Sechopoulos I., “A review of breast tomosynthesis. Part II. Image reconstruction, processing and analysis, and advanced applications,” Med. Phys. 40(1), 014302 (17pp.) (2013). 10.1118/1.4770281 [DOI] [PMC free article] [PubMed] [Google Scholar]
- Houssami N. and Skaane P., “Overview of the evidence on digital breast tomosynthesis in breast cancer detection,” The Breast 22(2), 101–108 (2013). 10.1016/j.breast.2013.01.017 [DOI] [PubMed] [Google Scholar]
- Lei J., Yang P., Zhang L., Wang Y., and Yang K., “Diagnostic accuracy of digital breast tomosynthesis versus digital mammography for benign and malignant lesions in breasts: A meta-analysis,” Eur. Radiol. 24(3), 595–602 (2014). 10.1007/s00330-013-3012-x [DOI] [PubMed] [Google Scholar]
- Andersson I., Ikeda D. M., Zackrisson S., Ruschin M., Svahn T., Timberg P., and Tingberg A., “Breast tomosynthesis and digital mammography: A comparison of breast cancer visibility and BIRADS classification in a population of cancers with subtle mammographic findings,” Eur. Radiol. 18(12), 2817–2825 (2008). 10.1007/s00330-008-1076-9 [DOI] [PubMed] [Google Scholar]
- Gur D., Abrams G. S., Chough D. M., Ganott M. A., Hakim C. M., Perrin R. L., Rathfon G. Y., Sumkin J. H., Zuley M. L., and Bandos A. I., “Digital breast tomosynthesis: Observer performance study,” Am. J. Roentgenol. 193(2), 586–591 (2009). 10.2214/AJR.08.2031 [DOI] [PubMed] [Google Scholar]
- Noroozian M., Hadjiiski L., Rahnama-Moghadam S., Klein K. A., Jeffries D. O., Pinsky R. W., Chan H.-P., Carson P. L., Helvie M. A., and Roubidoux M. A., “Digital breast tomosynthesis is comparable to mammographic spot views for mass characterization,” Radiology 262(1), 61–68 (2012). 10.1148/radiol.11101763 [DOI] [PMC free article] [PubMed] [Google Scholar]
- Wu T., Stewart A., Stanton M., McCauley T., Phillips W., Kopans D. B., Moore R. H., Eberhard J. W., Opsahl-Ong B., Niklason L., and Williams M. B., “Tomographic mammography using a limited number of low-dose cone-beam projection images,” Med. Phys. 30, 365–380 (2003). 10.1118/1.1543934 [DOI] [PubMed] [Google Scholar]
- Claus B. E. H. and Eberhard J. W., “Generalized filtered back-projection reconstruction in digital tomosynthesis,” U.S. patent 6,707,878[P] (16 March 2004).
- Wu T., Moore R. H., and Kopans D. B., “Voting strategy for artifact reduction in digital breast tomosynthesis,” Med. Phys. 33, 2461–2471 (2006). 10.1118/1.2207127 [DOI] [PubMed] [Google Scholar]
- Hu Y. H., Zhao W., Mertelmeier T., and Ludwig J., “Image artifact in digital breast tomosynthesis and its dependence on system and reconstruction parameters,” Digital Mammography (Springer, Berlin, 2008), pp. 628–634. [Google Scholar]
- Hu Y. H., Zhao B., and Zhao W., “Image artifacts in digital breast tomosynthesis: Investigation of the effects of system geometry and reconstruction parameters using a linear system approach,” Med. Phys. 35, 5242–5252 (2008). 10.1118/1.2996110 [DOI] [PMC free article] [PubMed] [Google Scholar]
- Kelly K. M., Dean J., Comulada W. S., and Lee S. J., “Breast cancer detection using automated whole breast ultrasound and mammography in radiographically dense breasts,” Eur. Radiol. 20(3), 734–742 (2010). 10.1007/s00330-009-1588-y [DOI] [PMC free article] [PubMed] [Google Scholar]
- Kelly K. M., Dean J., Lee S. J., and Comulada W. S., “Breast cancer detection: Radiologists’ performance using mammography with and without automated whole-breast ultrasound,” Eur. Radiol. 20(11), 2557–2564 (2010). 10.1007/s00330-010-1844-1 [DOI] [PMC free article] [PubMed] [Google Scholar]
- Kelly K. M. and Richwald G. A., “Automated whole-breast ultrasound: Advancing the performance of breast cancer screening,” Semin. Ultrasound CT MRI 32(4), 273–280 (2011). 10.1053/j.sult.2011.02.004 [DOI] [PubMed] [Google Scholar]
- Sinha S., Hooi F. M., Pinsky R., Kripfgans O., and Carson P., “Image processing and registration of opposed view 3d breast ultrasound,” Breast Imaging (Springer, Berlin, 2012), pp. 666–672. [Google Scholar]
- Goodsitt M. M., Chan H. P., Hadjiiski L., LeCarpentier G. L., and Carson P. L., “Automated registration of volumes of interest for a combined x-ray tomosynthesis and ultrasound breast imaging system,” Digital Mammography (Springer, Berlin, 2008), Vol. 5116, pp. 463–468. [Google Scholar]
- Conway W. F., Hayes C. W., and Brewer W. H., “Occult breast masses: Use of a mammographic localizing grid for US evaluation,” Radiology 181(1), 143–146 (1991). [DOI] [PubMed] [Google Scholar]
- Padilla F., Roubidoux M. A., Paramagul C., Sinha S. P., Goodsitt M. M., Le Carpentier G. L., Chan H. P., Hadjiiski L. M., Fowlkes J. B., Joe A. D., Klein K. A., Nees A. V., Noroozian M., Patterson S. K., Pinsky R. W., Hooi F. M., and Carson P. L., “Breast mass characterization using 3-dimensional automated ultrasound as an adjunct to digital breast tomosynthesis: A pilot study,” J. Ultrasound Med. 32(1), 93–104 (2013). [DOI] [PMC free article] [PubMed] [Google Scholar]
- Kak A. C. and Slaney M., “Principles of computerized tomographic imaging,” Society for Industrial and Applied Mathematics, pp. 275–296 (2001). 10.1137/1.9780898719277 [DOI] [Google Scholar]
- Li L., Xing Y., Chen Z., Zhang L., and Kang K., “A curve-filtered FDK (C-FDK) reconstruction algorithm for circular cone-beam CT,” J. X-Ray Sci. Technol. 19(3), 355–371 (2011). 10.3233/XST-2011-0299 [DOI] [PubMed] [Google Scholar]
- Schindera S. T., Diedrichsen L., Müller H. C., Rusch O., Marin D., Schmidt B., Raupach R., Vock P., and Szucs-Farkas Z., “Iterative reconstruction algorithm for abdominal multidetector CT at different tube voltages: Assessment of diagnostic accuracy, image quality, and radiation dose in a phantom study,” Radiology 260(2), 454–462 (2011). 10.1148/radiol.11102217 [DOI] [PubMed] [Google Scholar]
- Zhou Y., Thibault J. B., Bouman C. A., Sauer K. D., and Jiang H., “Fast model-based x-ray CT reconstruction using spatially nonhomogeneous ICD optimization,” IEEE Trans. Image Process 20(1), 161–175 (2011). 10.1109/TIP.2010.2058811 [DOI] [PubMed] [Google Scholar]
- Lo S. C. B. and Freedman M. T., “Image reconstruction of arc cone-beam CT with reprojection: A preliminary study,” Proc. SPIE 8668, 866831-1–866831-8 (2013). 10.1117/12.2008156 [DOI] [Google Scholar]
- Tian Z., Jia X., Yuan K., Pan T., and Jiang S. B., “Low-dose CT reconstruction via edge-preserving total variation regularization,” Phys. Med. Biol. 56(18), 5949–5967 (2011). 10.1088/0031-9155/56/18/011 [DOI] [PMC free article] [PubMed] [Google Scholar]
- Korna A., Fenchela M., Bendera B., Danza S., Hausera T. K., Ketelsenb D.,Flohrc T., Claussenb C. D., Heuschmidb M., Ernemanna U., and Brodoefelb H., “Iterative reconstruction in head CT: Image quality of routine and low-dose protocols in comparison with standard filtered back-projection,” Am. J. Neuroradiol. 33(2), 218–224 (2012). 10.3174/ajnr.A2749 [DOI] [PMC free article] [PubMed] [Google Scholar]
- Andersen A. H., “Algebraic reconstruction in CT from limited views,” IEEE Trans. Med. Imaging 8(1), 50–55 (1989). 10.1109/42.20361 [DOI] [PubMed] [Google Scholar]
- Wan X., Zhang F., Chu Q., Sun F., Yuan B., and Liu Z., “Three-dimensional reconstruction using an adaptive simultaneous algebraic reconstruction technique in electron tomography,” J. Struct. Biol. 175(3), 277–287 (2011). 10.1016/j.jsb.2011.06.002 [DOI] [PubMed] [Google Scholar]
- Pengpan T., Qiu W., Smith N. D., and Soleimani M., “Cone beam CT using motion-compensated algebraic reconstruction methods with limited data,” Comput. Method Program Biomed. 105(3), 246–256 (2012). 10.1016/j.cmpb.2011.09.007 [DOI] [PubMed] [Google Scholar]
- Andersen A. H. and Kak A. C., “Simultaneous algebraic reconstruction technique (SART): A superior implementation of the ART algorithm,” Ultras. Imaging 6(1), 81–94 (1984). 10.1177/016173468400600107 [DOI] [PubMed] [Google Scholar]
- Pang W. M., Qin J., Lu Y., Xie Y., Chui C. K., and Heng P. A., “Accelerating simultaneous algebraic reconstruction technique with motion compensation using CUDA-enabled GPU,” Int. J. Comput. Assist. Radiol. Surg. 6(2), 187–199 (2011). 10.1007/s11548-010-0499-3 [DOI] [PubMed] [Google Scholar]
- Jiang M. and Wang G., “Convergence of the simultaneous algebraic reconstruction technique (SART),” IEEE Trans. Image Process. 12(8), 957–961 (2003). 10.1109/TIP.2003.815295 [DOI] [PubMed] [Google Scholar]
- Jiang M. and Wang G., “Development of iterative algorithms for image reconstruction,” J. X-Ray Sci. Technol. 10(1), 77–86 (2001). [Google Scholar]
- Yuan Y., “Step-sizes for the gradient method” Ams/Ip Stud. Adv. Math. 42(2), 785–796 (2008). [Google Scholar]
- Sinha S., Hooi F. M., Syed Z., and Pinsky R., “Machine learning for noise removal on breast ultrasound images,” in Proceedings of the IEEE Ultrasonics Symposium (2010 IEEE, San Diego, CA, 2010), pp. 2020–2023.
- Sinha S., “Breast Cancer Detection on Automated 3D Ultrasound with Co-localized 3D X-ray,” (Doctoral dissertation, The University of Michigan, 2010). [Google Scholar]
- Madsen E. L., Zagzebski J. A., and Frank G. R., “An anthropomorphic ultrasound breast phantom containing intermediate-sized scatterers,” Ultrasound Med. Biol. 8(4), 381–392 (1982). 10.1016/S0301-5629(82)80006-9 [DOI] [PubMed] [Google Scholar]
- Carson P. L., Fouzaan Z., Verweij S. A. M., and Lee W. M., “Dual sided automated ultrasound system in the mammographic geometry,” IEEE Int. Ultrason. Symp. 1948(5719), 2134–2137 (2011). 10.1109/ULTSYM.2011.0529 [DOI] [Google Scholar]
- Neemuchwala H., Hero A., Zabuawala S., Zabuawala S., and Carson P., “Image registration methods in high-dimensional space,” Int. J. Imaging Syst. Technol. 16(5), 130–145 (2006). 10.1002/ima.20079 [DOI] [Google Scholar]
- Narayanasamy G., LeCarpentier G. L., Roubidoux M., Fowlkes J. B., Schott A. F., and Carson P. L., “Spatial registration of temporally separated whole breast 3D ultrasound images,” Med. Phys. 36(9), 4288–4300 (2009). 10.1118/1.3193678 [DOI] [PMC free article] [PubMed] [Google Scholar]
- Wu T., Moore R. H., Rafferty E. A., and Kopans D. B., “A comparison of reconstruction algorithms for breast tomosynthesis,” Med. Phys. 31, 2636–2647 (2004). 10.1118/1.1786692 [DOI] [PubMed] [Google Scholar]
- Zhang Y., Chan H. P., Sahiner B., Wei J., Goodsitt M. M., Hadjiiski L. M., Ge J., and Zhou C., “A comparative study of limited-angle cone-beam reconstruction methods for breast tomosynthesis,” Med. Phys. 33, 3781–3795 (2006). 10.1118/1.2237543 [DOI] [PMC free article] [PubMed] [Google Scholar]
- Zhou J., Zhao B., and Zhao W., “A computer simulation platform for the optimization of a breast tomosynthesis system,” Med. Phys. 34, 1098–1109 (2007). 10.1118/1.2558160 [DOI] [PubMed] [Google Scholar]


