

Abstract
Our current understanding of how DNA is packed in the nucleus is most accurate at the fine scale of individual nucleosomes and at the large scale of chromosome territories. However, accurate modeling of DNA architecture at the intermediate scale of ∼50 kb–10 Mb is crucial for identifying functional interactions among regulatory elements and their target promoters. We describe a method, Fit-Hi-C, that assigns statistical confidence estimates to mid-range intra-chromosomal contacts by jointly modeling the random polymer looping effect and previously observed technical biases in Hi-C data sets. We demonstrate that our proposed approach computes accurate empirical null models of contact probability without any distribution assumption, corrects for binning artifacts, and provides improved statistical power relative to a previously described method. High-confidence contacts identified by Fit-Hi-C preferentially link expressed gene promoters to active enhancers identified by chromatin signatures in human embryonic stem cells (ESCs), capture 77% of RNA polymerase II-mediated enhancer-promoter interactions identified using ChIA-PET in mouse ESCs, and confirm previously validated, cell line-specific interactions in mouse cortex cells. We observe that insulators and heterochromatin regions are hubs for high-confidence contacts, while promoters and strong enhancers are involved in fewer contacts. We also observe that binding peaks of master pluripotency factors such as NANOG and POU5F1 are highly enriched in high-confidence contacts for human ESCs. Furthermore, we show that pairs of loci linked by high-confidence contacts exhibit similar replication timing in human and mouse ESCs and preferentially lie within the boundaries of topological domains for human and mouse cell lines.
Recently, several chromatin conformation capture (3C)-based methods have been used to characterize, on a genome-wide scale, the chromatin architectures of many genomes and cell types at different resolutions (Fullwood et al. 2009; Lieberman-Aiden et al. 2009; Duan et al. 2010; Tanizawa et al. 2010; Dixon et al. 2012; Sexton et al. 2012; Lemieux et al. 2013; Zhang et al. 2013). Driving much of this research is the underlying hypothesis that the three-dimensional form of the genome in vivo is tightly related to genome function; hence, a better understanding of chromatin architecture is likely to provide insights into how the genome contributes to biological fitness.
A 3C-based genome architecture assay such as Hi-C (Lieberman-Aiden et al. 2009) produces as output a list of paired sequence tags that indicate contact between two genomic regions when the two tags map uniquely to nonadjacent locations along the genome. Because these assays operate on a population of cells, observing one such sequence tag implies that, in one cell in the sample, the corresponding pair of DNA regions was in close physical proximity. The natural resolution of Hi-C data is in terms of restriction enzyme (RE) fragments, which are the genomic units resulting from DNA digestion with restriction enzymes. However, depending on the sequencing depth and the size of the genome of interest, Hi-C data may be processed either using fixed-size genomic bins or by combining multiple consecutive restriction fragments (metafragments). Here we use “locus” to refer to the unit of resolution. We refer to the number of contacts between a pair of loci as a “contact count” and the matrix of contact counts among all locus pairs in the genome as a “contact map.”
In this work, we focus on statistically characterizing a particular aspect of chromatin architecture: intra-chromosomal contacts between locus pairs separated by 10–250 kb for yeast and 50 kb–10 Mb for complex eukaryotes (“mid-range” contacts). Although a 3C-based genome architecture assay such as Hi-C (Lieberman-Aiden et al. 2009) generates contact counts between all pairs of loci, assigning statistical confidence estimates to mid-range contacts is particularly challenging because a large portion of such contacts occur due to random looping of the DNA (Lieberman-Aiden et al. 2009), rather than due to formation of specific chromatin loops. On the other hand, many biologically important interactions, such as contacts between enhancers and promoters or between multiple promoters, occur in this distance range (Li et al. 2012; Sanyal et al. 2012; Zhang et al. 2013). Improving our ability to discriminate between functional mid-range contacts and contacts that occur due to random polymer looping has the potential to yield significant improvements in our understanding of genome function.
Previous chromatin architecture studies have handled mid-range contacts in several different ways. Because Lieberman-Aiden et al. (2009) analyzed the relatively large human genome with low sequencing depth, their assay provided data at 1-Mb resolution. Consequently, they simply discarded all proximal and a large portion of mid-range contacts, focusing instead on distal and inter-chromosomal contacts. Tanizawa et al. (2010) analyzed mid-range contacts in fission yeast by first normalizing the observed contact counts with respect to an experimental control and then correcting for random polymer looping using a double-exponential curve fitting procedure. Sexton et al. (2012) proposed a hierarchical domain model for the Drosophila genome that infers an expected chromosomal contact matrix at 10-kb resolution for each chromosome. This matrix was then used to normalize the observed contact counts to provide a relative enrichment score for intra-chromosomal locus pairs. However, in both of these studies, the resulting values were not subject to any statistical confidence estimation procedure. Finally, Duan et al. (2010) used a simple statistical model to assign statistical confidence to a contact between two loci based on their observed contact count relative to a null model in which every pairwise contact is assumed to be equally likely. To account for random polymer looping, intra-chromosomal locus pairs were grouped into bins corresponding to genomic distances of 20–25 kb, 25–30 kb, etc., and all pairs within a given bin were treated as equally likely to produce a single contact (Methods).
All the studies mentioned above pointed out the importance of controlling for the random polymer looping effect. More recent studies have pointed out another important factor, namely, that experimentally derived contact maps exhibit multiple sources of experimental and technical bias (Yaffe and Tanay 2011; Cournac et al. 2012; Hu et al. 2012; Imakaev et al. 2012). These biases relate to genomic characteristics such as GC content and mappability, as well as technical aspects of the assays such as cross-linking preference, fragment length, and circularization length. Each study proposes a normalization protocol to reduce or eliminate these biases. Yaffe and Tanay (2011) propose a method that estimates a probabilistic background model representing GC content, fragment length, and mappability biases and calculates the corrected contact map for each experiment. This method only corrects for biases that are known a priori, such as GC content. More recently, Imakaev et al. (2012) developed an iterative correction method that does not require a priori knowledge and is based on the assumption that all loci should have an equal number of total contacts. The corrected contact maps reported by these two different methods are highly consistent with each other, and both methods yield improved reproducibility across replicate experiments.
In this work, we describe a method, Fit-Hi-C (Fig. 1), for assessing the statistical significance of mid-range chromosomal contacts with respect to a background that jointly models the random polymer looping effect and previously observed biases in Hi-C data sets. We use contact maps from three different organisms (Supplemental Table 1) processed at a resolution of single RE fragments for yeast and metafragments (either 10 or 50 consecutive RE fragments) for mouse and human. We use the ICE normalization procedure (Imakaev et al. 2012) to compute biases for each locus from these contact maps. This normalization is applicable to data from a Hi-C assay as well as from variations of Hi-C that provide genome-wide contact maps, such as the budding yeast data set of Duan et al. (2010). We then use these biases together with genomic distance to calculate a contact probability between each pair of loci (Methods). We demonstrate that Fit-Hi-C removes artifacts and yields improved statistical power relative to a previously described approach (Duan et al. 2010). We confirm, across a variety of data sets, that the set of novel contacts deemed significant by Fit-Hi-C are both spatially consistent with and complementary to contacts identified using the previous method. Furthermore, we show that, compared to the method used in Duan et al. (2010), Fit-Hi-C captures a larger percentage of RNAPII-mediated chromatin interactions identified by ChIA-PET in mouse ESCs using either a false discovery rate (FDR) or rank-based threshold. Applying Fit-Hi-C to Hi-C data from several mouse and human cell lines, we observe that high-confidence contacts preferentially link expressed gene promoters to active enhancers identified by chromatin signatures in human embryonic stem cells (ESCs) (Rada-Iglesias et al. 2011); capture 77% of enhancer-promoter interactions identified using ChIA-PET in mouse ESCs (Zhang et al. 2013); and confirm previously validated, cell line-specific interactions in mouse cortex (Shen et al. 2012). We also demonstrate that regions containing binding peaks of pluripotency factors such as NANOG and POU5F1, as well as regions annotated as insulators or heterochromatin, are hubs for high-confidence contacts in human ESCs, whereas RNAPII binding sites, transcription start sites, promoters, and strong enhancers are involved in fewer high-confidence contacts. Our results provide further support for the existence of recently described topological domains at the submegabase scale (Dixon et al. 2012) and provide evidence that traces of these domains are visible even in lower resolution Hi-C data (Lieberman-Aiden et al. 2009). Finally, we show that genomic regions exhibiting similar replication timing profiles tend to be in contact with one another, suggesting 3D colocalization of synchronously replicating loci that are not necessarily proximal in 1D, in agreement with previous observations (Ryba et al. 2010).
Figure 1.
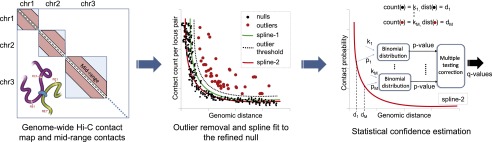
Assigning statistical confidence estimates to mid-range contacts using Fit-Hi-C. Cross-linking and digestion from a Hi-C assay produces a genome-wide contact map. We extract intra-chromosomal contacts in the range of (10 kb, 250 kb] for the yeast genome and (50 kb, 10 Mb] for the human and mouse genomes. We fit an initial spline (spline-1) using the observed contact counts and genomic distances between all possible mid-range locus pairs. The general shape of the spline is assumed to be due to random polymer looping and is the basis for the initial null model. This initial spline determines a threshold (dashed line) to identify outliers (red dots) which are excluded from the calculation of a refined null represented by a second spline (spline-2). For each mid-range locus pair, we estimate the prior contact probability from spline-2 using the exact genomic distance between the loci in the pair. We calculate P-values for all contacts, including null and outlier pairs, by using a binomial distribution and apply multiple hypothesis testing correction to compute a Q-value for each P-value.
Results
Decay in contact probability with increasing genomic distance between two loci on the same chromosome is a hallmark of all published Hi-C data sets. However, no single function can capture the relationship between contact probability and genomic distance because different organisms or different parameter settings for the same organism yield different scaling curves. For instance, data from Lieberman-Aiden et al. (2009) suggests that a power law function with an exponent of −1 captures this scaling for human cell lines, whereas the work of Duan et al. (2010) suggests an exponent of −1.5 for yeast. Furthermore, the genomic distance range of interest, the resolution at which data is analyzed, and the sequencing depth all impact the relationship between contact probability and genomic distance (Fig. 2). Therefore, a method to assign confidence estimates for intra-chromosomal contacts from any organism, at any given resolution and desired genomic distance range, must be able to capture these differences in scaling of contact probability.
Figure 2.

Differences in scaling of contact probability when sequencing depth, resolution, or the distance range of interest changes. We plot the relationship between contact probability and genomic distance by binning the total number of mid-range read pairs into 200 equal occupancy bins. We compute the mean genomic distance and mean contact probability among all locus pairs for each bin and calculate the best power-law (i.e., log-linear) fit to these observations (dashed line) for the genomic distance range spanned by the x-axis. We plot these for the K562 library from Lieberman-Aiden et al. (2009) at a resolution of 50 RE fragments (A), for the hIMR90 library from Dixon et al. (2012) at a resolution of 50 RE fragments for genomic distances up to 10 Mb (B), 50 RE fragments for genomic distances up to 5 Mb (C), and 10 RE fragments (D).
Fit-Hi-C eliminates binning bias
We use as a starting point the method of Duan et al. (2010), which assigns confidence estimates to mid-range contacts by segregating locus pairs into discrete genomic distance bins (e.g., 20–25 kb, 25–30 kb, etc.) and computing a contact probability for each bin separately to control for the random polymer looping effect. This method leads to bias in confidence estimation due to sharp transitions in contact probability from one bin to the next. Our method, Fit-Hi-C, replaces the discrete bins with a monotonic spline fitting procedure that assigns confidence estimates (P-values) to contact counts for two loci while conditioning on the exact genomic distance between them (Methods), thereby eliminating the artifactual stair-step pattern produced by the binning approach (Fig. 3A). In the figure, at distances for which the horizontal binning line is above the spline fit, the binning approach's contact probability estimates are too conservative and vice versa. Accordingly, as shown in Figure 3B and quantified by Fisher's exact test, these biases in contact probabilities are reflected in the corresponding confidence estimates, yielding overestimation of significance for the locus pairs that fall to the left side of each bin and vice versa (dark blue). Our spline fitting corrects this skew, yielding an unbiased (dark green) distribution. This correction can be seen when we plot the distributions of contacts that are only deemed significant by one method and not by the other (only by binning in light blue, only by spline-1 in light green). Similar results were obtained for nine genome architecture data sets from three different organisms (Supplemental Fig. 1). Our further analysis of the method-specific contact sets for each of the four cell lines of Dixon et al. (2012) demonstrates that the contacts identified by only spline-1 are more complementary (i.e., these contacts increase the transitivity of the contact graph, as described in Supplemental Note 1) to the set of contacts common to both methods compared to contacts identified only by binning (Supplemental Table 2).
Figure 3.
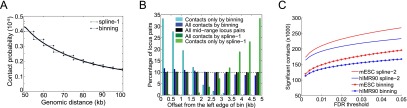
Fit-Hi-C eliminates edge effects caused by discrete binning and boosts statistical power for confidence estimation. (A) Comparison of fits resulting from our method to the discrete binning method which uses 5-kb genomic distance bins for a S. cerevisiae HindIII library from Duan et al. (2010). Only the genomic distance range of 50–100 kb is shown for visualization purposes. (B) Histograms of genomic distance offsets (Methods) for contacts identified at FDR 1% from ICE-corrected contact maps by different methods (dark blue, dark green) and for all possible mid-range locus pairs (black) for the library described in A. Histograms for each series sums up to 100%. For each locus pair, the offset is calculated with respect to the left edge of the enclosing 5-kb bin. Because we divide each 5-kb bin into 10 equally sized windows, we expect a contact set with no binning bias to have 10% (dashed line) of its members in each of these 10 windows, similar to the set of all mid-range locus pairs (black). We quantify the bias by testing the null hypothesis that the proportion of significant contacts on each side of the bin identified by a specific method is equal to this proportion for all mid-range locus pairs (black). Fisher's exact test P-values for this null hypothesis are 8.3 × 10−44 and 0.34 for all contacts identified by binning (dark blue) and by spline-1 (dark green), respectively. (C) Comparison of the number of contacts deemed significant by the refined null-based spline fit (spline-2) and discrete binning methods at varying FDR thresholds for hIMR90 and mESC libraries from Dixon et al. (2012).
Fit-Hi-C boosts statistical power
To boost the statistical power of the spline fitting method, we remove “positive” outliers, corresponding to bona fide (nonrandom) contacts, and then re-fit the spline to the remainder (Fig. 1; Supplemental Fig. 2). This modification, motivated by previous work on microarrays, drug mutation, and sequence data sets (Efron et al. 2001; Bailey and Gribskov 2002), yields a more accurate empirical null model. In general, such refinement has to be done carefully in order to avoid removing actual null observations from the refined null. To avoid this problem, we calculate initial significance estimates by using a conservative model, i.e., the nonrefined null represented by spline-1, and we choose a stringent threshold that accepts approximately one null contact as an outlier and removes it from the null model during the refinement (Methods).
Application of the refined method to data sets from different organisms and cell lines demonstrates that, at varying FDR thresholds, the refined null identifies more significant contacts compared to the binning approach (Fig. 3C), yielding a 6%–46% increase in the number of contacts at 1% FDR, depending on the data set (Supplemental Table 3). The degree of improvement depends mainly on the sequencing depth and not on the size of the genome. Analysis of control data sets from Duan et al. (2010) indicates that our null model successfully avoids introducing false positives (Supplemental Table 3). Furthermore, the new contacts identified by the refined null (spline-2), which we simply refer to as Fit-Hi-C from here on, at a fixed FDR threshold are spatially consistent with contacts identified by the more conservative spline-1 (Supplemental Note 1; Supplemental Fig. 3).
High-confidence Hi-C contacts capture interactions identified by ChIA-PET in mouse embryonic stem cells
Several lines of evidence suggest that the 3D proximity of enhancers to target promoters plays a role in gene expression (Tolhuis et al. 2002; Ferraiuolo et al. 2010; Shen et al. 2012). Development of techniques such as ChIA-PET (Fullwood et al. 2009) now allows genome-wide profiling of a subset of these contacts that are mediated by a protein of interest. A recent application of ChIA-PET generated a catalog of RNA polymerase II (RNAPII)-mediated contacts, approximately half of which are believed to be enhancer-promoter pairs, for mouse cells during lineage commitment, including mouse ESCs (Zhang et al. 2013). Here we use this catalog as a validation set, testing whether Fit-Hi-C can capture these RNAPII-mediated contacts when applied to Hi-C data of mouse ESCs from Dixon et al. (2012). We also compare the results from Fit-Hi-C to those produced using discrete binning.
Fit-Hi-C captures 77% of enhancer-promoter contacts and 73% of all contacts reported by ChIA-PET at 5% FDR (Fig. 4A). This result suggests that our confidence estimation can accurately identify contacts mediated by a specific protein among the very large set of chromatin contacts between any two loci as assayed by Hi-C. Also, to the best of our knowledge, this analysis is the first systematic comparison between Hi-C and ChIA-PET data showing that the two assays produce highly consistent results.
Figure 4.
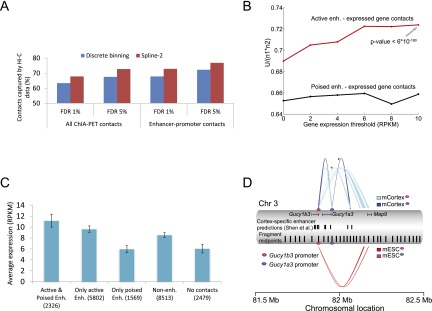
Fit-Hi-C identifies high-confidence contacts between previously predicted/validated enhancer-promoter pairs. (A) Percentage of RNAPII-mediated chromatin interactions identified by Zhang et al. (2013) in mouse ESCs that are captured either using our method (spline-2) or the discrete binning approach of Duan et al. (2010) from mESC Hi-C data at different FDR thresholds. A total of 1007 enhancer-promoter contacts and 2494 contacts between any two RNAPII binding peaks are extracted from Zhang et al. (2013) by limiting our analysis to mid-range contacts in the genomic distance interval of (50 kb, 5 Mb]. (B) Normalized Mann-Whitney U statistics for predicted locus pairs sorted by statistical significance, where “positive” pairs link an active enhancer (red line) or a poised enhancer (black line) to a gene expressed at least at the level given on the x-axis. The P-value of the Mann-Whitney test is shown for rejecting the null hypothesis that highly expressed genes (RPKM > 10) are not linked to active enhancers by Fit-Hi-C with Q-values lower than chance. (C) Average expression values and their standard errors for five nonoverlapping gene groups for the hESC cell line. The first three groups are defined according to the presence of contacts at FDR 1% from gene promoters to either or both active and poised enhancers. The remaining genes (i.e., genes with no contacts at FDR 1% to any annotated enhancer) are further segregated into two groups depending on whether their promoters have at least one contact at FDR 10% to some loci (“Non-enh”) or no contacts to any loci even at FDR 10% (“No contacts”). The first two groups of genes with at least one contact with an active enhancer show similar expression profiles regardless of the presence/absence of a contact with a poised enhancer (P-value of 0.92, two-sample Kolmogorov-Smirnov test). Genes that have a contact with an active enhancer show significantly higher expression compared to genes in all three groups that lack such contacts (P-values of 4 × 10⁻¹⁰, 0.0014, and 1.5 × 10−45 for “Only poised enh,” “Non-enh,” and “No contacts,” respectively). (D) Contact profiles at FDR 0.1% for promoter regions of two genes (Gucy1b3 and Gucy1a3) that show differential expression between two mouse cell lines (mESC and mCortex). Each connector represents a significant contact with thickness proportional to the minus log(P-value) of the contact. The connector colors indicated in square boxes are determined jointly by the cell line (mESC or mCortex) and by the gene promoter of interest (magenta oval for Gucy1b3, blue oval for Gucy1a3). No pink connectors are drawn from the promoter of Gucy1a3 due to the lack of significant contacts involving this promoter in mESCs. Cortex-specific enhancer elements predicted by Shen et al. (2012) and midpoints of each of the 10 consecutive restriction fragments are shown as two separate tracks. Contact confidences are assigned by Fit-Hi-C using ICE-corrected contact maps. A similar figure is also generated using raw contact maps (Supplemental Fig. 6).
Another important observation from Figure 4A is that Fit-Hi-C captures a larger percentage of all ChIA-PET contacts and enhancer-promoter pairs compared to discrete binning. However, it would be misleading to conclude superiority of our method solely based on this observation, because we report more contacts at a given FDR due to improved statistical power. To perform a fair comparison of the two methods, we rank contacts by the P-value assigned by each method, and we ask how many contacts between enhancer-promoter pairs or any locus pair from the ChIA-PET catalog are among the k most significant contacts. Our results show that Fit-Hi-C consistently captures more ChIA-PET contacts of both types for different values of k (Supplemental Fig. 4), suggesting that Fit-Hi-C produces a more accurate ranking compared to the discrete binning approach.
High-confidence Hi-C contacts link active enhancers in human embryonic stem cells to highly expressed genes
Chromatin signatures such as histone modifications and nucleosome density can also be predictive of enhancer-promoter interactions. In work by Rada-Iglesias et al. (2011), enhancer elements were predicted using these chromatin signatures for human ESCs. Using these predictions and Hi-C data for human ESCs, we examine whether pairs of loci that are assigned high significance (i.e., small Q-values) by our method are enriched for pairs of predicted enhancers and gene promoters. In other words, in the list of locus pairs sorted by increasing Q-value, we test whether “positive” pairs (i.e., pairs that link an active enhancer with an expressed gene) are ranked above “negative” pairs (i.e., pairs that do not involve any promoter or enhancer region) (see Methods for details). We perform a Mann–Whitney U-test and report the normalized U statistic, which ranges between 0 and 1. A large value of the U statistic implies that positive pairs tend to have higher significance than negative pairs (Methods). Figure 4B shows that promoters of highly expressed genes colocalize significantly with enhancers that are annotated as active in human stem cells (Mann-Whitney U-test P-value of 6−190 for RPKM > 10) and that these active enhancers engage in stronger contacts compared to enhancers that are poised before cellular differentiation. These results suggest that specific chromatin loops beyond 50 kb are tightly linked to functional interactions and agree with recently published 5C data for three ENCODE cell lines suggesting chromatin interactions are prevalent at distances around 120 kb upstream of transcription start sites (Sanyal et al. 2012).
Furthermore, an analysis of the expression profiles of five groups of genes segregated according to their contact profiles (Fig. 4C) shows that genes whose promoters are predicted to contact at least one active enhancer at FDR < 1% (first two groups in Fig. 4C) exhibit higher expression compared to genes that do not (last three groups). Within the groups of genes that do not have high-confidence contacts to active enhancers, the group with contacts to some locus at a loose FDR threshold of 10% (“Non-enh”) have higher expression compared to genes with contacts to only poised enhancers (“Only poised-enh”) and genes that are isolated (“No contacts”). These results suggest that three-dimensional proximity to a distal region, and especially to an active enhancer, is an important determinant of gene expression. Also, these results are consistent with a model in which poised enhancers establish contacts with their target promoters before lineage commitment but do not enhance the expression until after differentiation.
Fit-Hi-C accurately identifies 3C-validated cell line-specific enhancer-promoter contacts
To further validate our findings, we focus on a list of locus pairs that were previously tested using 3C to identify contacts between predicted enhancer regions and promoters (Shen et al. 2012). For each of six locus pairs separated by >50 kb, we identify the corresponding pair of windows at a resolution of 10 RE fragments, one containing the predicted enhancer and the other containing the gene promoter, and we use the Q-value of the contact between this window pair as the measure of colocalization between the enhancer-promoter pair. For two pairs that were confirmed by 3C not to interact in both mouse embryonic stem cells (mESC) and cortex cells (mCortex), our Q-value estimates were larger than 0.1 for both cell lines. For the remaining four pairs, all of which are confirmed to interact in mCortex but not in mESC, our Q-value estimates using corrected contact maps were all less than 10−5 for cortex cells and were all larger than 0.1 for stem cells (10−11 vs. 0.3, 10−13 vs. 0.2, 10−6 vs. 1.0, 10−7 vs. 1.0). This demonstrates that Fit-Hi-C can precisely identify the cell line specificity of these interactions for a reasonable FDR threshold choice of 1% or 5% even at the resolution of large (∼40 kb) metafragments. Repeating the same analysis with raw contact maps results in Q-values that are at least 10 orders of magnitude smaller for mCortex compared to mESC, although two out of four of these contacts are still significant for mESC at an FDR of 1%. This difference between using raw and corrected contact maps points out the importance of coupling Fit-Hi-C with a Hi-C correction method to eliminate false positives due to loci with an overall high number of contacts (Supplemental Fig. 5).
Figure 4D illustrates two of these high-confidence contacts, involving two promoters on mouse chromosome 3. Both of the genes transcribed from these promoters (Gucy1a3, Gucy1b3), as well as a third gene that is 212 kb downstream from the Gucy1a3 promoter (Map9), exhibit cortex-specific expression (Shen et al. 2012). This cell line-specific expression is partially explained by 3C validation of two contacts from an enhancer region (anchoring point chr3:82,055,789–82,055,808) to Gucy1a3 and Gucy1b3 promoters (marked by asterisks) (Shen et al. 2012). Our confidence estimates confirm these two contacts and reveal additional cortex-specific contacts that suggest formation of a complex loop bringing the promoters of Gucy1b3 and Map9 in close proximity in mCortex but not in mESC (see Supplemental Fig. 6 for comparison of significant contacts when raw versus corrected contact maps are used). This promoter-promoter contact occurs beyond the boundaries of previously defined “enhancer-promoter units” (Shen et al. 2012). Another example (Supplemental Figs. 7, 8) suggests that cell line-specific expression of two inward rectifier potassium channel genes may be related to contacts that are mediated by distal CTCF binding sites beyond enhancer-promoter unit boundaries.
Insulators, heterochromatin, and binding peaks of pluripotency factors are hubs for high-confidence contacts in human embryonic stem cells
We observe that the number of high-confidence contacts in which a particular locus participates varies from one locus to the other. To characterize further the type of regions that participate in many versus few high-confidence contacts, we compare Hi-C contact maps to annotations from two semiautomated genome annotation methods, ChromHMM (Ernst and Kellis 2012) and Segway (Hoffman et al. 2013). These methods take as input a collection of chromatin accessibility, histone modification, and selected transcription factor (TF) binding assays and then use unsupervised learning to simultaneously partition the genome into segments and assign a semantic label to each segment. For human ESCs, we ask how many significant contacts at an FDR of 1% each annotated segment is involved in. Then, we compute the average number of significant contacts per locus among all occurrences of each annotation label genome-wide (Supplemental Fig. 9). Figure 5 plots these numbers for similar labels from each segmentation method and shows that regions of insulator binding and heterochromatin are enriched in the number of high-confidence contacts. On the other hand, regions annotated as transcription start sites, active promoters, or strong enhancers engage in less than half the number of high-confidence contacts compared to insulators, suggesting they are potentially more selective in picking contact partners that may impact gene regulation.
Figure 5.
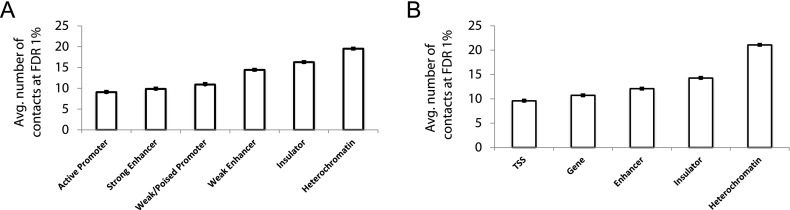
Insulators and heterochromatin regions participate in more high-confidence contacts than promoters and strong enhancers. Average number of high-confidence (FDR 1%) contacts and their standard errors identified by Fit-Hi-C for each annotation term from two different semiautomated genome annotation methods. Contact confidences are assigned at a resolution of 10 RE fragments for the Hi-C data from hESC cells (Dixon et al. 2012), using ICE-corrected contact maps and one-step refinement of the null model (spline-2). In order to map genome annotations to the windows used in the Fit-Hi-C analysis, each annotated region is assigned to the 10 RE fragment window with which it has the most overlap. (A) Six selected annotations from 15-label genomic segmentation of hESC using ChromHMM (Ernst and Kellis 2012). (B) Five selected annotations from 25-label genomic segmentation of hESC using Segway (Hoffman et al. 2012, 2013). See Supplemental Figure 9 for plots with complete lists of labels for both segmentation methods.
We carry out a similar analysis with TF binding data to examine the relationship between TF binding and the number of significant Hi-C contacts at a given locus. We observe that for human ESCs, the regions bound by NANOG and POU5F1 are hubs for high-confidence contacts (Supplemental Fig. 10A), consistent with these genes' roles as master regulators in undifferentiated ESCs regulating the maintenance of developmental potency (Niwa et al. 2000; Mitsui et al. 2003). Interestingly, the two other TFs with the highest contact counts, BCL11A and MAFK, are both developmental stage-specific regulators that either repress (Sankaran et al. 2008) or activate (Hwang et al. 2013) genes that are implicated in major malignancies. Confirming the results from the above analysis with annotations from segmentation methods, CTCF is among the TFs with the highest number of contacts, whereas RNAPII (POL2RA) is among the TFs with the lowest number of contacts. Similar analysis for human fibroblast (hIMR90) cell lines, for which binding information for only five TFs is available, suggests no significant differences in the number of high-confidence contacts for these TFs other than a slight depletion for RNAPII (Supplemental Fig. 10B). To further understand what types of CTCF binding sites are enriched in high-confidence contacts in human ESCs, we divide these sites into two groups using topological domain coordinates from Dixon et al. (2012): CTCFs within a topological domain and boundary CTCFs. The within-domain group contains ∼91% of all CTCF binding sites and has ∼16 high-confidence contacts per site on average, whereas the boundary group has only ∼11. Thus, it appears that CTCF-bound regions engage in a larger number of contacts, especially when these regions reside within domains which are shown to be enriched in high contact counts (Dixon et al. 2012).
High-confidence contacts reside in topological domains
We also tested whether our confidence estimates are consistent with recent models that suggest chromatin is organized into megabase-sized topological domains (Dixon et al. 2012; Nora et al. 2012). We first calculated the percentage of high-confidence mid-range contacts that link intra-domain loci rather than inter-domain loci using Hi-C data and domain calls for the mESC, mCortex, hESC, and hIMR90 cell lines (Dixon et al. 2012). To account for the enrichment that is due to genomic distance rather than three-dimensional distance, we designed a null model that preserves the scaling of contact probability with genomic distance (Methods). Figure 6A, plotting the ratio R of intra- to inter-domain contacts as a function of FDR threshold, shows that the more significant a contact is, the more it tends to lie within domain boundaries for all four cell lines and that a great proportion of this enrichment is due to nonrandom chromatin organization. The ratio R is as high as four to seven times larger for real libraries compared to the null model at very stringent FDR thresholds and is at least three times larger for all FDR up to 1%.
Figure 6.
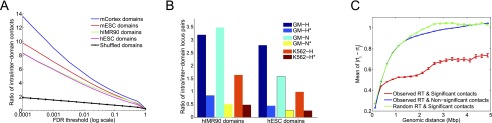
Locus pairs with high-confidence contacts lie within the same topological domain and have similar replication times. (A) Ratio of the number of significant contacts within topological domain boundaries (intra-domain) to the number of contacts across domain boundaries (inter-domain) at varying FDR thresholds for four different cell lines from Dixon et al. (2012). The black line represents the average of this ratio for the shuffled domains (null model) over all four cell lines. (B) Ratio defined in A for Hi-C data from Lieberman-Aiden et al. (2009) for which no topological domains were defined. We use domain annotations for two human cell lines from Dixon et al. (2012) to compute this ratio for three libraries of Lieberman-Aiden et al. (2009) on two different cell lines at FDR 0.1%. Each legend labeled with a star represents the ratio for the null model (shuffled domains) corresponding to that library. (C) Mean and standard errors of the absolute difference between replication timing values for pairs of loci (rti, rtj) that have a contact at FDR 1% for hESC (Hiratani et al. 2008). We plot the means and standard errors for the distributions of replication timing differences for each 250-kb genomic distance bin up to 5 Mb, for the significant contacts using observed and randomized replication timing (RT) measurements as well as for nonsignificant contacts (FDR >1%) using observed measurements.
More strikingly, despite having ∼40× fewer mid-range reads per cell line compared to the Dixon et al. (2012) data sets, we observe an enrichment in intra-domain contacts for previously published Hi-C data sets (Lieberman-Aiden et al. 2009) using the domain calls from Dixon et al. Figure 6B plots the contact ratio R at an FDR of 0.1% from three Hi-C data sets on two human cell lines (GM06990, a normal lymphoblastoid cell line, and K562, an erythroleukemia cell line with an aberrant karyotype) using domain coordinates from hESC and hIMR90 cell lines. These results suggest a considerable degree of conservation of domain structure across different cell lines, consistent with the findings of Dixon et al. and argue that our confidence estimates help reveal this conservation even with limited-coverage Hi-C data.
Synchronously replicating regions are linked by high-confidence chromatin contacts
We also investigate the link between chromatin architecture and another genomic feature that has been shown to exhibit domain structure, namely, replication timing. Previously, Ryba et al. (2010) observed a striking correlation between replication domains and chromatin compartments, suggesting the nonrandom colocalization of synchronously replicating loci at a large scale. Here we analyze this correlation at a finer scale by leveraging both data types at their intrinsic resolution without depending on compartment or domain calls. Specifically, we test whether pairs of loci with high-confidence contacts tend to exhibit more similar replication timing compared to pairs without high-confidence contacts. We also compare the resulting timing differences to those from differences generated by a null model that circularly shuffles replication timing measurements while preserving the positions of significant contacts to measure the extent to which the observed replication timing similarities are due to autocorrelation of the replication timing measurements along the genome (Methods). For both hESC (Fig. 6C; Supplemental Fig. 11A) and mESC (Supplemental Fig. 11B,C) and across a range of genomic distances, in-contact locus pairs exhibit more similar replication times than null pairs or pairs that are not in contact. Beyond a certain genomic distance, this high level of similarity cannot be attributed simply to the autocorrelation of timing measurements which is preserved both in our null model and for pairs that are not in contact. Interestingly, the genomic distance at which the replication timing similarity deviates from random expectation is around 750 kb for human ESCs and around 1 Mb for mouse ESCs, consistent with the larger replication domains in mouse ESCs (Hiratani et al. 2008; Ryba et al. 2011). Overall, our results suggest that local chromatin architecture preferentially brings together loci with similar replication timing, even at a scale that is much finer than chromatin compartments which span multiple megabases (Ryba et al. 2010).
Discussion
Our results suggest that systematic and unbiased assignment of confidence estimates to Hi-C contact maps can reveal links between genomic regions containing predicted or validated enhancers and promoters. For a set of enhancer predictions based solely on histone modification and protein binding patterns in human embryonic stem cells, our confidence estimates preferentially link active enhancer regions to promoters of highly expressed genes. This enrichment is consistent with many examples where strong chromatin contact between an enhancer and a promoter is a determinant of gene expression (Tolhuis et al. 2002; Shen et al. 2012). Our results further suggest that not only contacts with elements from the repertoire of predicted enhancers but also with so far unannotated regions have an effect on transcriptional activity of a gene. Finally, more than half of the genes with promoters that are not involved in even a moderate-confidence contact beyond the 50-kb range showed no detectable expression (RPKM < 1), consistent with the idea that these genes might be isolated and silenced by formation of a chromatin loop regulated by insulator elements such as shown by Ferraiuolo et al. (2010) for Hox clusters.
In addition, our results suggest an additional level of colocalization among loci that replicate at similar times (Ryba et al. 2010). We observe that replication timing similarity is much higher for locus pairs with high-confidence contacts that are <500 kb apart compared to >500 kb. The similarity in the former group can be completely captured by an appropriate null model, whereas for the latter group, the similarity is significantly higher than can be explained by the same null model, suggesting 3D colocalization of distal loci that replicate at similar times. Furthermore, our analysis suggests that the genomic distance range of replication timing similarity that can be explained by autocorrelation is larger for mouse ESCs, which may be related to the larger domain sizes in mouse compared to human ESCs. Currently, we use human and mouse embryonic stem cells for which both high coverage Hi-C data and high resolution replication profiles are available. Replication data is also available for different stages of embryonic development as well as for neural precursor cells in mouse (Hiratani et al. 2008, 2010). Comparative analysis of these data sets revealed “switching domains” that change replication timing preferences from one cell type to the other. Our method provides a useful tool to analyze how such changes in local chromatin organization relate to replication timing changes in the course of development or cellular differentiation.
Our technique for assigning statistical confidence estimates to mid-range contacts can be trivially extended to handle all contacts rather than focusing on a specific distance range. Because distal intra-chromosomal and inter-chromosomal contacts do not exhibit a distance-dependent effect, the significance of these interactions can be captured using just the binomial component of the Fit-Hi-C model. Also, in this work we performed confidence estimation by applying a single step of refinement to the null model; however, in principle, our method can be extended to apply this refinement iteratively (Supplemental Fig. 12).
Our method is designed to work either at the native resolution of the data (i.e., single restriction fragment) or at the level of metafragments or fixed-width windows. Not surprisingly, larger metafragments provide increased statistical power and result in a larger percentage of mid-range contacts deemed significant at a given FDR threshold (Supplemental Fig. 13A). The total number of significant contacts, however, first increases with the metafragment size and then decreases (Supplemental Fig. 13B). This tradeoff between metafragment size and number of significant contacts may help to select an appropriate resolution for a particular analysis, given the amount of sequencing data available, or may help decide how much sequencing is necessary to test a particular hypothesis.
A natural direction to pursue is replacement of the nonparametric spline fitting procedure used by Fit-Hi-C with a parametric model derived from biophysical models of DNA looping. Doing this, however, may be challenging because the probability of self-looping depends not only on the local properties of the DNA but also on factors such as the length of the chromosome, the size of the nucleus, and the density of the DNA therein. In practice, our analysis suggests that a simple power law model only applies within a limited distance range and that the appropriate exponent varies by organism and possibly even by cell type (Fig. 2).
We argue that, irrespective of the statistical methodology, the application of statistical confidence estimation to Hi-C data will be critical for assessing candidate hypotheses and selecting particular hypotheses for targeted validation. Even in the context of a study that aims to characterize the frequency or strength of a contact, a statistical confidence estimate must first establish the existence of the contact. We also argue that using a confidence estimation method that accounts for the random polymer looping effect is crucial in order to characterize association of chromatin contacts with other genomic features that relate pairs of loci, such as the two ends of a somatic copy number alteration (SCNA). Two independent studies have shown enrichment of chromatin contacts between SCNA ends (De and Michor 2011; Fudenberg et al. 2011). These studies explicitly control for SCNA length and other potential biases. An alternative method to assess whether two SCNA ends significantly colocalize in 3D is to simply use the Fit-Hi-C confidence estimate, which already accounts for SCNA length and other potential biases. Furthermore, statistical methods such as ours provide a systematic way to compare chromatin architecture sets to one another, facilitating, for example, analysis of changes in chromatin organization during development or between healthy and cancer cells. Finally, another direction in which such a systematic method will prove useful is in generating high-confidence contact networks and analyzing the graph or colocalization properties of these networks (Witten and Noble 2012; Paulsen et al. 2013).
Methods
Data sets
Hi-C data
We use publicly available genome-wide genome architecture data sets from budding yeast (Duan et al. 2010), four human cell lines (Lieberman-Aiden et al. 2009; Dixon et al. 2012), and two mouse cell lines (Dixon et al. 2012). We process raw paired-end reads from each publication using a pipeline that maps the reads to the appropriate reference genome, extracts the read pairs for which each end maps uniquely, and removes potential PCR duplicates. We then count the number of qualified read pairs for each possible restriction enzyme fragment pair, considering only pairs separated by a genomic distance within a range of interest. In order to process the contact maps at different resolutions, we combine multiple consecutive fragments to obtain metafragments. We then calculate the number of contacts per metafragment pair as the sum of contacts between each fragment pair among the two metafragments. Supplemental Table 1 summarizes the genomic distance ranges on which we focus, as well as the different resolutions at which we process each data set.
RNAPII-mediated chromatin interactions for mouse ESC cell line from ChIA-PET
We download the Supplemental Table 2 of Zhang et al. (2013) that lists all RNAPII interactions for mouse ESCs identified in the same work at a false discovery threshold of 5% (16,574 interactions in total). We then extract the subset of interactions that are intra-chromosomal and have a genomic distance between 50 kb and 5 Mb (2494 interactions). We use the list of enhancers in Supplemental Table 5 and list of promoters in Supplemental Table 6 to identify the interactions that link an enhancer to a promoter (1007 interactions). We then use the extracted set of all ChIA-PET interactions and the subset with only enhancer-promoter interactions in our analysis as positive sets of high-confidence contacts in mouse ESCs.
Enhancer predictions and gene expression for H1-hESC cell line
We use the enhancer predictions for human embryonic stem cells (hESC) identified using the presence of chromatin regulators, histone modifications, and nucleosome density (Rada-Iglesias et al. 2011). Predicted enhancers were segregated into two classes: Class I consists of 5118 regions annotated as active enhancers that have acetylation at histone H3 at lysine 27 (H3K27ac); Class II consists of 2287 regions annotated as poised enhancers that have trimethylation at histone H3 at lysine 27 (H3K27me3). We also use RNA-seq gene expression data from Rada-Iglesias et al. (2011) for all human Ensembl genes. We extract the RPKM (reads per kilobase per million mapped reads) value for each gene and assign it to the transcription start site (TSS) of the corresponding gene for further analysis. We use various RPKM thresholds to identify expressed genes among 20,688 genes with reported expression values for hESC.
Cell-line-specific 3C validated enhancer-promoter contacts
We extract enhancer-promoter pairs that are tested for chromatin contacts in two different mouse cell lines using 3C from Supplemental Table 8 of Shen et al. (2012). Out of seven pairs listed, we extract six that are within our distance range of interest (50 kb, 5 Mb]. Out of these six, two are confirmed to not have contacts in either mESC or mCortex cells. The remaining four are all shown to yield 3C contacts in mCortex but not in mESC. For each of the six pairs, we assign each participating locus to the window used in confidence estimation with which it has the most overlap at a resolution of 10 RE fragments. We then report the Q-value for the contact between the pair of assigned windows as the contact significance for the enhancer-promoter pair that is tested by 3C.
Genome annotations for the H1-hESC cell line from ChromHMM and Segway
We download the annotation labels that cover the whole human genome from two different semiautomated genomic annotation methods for the H1-ESC cell line. We use the link http://hgdownload-test.cse.ucsc.edu/goldenPath/hg19/encodeDCC/wgEncodeBroadHmm/wgEncodeBroadHmmH1hescHMM.bed.gz to download the 15-label ChromHMM annotations and the link http://noble.gs.washington.edu/proj/segway/2012/segway_h1hesc.bed.gz to download the 25-label Segway annotations.
For Figure 5A, we extract six labels from the full 15-label annotations and rename them to combine multiple labels with similar functional annotations when appropriate. Three of the six groups we show in Figure 5A correspond to one exact label in Supplemental Figure 9A, namely “Active Promoter,” “Insulator,” and “Heterochromatin.” For the other three groups, there are two corresponding labels each in Supplemental Figure 9A, and we take the average of the number of contacts for these two corresponding labels. We similarly combine multiple labels when necessary for each group displayed in Figure 5B among the 25 labels plotted in Supplemental Figure 9B.
Transcription factor binding peaks for human cell lines
We use the ENCODE Analysis Hub in the UCSC Genome Browser in order to gather regions of transcription factor (TF) binding peaks for the two human cell lines with Hi-C data from Dixon et al. (2012). From the link http://hgdownload-test.cse.ucsc.edu/goldenPath/hg19/encodeDCC/wgEncodeRegTfbsClustered, we use the file named “wgEncodeRegTfbsClusteredWithCellsV3.bed.gz” that lists TF binding site clusters identified by combining data from 91 cell types and 189 transcription-factor targeting antibodies. From this full list, we extract the peaks for H1-ESC and IMR90 cells which have 50 and 5 TFs, and 579,539 and 207,461 total peaks, respectively.
Topological domain coordinates
We use the coordinates of topological domains that were identified using a hidden Markov model based on the observed directionality bias of the contacts for each 40-kb window (Dixon et al. 2012). We use the domain calls that are based on contact maps aggregated among replicate experiments which we download from http://chromosome.sdsc.edu/mouse/hi-c/download.html. The number of domains for four available cell lines are 3127 for hESC, 2349 for hIMR90, 2200 for mESC, and 1519 for mCortex.
Replication timing data
We download the replication timing data sets for hESC (cell line H1 [Ryba et al. 2011]) and mESC (cell line 46C [Hiratani et al. 2008]) from http://replicationdomain.com. The probes for measuring replication timing have a median interval spacing of 1169 bp for hESC and 5782 bp for mESC. For each probe, the replication timing value is reported as the log ratio of the early replicating fraction of DNA to the late replicating fraction (i.e., log2[Early/Late]). These data sets provided a total of 2,161,679 and 384,849 probes with replication timing measurements for hESC and mESC, respectively.
The discrete binning approach
Because the method proposed by Duan et al. (2010) serves as the starting point for our method, we begin by describing that method in detail. To calculate statistical confidence estimates for inter-chromosomal contacts, Duan et al. (2010) used a uniform probability model to evaluate the probability of observing a contact count of  for loci ℓ1 and ℓ2. The calculation requires, in addition to the contact count, two values:
the number M of distinct inter-chromosomal locus pairs, and
the total number N of observed contact counts between inter-chromosomal locus pairs.
Assuming that a single observed contact (i.e., paired-end read) is equally likely to come from any of the M possible pairs of loci, the null probability of this contact being between a specific locus pair is P = 1/M. Duan et al. (2010) use this assumption to calculate the probability that a given pair (ℓ1, ℓ2) has a contact count of exactly k via the binomial distribution:
The P-value is the corresponding cumulative probability of observing at least k contacts:
Switching to the case of intra-chromosomal contacts requires taking into account the increased probability, due to random self-looping of the DNA, of observing an intra-chromosomal contact between a pair of loci separated by a small distance compared to a pair of loci separated by a larger distance. To account for this distance effect, Duan et al. (2010) subdivide the contacts into discrete bins of size 5 kb based on the genomic distance between the two loci. Because random contacts among very close locus pairs are common, the first four such bins (0- to 20-kb range) are simply discarded. After this binning, binomial P-values are calculated separately within each bin. Thus, for bin i, corresponding to a genomic distance range of [si, ei〉, the two values needed for the P-value calculation are now:
the number Mi of distinct pairs of loci with genomic distances in the range [si, ei〉, and
the total number Ni of observed contact counts with genomic distances in the range [si, ei〉.
These values are then substituted into Equations 1 and 2 to compute the P-value. Note that the P-values from different bins, as well as the P-values corresponding to inter-chromosomal contacts, are calibrated and therefore can be used to induce a single ranking of the entire set of observed contacts.
Finally, the combined collection of P-values must be corrected for multiple testing. This is done by estimating, for a given P-value threshold, the proportion of false positive interactions with P-values below (i.e., better than) the threshold. This proportion is known as the false discovery rate (FDR), which can be estimated using standard methods (Benjamini and Hochberg 1995). In practice, the statistical confidence associated with a given contact is reported as a Q-value, which is defined as the minimum FDR threshold at which the interaction is deemed significant (Storey 2002). The Q-value is thus an analog of the P-value that takes into account multiple testing correction.
Initial spline fit
In this work, we modify the binned binomial method in two ways. First, we replace the binning procedure with a spline-fitting procedure that yields a more precise estimate of the probability of observing a contact (i.e., contact probability) with a specified genomic distance (spline-1). Specifically, we aim to replace in Equation 1 the contact probability p that a randomly sampled contact is between a specific locus pair (ℓ1, ℓ2) with a function f(1)(d), where  is the genomic distance separating the two loci. We compute this function using a spline fit to the observed contact probabilities of locus pairs given their genomic distances. To achieve a smooth spline fit, we first segregate the locus pairs into b equal-occupancy bins (b = 200 in this work). This procedure involves enumerating all possible locus pairs within the distance range of interest (including pairs that have a contact count of zero), sorting the pairs in increasing order according to their genomic distances, and then segregating the resulting list into b quantiles. The smallest distances in bin i and bin i + 1 define the lower and upper genomic distance boundaries, si and ei, respectively, for bin i. Then, for each bin i, we compute three values: (1) the average number
  of contact counts per locus pair; (2) the prior contact probability that a given mid-range read comes from one specific locus pair in this bin
  , where N is the total number of mid-range reads; and (3) the average interaction distance
  over all locus pairs in the bin, including pairs that have a contact count of zero. We then fit a univariate spline to the resulting b points ((
 ,
,  ), …, (
 ,
,  )) using the “UnivariateSpline” function from the SciPy package in Python. We set the smoothing factor, the only parameter that is needed, for the spline fit to the square of the minimum contact probability among all b bins, for each library. This parameter choice guarantees that the spline will never take negative values and also provides visually smooth splines (Supplemental Fig. 2). We ensure that the estimated contact probabilities from the spline are monotonically nonincreasing with the increasing genomic distance by post-processing the spline using anti-tonic regression (reverse order isotonic regression). We then use the value from the resulting spline at distance d, f(1)(d), to provide a better estimate of p in Equation 1 for a locus pair separated by distance d. Using this contact probability, the contact count
  , and N as the total number of all mid-range reads, we compute a P-value and then a Q-value for each locus pair (ℓ1, ℓ2), as was done for the case of discrete binning.
Refining the null model
Our second modification of the binning method involves producing a more accurate estimate of the null distribution by excluding contacts that are likely to be real, i.e., interactions not due to random looping of the chromatin fiber. Accordingly, we adopt a two-phase spline fitting procedure. In the first phase, we use all of the observations from the data to fit the initial spline, f(1)(d), as described above. Thereafter, we exclude (i.e., set the contact count to zero) all locus pairs whose P-values are <1/M (i.e., outliers), where M is the total number of possible locus pairs (Fig. 1; Supplemental Fig. 2A). This P-value threshold is conservative (i.e., calculated from the nonrefined null) and ensures that even if the original null model were correct, the procedure would erroneously exclude only ∼1 null locus pair (i.e., non-outlier) on average. We then repeat the entire equal-occupancy binning and spline fitting procedure on this reduced set of contacts (spline-2). This resulting spline f(2)(d) defines our actual estimate of the null distribution (i.e., refined null), and is used to compute P-values and Q-values for all locus pairs including the outliers that were excluded from the calculation of the refined null.
Incorporating biases learned from Hi-C data in confidence estimation
Methods that correct for biases in Hi-C data produce a corrected contact count matrix from the raw contact counts (Yaffe and Tanay 2011; Cournac et al. 2012; Hu et al. 2012; Imakaev et al. 2012). The method of Yaffe and Tanay (2011) computes a correction factor for each locus and locus pair that incorporates information about mappability, GC content, number of RE sites, etc. On the other hand, the method by Imakaev et al. (2012) (ICE) learns a bias vector, one correction factor per locus. The outer product of this bias vector with itself yields a bias matrix that is of the same size as the input contact map. Despite the differences in methodologies, Imakaev et al. (2012) demonstrate that the two methods produce almost equivalent results.
Our confidence estimation procedure incorporates biases learned by ICE into the contact probability calculation. This approach eliminates the need to use corrected contact counts, which are fractional, in the binomial model. To compute confidence estimates, we first infer a spline fit from the raw contact counts. In parallel, we apply ICE to the raw contact counts and learn biases associated with each locus. We then eliminate all loci whose total number of contacts is less than half (bias < 0.5) or more than twice (bias > 2) the average number of total contacts per locus. Then, when calculating the prior probability of contact for a locus pair (ℓ1, ℓ2) with distance d, we not only do a look-up for that contact probability from the spline (praw = f(d)) but also multiply praw by the corresponding bias values (b1, b2) for (ℓ1, ℓ2), yielding pcorrected = f(d) × (b1 × b2). This process results in higher prior contact probabilities for loci with overall high counts and, in turn, less significant confidence estimates for contacts involving such loci relative to contacts that involve loci with low marginal contact counts.
Quantifying binning artifacts
To quantify the effect of the binning artifacts in the calculation of confidence estimates for a given method, we (1) extract the set of all locus pairs within the distance range we are interested in (mid-range contacts), (2) identify all mid-range contacts at 1% FDR threshold, (3) for each contact, divide the corresponding genomic distance by 5 kb (50 kb for human and mouse) and call the remainder the “offset from the left edge of bin,” and (4) compute the histogram of contacts as a function of offset by dividing the 5-kb bin into 10 equally sized windows. For a set of locus pairs with no bias, we expect to see 10% of pairs to fall in each of the 10 equally sized windows, as we observe for the set of all mid-range locus pairs (black) in Figure 3B. If a set of contacts identified by a particular method has a distribution of offsets over the 10 equally sized windows that is significantly different than the distribution for all possible locus pairs (or we could use a uniform distribution of 10% for each window), then the confidence estimates from this method are biased. To measure this bias, we compare distributions for the set of contacts identified by binning, by spline-1 and by only one of these methods (i.e., unique to one method) to the distribution for the set of all mid-range locus pairs. To quantify the significance of difference between the distributions gathered from a set with no bias and a contact set identified by a specific method (either binning or spline-1), we divide the contacts into two groups (<2.5 kb left side, ≥2.5 kb right side) for each set and apply Fisher's exact test. We repeat the same procedure for contacts that are uniquely found by only one method (either binning or spline-1).
Analyzing enhancer-promoter contacts
The labeling scheme used for generating Figure 4B is as follows. We begin with a set of enhancers, divided into “active” (5118) and “poised” (2287). We also use a range of RNA-seq RPKM thresholds to divide a set of 20,689 genes into a series of sets of “expressed” and “not expressed” genes (Rada-Iglesias et al. 2011). In this study, we use RPKM thresholds in the range [0, ..., 10]. We then define our set of “positive” locus pairs as interactions that connect an active enhancer to an expressed gene, and we define our set of “negative” locus pairs as interactions in which at least one of the two loci has no overlap with either an enhancer (“active” or “poised”) or a gene (“expressed” or “not expressed”). All locus pairs that do not meet either of these two sets of criteria are unlabeled and do not enter into the further analysis. The motivation behind this labeling is to avoid placing pairs of loci that might correspond to contacts involving uncharacterized regulatory elements into the negative group. Also, note that this labeling assumes that most of the regions identified as enhancers by Rada-Iglesias et al. (2011) function as activating rather than repressive enhancers. We rank all the labeled locus pairs from the hESC Hi-C data with genomic distances in the range 50–150 kb by increasing P-value. We then test, using the Mann-Whitney U-test, the null hypothesis that the two populations (positive vs. negative) are the same against the alternative hypothesis that the positive class has smaller P-values than the negative class. We normalize the U statistic by dividing it to the maximum value attainable for the given sample sizes n1 and n2, which is n1 × n2. We compute the normalized U statistic for different parameter settings, such as active or poised enhancers and varying RPKM thresholds.
For Figure 4C, we calculate the average expression values and associated standard errors for genes that are segregated into five nonoverlapping groups. The first group contains only the genes that have a significant contact at an FDR of 1% with both an active and a poised enhancer. The second and third groups contain genes with a significant contact at an FDR of 1% for either only active or only poised enhancers. To account for possible uncharacterized enhancers or other regulatory elements that may be missed by the current annotation, we further divide the remaining genes into two groups “Non-enh” and “No contacts.” The group labeled as “No contacts” contains the genes that do not have any significant contact at an FDR of 10% between its promoter and any other loci (annotated or nonannotated). All the remaining genes fall into “Non-enh,” which are the genes that do not have high-confidence contacts with enhancer elements but have some contact at an FDR of 10% with some distal locus (>50 kb). We compute the statistical significance of the difference between distributions of expression values for pairs of groups using a two-sample Kolmogorov–Smirnov (KS) test.
Computing the enrichment of intra-domain interactions
For Hi-C data sets taken from Dixon et al. (2012), we use the topological domain coordinates from the same publication that are reported separately for each cell line (hESC, hIMR90 from human; mESC, mCortex from mouse). We compute the ratio R between the number of contacts that have both ends within one topological domain (intra-domain) to the number of contacts that occur across two different domains (inter-domain) at varying FDR thresholds using metafragments that span 10 consecutive restriction fragments. At an FDR of 1 (i.e., 100%), this ratio simply represents the ratio when contact maps are used without any confidence assignment. To estimate the significance of the ratio R, we randomly shuffle topological domains by preserving the distribution of the domain lengths for each chromosome. We achieve this as follows. Let  be the set of all topological domain lengths and
  be the set of all lengths for the boundary regions that separate the domains for chromosome i. Excluding unmappable chromosome ends, if there are n domains for a chromosome, then there will be m = n − 1 boundaries. While shuffling domains to construct our null model, for each chromosome we first randomly select one domain length
  from ai and create our first random domain that starts from the first mappable region and extends by length
  . We then select a length
  from the boundary set bi and create a random boundary starting from the last base pair of the first random domain and extending by length
  . We repeat this process to decorate the whole chromosome by random domains followed by random boundary regions. We do this randomization for each chromosome and repeat the process 100 times to create a null model for each set of topological domain calls and compute the average and standard deviation of R over all randomizations. For Figure 6A, we combine null models of all four different cell lines from Dixon et al. (2012) to create one aggregate null model.
Previously published data sets from a human lymphoblastoid cell line (GM06990; two replicates with different restriction enzymes) and an erythroleukemia cell line (K562; one replicate) provide limited sequencing depth Hi-C data without topological domain coordinates (Lieberman-Aiden et al. 2009). For these cell lines, we use the domains identified for hESC and hIMR90 cell lines by Dixon et al. (2012) to compute R and use the random shuffling described above to create a corresponding null model. We process the three libraries from Lieberman-Aiden et al. (2009) using 50 consecutive restriction fragments per metafragment, which is a coarser resolution compared to 10 that were used for the Dixon et al. (2012) data. We plot the ratio R for each topological domain/Hi-C data combination and their corresponding null models at FDR 0.1%.
Characterizing the relationship between assigned contact significance and replication timing
We use replication timing data for human (Ryba et al. 2011) and mouse embryonic stem cells (Hiratani et al. 2008) together with the Hi-C data for these cell lines (Dixon et al. 2012) to investigate the relationship between chromatin organization and replication. We process the Hi-C data at the resolution of metafragments, each of which spans 10 consecutive restriction fragments. For each locus, we assign a replication timing value using the probe nearest to the locus midpoint. We compute the difference between replication times of two loci by taking the absolute value of the difference between their replication timing values. We compute the distribution of replication timing differences for mid-range contacts at a fixed FDR, binned by 250-kb bins according to their genomic distances (x-axis). We also compute these distributions by aggregating all genomic distance bins and using varying FDR thresholds (x-axis) to determine sets of significant and nonsignificant contacts. We do this analysis for both observed replication timing measurements (observed RT) and a set of randomly shuffled measurements (random RT). To create the random set, we implement a circular shuffling technique that preserves the adjacency of similar replication measurements coming from adjacent probes as follows. Let ti be the set of all probes with replication timing measurements for chromosome i, |ti| be its cardinality, and p be the percentage by which the replication values will be shifted circularly while preserving the exact probe coordinates. Then, a shift of p percent will move the replication value of the jth probe,  , to the j + (p/100) × |ti| (mod |ti|)th probe. Shifts of 0% and 100% will simply preserve the original measurements. Using this scheme, we create nine shuffled replication profiles (10%, …, 90% shift) for each experiment.
Source code availability
We provide our Fit-Hi-C implementation in Python in the online Supplemental Material and on the companion web site of this article (http://noble.gs.washington.edu/proj/fit-hi-c). This program takes as input a list of locus pairs and associated counts and produces as output the same list annotated with P-values and Q-values. Optionally, the program can operate on corrected contact maps, using as input a bias vector generated using a method such as ICE (Imakaev et al. 2012).
Acknowledgments
We thank David M. Gilbert, Zhi-jun Duan, Wenxiu Ma, Max Libbrecht, Tyrone Ryba, Vishnu Dileep, Benjamin Pope, Daniela Witten, and Fabian Buske for helpful comments. This work was funded by a Computing Research Association CIFellows award to F.A. (NSF award CIF 1136996) and by NIH awards U41 HG007000 and P41 GM103533. T.L.B. was funded by a University of Queensland Trans-Pacific Fellowship Award.
Author contributions: All three authors contributed to the original concept and design of the methodology and the computational experiments. F.A. carried out the experiments. The manuscript was drafted by F.A. with input and revisions from T.L.B. and W.S.N.
Footnotes
[Supplemental material is available for this article.]
Article published online before print. Article, supplemental material, and publication date are at http://www.genome.org/cgi/doi/10.1101/gr.160374.113.
References
- Bailey T, Gribskov M 2002. Estimating and evaluating the statistics of gapped local-alignment scores. J Comput Biol 9: 575–593 [DOI] [PubMed] [Google Scholar]
- Benjamini Y, Hochberg Y 1995. Controlling the false discovery rate: a practical and powerful approach to multiple testing. J R Stat Soc Ser B Methodol 57: 289–300 [Google Scholar]
- Cournac A, Marie-Nelly H, Marbouty M, Koszul R, Mozziconacci J 2012. Normalization of a chromosomal contact map. BMC Genomics 13: 436. [DOI] [PMC free article] [PubMed] [Google Scholar]
- De S, Michor F 2011. DNA replication timing and long-range DNA interactions predict mutational landscapes of cancer genomes. Nat Biotechnol 29: 1103–1108 [DOI] [PMC free article] [PubMed] [Google Scholar]
- Dixon JR, Selvaraj S, Yue F, Kim A, Li Y, Shen Y, Hu M, Liu JS, Ren B 2012. Topological domains in mammalian genomes identified by analysis of chromatin interactions. Nature 485: 376–380 [DOI] [PMC free article] [PubMed] [Google Scholar]
- Duan Z, Andronescu M, Schutz K, McIlwain S, Kim YJ, Lee C, Shendure J, Fields S, Blau CA, Noble WS 2010. A three-dimensional model of the yeast genome. Nature 465: 363–367 [DOI] [PMC free article] [PubMed] [Google Scholar]
- Efron B, Tibshirani R, Storey JD, Tusher V 2001. Empirical Bayes analysis of a microarray experiment. J Am Stat Assoc 96: 1151–1161 [Google Scholar]
- Ernst J, Kellis M 2012. ChromHMM: automating chromatin-state discovery and characterization. Nat Methods 9: 215–216 [DOI] [PMC free article] [PubMed] [Google Scholar]
- Ferraiuolo MA, Rousseau M, Miyamoto C, Shenker S, Wang XQ, Nadler M, Blanchette M, Dostie J 2010. The three-dimensional architecture of Hox cluster silencing. Nucleic Acids Res 21: 7472–7484 [DOI] [PMC free article] [PubMed] [Google Scholar]
- Fudenberg G, Getz G, Meyerson M, Mirny LA 2011. High order chromatin architecture shapes the landscape of chromosomal alterations in cancer. Nat Biotechnol 29: 1109–1113 [DOI] [PMC free article] [PubMed] [Google Scholar]
- Fullwood MJ, Liu MH, Pan YF, Liu J, Xu H, Mohamed YB, Orlov YL, Velkov S, Ho A, Mei PH, et al. 2009. An oestrogen-receptor-α-bound human chromatin interactome. Nature 462: 58–64 [DOI] [PMC free article] [PubMed] [Google Scholar]
- Hiratani I, Ryba T, Itoh M, Yokochi T, Schwaiger M, Chang CW, Townes YLTM, Schbeler D, Gilbert DM 2008. Global reorganization of replication domains during embryonic stem cell differentiation. PLoS Biol 6: e245. [DOI] [PMC free article] [PubMed] [Google Scholar]
- Hiratani I, Ryba T, Itoh M, Rathjen J, Kulik M, Papp B, Fussner E, Bazett-Jones DP, Plath K, Dalton S, et al. 2010. Genome-wide dynamics of replication timing revealed by in vitro models of mouse embryogenesis. Genome Res 20: 155–169 [DOI] [PMC free article] [PubMed] [Google Scholar]
- Hoffman MM, Buske OJ, Wang J, Weng Z, Bilmes JA, Noble WS 2012. Unsupervised pattern discovery in human chromatin structure through genomic segmentation. Nat Methods 9: 473–476 [DOI] [PMC free article] [PubMed] [Google Scholar]
- Hoffman MM, Ernst J, Wilder SP, Kundaje A, Harris RS, Libbrecht M, Giardine B, Ellenbogen PM, Bilmes JA, Birney E, et al. 2013. Integrative annotation of chromatin elements from ENCODE data. Nucleic Acids Res 41: 827–841 [DOI] [PMC free article] [PubMed] [Google Scholar]
- Hu M, Deng K, Selvaraj S, Qin Z, Ren B, Liu JS 2012. HiCNorm: removing biases in Hi-C data via Poisson regression. Bioinformatics 28: 3131–3133 [DOI] [PMC free article] [PubMed] [Google Scholar]
- Hwang YJ, Lee EW, Song J, Kim HR, Jun YC, Hwang KA 2013. MafK positively regulates NF-kB activity by enhancing CBP-mediated p65 acetylation. Sci Rep 3: 3242. [DOI] [PMC free article] [PubMed] [Google Scholar]
- Imakaev M, Fudenberg G, McCord RP, Naumova N, Goloborodko A, Lajoie BR, Dekker J, Mirny LA 2012. Iterative correction of Hi-C data reveals hallmarks of chromosome organization. Nat Methods 9: 999–1003 [DOI] [PMC free article] [PubMed] [Google Scholar]
- Lemieux JE, Kyes SA, Otto TD, Feller AI, Eastman RT, Pinches RA, Su MBXZ, Newbold CI 2013. Genome-wide profiling of chromosome interactions in Plasmodium falciparum characterizes nuclear architecture and reconfigurations associated with antigenic variation. Mol Microbiol 90: 519–537 [DOI] [PMC free article] [PubMed] [Google Scholar]
- Li G, Ruan X, Auerbach RK, Sandhu KS, Zheng M, Wang P, Poh HM, Goh Y, Lim J, Zhang J, et al. 2012. Extensive promoter-centered chromatin interactions provide a topological basis for transcription regulation. Cell 148: 84–98 [DOI] [PMC free article] [PubMed] [Google Scholar]
- Lieberman-Aiden E, van Berkum NL, Williams L, Imakaev M, Ragoczy T, Telling A, Amit I, Lajoie BR, Sabo PJ, Dorschner MO, et al. 2009. Comprehensive mapping of long-range interactions reveals folding principles of the human genome. Science 326: 289–293 [DOI] [PMC free article] [PubMed] [Google Scholar]
- Mitsui K, Tokuzawa Y, Itoh H, Segawa K, Murakami M, Takahashi K, Maruyama M, Maeda M, Yamanaka S 2003. The homeoprotein Nanog is required for maintenance of pluripotency in mouse epiblast and ES cells. Cell 113: 631–642 [DOI] [PubMed] [Google Scholar]
- Niwa H, Miyazaki J, Smith AG 2000. Quantitative expression of Oct-3/4 defines differentiation, dedifferentiation or self-renewal of ES cells. Nat Genet 24: 372–376 [DOI] [PubMed] [Google Scholar]
- Nora EP, Lajoie BR, Schulz EG, Giorgetti L, Okamoto I, Servant N, Piolot T, van Berkum NL, Meisig J, Sedat J, et al. 2012. Spatial partitioning of the regulatory landscape of the X-inactivation centre. Nature 485: 381–385 [DOI] [PMC free article] [PubMed] [Google Scholar]
- Paulsen J, Lien TG, Sandve GK, Holden L, Borgan O, Glad IK, Hovig E 2013. Handling realistic assumptions in hypothesis testing of 3D co-localization of genomic elements. Nucleic Acids Res 41: 5164–5174 [DOI] [PMC free article] [PubMed] [Google Scholar]
- Rada-Iglesias A, Bajpai R, Swigut T, Brugmann SA, Flynn RA, Wysocka J 2011. A unique chromatin signature uncovers early developmental enhancers in humans. Nature 470: 279–283 [DOI] [PMC free article] [PubMed] [Google Scholar]
- Ryba T, Hiratani I, Lu J, Itoh M, Kulik M, Zhang J, Schulz TC, Robins AJ, Dalton S, Gilbert DM 2010. Evolutionarily conserved replication timing profiles predict long-range chromatin interactions and distinguish closely related cell types. Genome Res 20: 761–770 [DOI] [PMC free article] [PubMed] [Google Scholar]
- Ryba T, Hiratani I, Sasaki T, Battaglia D, Kulik M, Zhang J, Dalton S, Gilbert DM 2011. Replication timing: a fingerprint for cell identity and pluripotency. PLoS Comput Biol 7: e1002225. [DOI] [PMC free article] [PubMed] [Google Scholar]
- Sankaran V, Menne T, Xu J, Akie T, Lettre G, Handel BV, Mikkola HK, Hirschhorn JN, Cantor AB, Orkin SH 2008. Human fetal hemoglobin expression is regulated by the developmental stage-specific repressor BCL11A. Science 322: 1839–1842 [DOI] [PubMed] [Google Scholar]
- Sanyal A, Lajoie BR, Jain G, Dekker J 2012. The long-range interaction landscape of gene promoters. Nature 489: 109–113 [DOI] [PMC free article] [PubMed] [Google Scholar]
- Sexton T, Yaffe E, Kenigsberg E, Bantignies F, Leblanc B, Hoichman M, Parrinello H, Tanay A, Cavalli G 2012. Three-dimensional folding and functional organization principles of the Drosophila genome. Cell 148: 458–472 [DOI] [PubMed] [Google Scholar]
- Shen Y, Yue F, McCleary DF, Ye Z, Edsall L, Kuan S, Wagner U, Dixon J, Lee L, Lobanenkov VV, et al. 2012. A map of the cis-regulatory sequences in the mouse genome. Nature 488: 116–120 [DOI] [PMC free article] [PubMed] [Google Scholar]
- Storey JD 2002. A direct approach to false discovery rates. J R Stat Soc Ser B Methodol 64: 479–498 [Google Scholar]
- Tanizawa H, Iwasaki O, Tanaka A, Capizzi JR, Wickramasignhe P, Lee M, Fu Z, Noma K 2010. Mapping of long-range associations throughout the fission yeast genome reveals global genome organization linked to transcriptional regulation. Nucleic Acids Res 38: 8164–8177 [DOI] [PMC free article] [PubMed] [Google Scholar]
- Tolhuis B, Palstra RJ, Splinter E, Grosveld F, de Laat W 2002. Looping and interaction between hypersensitive sites in the active β-globin locus. Mol Cell 10: 1453–1465 [DOI] [PubMed] [Google Scholar]
- Witten DM, Noble WS 2012. On the assessment of statistical significance of three-dimensional colocalization of sets of genomic elements. Nucleic Acids Res 40: 3849–3855 [DOI] [PMC free article] [PubMed] [Google Scholar]
- Yaffe E, Tanay A 2011. Probabilistic modeling of Hi-C contact maps eliminates systematic biases to characterize global chromosomal architecture. Nat Genet 43: 1059–1065 [DOI] [PubMed] [Google Scholar]
- Zhang Y, Wong CH, Birnbaum RY, Li G, Favaro R, Ngan CY, Lim J, Tai E, Poh HM, Wong E, et al. 2013. Chromatin connectivity maps reveal dynamic promoter-enhancer long-range associations. Nature 504: 306–310 [DOI] [PMC free article] [PubMed] [Google Scholar]