Abstract
Deficits in eye contact have been a hallmark of autism1,2 since the condition’s initial description3. They are cited widely as a diagnostic feature4 and figure prominently in clinical instruments5; however, the early onset of these deficits has not been known. Here we show in a prospective longitudinal study that infants later diagnosed with autism spectrum disorders (ASD) exhibit mean decline in eye fixation within the first 2 to 6 months of life, a pattern not observed in infants who do not develop ASD. These observations mark the earliest known indicators of social disability in infancy, but also falsify a prior hypothesis: in the first months of life, this basic mechanism of social adaptive action—eye looking—is not immediately diminished in infants later diagnosed with ASD; instead, eye looking appears to begin at normative levels prior to decline. The timing of decline highlights a narrow developmental window and reveals the early derailment of processes that would otherwise play a key role in canalizing typical social development. Finally, the observation of this decline in eye fixation—rather than outright absence—offers a promising opportunity for early intervention, one that could build on the apparent preservation of mechanisms subserving reflexive initial orientation towards the eyes.
Autism Spectrum Disorders (ASD) affect approximately 1 in every 88 individuals6. They are lifelong, believed to be congenital, and are among the most highly heritable of psychiatric conditions7, with estimates suggesting as many as three to five hundred distinct genes impacting etiology8. The genetic heterogeneity of ASD, however, poses a stark challenge for understanding its biology: how are so many different “causes” instantiated into common forms of disability?
One answer is that while the specific biological mechanisms may vary (in genes or pathways affected, in dosage or in timing), any such disruptions will contribute to an individual deviation from normative developmental processes9,10; the mechanisms may initially be different, but a divergence from typical development is shared. In this way, widely varying initial liabilities can be converted into similar manifestations of impairment, giving rise to the spectrum of social disability we then call “autism”.
In typical development, the processes of normative social interaction are extremely early-emerging: from the first hours and weeks of life, preferential attention to familiar voices11, faces12, face-like stimuli13, and biological motion14 guide typical infants15. These processes are highly-conserved phylogenetically16 and lay the foundation for iterative specialization of mind and brain17, entraining typical babies to the social signals of their caregivers11–14,18.
In the current study, we tested the extent to which measures of these early-emerging normative processes may reveal disruptions in ASD at a point prior to the manifestation of overt symptoms. We measured preferential attention to the eyes of others, a skill present in typical infants12 but significantly impaired in 2-year-olds with ASD2. We hypothesized that in infants later diagnosed with ASD, preferential attention to others’ eyes might be diminished from birth onwards2,3,17.
Data were collected at 10 time points: at months 2, 3, 4, 5, 6, 9, 12, 15, 18, and 24. We studied 110 infants, enrolled as risk-based cohorts: N=59 at high-risk for ASD (full siblings of a child with ASD19) and N=51 at low-risk (without 1st, 2nd, or 3rd degree relatives with ASD). Diagnostic status was ascertained at 36 months. For details on study design, clinical characterization of participants, and experimental procedures, see Methods and Supplementary Materials.
Of the high-risk infants, N=12 met criteria for ASD20 (10 males, 2 females), indicating a conversion rate of 20.3%19. One child from the low-risk cohort was also diagnosed with ASD. Given the small number of girls in the ASD group, we constrained current analyses to males only, N=11 ASD (10 from the high-risk cohort and 1 from the low-risk), and N=25 typically-developing (TD) (all from the low-risk cohort).
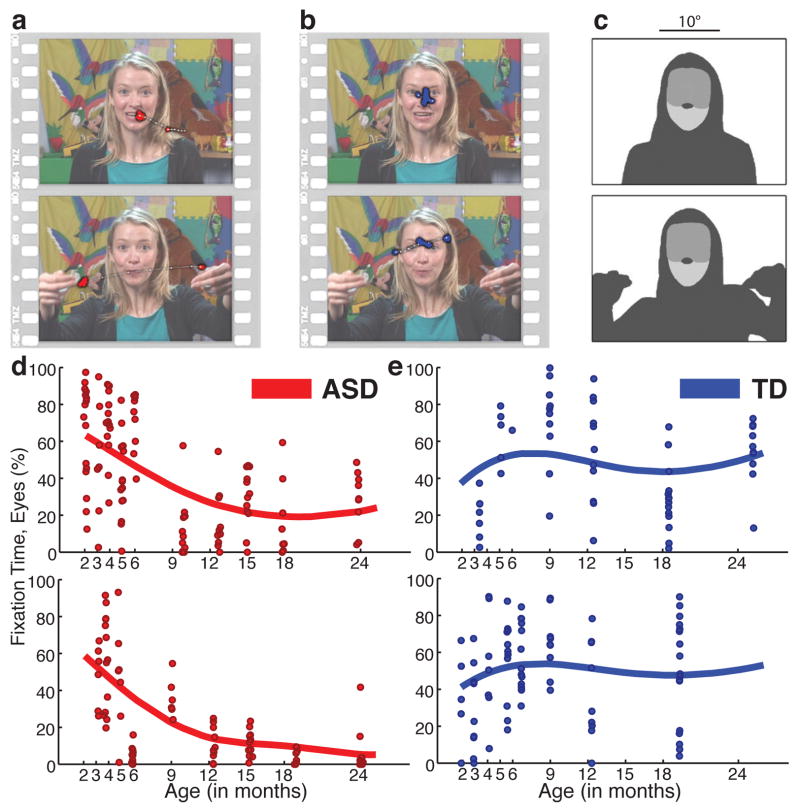
At each testing session, infants viewed scenes of naturalistic caregiver interaction (Figures 1a, 1b) while their visual scanning was measured with eye-tracking equipment. The N=36 TD and ASD children viewed 2,384 trials of video scenes.
Figure 1. Example stimuli, visual scanpaths, regions-of-interest, and longitudinal eye-tracking data from 2 until 24 months of age.
a, Data from 6-month-old later diagnosed with ASD, red. b, Data from typically-developing (TD) 6-month-old, blue. Two seconds of eye-tracking data are overlaid on each still image, onscreen at the midpoint of the data sample. Saccades plotted as thin white lines with white dots; fixation data plotted as larger colored dots. c, Corresponding regions of interest for each image in a and b, shaded to indicate eye, mouth, body, and object regions. Trial data with FDA curve fits plotting percentage of total fixation time on eyes, from 2 until 24 months of age, for d, 2 children with ASD and e, 2 TD children.
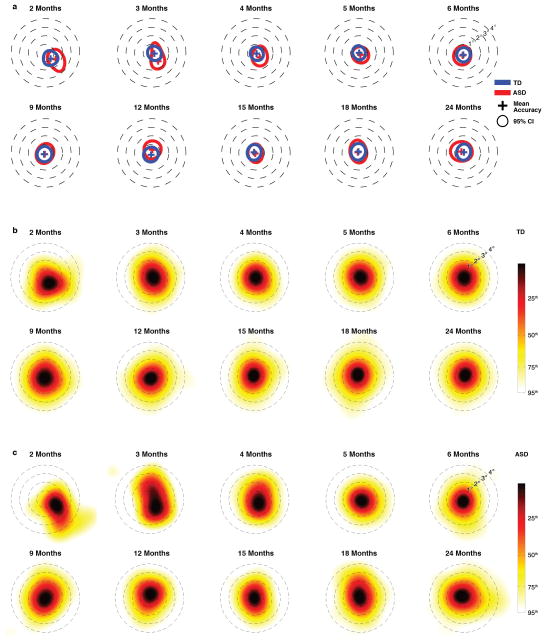
Control comparisons tested for between-group differences in attention to task and completion of procedures. There were no between-group differences in duration of data collected per child (TD = 71.25(27.66) min, ASD = 64.16(30.77) min, t34 = 0.685, P = 0.498); nor in the distribution of ages at which successful data collection occurred (k = .0759, P = 0.9556; 2-sample Kolmogorov-Smirnov). Calibration accuracy was not significantly different between groups, cross-sectionally, at any data collection session (all P > 0.15, t < 1.44; mean P = 0.428), nor longitudinally, as a main effect of diagnosis (F1,2968.336 = 0.202, P = 0.65) or interaction of diagnosis by time (F1,130.551 = 0.027, P = 0.87) (by hierarchical linear modeling; see Methods, Supplementary Materials and Extended Data Figure 8).
Extended Data Figure 8. Calibration accuracy from 2 until 24 months of life in typically-developing children (TD) and in children diagnosed with an autism spectrum disorder (ASD).
In plots in a, the cross marks the location of mean calibration accuracy, while the annulus marks the 95% confidence interval (CI). In b, kernel density estimates plot the distribution of fixation locations relative to fixation targets for Typically-Developing (TD) children. In c, kernel density estimates plot the distribution of fixation locations relative to fixation targets for children diagnosed with an Autism Spectrum Disorder (ASD). Smoothing bandwidth for kernel density estimates was equal to 1°. Targets for testing calibration accuracy consisted of spinning and/or flashing points of light and cartoon animations, ranging in size from 1° to 1.5° of visual angle, presented on an otherwise blank screen, all with accompanying sounds
We then measured percentage of visual fixation time to eyes, mouth, body, and object regions (Figure 1c). For each child, during each video, these measures served as the dependent variables for longitudinal analyses. Longitudinal analyses were conducted by Functional Data Analysis (FDA)21 and Principal Analysis by Conditional Expectation (PACE)22 (examples in Figures 1d, 1e), and were repeated with traditional growth curve analysis using hierarchical linear modeling (HLM)23.
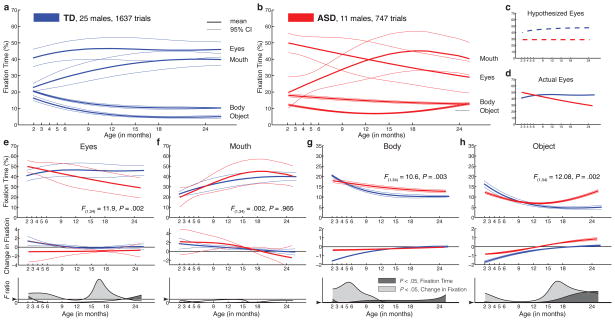
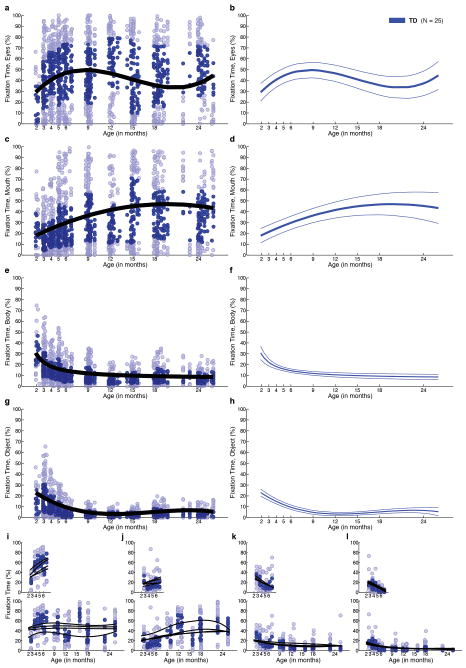
Growth curves for normative social engagement show broad developmental change in TD infants during the first two years of life (Figure 2a and Extended Data Figures 2,4,7). From 2–6 months, TD infants look more at the eyes than at mouth, body, or object regions (all F1,23 > 15.74, P < 0.001, by functional ANOVA21) (2a,2e). Mouth fixation increases during the first year and peaks at approximately 18 months (2a,2f). Fixation on body and object regions declines sharply throughout the first year, reaching a plateau between 18 and 24 months (2a, 2g, 2h), with greater fixation on body than on object regions at all time points (F1,23 = 18.02, P < 0.001).
Figure 2. Growth charts of social visual engagement for typically-developing children and children diagnosed with ASD.
Fixation to eyes, mouth, body, and object from 2 until 24 months in a, TD and, b, ASD. c, Contrary to a congenital reduction in preferential attention to eyes in ASD, d, children with ASD exhibit mean decline in eye fixation. Longitudinal change in fixation to e, eyes; f, mouth; g, body; and h, object regions; between-group comparisons by functional ANOVA. Dark lines indicate mean growth curves, light lines indicate 95% CI. Top panels in e-h plot percent fixation; middle panels plot change in fixation (the first derivative, in units of % change per month); and bottom panels plot F value functions for between-group pointwise comparisons. Significant differences are shaded in medium gray for comparison of fixation data and light gray for comparison of change-in-fixation data.
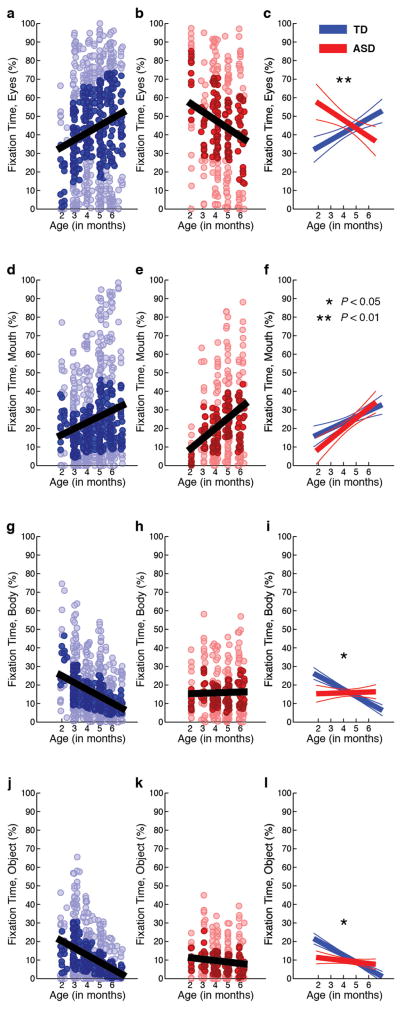
Extended Data Figure 2. Developmental differences in visual fixation between 2 and 6 months of age.
Raw data for eyes fixation (a–c), mouth fixation (d–f), body fixation (g–i), and object fixation (j–l) between 2 and 6 months for typically-developing infants (in blue) and infants later diagnosed with autism spectrum disorders (in red). Darkly shaded data markers indicate the interquartile range (spanning 25th to 75th percentiles). Data show significant associations with chronological age, but the slopes of the associations differ for ASD and TD outcome groups, with significant interactions of Diagnosis by Age for eyes, F(1,787.928) = 9.27, P = 0.002; for body, F(1,25.557) = 5.88, P = 0.023; and for object, F(1,21.947) = 5.24, P = 0.032; but not for mouth, F(1,47.298) = 0.019, P = 0.89. Analyses by HLM. Plots in c, f, i, and l show mean trend lines and 95% CI.
Extended Data Figure 4. Developmental change in visual fixation between 2 and 24 months of age in typically-developing children.
Raw data for eyes fixation (a), mouth fixation (c), body fixation (e), and object fixation (g) between 2 and 24 months for typically-developing children. Darkly shaded data markers indicate the interquartile range (spanning 25th to 75th percentiles). Black lines indicates mean growth curves via hierarchical linear modelling (HLM). Mean fixation curves with 95% confidence intervals for eyes fixation (b), mouth fixation (d), body fixation (f), and object fixation (h) between 2 and 24 months for typically-developing children.
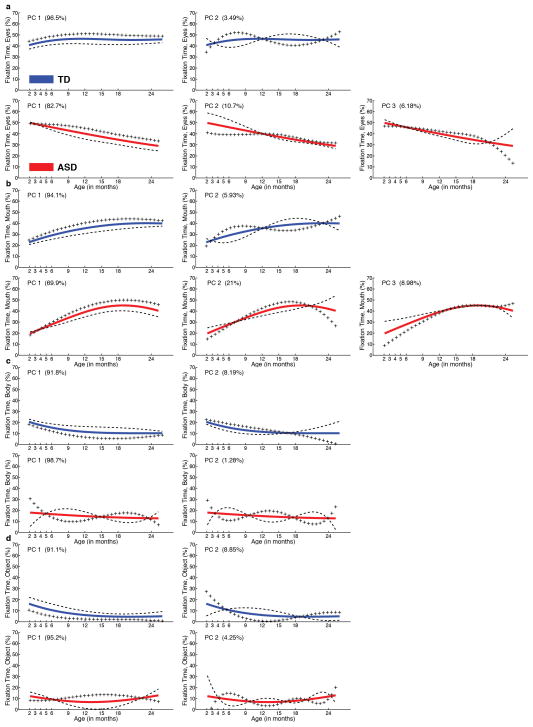
Extended Data Figure 7. Mean fixation curves by PACE/FDA with the effects of adding (+) or subtracting (−) principal component (PC) functions.
(following the convention of Ramsay and Silverman, ref. 21). a, eyes fixation, b, mouth fixation, c, body fixation, and d, object fixation for both typically-developing infants (in blue) and infants with autism (in red). For each region and each group, number of plots is dictated by number of PC functions. Number of PC functions was determined by the Akaike Information Criterion. The fraction of variance explained (FVE) is given in parentheses in the upper left corner of each plot. The mean functions in each case match those plotted in Main Text Figure 2.
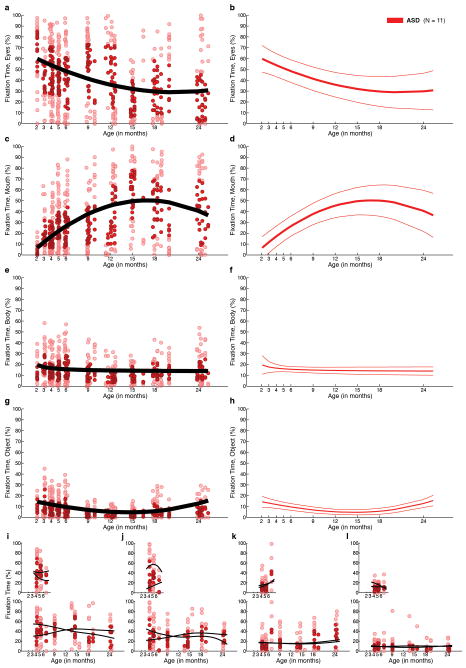
In infants later diagnosed with ASD, growth curves of social visual engagement follow a different developmental course (Figure 2b and Extended Data Figures 2,5,7). From 2 until 24 months of age, eye fixation declines, arriving by 24 months at a level that is approximately ½ that of typically-developing children (2e). Fixation on others’ mouths increases from month 2 until approximately month 18 (2f). Fixation on others’ bodies declines in children with ASD, but at less than half the rate of TD children, stabilizing at a level 25% greater than typical (2g). Object fixation also declines more slowly in children with ASD, and increases during the 2nd year (2h), rising by 24 months to twice the level of typical controls.
Extended Data Figure 5. Developmental change in visual fixation between 2 and 24 months of age in children with ASD.
Raw data for eyes fixation (a), mouth fixation (c), body fixation (e), and object fixation (g) between 2 and 24 months for children with ASD. Darkly shaded data markers indicate the interquartile range (spanning 25th to 75th percentiles). Black lines indicates mean growth curves via hierarchical linear modelling (HLM). Mean fixation curves with 95% confidence intervals for eyes fixation (b), mouth fixation (d), body fixation (f), and object fixation (h) between 2 and 24 months for children with ASD.
Between-group comparison of entire 2- to 24-month growth curves by functional ANOVA21 reveals significant differences in eye fixation (Figure 2e, F1,34 = 11.90, P =0.002); in body fixation (Figure 2g, F1,34 = 10.60, P =0.003); and in object fixation (Figure 2h, F1,34 = 12.08, P =0.002); but not in mouth fixation (Figure 2f, F1,34 = 0.002, P =0.965) (Bonferroni corrections for multiple comparisons, α = 0.0125). Related analyses, including HLM, are given in Supplementary Materials and Extended Data Figures 4,5,7,8)
Contrary to our initial hypothesis2, the data for children with ASD show developmental decline in eye fixation from 2 until 24 months of age (Figure 2c,2d), with average levels of ASD eye looking that appear to begin in the normative range.
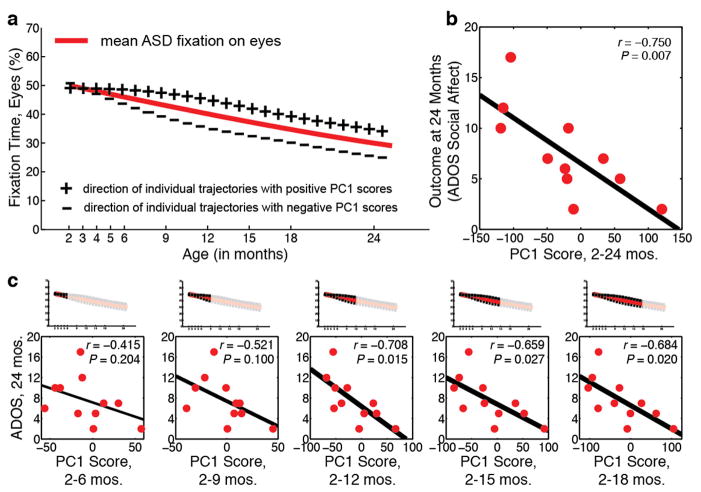
The relationship between longitudinal eye fixation and dimensional level of social-communicative disability was tested via regression. As shown in Extended Data Figure 1, steeper decline in eye fixation is associated with more severe social disability5: r(9) = −0.750 [−0.27 – −0.93, 95% CI], P = 0.007. In an exploratory analysis, we also tested sub-sets of the available data: that is, we measured decline in eye fixation using only data collected between months 2 through 6, excluding data collected thereafter; then using only data collected between months 2–9; 2–12; etc.). The relationship between decline in eye fixation and outcome becomes a statistical trend by 2–9 months (P = 0.100), and is statistically significant thereafter. Although these analyses will benefit from replication with larger samples, they offer preliminary indication of the clinical significance of these early behaviours.
Extended Data Figure 1. In infants later diagnosed with ASD, decline in eye fixation during the first 2 years is significantly associated with outcome levels of symptom severity.
Functional Principal Component Analysis (FPCA) was used to extract growth curve components explaining variance in trajectory shape about the population mean. (a) Population mean for fixation to eyes in children with ASD (red line) plotted with lines indicating direction of individual trajectories having positive principal compenent one (PC1) scores (line marked by plus signs) or negative PC1 scores (line marked by minus signs). (b) Outcome levels of social disability (as measured by ADOS Social-Affect) as a function of decline in eye fixation (measured as eyes PC1 score). (c) Outcome levels of social disability as a function of decline in eye fixation using subsets of the longitudinal data (i.e., measuring decline in eye fixation using only data collected between months 2–6, excluding data thereafter; then between months 2–9, etc.). Decline in eye fixation predicts future outcome at trend levels by 2–9 months (P = 0.100), and is statistically significant thereafter.
Our experimental design densely sampled the first 6 months of life in order to test the relationship between early looking behaviour and later categorical outcome. Extended Data Figures 2a–2c show raw eye fixation data collected in the first 6 months. Eye fixation data for both groups show significant associations with chronological age (F1,114.237 = 9.94, P =0.002 for TD eye fixation, F1,41.609 = 9.62, P =0.003 for ASD eye fixation), but the slopes of the associations are in opposite directions: increasing at +3.6% per month for TD [1.3 – 5.9, 95% CI], and decreasing at −4.8% per month for ASD [−7.9 – −1.7, 95% CI]. A similar difference is observed for body fixation (Extended Data Figure 2g–2i): body fixation is declining in TD children but is not declining in those later diagnosed with ASD (−4.3% per month [−5.4 – −3.1] for TD, F1,211.856 = 54.83, P <0.001; 0.3% per month for ASD [−1.2 – 1.7], F1,241.320 = 0.11, P =0.739). For both regions, there are significant interactions of Diagnosis by Age: eyes, F1,787.928 = 9.27, P =0.002; and body, F1,25.557 = 5.88, P =0.023 (HLM).
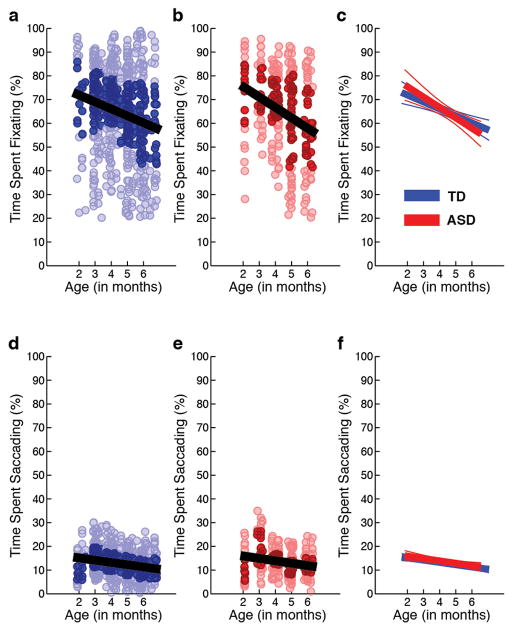
As a control, we tested whether there were between-group differences in levels of looking at the video stimuli, irrespective of content region. There were no between-group differences in levels of fixation or saccading, respectively, either as a main effect of diagnosis [F(1,21.652) = 0.958, P = 0.339; F(1,27.189) = 0.250, P = 0.621] or as an interaction of diagnosis by age [F(1,20.026) = 0.880, P = 0.359; F(1,26.430) = 0.561, P = 0.460] (Extended Data Figure 3).
Extended Data Figure 3. Percentage of total time spent fixating and saccading between 2 and 6 months of age.
Raw data for percentage of total time spent fixating (a–c) and time spent saccading (d–f) between 2 and 6 months for typically-developing infants (in blue) and infants with autism spectrum disorders (in red). Darkly shaded data markers indicate the interquartile range (spanning 25th to 75th percentiles). Data show significant associations with chronological age, but the slopes of the associations do not differ for ASD and TD outcome groups, F(1,20.026) = 0.88, P = 0.359 for time spent fixating; and F(1,26.430) = 0.56, P = 0.460 for time spent saccading. Analyses by HLM. Plots in c and f show mean trend lines and 95% CI.
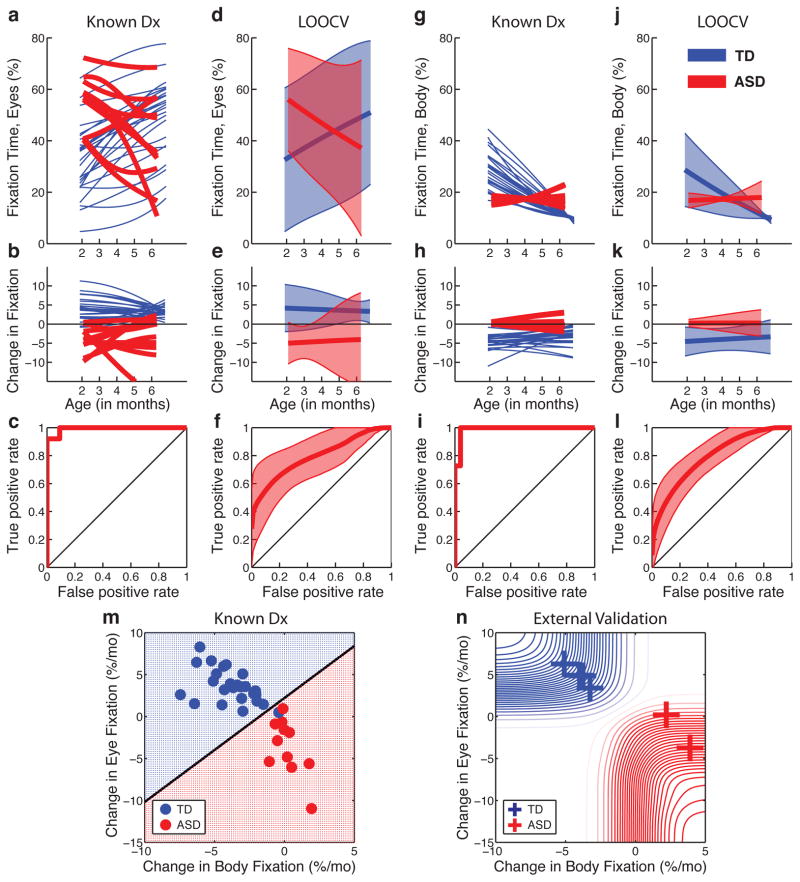
Given the variability in infant looking, we measured the extent of overlap in distributions for measures of fixation in TD infants relative to infants later diagnosed with ASD. Figure 3a plots individual growth curves for levels of eye fixation, while Figure 3b plots change in eye fixation. Mean individual levels of change in fixation between 2 and 6 months show minimal overlap between groups (Figure 3c). However, such estimates (depending as they do on the data used to build the model, with known diagnostic outcomes) are likely to be optimistic24; to assess bias, we performed an internal validation.
Figure 3. Visual fixation between 2 and 6 months relative to diagnosis at year 3.
Individual curve fits for, a, eye fixation data, and, b, change-in-fixation data for typically-developing infants (blue) and infants later diagnosed with ASD (red). c, The extent of between-group overlap in distributions of change-in-fixation data. For internal validation, each infant was tested as a validation case in relation to the remainder of the data (leave-one-out cross-validation, LOOCV). Area plots in d and e show LOOCV mean and 95% prediction intervals for individual trajectories of d, eye fixation, and e, change-in-fixation data; f, shows extent of between-group overlap in change-in-fixation data (mean and 95% CI). g–i and j–l repeat the same analyses for body fixation. m, plots the joint distribution of change in eye and body fixation. n, 6 male infants, not part of the original sample, were tested as an external validation.
As an internal validation (Figures 3d–3f), we used leave-one-out cross-validation (LOOCV), partitioning our data into subsamples so that each infant was tested as a validation case (ie, presuming unknown diagnostic outcome) in relation to the remainder of the data set25. The results indicate relatively low levels of overlap between groups (Figure 3f). The same analyses were conducted for rates-of-change in body fixation (Figures 3g–i and 3j–l). While the area under each receiver operating characteristic (ROC) curve is smaller (as expected) for the internal validations (3f, 3l) as compared with estimates based on known diagnostic outcomes (3c, 3i), the 95% confidence intervals clearly indicate less overlap than expected by chance.
As an external validation, we used the same technique to test 6 male infants who were not part of the original sample. Two of the six children had reached the age of 36 months, with confirmed ASD diagnosis, while 4 of the children were low-risk recruits, now at least 22 months of age, with no clinical concerns of ASD. In relation to the original sample’s change in eye and body fixation (Figure 3m), these 6 independent test cases show similar trajectories within the first 6 months (Figure 3n). While this validation set is small, the probability of obtaining all 6 of these results in the predicted direction by chance alone is P = 0.0156 (equal to the chance of correctly predicting the outcome, 0.5, on each of 6 occasions, 0.56).
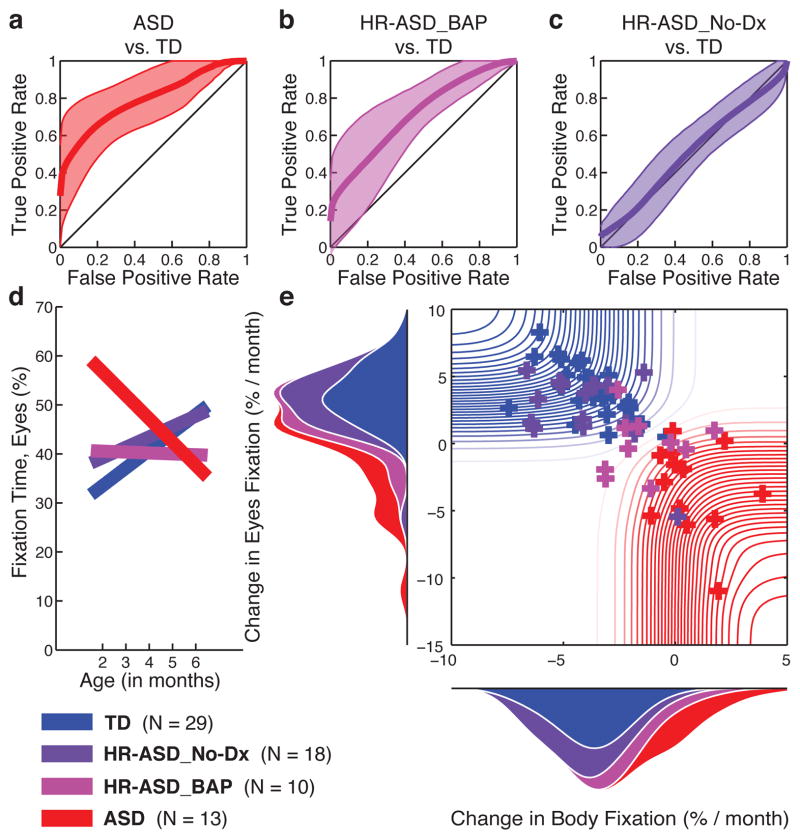
Having observed these differences between clearly-defined extremes of social functioning at outcome (ASD and TD), we then analysed data from the remaining high-risk males. These siblings were identified clinically as either unaffected at 36 months (HR-ASD_No-Dx) or as exhibiting subthreshold signs of ASD (also called the “Broader Autism Phenotype”, or BAP26, abbreviated here as HR-ASD_BAP). For change in eye fixation between 2 and 6 months of age, ROC curves in Figures 4a, 4b, and 4c quantify the overlap in measures relative to outcome (95% confidence intervals by LOOCV). The behaviour of unaffected siblings (HR-ASD_NoDx) is highly overlapping with that of TD children (4c), while the behaviour of infants later diagnosed with ASD (4a), and that of infants with subthreshold signs (4b), clearly differs from typical controls.
Figure 4. Visual fixation between 2 and 6 months relative to outcome levels of affectedness.
At 36 months, infant siblings at high-risk for ASD were confirmed either as having ASD; as having subthreshold signs of ASD (HR-ASD_BAP, Broader Autism Phenotype); or as unaffected (HR-ASD_No-Dx). ROC curves in a, b, and c, quantify overlap in measures of change in eye fixation relative to outcome (95% CI by LOOCV). The behaviour of unaffected siblings is overlapping with that of TD children, c, while the behaviour of infants later diagnosed with ASD, a, and that of infants with subthreshold signs, b, differs significantly from typical children. d, Eye fixation varies systematically across all outcome groups, with significant interaction of Outcome by Age (by HLM). e, Individual change in eye and body fixation for N=70 infant males (N=29 TD, 25 original sample, 4 external validation; N=13 ASD, 11 original sample, 2 external validation; N=18 HR-ASD_No-Dx; and N=10 HR-ASD_BAP). Probability density functions on ordinate and abscissa indicate distribution of measures for each outcome group.
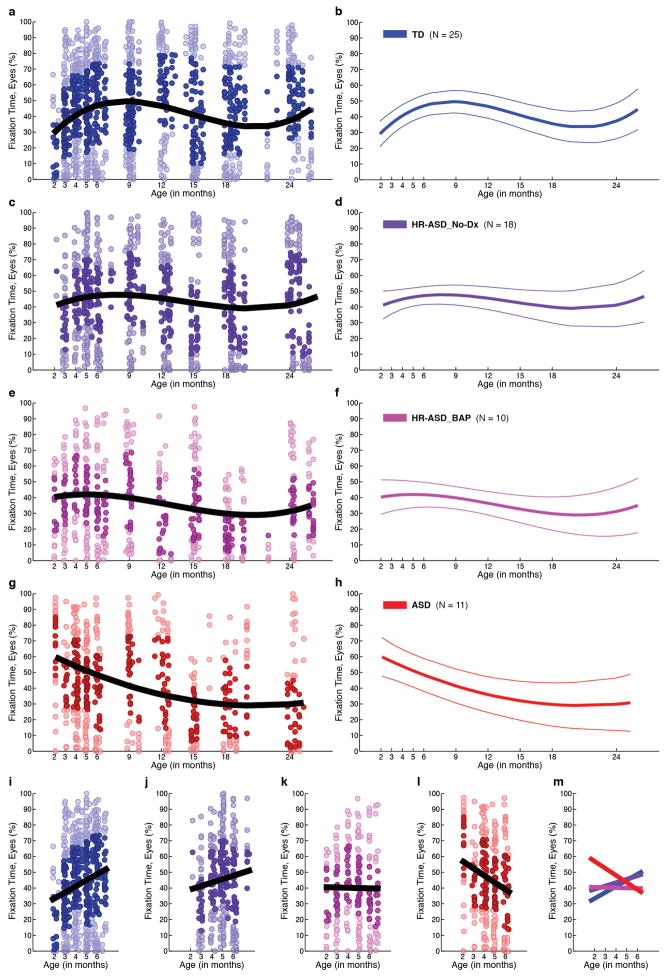
We also considered these data as part of a larger continuum (Figure 4d and Extended Data Figure 6). Graded developmental trajectories are evident in the significant interaction of Outcome [4 levels] by Age: F3,133.006 = 6.95, P <0.001 (HLM). TD children (blue) show strongly increasing eye fixation. Unaffected siblings (dark purple) also show increasing eye fixation. Siblings with subthreshold symptoms show neither increasing nor decreasing eye fixation (light purple), and infants later diagnosed with ASD show declining eye fixation (red).
Extended Data Figure 6. Developmental change in visual fixation on the eyes relative to outcome levels of affectedness.
Percent fixation on eyes for (a) typically-developing infants; (c) infants at high-risk for ASD who showed no evidence of ASD at 36 months (HR-ASD_No-Dx); (e) infants at high-risk for ASD who showed some sub-thresholds signs of the Broader Autism Phenotype at 36 months but did not meet clinical best estimate diagnosis of ASD (HR-ASD_BAP); and (g) infants diagnosed with ASD at 36 months. External validation participants not included (in contrast to Figure 4 in main text). Darkly shaded data markers indicate the interquartile range (spanning 25th to 75th percentiles). Black lines indicates mean growth curves via hierarchical linear modeling (HLM). Plots in b, d, f, and h show mean fixation curves with 95% CI. Plots i–l highlight the first 6 months of life in each group, and m plots the relationship across groups.
In Figure 4e, individual results are plotted dimensionally, across the full spectrum of social ability to disability. The probability density functions on ordinate and abscissa indicate whole sample distributions for change in eye and body fixation. The data show gradations from TD children to those diagnosed with ASD, with children with ASD showing the largest decline in eye fixation as well as the greatest increase in body fixation. Values for unaffected siblings are fully overlapping with those of TD children, while children with BAP outcomes show intermediary behaviours.
In summary, the current results indicate that the development of infants later diagnosed with ASD differs from that of their typical peers by 2–6 months of age. These results, while still limited in sample size, document the derailment of skills that would otherwise guide typical socialization10,17,18, and this early divergence from normative experience suggests a means by which diverse genetic liabilities are instantiated, developmentally, into a spectrum of affectedness. Given the interdependence9 of individual experience with brain structure and function, and with gene expression and methylation, these results suggest how a single individual’s outcome will be shaped not only by initial genotypic vulnerabilities, but also by the atypical experiences that arise as a consequence of those vulnerabilities, instantiating a wide spectrum of affectedness.
In children later diagnosed with ASD, eye looking shows mean decline by at least 2 months. To our surprise, however, those early levels of eye looking appear to begin at normative levels. This contradicts prior hypotheses of a congenital absence of social adaptive orientation2,3,17,18 and suggests instead that some social-adaptive behaviors may initially be intact in newborns later diagnosed with ASD. If confirmed in larger samples, this would offer a remarkable opportunity for treatment: predispositions that are initially intact suggest a neural foundation that might be built upon, offering far more positive possibilities than if that foundation were absent from the outset. Equally exciting, these data fit well within the framework of long-studied animal models of the neural systems subserving filial orientation and attachment28: they highlight a narrow period for future investigation, spanning the transition from experience-expectant to experience-dependent mechanisms27. A critical next step will be to measure densely sampled developmental change in gene expression and brain growth, in tandem with detailed quantification of behaviour; in short, measuring gene-brain-behaviour growth charts of infant social engagement to understand the developmental pathogenesis of social disability29.
Methods
Stimuli
Children were shown video scenes of a female actor looking directly into the camera and playing the role of a caregiver: entreating the viewing toddler by engaging in childhood games (e.g., playing pat-a-cake) (Figures 1a and 1b in main text; also described in 2). The actors were filmed in naturalistic settings that emulated the real-world environment of a child’s room, with pictures, shelves of toys, and stuffed animals. We used naturalistic stimuli (e.g., dynamic rather than static stimuli, and realistic rather than abstracted or reductive scenes) in light of past research indicating that older children with ASD exhibit large discrepancies between their actual adaptive behavior skills in the real world relative to their cognitive potential in more structured situations30; exhibit larger between-group effect sizes for face-processing deficits with dynamic relative to static stimuli31; and exhibit marked difficulties when attempting to generalize skills from structured, rote environments (in which the skills were initially learned) to environments that are open-ended and rapidly-changing4. At each data collection session, videos were drawn in pseudo-random order from a pool of 35 total. Both the “caregiver” video stimuli analyzed here (35 videos), as well as videos of infant and toddler interaction (“peer-play” videos, as described in reference32, for another set of experiments not yet analyzed) were presented. Video stimuli were presented in pseudo-random order. There were no between-group differences in duration of data collected per child, either in total (t34 = 0.685, P = 0.498) or specifically for the caregiver stimuli (t34 = 0.205, P = 0.839). Successful data collection was achieved in 80.2% of all testing sessions; failed data collection sessions occurred as the result of an infant falling asleep, crying, or becoming too fussy to watch the videos. Reasons for failure were recorded in data collection reports for each session and maintained in a database; no systematic difference in reasons for failure could be discerned between the two groups. At each data collection session, approximately 30% of the videos shown to a child were novel, while the remaining 70% were repeated from previous sessions (from both the immediately preceding session as well as from any prior session beginning at month 2 onwards). This balanced the need for repeated measures to the same stimulus video with the need for novelty. To test for learning effects of repeated presentations, we compared end-stage results at 24 months in this longitudinal sample with previous results in a cross-sectional sample at that age (males from 2): tested by 2×2 between-subjects factorial ANOVA, there was no main effect of cohort, longitudinal vs. cross-sectional (F1,57 =0.052, P =0.820), but there was a significant main effect of diagnosis (ASD vs. TD, F1,57 = 6.29, P =0.015).
Caregiver videos were presented as full-screen audiovisual stimuli on a 20-inch computer monitor (refresh rate of 60 Hz noninterlaced); in 32-bit color; at 640×480 pixels in resolution; at 30 frames per second; with mono channel audio sampled at 44.1 kHz. Stimuli were sound and luminosity equalized, and were piloted prior to the start of study in order to optimize engagement for typical infant and toddler viewers. Regions of Interest (Eye, Mouth, Body, & Object) were bitmapped in all frames of video (Figure 1c in main text). Average sizes of the regions-of-interest are given in Extended Data Table 1c.
Extended Data Table 1.
Parameter Values and Regions-of-Interest.
a, Table of parameter values for hierarchical linear modeling. b, Table of parameter values for PACE/FDA smoothing bandwidths, eigenfunctions, and fraction of variance explained (FVE). c, Table of sizes of regions-of-interest in video stimuli.
| a
| ||||||
|---|---|---|---|---|---|---|
| Model | Group | Intercept (s.e.m.) | Age coefficient B1 (s.e.m.) | Age coefficient B2 (s.e.m.) | Age coefficient B3 (s.e.m.) | |
| Eyes | 3rd order | TD | 13.410 (19.009) | 9.6878 (4.5920) | −0.7919 (0.3801) | 0.0179 (0.0092) |
| 3rd order | ASD | 66.979 (8.665) | −3.5843 (2.0843) | 0.0817 (0.1726) | 0.0001 (0.0042) | |
| Mouth | 2nd order | TD | 11.411 (13.269) | 3.6110 (1.6954) | −0.0917 (0.0537) | n.a. |
| 2nd order | ASD | −6.596 (6.081) | 6.7058 (0.7762) | −0.1977 (0.0244) | n.a. | |
| Body | Inverse | TD | 6.872 (5.162) | 45.6250 (28.3084) | n.a. | n.a. |
| Inverse | ASD | 13.450 (2.358) | 12.8734 (12.9730) | n.a. | n.a. | |
| Object | 3rd order | TD | 32.772 (8.973) | −5.7665 (2.3918) | 0.3570 (0.1980) | −0.0068 (0.0048) |
| 3rd order | ASD | 17.366 (4.100) | −1.4479 (1.0913) | 0.0201 (0.0904) | 0.0014 (0.0022) | |
| b
| |||||
|---|---|---|---|---|---|
| Group | Wμ1 | WG2 | Eigenfunctions3 | FVE | |
| Eyes | TD | 5.7045 | [2.5422, 2.5422] | 2 | 96.48%, 3.49% |
| ASD | 6.3868 | [2.2335, 2.2335] | 3 | 82.72%, 10.66%, 6.18% | |
| Mouth | TD | 5.6800 | [2.5431, 2.5431] | 2 | 94.06%, 5.93% |
| ASD | 6.3879 | [2.2339, 2.2339] | 3 | 69.89%, 20.95%, 8.98% | |
| Body | TD | 5.6729 | [2.5415, 2.5415] | 2 | 91.75%, 8.19% |
| ASD | 6.3894 | [2.2339, 2.2339] | 2 | 98.71%, 1.28% | |
| Object | TD | 5.6935 | [2.5433, 2.5433] | 2 | 91.14%, 8.85% |
| ASD | 6.3883 | [2.2331, 2.2331] | 2 | 95.25%, 4.25% | |
| c
| ||||
|---|---|---|---|---|
| Eyes | Mouth | Body | Object | |
| Horizontal1 | 8.04° (0.46) | 7.71° (0.49) | 25.11° (2.70) | 31.99° (0.05)2 |
| Vertical1 | 6.91° (0.44) | 5.72° (0.59) | 21.71° (0.73) | 23.94° (0.49)2 |
s.e.m. = standard error measure
Bandwidth for mean function, Wμ, selected by generalized cross-validation.
Bandwidth for covariance surface, WG, selected by generalized cross-validation.
Number of eigenfunctions selected by Akaike Information Criterion (AIC).
FVE = Fraction of Variance Explained
Data are given as mean (SD) in degrees of visual angle.
Object ROIs generally spanned the full horizontal and vertical extent of the background in all video images, excepting cases of some body and hand gestures, as shown in Figure 1 in the main text. The average minimum visual area subtended by any portion of the object ROI is equal to the difference between object and body ROIs.
Experimental Setting and Equipment
Two settings for eye-tracking data collection were utilized in this study. One eye-tracking laboratory was optimized for infants between the ages of 2 and 6 months, and a second setting was optimized for infants and toddlers from 9 to 36 months. The primary distinction between the two settings was the use of a reclined bassinet for younger infants versus the use of a car seat for older infants and toddlers. The eye-tracking data collection hardware and software were identical in both settings, and all aspects of automated stimuli presentation, data collection, and analysis were also identical; these have previously been described in 2. To obtain optimal eye imaging with infants in the reclined bassinet, eye-tracking cameras and infrared light source were concealed within a teleprompter. In the toddler lab, eye-tracking cameras were mounted beneath a computer display monitor. The display monitor was mounted flush within a wall panel. In both labs, eye-tracking was accomplished by a video-based, dark pupil/corneal reflection technique with hardware and software created by ISCAN, Inc. (Woburn, MA, USA), with data collected at 60 Hz. In both labs, audio was played through a set of concealed speakers. Infants were placed in a modified travel bassinet, mounted on a table that was raised and lowered at the beginning of each session to standardize the positioning of the infant’s eyes relative to the display monitor. In the toddler lab, children were seated in a car seat in front of the computer screen on which the videos were presented. As in the infant lab, the car seat was raised and lowered so as to standardize the position of each child’s eyes relative to the display monitor.
Experimental Protocol
Infants and toddlers were accompanied at all times by a parent or primary caregiver. To begin the experimental session, the participant (infant or toddler) and caregiver entered the laboratory room while a children’s video (Baby Mozart, Elmo, etc.) played on the display monitor. The child was buckled into the bassinet or car seat. Eye position relative to display monitor was then standardized for each child by adjusting the seat or bassinet location. Viewers’ eyes were 28 inches (71.12 centimeters) from the display monitor, which subtended an approximately 24° × 32° portion of each viewer’s visual field. Lights in the room were dimmed so that only content presented on the display monitor could be easily seen. During testing, both experimenter and parent were out of view from the child but were able to monitor the child at all times by means of an eye-tracking camera and by a second video camera that filmed a full-body image of the child.
Visual fixation patterns were measured with eye-tracking hardware (ISCAN, Inc). To begin the process of data collection, after the child was comfortably watching the children’s video, calibration targets were presented onscreen by the experimenter. This was done via software that paused the playing video and presented a calibration target on an otherwise blank background. A five-point calibration scheme was used, presenting spinning and/or flashing points of light as well as cartoon animations, ranging in size from 1° to 1.5° of visual angle, all with accompanying sounds. For the infants, calibration stimuli began as large targets, >= 10° in horizontal and vertical dimensions, which then shrank via animation to their final size of 1° to 1.5° of visual angle. The calibration routine was followed by verification of calibration in which more animations were presented at five on-screen locations. Throughout the remainder of the testing session, animated targets (as used in the calibration process) were shown between experimental videos to measure drift in calibration accuracy. In this way, accuracy of the eye-tracking data was verified before beginning experimental trials and was then repeatedly checked between video segments as the testing continued. In the case that drift exceeded 3°, data collection was stopped and the child was recalibrated before further videos were presented. For additional details and measures of calibration accuracy, please see Supplementary Materials and Extended Data Figure 8.
Analysis of Eye Movements
Analysis of eye movements and coding of fixation data were performed with software written in MATLAB (MathWorks). The first phase of analysis was an automated identification of non-fixation data, comprising blinks, saccades, and fixations directed away from the stimuli presentation screen. Saccades were identified by eye velocity using a threshold of 30°/second33. We tested the velocity threshold with the 60 Hz eye-tracking system described above and, separately, with an eye-tracking system collecting data at 500 Hz (SensoMotoric Instruments GmbH, Teltow, Germany). In both cases saccades were identified with equivalent reliability as compared with both hand coding of the raw eye position data and with high-speed video of the child’s eyes. Blinks were identified as described in 32. Off-screen fixations (when a participant looked away from the video) were identified by fixation coordinates beyond the stimuli presentation screen.
Eye movements identified as fixations were coded into 4 regions of interest that were defined within each frame of all video stimuli: eyes, mouth, body (neck, shoulders, and contours around eyes and mouth, such as hair), and object (surrounding inanimate stimuli) (Figure 1c, main text). The regions of interest were hand traced for all frames of the video and were then stored as binary bitmaps (via software written in MATLAB; MathWorks Inc, Natick, Massachusetts). Automated coding of fixation time to each region of interest then consisted of a numerical comparison of each child’s coordinate fixation data with the bitmapped regions of interest.
Longitudinal Data Analyses
To examine the longitudinal development of social visual attention, for individual participants and across both ASD and TD groups, we used Functional Data Analysis (FDA)21 and Principal Analysis by Conditional Expectation (PACE)22,34–36 (main text, Figure 1d and 1e for example individual fits, and Figure 2 for group results; also Extended Data Figure 7). Although we focused on FDA/PACE in order to overcome limitations inherent to cross-sectional analyses, as well as some limitations of traditional growth curve analyses, we repeated all our analyses using hierarchical linear modeling (HLM) (Extended Data Figures 4,5,6 and Extended Data Table 1b). Although the two methods yielded the same pattern of significant between-group differences (described in main text and in Supplementary Materials), we favour the FDA approach because traditional growth curve analyses can be confounded by individual differences in developmental timescale, and also because traditional growth curve analyses often require correct assumption of an underlying parametric or semi-parametric model (rather than allowing this to be determined in a data-driven fashion37). In contrast, FDA methods determine curve shape empirically22,35 and model statistical variation in both time scale as well as amplitude34,36. The PACE method of FDA is also designed specifically to overcome a common problem for longitudinal studies: non-uniform sampling particularly in the case of missing values22,35. PACE characterizes statistical ensembles of irregularly-sampled longitudinal data in terms of entire curve shapes on the basis of conditional expectation. This maximizes the ability to detect patterns of correlation across trajectories and minimizes the impact of data sampled at discrete intervals with varying number of measurements per participant36. This approach significantly improves the detection of common features in trajectory shape.
As noted above, as a methodological comparison to FDA, we also analysed the data using hierarchical linear modeling23. The presence of linear and curvilinear (quadratic and cubic) patterns was assessed for Fixation relative to Age via the following model: Fixationij = interceptj + dij + B1j (Ageij) + B2j (Ageij)2 + B3j (Ageij)3 + eij; where dij represents the normally distributed random effect modeling within-subject dependence by group; eij represents the normally distributed residual error; and the B1, B2, and B3 coefficients indicate how fixation levels change with age and by group. Initial evaluation of the data indicated an inverse relationship between body fixation and age, and was therefore also assessed with the following model: Body Fixationij = di + interceptj + (B1j/Ageij) + eij. In all cases, the intercept and B terms were modeled as fixed effects but were allowed to vary by group. Degrees of freedom were calculated by the Satterthwaite method (equal variances not assumed). Positively skewed data (eg, body and object fixation trials) were log-transformed; plots show untransformed data. F tests and log-likelihood ratios were used to determine whether a linear, quadratic, cubic, or inverse relationship best described the data. Growth curves from hierarchical linear modeling are plotted in Extended Data Figures 4 and 5, and the regression parameters for Eyes, Mouth, Body, and Object are given in Extended Data Table 1a.
Throughout our analyses, PACE parameters were selected by generalized cross-validation22. Mean fixation curves from Figure 2, main text, together with the effects of adding or subtracting principal component functions (following the convention of Ramsay & Silverman21), smoothing kernel bandwidths, and fractions of variance explained per principal component can be found in Extended Data Figure 7 and Table 1b). The Akaike Information Criterion, with likelihood of measurements conditional on estimated random coefficients, was applied for selecting the number of principal components 22. Derivatives were computed by the PACE-QUO method35.
Supplementary Material
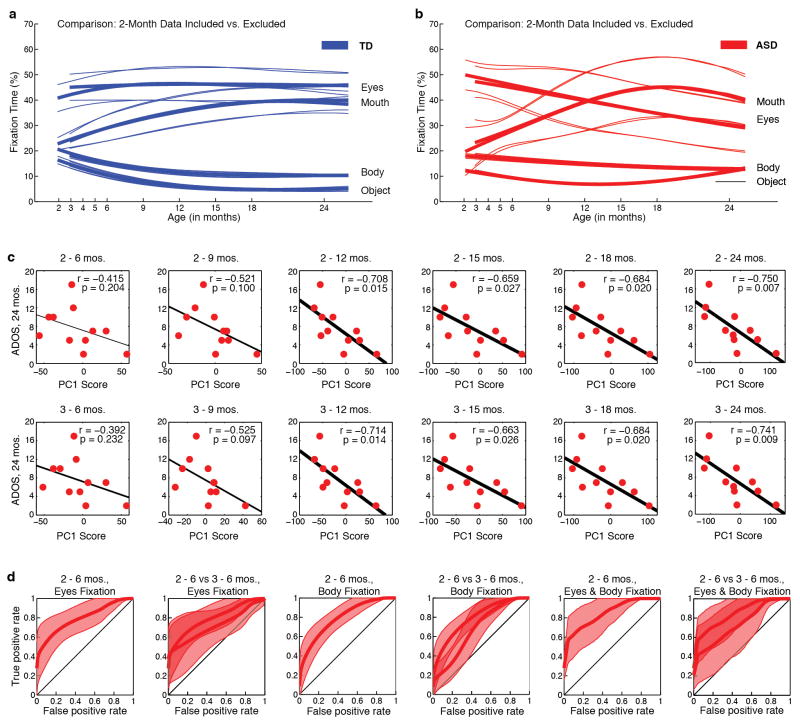
Extended Data Figure 9. Growth charts of social visual engagement and their relationship to dimensional and categorical outcome, with data from month 2 included versus excluded.
Comparison of growth curves with month 2 data included or excluded for a, Typically-Developing males (TD, in blue) and, b, for males with an autism spectrum disorder (ASD, in red). Exclusion of the month-2 data does not significantly alter the trajectories themselves, nor does it alter the between-group comparisons. c, Outcome levels of social disability (as measured by ADOS social-affect score) as a function of decline in eyes fixation (measured as eyes PC1 score, as in Extended Data Figure 1) using subsets of the longitudinal data (i.e., decline in eye fixation using only data collected between months 2–6 or 3–6, excluding data thereafter; then between months 2–9 or 3–9, etc.). In top row, month 2 data are included; in bottom row, month 2 data are excluded. When month 2 data are included or excluded, decline in eye fixation still significantly predicts future outcome; this relationship reaches trend level significance by 3–9 months (P = 0.097), and is statistically significant thereafter (with r = −0.714, P = 0.014 for 3–12 months). d, ROC curves for classification of infants with confirmed ASD outcomes relative to typically-developing infants. Using leave-one-out cross-validation, plots show mean and 95% confidence intervals for classification based on change in eye fixation (first two plots from left), change in body fixation (middle two plots), and change in both eye and body fixation (last two plots at right) between 2 and 6 months of age. Plots show ROC classification using data from months 2–6 and for the comparison of months 2–6 relative to months 3–6. With month-2 data excluded, confidence intervals for the cross-validated ROC curves increase in size (as expected, in proportion to the reduction in data by excluding month 2), but the curves remain significantly different from chance, and the ROC curves with month 2 data included or excluded are not significantly different from one another.
Acknowledgments
This work was supported by grants from the Simons Foundation and the National Institute of Mental Health (R01 MH083727). Additional support was provided by the Marcus Foundation, the Whitehead Foundation, and the Georgia Research Alliance. We wish to thank the families and children for their time and participation. We also wish to thank Jessica Jones, Andrea Trubanova, Jeremy Borjon, Jenn Moriuchi, Kate Rice, Jessie Northrup, Laura Edwards, Jennings Xu, Sarah Shultz, Anna Krasno, Casey Zampella, Kelley Knoch, David Lin, Katelin Carr, and Amanda Blank for their assistance in data collection and analysis; Peter Lewis, Jose Paredes, Philip Gorrindo, and Marilyn Ackermann for assistance in designing and building lab hardware and software; Gordon Ramsay and Courtney McCracken for discussions of data analysis and statistics; Irene Zilber, Amy Margolis, Daniela Blum, Martha Dye, Deanna Simeone, Amanda Smith, and Kerry O’Loughlin for project supervision, coordination, and data collection; Tammy Babitz for administrative support; and Kasia Chawarska, Celine Saulnier, Suzanne Macari, Rhea Paul, Amy Carney, Tina Goldsmith, Amanda Steiner, Grace Gengoux, Diane Goudreau, Erin Loring, James McGrath, and Abha Gupta for their contributions to the clinical characterization of the samples.
Footnotes
Author Contributions: W.J. and A.K. developed the initial idea and design of the study, interpreted data, wrote the final manuscript, had full access to all of the data in the study and take responsibility for the integrity of the data and the accuracy of the data analysis. W.J. and A.K. performed final revision of the manuscript for intellectual content. A.K. supervised participant characterization. W.J. supervised technological developments and technical aspects of experimental procedure, data acquisition, and analysis.
Competing Interests Statement The authors declare that they have no competing financial interests.
References
- 1.Grice SJ, et al. Neural correlates of eye-gaze detection in young children with autism. Cortex. 2005;21:342–353. doi: 10.1016/s0010-9452(08)70271-5. [DOI] [PubMed] [Google Scholar]
- 2.Jones W, Carr K, Klin A. Absence of preferential looking to the eyes of approaching adults predicts level of social disability in 2-year-olds with autism spectrum disorder. Arch Gen Psych. 2008;65(8):946–954. doi: 10.1001/archpsyc.65.8.946. [DOI] [PubMed] [Google Scholar]
- 3.Kanner L. Autistic disturbances of affective contact. Nerv Child. 1943;2:217–250. [PubMed] [Google Scholar]
- 4.Volkmar FR, Lord C, Bailey A, Schultz RT, Klin A. Autism and pervasive developmental disorders. J Child Psychol Psychiatry. 2004;45:1–36. doi: 10.1046/j.0021-9630.2003.00317.x. [DOI] [PubMed] [Google Scholar]
- 5.Lord C, Rutter M, DiLavore P, Risi S. ADOS Toddler Module: ADOS-T: Manual. Western Psychological Services; Los Angeles, CA: 2008. [Google Scholar]
- 6.Centers for Disease Control and Prevention. Prevalence of autism spectrum disorders – Autism and Developmental Disabilities Monitoring Network 14 Sites United States 2008. Surveillance Summaries. 2012;61(SS03):1–19. [PubMed] [Google Scholar]
- 7.Constantino JN, Todorov A, Hilton C, Law P, Zhang Y, Molloy E, Fitzgerald R, Geschwind D. Autism recurrence in half siblings: strong support for genetic mechanisms of transmission in ASD. Mol Psychiatry. 2013;8(2):137–8. doi: 10.1038/mp.2012.9. [DOI] [PubMed] [Google Scholar]
- 8.State MW, Sestan N. Neuroscience: The emerging biology of autism spectrum disorders. Science. 2012;227(6100):1301–3. doi: 10.1126/science.1224989. [DOI] [PMC free article] [PubMed] [Google Scholar]
- 9.Oyama S. The Ontogeny of Information: Developmental Systems and Evolution, Second Edition. Duke University Press; Durham, NC: 2000. [Google Scholar]
- 10.Jones W, Klin A. Heterogeneity and homogeneity across the autism spectrum: the role of development. J Am Acad Child Adolesc Psychiatry. 2009;48(5):471–3. doi: 10.1097/CHI.0b013e31819f6c0d. [DOI] [PubMed] [Google Scholar]
- 11.DeCasper AJ, Fifer WP. Of human bonding: newborns prefer their mothers’ voices. Science. 1980;208(4448):1174–6. doi: 10.1126/science.7375928. [DOI] [PubMed] [Google Scholar]
- 12.Haith MM, Bergman T, Moore MJ. Eye contact and face scanning in early infancy. Science. 1977;198(4319):853–855. doi: 10.1126/science.918670. [DOI] [PubMed] [Google Scholar]
- 13.Johnson MH. Subcortical face processing. Nat Rev Neurosci. 2005;6(10):766–774. doi: 10.1038/nrn1766. [DOI] [PubMed] [Google Scholar]
- 14.Simion F, Regolin L, Bulf H. A predisposition for biological motion in the newborn baby. Proc Natl Acad Sci USA. 2008;105(2):809–13. doi: 10.1073/pnas.0707021105. [DOI] [PMC free article] [PubMed] [Google Scholar]
- 15.Johnson M. Functional brain development in humans. Nat Rev Neurosci. 2001;2:475–483. doi: 10.1038/35081509. [DOI] [PubMed] [Google Scholar]
- 16.Rosa Salva O, Farroni T, Regolin L, Vallortigara G, Johnson MH. The evolution of social orienting: evidence from chicks (Gallus gallus) and human newborns. PLoS One. 2011;6(4):e18802. doi: 10.1371/journal.pone.0018802. [DOI] [PMC free article] [PubMed] [Google Scholar]
- 17.Klin A, Jones W, Schultz RT, Volkmar F. The enactive mind – from actions to cognition: lessons from autism. Philos Transact Bio Sci. 2003;358:345–360. doi: 10.1098/rstb.2002.1202. [DOI] [PMC free article] [PubMed] [Google Scholar]
- 18.Klin A, Lin DJ, Gorrindo P, Ramsay G, Jones W. Two-year-olds with autism fail to orient towards human biological motion but attend instead to non-social, physical contingencies. Nature. 2009;459:257–261. doi: 10.1038/nature07868. [DOI] [PMC free article] [PubMed] [Google Scholar]
- 19.Ozonoff S, et al. Recurrence risk for autism spectrum disorders: a Baby Siblings Research Consortium study. Pediatrics. 2011;128(3):e488–95. doi: 10.1542/peds.2010-2825. [DOI] [PMC free article] [PubMed] [Google Scholar]
- 20.Chawarska K, Klin A, Paul R, Volkmar FR. Autism spectrum disorders in the second year: stability and change in syndrome expression. J Child Psychol Psych. 2007;48 (2):128–138. doi: 10.1111/j.1469-7610.2006.01685.x. [DOI] [PubMed] [Google Scholar]
- 21.Ramsay JO, Silverman BW. Functional Data Analysis. 2. Springer - Verlag; 2006. [Google Scholar]
- 22.Yao F, Müller HG, Wang JL. Functional data analysis for sparse longitudinal data. J Am Stat Assoc. 2005;100(470):577–590. [Google Scholar]
- 23.Singer JD, Willett JB. Applied Longitudinal Data Analysis. Oxford University Press; New York, NY: 2003. [Google Scholar]
- 24.Mosteller F, Tukey JW. Data Analysis and Regression. Addison-Wesley; Reading, MA: 1977. p. 37. [Google Scholar]
- 25.Stone M. Cross-validatory choice and assessment of statistical predictions. J Roy Stat Soc Ser B. 1974;36:111–147. [Google Scholar]
- 26.Steer CD, Golding J, Bolton PF. Traits contributing to the autistic spectrum. PLoS One. 2010;5(9):e12633. doi: 10.1371/journal.pone.0012633. [DOI] [PMC free article] [PubMed] [Google Scholar]
- 27.Johnson MH, Karmiloff-Smith A. Neuroscience perspectives on infant development. In: Bremner G, Slater A, editors. Theories of infant development. Malden, MA: Blackwell; 2004. pp. 121–141. [Google Scholar]
- 28.Horn G, Nicol AU, Brown MW. Tracking memory’s trace. Proc Natl Acad Sci USA. 2001;98(9):5282–5287. doi: 10.1073/pnas.091094798. [DOI] [PMC free article] [PubMed] [Google Scholar]
- 29.Abrahams BS, Geschwind DH. Advances in autism genetics: on the threshold of a new neurobiology. Nat Rev Genet. 2008;9:341–355. doi: 10.1038/nrg2346. [DOI] [PMC free article] [PubMed] [Google Scholar]
- 30.Klin A, Saulnier CA, Sparrow SS, Cicchetti DV, Volkmar FR, Lord C. Social and communication abilities and disabilities in higher functioning individuals with autism spectrum disorders. J Autism Dev Disord. 2007;37(4):748–59. doi: 10.1007/s10803-006-0229-4. [DOI] [PubMed] [Google Scholar]
- 31.Speer LL, Cook AE, McMahon WM, Clark E. Face processing in children with autism: effects of stimulus contents and type. Autism. 2007;11(3):265–77. doi: 10.1177/1362361307076925. [DOI] [PubMed] [Google Scholar]
- 32.Shultz S, Klin A, Jones W. Inhibition of eye blinking reveals subjective perceptions of stimulus salience. Proc Natl Acad Sci USA. 2011;108(52):21270–5. doi: 10.1073/pnas.1109304108. [DOI] [PMC free article] [PubMed] [Google Scholar]
- 33.Leigh RJ, Zee DS. The Neurology of Eye Movements. 3. Vol. 94. Oxford, England: Oxford University Press; 1999. [Google Scholar]
- 34.Hall P, Müller HG, Yao F. Estimation of functional derivatives. Ann Stat. 2009;37:3307–3329. [Google Scholar]
- 35.Liu B, Müller HG. Estimating derivatives for samples of sparsely observed functions, with application to online auction dynamics. J Am Stat Assoc. 2008;104(486):704–717. [Google Scholar]
- 36.Tang R, Müller HG. Pairwise curve synchronization for functional data. Biometrika. 2008;95:875–889. [Google Scholar]
- 37.Burchinal M, Nelson L, Poe M. Growth curve analysis: An introduction to various methods for analyzing longitudinal data. In: McCartney K, Burchinal M, Bub K, editors. Best Practices in Quantitative Methods for Developmentalists. Monogr Soc Res Child Dev. 3. Vol. 71. 2006. pp. 65–87. [DOI] [PubMed] [Google Scholar]
Associated Data
This section collects any data citations, data availability statements, or supplementary materials included in this article.


