Abstract
1α,25-Dihydroxyvitamin D3 [1α,25(OH)2D3] is a steroid hormone derived from circulating 25(OH) vitamin D [25(OH)D] with chemopreventive effects in colorectal cancer. 1α,25(OH)2D3 acts through transcriptional mechanisms; however, our understanding of vitamin D transcriptional responses in the colon is derived from studies in transformed cancer cell lines which may not represent responses in normal healthy tissue. Here, we describe the optimization of an ex vivo culture model using primary colonic biopsy samples for studying short-term transcriptional response induced by 1α,25(OH)2D3 and 25(OH)D treatment. Colon biopsy samples from healthy subjects were maintained in primary culture and treated in parallel with 100 nM 1α,25(OH)2D3 or 62.5 nM 25(OH)D and vehicle control (ethanol). Viability was assessed using histology and enzymatic assays. Genome-wide transcriptional responses to 1α,25(OH)2D3 were assessed and expression of 25(OH)D targets CYP27B1 and CYP24A1 were measured by real time PCR. We show that ex vivo culture of colonic tissue remains viable for up to 8 h. The largest number of differentially expressed genes in response to 1α,25(OH)2D3 was noted after 6 h (n = 120). As proof of concept, the top upregulated gene was CYP24A1, a well-established vitamin D-responsive gene. With 25(OH)D treatment, mRNA expression of CYP27B1 was significantly increased after 1 h, while expression of CYP24A1 was greatest at 8 h. Ex vivo culture can be used to assess short-term transcriptional responses to 1α,25(OH)2D3 and 25(OH)D in primary tissue from human colon. Future studies will address interindividual differences in transcriptional responses.
Keywords: vitamin D, transcriptional response, primary tissue culture, colon
vitamin d is a steroid hormone that plays important roles in normal physiology notably in the human colon. The biologically active form, 1α,25-dihydroxyvitamin D3 [1α,25(OH)2D3], is hydroxylated from circulating inactive 25(OH) vitamin D [25(OH)D] in the kidneys by the enzyme CYP27B1. Extrarenal conversion of inactive to active vitamin D also has been increasingly recognized (25). Indeed, colonic epithelium possesses local CYP27B1 enzyme activity that may contribute to vitamin D's anticarcinogenic tissue-specific effects (2, 8, 9, 2, 19, 20). 1α,25(OH)2D3 regulates gene expression by binding and activating the vitamin D receptor (VDR) to affect transcription of a variety of direct and indirect target genes. Among the inducible target genes is CYP24A1, the gene coding for the 24-hydroxylase enzyme which leads to catabolism of 1α,25(OH)2D3.
In the colon, 1α,25(OH)2D3 has numerous normal physiological effects including inhibition of cell proliferation and induction of differentiation that likely contribute to its chemoprotective effects against colorectal cancer (CRC) (4, 15). In addition, 1α,25(OH)2D3 modulates the immune system and has been shown to be effective in attenuation of endotoxin induced inflammatory response in the colon (4). Given that 1α,25(OH)2D3 works primarily by altering target gene expression (23), it is possible that differential transcriptional responses to either active and/or precursor to vitamin D could underlie different treatment responses and disease susceptibility between individuals and populations. Uncovering such differences may elucidate pathways underlying individual effects of vitamin D status on disease susceptibility and could have implications for tailoring vitamin D therapies for chemoprevention in the future.
Previous short-term treatment studies have been carried out mostly in CRC cell lines (11, 14) and have identified a number of differentially expressed genes in response to 1α,25(OH)2D3 in malignant colonocytes. However, studies in cancer cell lines might not be applicable to normal colon tissue, which is the primary target for vitamin D chemoprevention. The approach presented in this work allows for the evaluation of healthy and nonimmortalized cells. Colonic biopsies obtained during colonoscopy are an attractive tissue source as they are easily obtained from both healthy and diseased subjects. To assess vitamin D responses in primary colon tissue, we have adapted an ex vivo culture system from Dame et al. (5) using biopsies obtained during screening colonoscopy. This approach can be used to assess transcriptional responses in the same individual under the same experimental conditions, thereby minimizing a variety of biological and environmental confounders such as genetics (e.g., single nucleotide polymorphisms), epigenetics, gut microbiome, diet and bioavailable serum vitamin D that could add noise to transcriptional profiles. Here, we demonstrate that colonic biopsies remain viable up to 8 h in culture and determine optimal conditions of 1α,25(OH)2D3 and 25(OH)D treatment for transcriptional profiling.
MATERIAL AND METHODS
Subjects
This study was approved by the University of Chicago Institutional Review Board.
Healthy subjects were recruited prior to undergoing colonoscopy for CRC cancer screening at the University of Chicago. None of the patients had a history of colonic disease. All patients underwent a bowel preparation for screening colonoscopy with polyethylene glycol 3350 and clear liquid diet for 24 h prior to the procedure. For the results shown in this paper, a total of 34 individual patients were included: 13 subjects for histology, 12 subjects for microarrays, 7 subjects for RT-PCR and 2 subjects for cell viability. In all patients, biopsies ∼5 mm3 were obtained at 20 cm from the anal verge using standard biopsy forceps (Boston Scientific, Natick, MA). Tissue was immediately placed in transport media then cultured and treated as detailed below.
Ex Vivo Culture of Colonic Biopsies
For culturing of colonic biopsies, we adapted a protocol developed by Dame et al. (5). We used the same transport and culture media. The culture media is composed of 80% CMRL Medium 1066 (Life Technologies, Carlsbad, CA) and 20% Ham's F-12 Nutrient Mixture (Life Technologies) supplemented with: 25 mM glucose (G8644; Sigma-Aldrich, St. Louis, MO), 2 mM GlutaMAX I (35050, Life Technologies), 0.1 μM sodium selenite (S5261, Sigma-Aldrich), 3 μM zinc sulfate (Z0251, Sigma-Aldrich), 145 nM menadone sodium bisulfate-vitamin K3 (M2518, Sigma-Aldrich), 45 nM (+)-α-tocopherol acetate (T1157, Sigma-Aldrich), 50 μg/ml gentamicin (Life Technologies), 3 μg/ml hydrocortisone (H0888, Sigma Aldrich), 50 ng/ml glucagon (G3157, Sigma-Aldrich), 0.5 ng/ml 3,3′,5-triiodo-l-thyonine sodium salt (T5516, Sigma-Aldrich), 10 μg/ml insulin from bovine pancreas (I6634, Sigma-Aldrich), and 50 μg/ml bovine pituitary extract (P1476, Sigma-Aldrich). A similar basal medium was used for ex vivo transportation of colon tissue lacking the supplementary components. It consists of a mixture of 80% CMRL Medium 1066 (Life Technologies), 20% Ham's F-12 Nutrient Mixture (Life Technologies), 25 mM glucose (G8644, Sigma-Aldrich), 2 mM GlutaMAX I (35050, Life Technologies), 50 μg/ml gentamicin (Life Technologies), 2.5 μg/ml amphotericin (Life Technologies). Biopsies were transported on ice, and tissue cultures were initiated within 1 h of collection.
Organ Culture
The tissue was removed from the transport media and washed three times with phosphate-buffered saline (PBS, Life Technologies). The biopsies were then transected into two equal parts of ∼2–5 mm3. In optimization experiments, it was found that transection of biopsies yielded improved histology (data not shown). Tissue was placed on a 100 μm cell strainer (352360; BD Falcon, Bedford, MA) in a 35 mm2 well of a six-well tissue culture plate (35 3046, BD Falcon). We added 6 ml of culture media to each well covering the cell strainers with ∼1 mm of medium while leaving the biopsies partially submerged. The plates were placed in an incubation chamber at 37°C for the allotted time per time course. Two different culturing environments were tested (5% CO2/95% air vs. 95% O2), but there was no difference in viability with hyperoxic conditions. Following treatment the tissue was washed twice with cold PBS and fixed in 10% buffered formalin for immunohistochemistry (IHC) or stored in RNAlater Solution (AM7024, Life Technologies) for future RNA isolation.
Vitamin D treatments
1α,25(OH2)D3.
Two time-course experiments were performed to determine the time point with the greatest number of differentially expressed genes in response to 1α,25(OH2)D3 treatment. Multiple staggered time course experiments were performed because only a limited number of biopsies could be obtained from each patient. In the time course 1, we cultured biopsies from six subjects with 100 nM 1α,25(OH)2D3 or ethanol (EtOH) in parallel for 2, 4, and 6 h. In time course 2, colonic biopsies from an additional six subjects were cultured with 100 nM 1α,25(OH)2D3 or EtOH in parallel for 6, 9, and 12 h. The 100 nM dose of 1α,25(OH)2D3 was selected based on a previous study in colon cancer cell lines (13) to allow for direct comparison.
25(OH)D.
To determine the time point where CYP27B1 expression was greatest with the precursor of active vitamin D 25(OH)D, four time points were included (15 min, 30 min, 1 h, and 90 min). Tissue in culture from three individuals was treated with 62.5 nM 25(OH)D. In four different subjects, CYP24A1 expression was also measured at 8 h after 62.5 nM 25(OH)D treatment. The dose of 25(OH)D was selected because this is equivalent to the mean serum 25(OH)D level from a population-based study in the US (6) and represents physiological conditions.
Histology and IHC
Colonic biopsy samples from healthy individuals were cultured with 1α,25(OH)2D3 or EtOH as above and then fixed in formalin for hematoxylin and eosin (H&E) and Ki-67 staining. Histology and IHC were performed by the University of Chicago Human Tissue Resource Core using standard protocols. For anti-Ki67 staining, following deparaffinization and rehydration, tissue sections were treated with antigen retrieval solution (DAKO, S2367) in a steamer for 20 min. Tissue sections were then incubated with anti-Ki67 antibody (1:300) (cat. #RM-9106-s, clone: SP6, rabbit IgG; Labvision, Kalamazoo, MI) for 1 h at room temperature in a humidity chamber. Following Tris-buffered saline wash, the antigen-antibody binding was detected with Envision+ system (DAKO, K4003) and DAB+ chromogen (DAKO, K3468). Tissue sections were briefly immersed in hematoxylin for counterstaining and were sealed with a coverslip. The fraction of Ki-67-positive nuclei was quantified using Immunoratio (21) on sections with adequately oriented crypts for analysis (n = 13).
Quantification of Cell Viability in Ex Vivo Culture
Viability of tissue was quantified using CellTiter-Blue assay (Promega, Vienna, Austria). Six (6) colonic biopsies from two healthy individuals were collected, transected, and cultured as detailed above in the presence of CellTiter-Blue. CellTiter-Blue is a cell viability assay that measures the conversion of a redox dye (resazurin) to a fluorescent product (resorufin) by viable metabolically active cells. Viable cells are capable of reducing resazurin into resorufin, while nonviable cells rapidly lose the metabolic capacity to reduce the indicator dye. The ratio of viable cells can be calculated via color change with spectrophotometry (absorbance) as a ratio of absorption at 570 nm/600 nm.
RNA Isolation and Assessment of Transcriptional Response
RNA isolation.
Following storage in RNAlater, previously cultured colon tissue was then placed in 400 μl of QIAzol lysis reagent (cat. #79306; Qiagen, Germantown, MD) in addition to 50 μl RNase-free 0.5 mm zirconium oxide beads (cat. #ZrO05-RNA; Next Advance, Averill, NY) in a 1.5 ml microcentrifuge tube. Tubes were placed in a Bullet Blender Storm (BBY24M, Next Advance) and pulsed in a series of 2 min cycles until homogenized. RNA isolation was performed using an RNeasy Universal Mini Kit (cat. #73404, Qiagen) in conjunction with a Qiacube Automated Workstation (Qiagen). Following tissue homogenization, tubes were left at room temperature for 5 min. We added 100 μl of gDNA Eliminator (Qiagen) to each tube to remove genomic DNA followed by 15 s of vigorous inversion for proper mixing. We added 180 μl of chloroform, followed by 15 s of vigorous inversion and 2 min incubation at room temperature. The tubes were then spun at 13,000 g for 15 min. Following centrifugation the upper aqueous layer was separated and placed into a new collection tube. The aqueous phase was then placed into the Qiacube Automated Workstation with the appropriate reagents from the RNeasy Universal Mini Kit. The apparatus was run according to the manufacturer's specifications. Following the procedure 30 μl of eluted RNA was removed and quantified using a NanoDrop (Wilmington, DE) spectrophotometer. RNA was stored at −80°C.
Microarrays and transcriptional response analysis.
For each experiment RNA was extracted from all samples on the same day. Total RNA was reverse transcribed into cDNA, labeled, hybridized to Illumina (San Diego, CA) HumanHT-12 v3 Expression BeadChips, and scanned at the Functional Genomics Core at the University of Chicago. To minimize batch effects, all microarrays were hybridized on the same day and at the same time. Summary data were obtained using the BeadStudio software from Illumina. We evaluated the array quality and processed the data using the R package “limma” for background correction and quantile normalization (16, 24). All RNA samples and arrays used in this study passed the established quality criteria including an RNA integrity number >7, and a 260 nm/280 nm optical density ratio between 1.8 and 2.1. We identified differentially expressed genes using Significance Analysis of Microarray (SAM) (22). Differentially expressed genes were determined by paired t-test between vitamin D- and vehicle-treated cells derived from the same patients. The criteria of significance are at false discovery rate (FDR) <10% and fold change >1.5. We have deposited the array into the National Center for Biotechnology Information's Gene Expression Omnibus Database (GSE50012). Significant canonical pathways were identified using Ingenuity Pathway Analysis software (Ingenuity Systems, Redwood City, CA). The significance of a canonical pathway was determined by the right-tailed (referring to the overrepresented pathway) Fisher's exact test with P < 0.05.
Reverse transcription.
Conversion of RNA to cDNA was accomplished using a High Capacity cDNA Reverse Transcription Kit from Applied Biosystems (cat. #4368814; Carlsbad, CA) using 0.1 μg of RNA per the manufacturer's instructions. The reverse transcription reaction was run in a 96-well plate using an MJ Research PRTC-225 Pettier Thermal Cycler (St. Bruno, Quebec, Canada) as follows: 25°C for 10 min, 37°C for 120 min, 85°C for 5 min, followed by a hold at 4°C indefinitely. cDNA was stored at −20°C.
Quantitative real-time PCR.
Quantitative real-time PCR (RT-PCR) was performed using Power SYBR Green PCR Master Mix from Applied Biosystems (cat. #4367659). CYP24A1 and CYP27B1 were chosen based on their established roles in metabolism of 1α,25(OH)2D3 and 25(OH)D, respectively. Primers were purchased from Integrated DNA Technologies (Coralville, IA), and sequences were as follows: 18S forward: 5′-gta acc cgt tga acc cca tt-3′; 18S reverse: 5′-cca tcc aat cgg tag tag cg-3′; CYP24A1 forward: 5′-agg cca cgt tga aga ctt gt-3′; CYP24A1 reverse: 5′-ttg gtg ttg agg ctc ttg tg-3′; CYP27B1 forward: 5′-ACC CGA CAC GGA GAC CTT C-3′; CYP27B1 reverse: 5′-TGT GTT AGG ATC TGG GCC AAA-3′. Reactions were loaded in triplicate in a 384-well plate on an Applied Biosystems 7900HT Fast Real Time PCR System. Data were acquired and analyzed using Applied Biosystems SDS Software (version 2.2.1) using the ΔΔCt cycle method.
RESULTS
Ex Vivo Culture of Colonic Biopsies is Feasible, and Tissue Remains Viable for up to 8 h
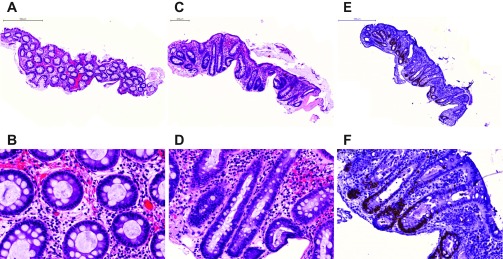
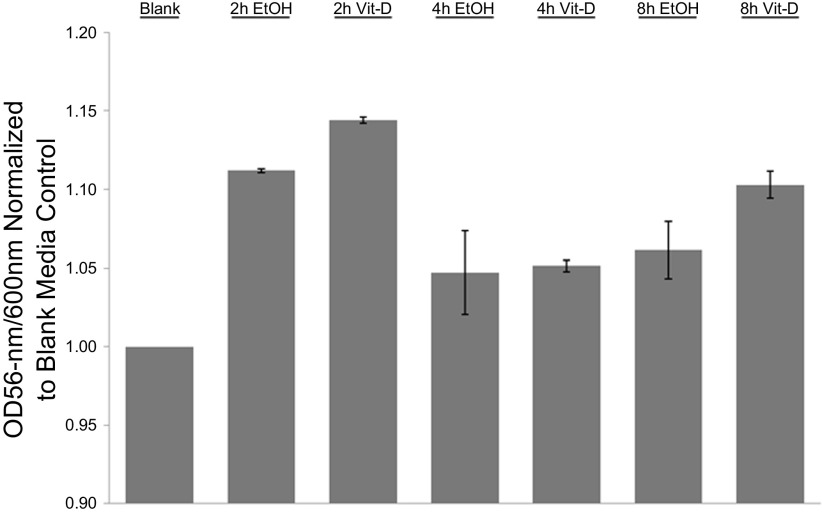
Following a protocol adapted from Dame et al. (5), colonic biopsies were maintained in culture for up to 8 h with preservation of normal colonic histology. H&E sections of cultured specimens demonstrate typical architectural features of colonic epithelium and lamina propria (Fig. 1). Histological features were maintained regardless of treatment conditions. There is evidence of preserved colonic crypts with goblet cells distributed throughout the lengths of the crypts. Ki-67 staining shows expected staining in the bases of the crypts with average overall proportions of stained nuclei [14.5% (SE 1.2%)] within the range of previous reports (Fig. 1) (1, 10, 17, 17). In addition, colon biopsies remained viable over this time period as assessed by the CellTiter-Blue assay (Fig. 2). Colonic biopsies were kept in culture for up to 24 h, but architectural features were not consistently preserved after 12 h in culture (data not shown). Similar to previous studies (3, 5, 6), we found that viability was improved using an air-liquid interface. In contrast to Dame et al. (5), however, we did not find that hyperoxic conditions (95% O2) improved viability over 95% air (data not shown).
Fig. 1.
Histology and immunohistochemistry of colonic biopsies in short-term culture. Normal colonic histology is maintained in short-term culture of biopsy samples with both EtOH and 1α,25(OH)2 vitamin D treatments. A, B: low- and high-power views of hematoxylin- and eosin (H&E)-stained formalin-fixed paraffin-embedded biopsy treated with EtOH for 8 h. C, D: low- and high-power H&E of biopsy in culture treated with 1α,25(OH)2 vitamin D for 6 h. E, F: low- and high-power views of Ki-67 staining of biopsy in culture with 1α,25(OH)2 vitamin D at 6 h showing prominent staining in colonic crypts as expected.
Fig. 2.
CellTiter-Blue assay results. Colonic biopsies in culture show evidence of metabolic activity with conversion of resazurin to resorufin quantified by absorbance compared with blank control at 2, 4, and 8 h.
The Largest Number of Differentially Expressed Genes Was Observed Following 6 h 1α,25(OH)2 Vitamin D Treatment
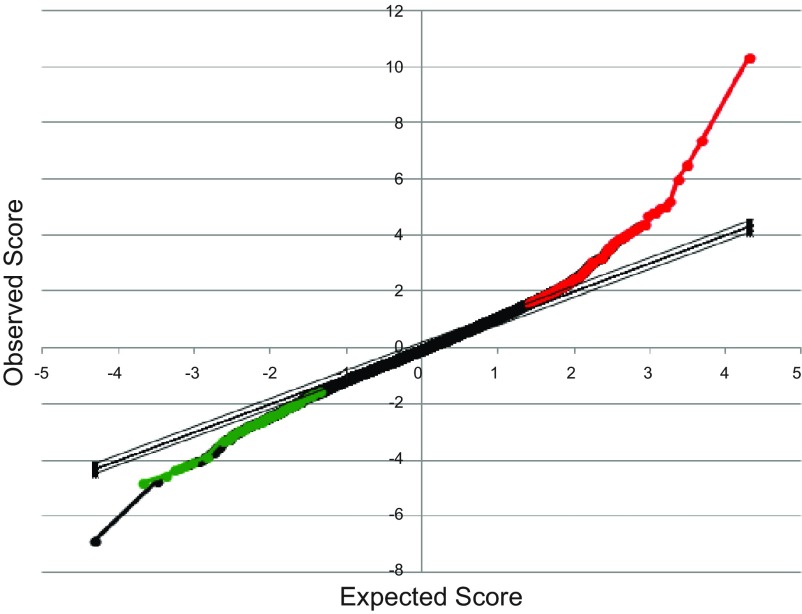
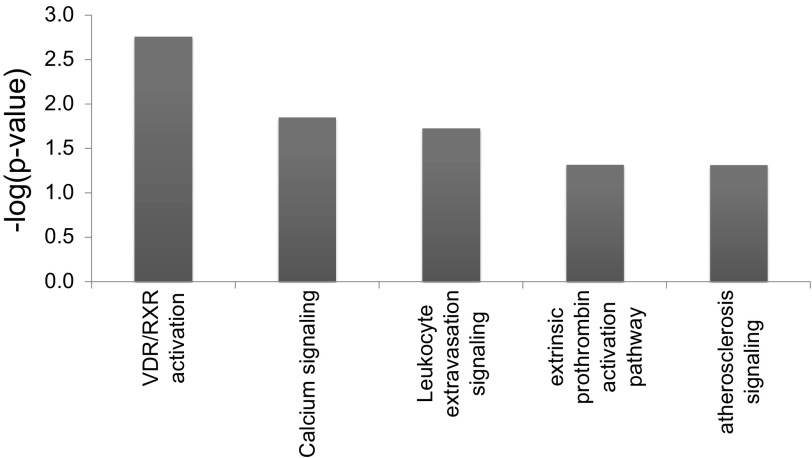
To determine the optimal treatment time for active vitamin D, we performed two treatment time courses (1 and 2) and analyzed transcriptome-wide expression levels at each time point. As we were limited to approximately six biopsies per patient, we performed two time course experiments with six individuals and three time points for each experiment. Time course 1 included 2, 4, and 6 h, while time course 2 included 6, 9, and 12 h. The largest number of differentially expressed genes (120 genes in total: 72 up- and 48 downregulated genes at FDR < 10%) was found at 6 h of treatment in time course 1 (Fig. 3, Supplementary Table S1).1 Top up- and downregulated genes (FDR < 5%) are shown in Tables 1 and 2, respectively. The top enriched KEGG pathway was VDR/retinoid X receptor (RXR) activation (P = 1.75 × 10⁻³) with additional significant pathways being calcium signaling, leukocyte extravasation signaling, extrinsic prothrombin activation pathway, and atherosclerosis signaling (Fig. 4). Among 73 genes with official gene names, 55 (75%) were also differentially expressed in a transcriptional study using LS180 CRC cancer cell line (11). In time course 2, there were 12 upregulated genes (FDR < 10%) at 6 h. The top differentially expressed gene at 6 h in both experiments was the vitamin D-inducible gene CYP24A1 (Fig. 5). In addition to CYP24A1, there were six differentially expressed genes that overlapped between the first and second time courses (MCG102966, MAT2A, EFTUD1, TSKU, SPOCK2, and UCA1).
Fig. 3.
Significance of microarray (SAM) analysis of genome-wide transcriptional response to 1α,25(OH)2D3 response at 6 h. Plotted are expected SAM score (x-axis) vs. observed SAM score (y-axis) showing significant deviation from expected for both upregulated (red) and downregulated (green) genes.
Table 1.
Top upregulated genes in response to 1α,25(OH)2 vitamin D treatment at 6 h
| Gene Name | Fold Change | FDR, % |
|---|---|---|
| CYP24A1 | 19.91 | 0 |
| LOC400578 | 2.62 | 0 |
| MGC102966 | 2.44 | 0 |
| TXNRD1 | 2.02 | 0 |
| UCA1 | 3.37 | 0 |
| EFTUD1 | 1.89 | 0 |
| LINCR | 2.88 | 0 |
| TACSTD2 | 1.62 | 0 |
| ARL5B | 1.73 | 0 |
| EID3 | 1.79 | 0 |
| OASL | 1.86 | 0 |
| CLCF1 | 1.72 | 0 |
| C3orf52 | 1.63 | 0 |
| F3 | 1.76 | 0 |
| PIM1 | 1.86 | 0 |
| DDIT4 | 1.63 | 0 |
| CLDN23 | 1.53 | 0 |
| LOC340274 | 1.60 | 0 |
| ZNF296 | 1.68 | 0 |
| GEM | 2.45 | 0 |
| SH3TC1 | 1.80 | 0 |
| VLDLR | 1.74 | 0 |
| DMRT2 | 1.65 | 0 |
| NET1 | 1.86 | 0 |
| FLJ35024 | 2.21 | 0 |
| PRSS22 | 1.85 | 0 |
| C1orf131 | 1.52 | 0 |
| LOC392871 | 1.63 | 0 |
| UPP1 | 1.63 | 0 |
| TRPV6 | 3.17 | 0 |
| DUSP5 | 1.65 | 0 |
| RP5-1022P6.2 | 1.60 | 0 |
| MAT2A | 1.70 | 0 |
| HRASLS2 | 1.54 | 1.03 |
| TMEM57 | 1.66 | 1.03 |
| TSKU | 1.55 | 1.03 |
| KPNA7 | 1.53 | 1.03 |
| AKAP12 | 2.07 | 1.64 |
| SEC14L1 | 1.59 | 1.64 |
| YOD1 | 1.61 | 1.64 |
| SLC20A1 | 1.61 | 4.18 |
| FGD6 | 1.59 | 4.18 |
| TIPARP | 1.52 | 4.89 |
| SLC30A1 | 1.62 | 4.89 |
| C12orf36 | 1.51 | 4.89 |
| TPM4 | 1.59 | 4.89 |
False discovery rate (FDR) < 5%.
Table 2.
Top downregulated genes in response to 1α,25(OH)2 vitamin D treatment at 6 h
| Gene Name | Fold Change | FDR, % |
|---|---|---|
| CSF1R | 0.63 | 0 |
| FCER1G | 0.61 | 0 |
| C1QB | 0.58 | 0 |
| SLC15A3 | 0.65 | 0 |
| C1QC | 0.56 | 0 |
| ITM2A | 0.65 | 0 |
| CPVL | 0.66 | 0 |
| LUM | 0.62 | 1.88 |
| COL5A2 | 0.65 | 1.88 |
| APOE | 0.66 | 1.88 |
| EDNRB | 0.65 | 1.88 |
| COL3A1 | 0.62 | 1.88 |
| TMEM119 | 0.58 | 1.88 |
| COL4A5 | 0.66 | 1.88 |
| SGCE | 0.65 | 1.88 |
| MXRA5 | 0.66 | 2.42 |
| MYH11 | 0.63 | 2.42 |
| ACTG2 | 0.60 | 4.18 |
| COL1A2 | 0.59 | 4.18 |
| ZNF573 | 0.65 | 4.18 |
| CXCL14 | 0.66 | 4.18 |
| LOC642113 | 0.63 | 4.18 |
| PLAT | 0.66 | 4.18 |
| S100A4 | 0.61 | 4.66 |
| LOC652102 | 0.57 | 4.66 |
| LOC730525 | 0.62 | 4.66 |
| C1QTNF5 | 0.64 | 4.66 |
| ACTA2 | 0.66 | 4.66 |
| LOC647450 | 0.63 | 4.89 |
| TPSB2 | 0.66 | 4.89 |
| PDGFRA | 0.65 | 4.89 |
FDR < 5%.
Fig. 4.
Ingenuity Pathway Analysis (IPA) analysis of enriched pathways in response to 1α,25(OH)2D3 at 6 h. Shown are the significantly enriched pathways (P < 0.05) including vitamin D receptor (VDR)/retinoid X receptor (RXR) activation, calcium signaling, leukocyte extravasation signaling, extrinsic prothrombin activation pathway, and atherosclerosis signaling.
Fig. 5.
CYP24A1 expression in colonic tissue at 2, 4, and 6 h in response to 1α,25(0H)2D3 (A) and 6, 9, and 12 h (B) of treatment in culture. CYP24A1 expression is significantly increased at 6 h compared with 2 and 4 h (P = 0.003 and 0.046, respectively), whereas there are no differences in relative expression for 6, 9, and 12 h.
Expression of CYP27B1 and Induction of CYP24A1 After Treatment With 25(OH)D
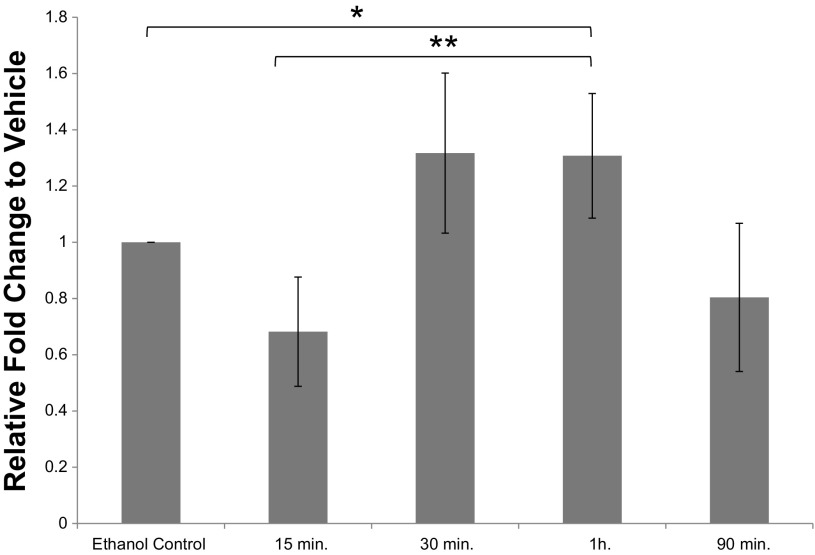
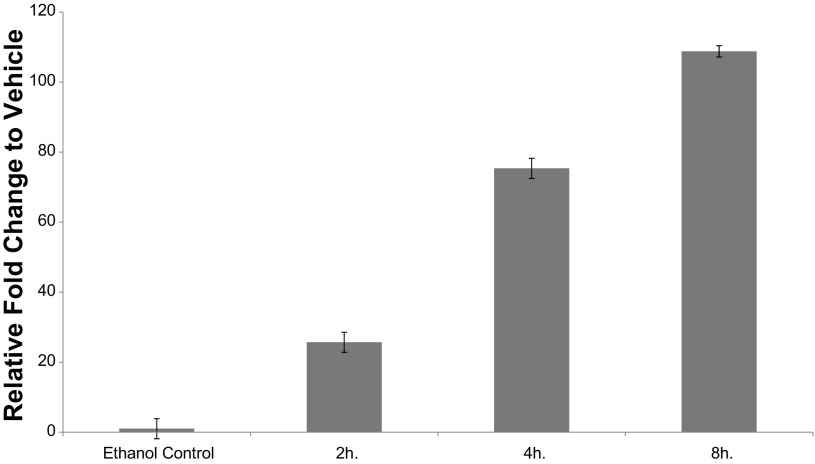
To determine maximal CYP27B1 expression in response to 25(OH)D treatment, a time course experiment was conducted. As shown in Fig. 6, there was increased CYP27B1 mRNA expression beginning at 30 min with significantly increased expression at 1 h (15 min vs. 1 h, P = 0.01). In four additional subjects, CYP24A1 expression was also measured at 2, 4, and 8 h after 25(OH)D treatment (Fig. 7). This experiment showed CYP24A1 expression was greatest after 8 h (2 h v. 8 h, P = 2.8 × 10⁻⁴) because 25(OH)D is locally converted to 1α,25(OH)2D3 in the colon.
Fig. 6.
CYP27B1 mRNA expression in response to 25(OH)D treatment. Fold change of CYP27B1 expression relative to vehicle control (EtOH) at 15 min, 30 min, 1 h, and 90 min. There was a significant increase in expression at 1 h relative to EtOH control and the 15 min time point (*P = 0.01, **P = 0.01).
Fig. 7.
CYP24A1 mRNA expression in response to 25(OH)D treatment. Fold change of CYP24A1 expression relative to vehicle control (EtOH) at 2, 4, and 8 h showing maximal expression at 8 h. All time points were highly significantly upregulated compared with EtOH (P < 2.0 × 10−300) as well as over time (2 h vs. 4 h, P = 0.002; 4 h vs. 8 h, P = 0.02, 2 h vs. 8 h, P = 2.8 × 10⁻⁴).
DISCUSSION
We have established an ex vivo culturing system that allows for the study of transcriptional responses in primary human colon tissue. Here, we optimize treatment conditions for active and precursor vitamin D [25(OH)D], but conditions can be modified for other treatments. Colonic biopsies in culture remain viable for 8 h with intact colonic architecture and crypt proliferation as demonstrated by Ki-67 staining. We show that 6 h treatment with 1α,25(OH)2D3 yields the greatest number of differentially expressed genes (n = 120). For 25(OH)D treatment, significantly increased expression of CYP27B1 was noted at 30 min, while the greatest CYP24A1 expression was found after 8 h of treatment.
We extend an ex vivo culturing approach (5) by optimizing conditions for culturing of colonic biopsies. Whereas previous studies utilize full-thickness colonic tissue obtained from surgical specimens from diseased colons with a certain amount of ischemic time (5, 7), we find that obtaining colonic biopsies from screening colonoscopies allows for rapid acquisition of tissue that can be placed into culture within minutes of being removed from the patient, yielding viable tissue from a healthy patient population. Tissue from subjects without colonic disease allows for better understanding of transcriptional responses to vitamin D in normal healthy samples that do not have aberrant gene expression due to a disease state such as cancer or inflammation. Furthermore, cultured samples from the same individual can be treated in parallel under identical experimental conditions, thereby reducing the effect of technical and environmental confounders.
Utilizing this tissue culture system, we found the largest number of differentially expressed genes occurred following 6 h of 1α,25(OH)2D3 treatment. As proof of concept, we found that a known vitamin D-induced gene CYP24A1 was the most highly upregulated gene at this time point across two different experiments and showed greatest expression at 6 h. Moreover, VDR/RXR regulated circuits were the top enriched pathway. These findings argue that vitamin D transcriptional responses in our ex vivo culturing system closely resemble those occurring in vivo. In addition, among the differentially expressed genes in response to active vitamin D, we noted a number of other vitamin D-responsive genes with 75% overlap in a study in CRC cell lines (11), further supporting our experimental system for studying transcriptional response in the healthy colon. While it is possible that we did not find a greater number of differentially expressed genes at time points after 6 h due to declining tissue viability, a previous study in CRC cell lines found that expression of CYP24A1 (a prototypical marker of active vitamin D transcriptional response) increased most rapidly in the first 8 h of treatment supporting our supposition that short-term treatment of colonic mucosa in culture is adequate to assess vitamin D-induced gene expression changes (13). Moreover, our sample size of only six subjects per experiment may account for the relatively small number of significantly differentially expressed genes in response to treatment.
Regarding response to precursor to active vitamin D, we noted significant increased expression of colonic CYP27B1 at 1 h. While not significant, CYP27B1 expression was increased within 30 min. To our knowledge, no previous study has defined peak expression of CYP27B1 in healthy colon, although in a 2010 paper Murillo et al. (12) found decreasing expression in a CRC cell line after 2 h but did not include earlier time points. Importantly, with precursor to active vitamin D treatment, we found the highest expression of CYP24A1, the gene most strongly induced by active vitamin D treatment after 8 h of treatment. Based on our results, we suggest that 6 h is an optimal treatment time point for measuring transcriptional response to active vitamin D, while 1 h is the optimal treatment time point for assessing CYP27B1 expression reflecting local conversion of the precursor to active vitamin D 25(OH)D to active vitamin D.
In summary, we demonstrate that colonic biopsies in short term culture (8 h) can be used to assess tissue-specific transcriptional responses to treatments, such as vitamin D, that are important for colonic health. Given that colonic tissue is readily accessible, this system will allow for future assessment of interindividual and interethnic differences in transcriptional response with collection of a larger sample size from an ethnically diverse patient population. Here, we find that the 6 h time point yields the greatest number of differentially expressed genes in response to 1α,25(OH)2D3, while 1 h appears to be the optimal treatment time for evaluation of CYP27B1 expression. While we have defined appropriate treatment conditions for vitamin D in this study, other agents (e.g., glucocorticoids, etc.) could readily be tested using this system.
GRANTS
Grant support provided by National Institutes of Health Grants K08CA-142892 (S. S. Kupfer) and P30DK-42086 (pilot funding to S. S. Kupfer).
DISCLOSURES
No conflicts of interest, financial or otherwise, are declared by the author(s).
AUTHOR CONTRIBUTIONS
Author contributions: B.M., M.C., E.H., A.L., and K.C. performed experiments; B.M., M.C., E.H., A.L., Y.H., and S.S.K. analyzed data; B.M., M.C., E.H., A.L., and S.S.K. interpreted results of experiments; B.M. and S.S.K. prepared figures; B.M. and S.S.K. drafted manuscript; B.M., M.C., E.H., A.L., K.C., Y.H., and S.S.K. edited and revised manuscript; B.M., M.C., E.H., A.L., K.C., Y.H., and S.S.K. approved final version of manuscript; S.S.K. conception and design of research.
Supplementary Material
ACKNOWLEDGMENTS
We thank Anna Di Rienzo for helpful discussions and review of the manuscript. We thank Marc Bissonnette for review of the manuscript. We thank Nanduri Prabhakar for use of the hyperoxic chamber. We thank the University of Chicago Human Tissue Resource Core for histology and immunohistochemistry.
Footnotes
The online version of this article contains supplemental material.
REFERENCES
- 1.Akedo I, Ishikawa H, Ioka T, Kaji I, Narahara H, Ishiguro S, Suzuki T, Otani T. Evaluation of epithelial cell proliferation rate in normal-appearing colonic mucosa as a high-risk marker for colorectal cancer. Cancer Epidemiol Biomarkers Prev 10: 925–930, 2001. [PubMed] [Google Scholar]
- 2.Bareis P, Bises G, Bischof MG, Cross HS, Peterlik M. 25-Hydroxy-vitamin D metabolism in human colon cancer cells during tumor progression. Biochem Biophys Res Commun 285: 1012–1017, 2001. [DOI] [PubMed] [Google Scholar]
- 3.Browning TH, Trier JS. Organ culture of mucosal biopsies of human small intestine. J Clin Invest 48: 1423–1432, 1969. [DOI] [PMC free article] [PubMed] [Google Scholar]
- 4.Cross HS, Nittke T, Kallay E. Colonic vitamin D metabolism: implications for the pathogenesis of inflammatory bowel disease and colorectal cancer. Mol Cell Endocrinol 347: 70–79, 2011. [DOI] [PubMed] [Google Scholar]
- 5.Dame MK, Bhagavathula N, Mankey C, DaSilva M, Paruchuri T, Aslam MN, Varani J. Human colon tissue in organ culture: preservation of normal and neoplastic characteristics. In Vitro Cell Dev Biol Anim 46: 114–122, 2010. [DOI] [PMC free article] [PubMed] [Google Scholar]
- 6.Forrest KY, Stuhldreher WL. Prevalence and correlates of vitamin D deficiency in US adults. Nutr Res 31: 48–54, 2011. [DOI] [PubMed] [Google Scholar]
- 7.Grivel JC, Margolis L. Use of human tissue explants to study human infectious agents. Nat Protoc 4: 256–269, 2009. [DOI] [PMC free article] [PubMed] [Google Scholar]
- 8.Holt PR, Arber N, Halmos B, Forde K, Kissileff H, McGlynn KA, Moss SF, Kurihara N, Fan K, Yang K, Lipkin M. Colonic epithelial cell proliferation decreases with increasing levels of serum 25-hydroxy vitamin D. Cancer Epidemiol Biomarkers Prev 11: 113–119, 2002. [PubMed] [Google Scholar]
- 9.Matusiak D, Benya RV. CYP27A1 and CYP24 expression as a function of malignant transformation in the colon. J Histochem Cytochem 55: 1257–1264, 2007. [DOI] [PubMed] [Google Scholar]
- 10.McTiernan A, Yasui Y, Sorensen B, Irwin ML, Morgan A, Rudolph RE, Surawicz C, Lampe JW, Ayub K, Potter JD, Lampe PD. Effect of a 12-month exercise intervention on patterns of cellular proliferation in colonic crypts: a randomized controlled trial. Cancer Epidemiol Biomarkers Prev 15: 1588–1597, 2006. [DOI] [PubMed] [Google Scholar]
- 11.Meyer MB, Goetsch PD, Pike JW. VDR/RXR and TCF4/beta-catenin cistromes in colonic cells of colorectal tumor origin: impact on c-FOS and c-MYC gene expression. Mol Endocrinol 26: 37–51, 2012. [DOI] [PMC free article] [PubMed] [Google Scholar]
- 12.Murillo G, Matusiak D, Benya RV, Mehta RG. Chemopreventive efficacy of 25-hydroxyvitamin D3 in colon cancer. J Steroid Biochem Mol Biol 103: 763–767, 2007. [DOI] [PMC free article] [PubMed] [Google Scholar]
- 13.Murillo G, Nagpal V, Tiwari N, Benya RV, Mehta RG. Actions of vitamin D are mediated by the TLR4 pathway in inflammation-induced colon cancer. J Steroid Biochem Mol Biol 121: 403–407, 2010. [DOI] [PMC free article] [PubMed] [Google Scholar]
- 14.Palmer HG, Sanchez-Carbayo M, Ordonez-Moran P, Larriba MJ, Cordon-Cardo C, Munoz A. Genetic signatures of differentiation induced by 1alpha,25-dihydroxyvitamin D3 in human colon cancer cells. Cancer Res 63: 7799–7806, 2003. [PubMed] [Google Scholar]
- 15.Pereira F, Larriba MJ, Munoz A. Vitamin D and colon cancer. Endocr Relat Cancer 19: R51–R71, 2012. [DOI] [PubMed] [Google Scholar]
- 16.Shi W, Oshlack A, Smyth GK. Optimizing the noise versus bias trade-off for Illumina whole genome expression BeadChips. Nucleic Acids Res 38: e204, 2010. [DOI] [PMC free article] [PubMed] [Google Scholar]
- 17.Suzuki H, Matsumoto K, Terabe M. Ki-67 antibody labeling index in colorectal carcinoma. J Clin Gastroenterol 15: 317–320, 1992. [DOI] [PubMed] [Google Scholar]
- 18.Takano Y, Saegusa M, Ikenaga M, Mitomi H, Okayasu I. Apoptosis of colon cancer: comparison with Ki-67 proliferative activity and expression of p53. J Cancer Res Clin Oncol 122: 166–170, 1996. [DOI] [PubMed] [Google Scholar]
- 19.Tangpricha V, Flanagan JN, Whitlatch LW, Tseng CC, Chen TC, Holt PR, Lipkin MS, Holick MF. 25-hydroxyvitamin D-1alpha-hydroxylase in normal and malignant colon tissue. Lancet 357: 1673–1674, 2001. [DOI] [PubMed] [Google Scholar]
- 20.Townsend K, Evans KN, Campbell MJ, Colston KW, Adams JS, Hewison M. Biological actions of extra-renal 25-hydroxyvitamin D-1alpha-hydroxylase and implications for chemoprevention and treatment. J Steroid Biochem Mol Biol 97: 103–109, 2005. [DOI] [PubMed] [Google Scholar]
- 21.Tuominen VJ, Ruotoistenmaki S, Viitanen A, Jumppanen M, Isola J. ImmunoRatio: a publicly available web application for quantitative image analysis of estrogen receptor (ER), progesterone receptor (PR), and Ki-67. Breast Cancer Res 12: R56, 2010. [DOI] [PMC free article] [PubMed] [Google Scholar]
- 22.Tusher VG, Tibshirani R, Chu G. Significance analysis of microarrays applied to the ionizing radiation response. Proc Natl Acad Sci USA 98: 5116–5121, 2001. [DOI] [PMC free article] [PubMed] [Google Scholar]
- 23.White JH. Profiling 1,25-dihydroxyvitamin D3-regulated gene expression by microarray analysis. J Steroid Biochem Mol Biol 89–90: 239–244, 2004. [DOI] [PubMed] [Google Scholar]
- 24.Xie Y, Wang X, Story M. Statistical methods of background correction for Illumina BeadArray data. Bioinformatics 25: 751–757, 2009. [DOI] [PMC free article] [PubMed] [Google Scholar]
- 25.Zehnder D, Bland R, Williams MC, McNinch RW, Howie AJ, Stewart PM, Hewison M. Extrarenal expression of 25-hydroxyvitamin D(3)-1 alpha-hydroxylase. J Clin Endocrinol Metab 86: 888–894, 2001. [DOI] [PubMed] [Google Scholar]
Associated Data
This section collects any data citations, data availability statements, or supplementary materials included in this article.


