

Background: Regulation of dopamine D2 receptor (DRD2) is pathophysiologically and pharmacologically important.
Results: miR-9 and miR-326 target to the 3′-UTR of DRD2, and endogenously inhibit DRD2 expression. A functional single nucleotide polymorphism alters such regulation.
Conclusion: DRD2 is post-transcriptionally regulated by miR-326 and miR-9.
Significance: The study suggests a pathophysiological and pharmacological role of miR-9 and miR-326 in neuropsychiatric disorders.
Keywords: Dopamine Receptors, Gene Expression, Gene Regulation, Genetic Polymorphism, MicroRNA, Pharmacogenetics, DRD2
Abstract
The human dopamine receptor D2 (DRD2) has been implicated in the pathophysiology of schizophrenia and other neuropsychiatric disorders. Most antipsychotic drugs influence dopaminergic transmission through blocking dopamine receptors, primarily DRD2. We report here the post-transcriptional regulation of DRD2 expression by two brain-expressed microRNAs (miRs), miR-326 and miR-9, in an ex vivo mode, and show the relevance of miR-mediated DRD2 expression regulation in human dopaminergic neurons and in developing human brains. Both miRs targeted the 3′-UTR (untranslated region) of DRD2 in NT2 (neuron-committed teratocarcinoma, which endogenously expresses DRD2) and CHO (Chinese hamster ovary) cell lines, decreasing luciferase activity measured by a luciferase reporter gene assay. miR-326 overexpression reduced DRD2 mRNA and DRD2 receptor synthesis. Both antisense miR-326 and antisense miR-9 increased DRD2 protein abundance, suggesting an endogenous repression of DRD2 expression by both miRs. Furthermore, a genetic variant (rs1130354) within the DRD2 3′-UTR miR-targeting site interferes with miR-326-mediated repression of DRD2 expression. Finally, co-expression analysis identified an inverse correlation of DRD2 expression with both miR-326 and miR-9 in differentiating dopaminergic neurons derived from human induced pluripotent stem cells (iPSCs) and in developing human brain regions implicated in schizophrenia. Our study provides empirical evidence suggesting that miR-326 and miR-9 may regulate dopaminergic signaling, and miR-326 and miR-9 may be considered as potential drug targets for the treatment of disorders involving abnormal DRD2 function, such as schizophrenia.
Introduction
The dopaminergic hypothesis of SZ postulates that dopaminergic overactivity causes psychosis. Underlying this hypothesis are the observations that psychotogenic stimulants (e.g. amphetamines) activate dopamine receptors (1) and that most antipsychotic drugs influence dopaminergic transmission through blocking dopamine (primarily D2) receptors (2–9). Besides the essential role of DRD2 affinity for antipsychotic effects (10), further support derives from the study of postmortem brains, live brain imaging, and animal models. Postmortem studies of SZ cases consistently found increased density of striatal D2 receptors (8, 11–15). Brain imaging studies have shown that amphetamine-induced increase of dopamine response is correlated with positive symptoms of SZ (16–18) and elevation of striatal D2 receptors (8, 19). Mice overexpressing striatal DRD2 exhibit selective cognitive impairments in working memory tasks (20, 21). Three DRD2 missense variants (Val96 → Ala, Pro310 → Ser, and Ser311 → Cys) impair receptor function (22, 23), and the minor allele of rs1801028 (Ser311 → Cys) is associated with SZ2 in a meta-analysis (24). However, these missense changes are uncommon, and their function does not seem congruent with a hyperdopaminergic hypothesis of SZ. Therefore, it is conceivable that for DRD2, increased expression (rather than structural changes) may play an important role in SZ pathogenesis. DRD2 is also hypothesized to be involved in multiple other neuropsychiatric disorders, e.g. drug addiction (25), neuroticism, and anxiety disorders (26, 27), which highlights additional potential importance of studying its regulation.
Multiple DRD2 genetic variants influence DRD2 expression at both the transcriptional and the post-transcriptional levels. At the transcriptional level, the insertion allele of the promoter variant rs1799732 (−141C Ins/Del) increases in vitro DRD2 transcription and is reported to be nominally associated with SZ in a small Japanese sample (260 cases versus 312 controls) (28). Post-transcriptionally, two intronic SNPs, rs2283265 (intron 5) and rs1076560 (intron 6), in high linkage disequilibrium (LD) with each other, alter DRD2 splicing (29) and are associated with reduced performance in working memory in controls (29) and with cocaine abuse (30, 31). We and others have also previously shown that allele C of a functional synonymous variant rs6277 (C957T) increases DRD2 mRNA stability and receptor synthesis in vitro (32) and in vivo (33). Furthermore, rs6277 has been reported to be associated with cognitive performance (34–36), response to antipsychotic medication (37), and depressive rumination (38). Identification of these functional DRD2 variants highlights the potential importance of noncoding regulatory sequences.
miRs have emerged as important post-transcriptional regulators of gene expression. miRs are ∼22-nucleotide small noncoding RNAs processed from pre-miRs (∼100 bp) with a typical folding structure containing a mature miR region and a stem-loop region (39, 40). miRs mediate translational repression and/or mRNA decay of a target gene through sequence complementation with the 3′-UTRs of their target genes (41, 42). There is evidence suggesting that the number of miR target sites at the 3′-UTRs of a gene is negatively correlated with RNA stability (43). The 3′-UTR of human DRD2 mRNA is predicted (PicTar, TargetScan) to have multiple miR binding sites (Fig. 1, A and B), including those for miR-326 and miR-9, which are brain-expressed and involved in neurogenesis and neurodifferentiation (44–46). There are two known SNPs, rs1130354 and rs6274, within a predicted (PicTar) targeting region shared by miR-326 and miR-9 (Fig. 1, B and C). Polymorphisms within the target region may impair the base-pairing between an miR and its target, hence affecting target gene expression. In this study we used a cellular model to examine the effects of miR-326 and of miR-9 on DRD2 receptor expression and whether genetic variation within the 3′-UTR of DRD2 mRNA alters the targeting of miRs.
FIGURE 1.

DRD2 3′-UTR (chr11:113,281,399–113,280,217; hg19) has multiple miR target sites for miR-9 and miR-326 as predicted by PicTar and TargetScan. A, PicTar prediction and DNA sequence conservation. B, TargetScan prediction of miR target sites. C, base pairing between miR and target sequences of DRD2. Conserved sequences (shaded) among human, mouse, rat and dog for the targeting sequences are also shown. The allele highlighted in yellow indicates the SNP site (rs1130354) within the 7-nucleotide seed sequence.
EXPERIMENTAL PROCEDURES
Cell Culture
We purchased CHO-K1 (hereafter referred to as CHO) and human NT2 cell lines from ATCC. We cultured CHO in F-12K and NT2 in Dulbecco's modified Eagle's medium (DMEM; from ATCC) supplemented with 10% fetal bovine serum (FBS) and penicillin/streptomycin 100 units/ml (from ATCC). We maintained cells in 15 ml of growth medium in a 75T flask with a cell density of <1 × 10⁶/ml in a 37 °C incubator with 5% CO2, changing cell culture media every other day until the experiment day. We used both NT2 and CHO cell lines for reporter gene assay but used only the NT2 cell line for studying miR-mediated inhibition on endogenous DRD2 expression, because CHO cells do not endogenously express DRD2 (23, 32, 47).
Samples and Genotyping
We studied 1870 SZ cases and 2002 controls from the Molecular Genetics of Schizophrenia (MGS) sample of European ancestry (48, 49) to evaluate the LD between functional SNPs and for estimating allele frequency of rs1130354. We previously described in detail the recruitment procedures and clinical phenotypes (48, 49). We used the TaqMan Pre-Designed SNP Genotyping Assay (Invitrogen) to genotype rs1130354 in the MGS European ancestry sample. Briefly, we used 4 ng of genomic DNAs in a total of 5 μl of a polymerase chain reaction (PCR) reaction in each well on a 384-well plate. We carried out PCR on a 7900HT instrument (Invitrogen) with standard real-time PCR cycling conditions. We made automatic genotype calls with SDS 2.2 software (Invitrogen). The genotyping completion rate was 98 and 96% for cases and controls, respectively. There was no significant deviation from Hardy-Weinberg disequilibrium. The NorthShore University HealthSystem Institutional Review Board approved the study.
DNA Cloning and Sequence Mutagenesis
We used a PCR to amplify from MGS DNAs the DRD2 3′-UTR sequences (830 bp; chr11:113,280,381–113,281,210; hg19) spanning the predicted target sites of miR-9 and miR-326. The DNA sequences of the amplified fragments were confirmed by Sanger sequencing. We selected the amplified wild-type (WT) sequence as those with the same sequence as the hg19 reference sequence. We then cloned the wt sequence fragment into Xho1 and Pme1 sites downstream of the firefly luciferase coding region in the psiCHECK™-2 Vector (Promega). psiCHECK™-2 utilizes firefly luciferase as a reporter gene and Renilla luciferase in the same vector as a control to normalize transfection efficiency and cell number in the reporter gene assay. With the recombined reporter gene vector containing DRD2 3′-UTR wt sequence as a backbone vector, we used the QuikChange II Site-Directed Mutagenesis kit (Agilent) to change the nucleotide sequence to construct the mutant alleles of the two known SNPs (rs1130354 and rs6274) within the targeting sites of miR-9 and miR-326. We designed PCR primers (sequences available upon request) for cloning DRD2 3′-UTR and for mutagenesis with Primer3 and purchased primer oligos from IDT (Integrated DNA Technologies).
Reporter Gene Assay
We transformed reporter gene DNA constructs containing the DRD2 3′-UTR wt sequence (pD2UTR-wt) with rs6274 mutant allele G (pD2UTR-rs6274-G) and with rs1130354 mutant allele G (pD2UTR-rs1130354-G) (Fig. 2) into Escherichia coli DH5α and prepared endotoxin-free plasmid DNAs with the StrataPrep® EF Plasmid Midiprep kit (Agilent). We next transfected reporter gene plasmid DNAs into CHO or NT2 cells. Briefly, we plated 3.5 × 10⁴ cells per well into 24-well plates 24 h before transfection. The next day we transfected ∼100 ng of reporter gene vector and varying amounts of miR precursors into CHO and NT2 cells at 90% confluence, respectively. We used Lipofectamine 2000 (Invitrogen) for transfection. At 48 h post-transfection, we measured Renilla and firefly luciferase activity in transfected cells using a Dual-Luciferase Reporter Assay system (Promega) in a 96-well plate.
FIGURE 2.
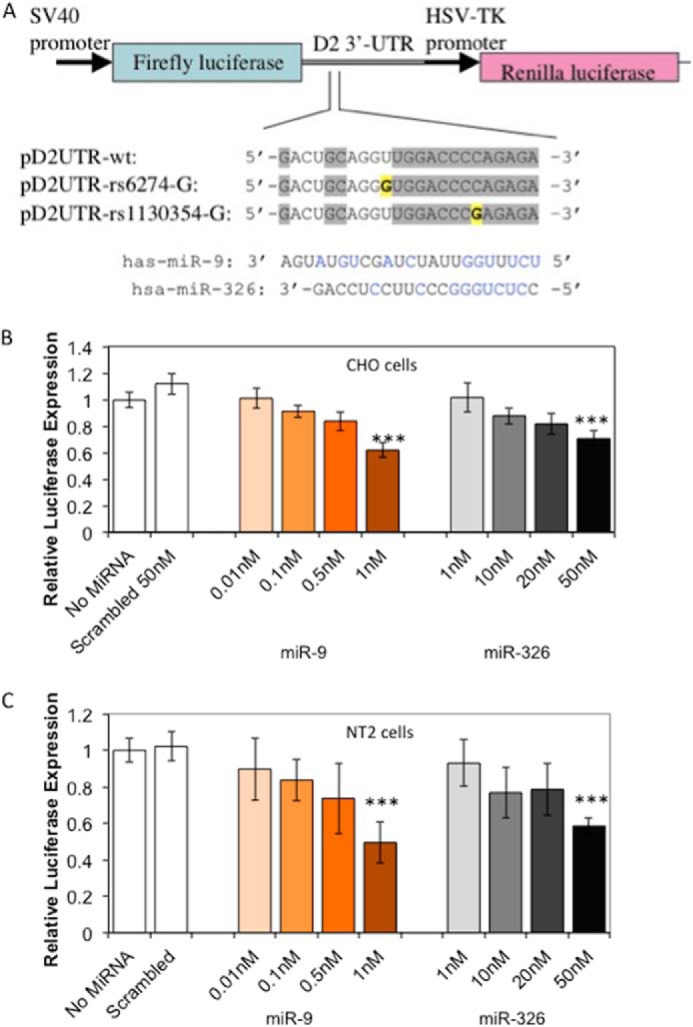
Luciferase reporter constructs and reporter gene assay. A, the reporter gene vector (psiCHECK) containing the 3′-UTR of DRD2, showing one putative target site shared by miR-9/miR-326. Gray-shaded letters in each construct represent conserved sequences, and yellow letters indicate the minor alleles of rs6274 and rs1130354. Letters in blue represent the miR nucleotides complementary to the target sequence. miR-9 and miR-326 inhibited the reporter gene (luciferase) expression through targeting the downstream DRD2 3′-UTR in transfected CHO cells (B) and NT2 cells (C). Concentration of both miRs had significant effect on reporter gene expression in both CHO cells (ANOVA p < 0.0001) and in NT2 cells (ANOVA p < 0.0001 for miR-9 and <0.0002 for miR-326). We co-transfected cells with pD2UTR-wt and synthetic pre-miRs. We measured luciferase activity at 48 h post-transfection and present data as the average ± S.D. from at least 3 independent experiments, each with 3 measurements for each condition. *** indicates p < 0.0001 from Student's t test.
Overexpression of miRs and Anti-miRs in NT2 Cells
We plated NT2 cells at 2.5 × 10⁵ cells per well on a 6-well plate 24 h before transfection. At 90% of cell confluency we transfected NT2 cells with Ambion® Pre-miR™ miR precursors miR-9 and miR-326 (Invitrogen) at final concentrations of 20, 50, and 100 nm. We also transfected Ambion® Anti-miR™ miRNA Inhibitors (Invitrogen) for miR-9 and miR-326. We used DMEM supplemented with 10% FBS without antibiotics to culture the transfected cells for 48 h. We then collected cells for RNA and protein extraction using the mirVana PARIS kit (Invitrogen).
Human iPSCs and Dopaminergic (DA) Neuron Differentiation
We generated three iPSC lines from fibroblasts cells of two individuals (GM01835 and GM03652) (from Coriell) and from skin biopsy of a healthy adult volunteer. The NorthShore University HealthSystem Institutional Review Board approved the study. We used a polycistron lentivirus vector (STEMCCA) containing four standard reprogramming factors (OCT4, SOX2, c-MYC, and KLF4) to infect the fibroblasts for generating iPSCs as previously described (50, 51). The iPSC clones were identified by stem cell-like morphology and positive immune fluorescence staining for pluripotent stem cell markers (TRA-1–60, OCT4, NANOG, and SSEA4). The iPSC clones were further evaluated for pluripotency by testing the formation of embryoid bodies that spontaneously differentiate into three germ layers (52). The three germ layers were characterized by immune fluorescence staining of α-fetoprotein (endoderm), tubulin β-III (ectoderm), and α-smooth muscle actin (Mesoderm). Human iPSCs were cultured on mouse embryonic fibroblasts (Global Stem) in standard human embryo stem cell media (53). For DA neuron differentiation, we adopted a floor-plate-based midbrain DA differentiation method as previously described (53). In brief, we grew ∼2.2 million iPSCs on a 10-cm dish pre-coated with Matrigel (BD Biosciences) for 11 days for floor-plate induction by exposing cells to a combination of LDN193189, SB431542, SHH C25II, Purmorphamine, FGF8 and CHIR99021. On day 11 we changed the media to Neurobasal/B27/l-Glut containing medium (NB/B27) (Invitrogen). On day 13 we changed the media to differentiation media (NB/B271, BDNF, ascorbic acid, glial cell-derived neurotrophic factor, dibutyryl-cAMP, TGFb3 and DAPT). On day 20, we dissociated and replated the cells at high density (300–400 × 103 cells/cm2) on 6-well plates and coverslips precoated with poly-d-lysine/laminin in differentiation medium. We kept the neurons in differentiation until the day for a certain experiment. For single neuron gene expression analysis to determine the percentage of DA neurons (TH+ neurons), we manually picked single neurons by serial dilution into wells on 96-well plate and directly lysed cells and carried out reverse transcription using CellsDirect™ One-Step qRT-PCR kit (Invitrogen). Quantitative PCR was performed on Fluidigm BioMark system as described below. We assayed expression of TH, MAP2, and GAPDH, and only samples with all three replicates of a gene assay passing the Ct threshold were considered “expressed.”
Real-time Quantitative PCR
We reverse-transcribed total RNAs extracted from transfected cells or iPSC/neurons using TaqMan® Reverse Transcription Reagents (Invitrogen). We used 350 ng of RNA per 20-μl reverse transcription reaction with both random hexamers and oligo(dT)16 to prime the reaction. To quantify gene expression, we used 2 μl of the reverse-transcribed cDNA in the subsequent real-time PCR using TaqMan gene expression assays (Invitrogen) in combination of TaqMan universal PCR Mastermix (Invitrogen). For miR quantification, we used the TaqMan® MicroRNA Reverse Transcription kit in the reverse transcription reaction and the TaqMan® MicroRNA Assay (for miR-9, miR-326 and RNU48) in real-time PCR. For expression quantification in NT2 cells, we carried out PCR in a 20-μl reaction with 4 replicates on a 384-well plate on a 7900HT (Invitrogen) with standard real-time PCR cycling conditions. For expression quantification in iPSCs and DA neurons, we carried out multiplex quantitative PCR on BioMark microfluid Dynamic Gene Expression Array (Fluidigm). We performed pre-amplifications of the reverse-transcribed cDNA products (also known as Specific Target Amplification) separately for miRNA and mRNAs (DRD2 and other genes) following the protocol recommended by Fluidigm. The preamplified products were then diluted (1:4 for miRNA and 1:2.5 for mRNA) and pooled together with equal amounts followed by multiplex PCR on a 48.48 Dynamic Gene Expression Array (Fluidigm) with three technical replicates. We used the standard Δ-Ct method (Invitrogen) for relative expression quantification. Expression of GAPDH was used as an endogenous control to normalize the mRNA abundances, and the expression of RNU48 was used as an endogenous control to normalize the expression of miRs.
Western Blotting
To quantify the DRD2 expression at the protein level, we plated NT2 cells at 2.5 × 10⁵ cells per well on a 6-well plate 24 h before transfection with different miRs or anti-miRs as described above. We lysed cell cultures after 48 h and extracted proteins using the mirVana PARIS kit from each cell culture. We prepared cell lysate with SDS and then ran the cell lysate on a 4–20% precast linear gradient polyacrylamide Bio-Rad Ready Gel (Bio-Rad). We transferred protein bands onto a nitrocellulose membrane via the semidry transfer method. We then blocked the membrane with 5% nonfat milk (Bio-Rad) in 5% PBS-Tween for 1 h and then incubated sequentially with mouse monoclonal antibody against human DRD2 receptor (sc-5303) and with goat anti-mouse HRP (horseradish peroxidase) (sc-2005) with washing between incubations. We probed the expression of the endogenous control β-actin by HRP-conjugated goat polyclonal IgG antibody against actin (C-11) (sc-1615-HRP). We purchased all antibodies from Santa Cruz Biotechnology and used them at the manufacturer's recommended dilution. We exposed the membrane with SuperSignal West Femto Chemiluminescent Substrate (Thermo Scientific). The amounts of DRD2 and β-actin on gel images from Western blots were quantified by ImageJ 1.47v (54).
Transcriptome Data of Developing Human Brain Tissues
We obtained the miRNA sequencing data and RNA sequencing (RNA-seq) data of developing brain tissues from the Allen Institute for Brain Science-BrainSpan Atlas of the Developing Human Brain. The full data set includes 1,620 miRNAs of 215 brain samples and 52,376 genes (Gencode v10) of 524 brain samples. These samples are from various postmortem brain regions of developmental stages of different individuals. We extracted 185 samples (for 16 brain regions) with expression data available for both the DRD2 and the two miRNAs, miR-326 and miR-9 (supplemental Table 1). Details of tissue acquisition, RNA-seq and miRNA-seq data processing, and data normalization can be found in the technical white paper BrainSpan Atlas of the Developing Human Brain.
Statistics and Bioinformatics
We used Student's t test to assess the significance of differential expression of reporter gene and endogenously expressed DRD2 between different experimental conditions. Two-tailed p values were reported. In addition, for each miR with >3 experimental groups, we also performed ANOVA to test for differences across different groups. We extracted genomic sequences from the UCSC genome browser and the miR target sites on the 3′-UTRs of DRD2 from the UCSC genome browser tracks annotated by TargetScan (55) and by PicTar (56). We predicted the RNA folding structures between miRs and targeting sequences (i.e. miR/target duplexes) and the minimum folding energy (ΔG) using RNAhybrid (57). We calculated LD between different SNPs of DRD2 gene with Haploview (58).
RESULTS
Both miR-9 and miR-326 Interact with the 3′-UTR of DRD2 and Repress Reporter Gene Expression
We used the Dual-Luciferase Reporter Assay System (psiCHECK™-2) to determine whether miR-9 and miR-326 interact with the 3′-UTR of DRD2 mRNA, thereby inhibiting the reporter gene (luciferase) expression. In the recombinant reporter gene construct, DRD2 3′-UTR sequence spanning the predicted binding sites of miR-9 and miR-326 was positioned downstream of the firefly luciferase open reading frame in the psiCHECK™-2 vector (Fig. 2A). Transfected pre-miR-9 or pre-miR-326 exhibited a dose-responsive negative effect on reporter gene expression in both NT2 and CHO cell lines. Pre-miR-9 at 1 nm induced ∼40% reduction of luciferase activity, and pre-miR-326 at 50 nm induced ∼50% reduction of luciferase activity (Fig. 2, B and C).
miR-9 and miR-326 Inhibit Endogenously Expressed DRD2 in NT2 Cells
A reporter gene assay proved the direct targeting of the two miRs to the 3′-UTRs of DRD2. We next examined whether the endogenously expressed DRD2 is subject to the regulation by the two miRs in NT2, a cell line that endogenously expresses miR-9, miR-326, and DRD2 (data not shown) and has been used as a model of dopaminergic neurons for studying dopamine signaling (59–62). For each miR, we tested whether overexpression of exogenous pre-miRs can inhibit endogenous expression of DRD2 and whether knocking down the endogenous miRs can increase expression of DRD2. Consistent with the reporter gene assay results, overexpression of pre-miR-326 in NT2 cells showed an inhibitory effect on endogenously expressed DRD2 mRNA, with ∼40% reduction of the DRD2 mRNA level with 50 nm pre-miR-326 (Fig. 3A). At the protein level, overexpression of pre-miR-326 (50 nm) also led to reduced DRD2 receptor expression (Fig. 3B). As expected, transfection of antisense 2′-O-methyl-modified oligoribonucleotide (63, 64) for miR-326 (anti-miR-326; at 45 nm) in NT2 cells increased DRD2 protein abundances, presumably through blocking the inhibitory effect of endogenously expressed miR-326 on DRD2 expression (Fig. 3B).
FIGURE 3.
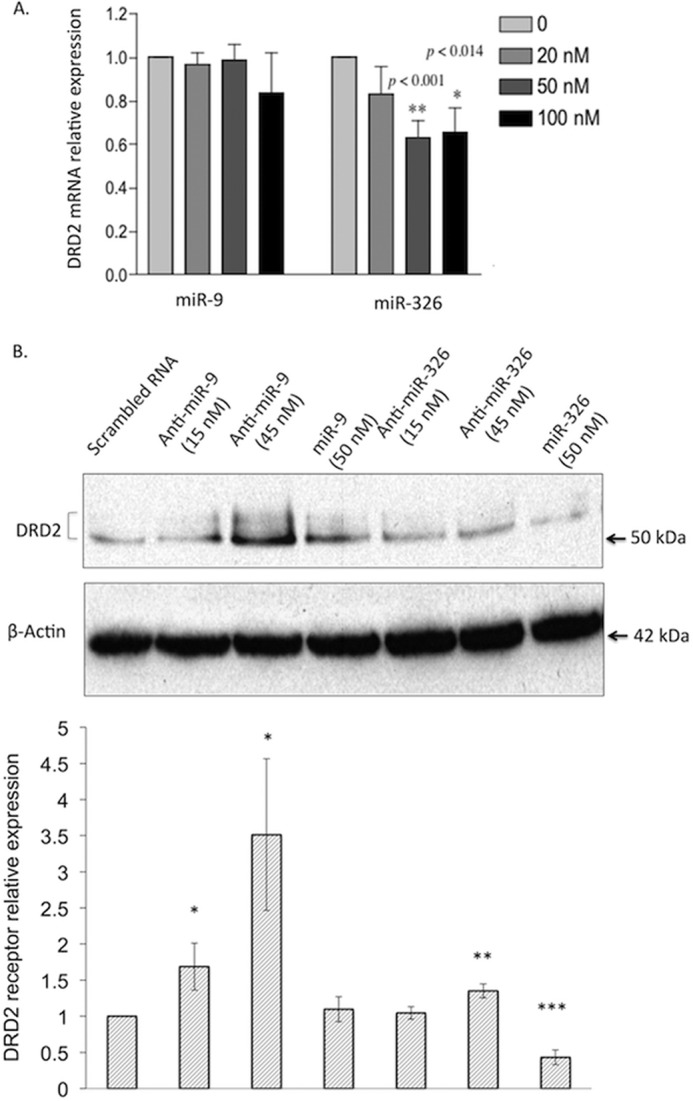
miR-9 and miR-326 inhibited endogenous DRD2 expression in NT2 cells. A, effect of different concentrations of exogenous miR-9 and miR-326 on endogenously expressed DRD2 mRNAs, with data presented as the average ±S.D. from at least three independent experiments each with 3 measurements for each condition. Different concentrations of exogenous miR-9 did not have significant effects on DRD2 expression (ANOVA p = 0.35), but concentration of miR-326 significantly influenced DRD2 expression (ANOVA p < 0.0001). B, Western blot showing the repression of DRD2 expression at the protein level by endogenously expressed miR-9 and miR-326. We harvested cell lysates 48 h post-transfection with miRs or anti-miRs, directly followed by Western blot, using β-actin as a control to normalize the DRD2 expression. The top panel shows a representative Western blot, and the bottom panel shows the relative DRD2 expression (i.e. ratio to the DRD2 expression in cells transfected with scrambled small RNAs). Anti-miR-9 (15 and 45 nm) and anti-miR-326 (45 nm) increase the endogenous expression of DRD2 receptors. Overexpression of miR-326 but not miR-9 inhibits the endogenous expression of DRD2 receptors. Data are presented as the average ± S.D. from four independent experiments. * indicates p < 0.05; ** indicates p < 0.01, and *** indicates p < 0.001 from Student's t test.
Surprisingly, overexpression of pre-miR-9 in NT2 cells did not reduce endogenously expressed DRD2 either at the mRNA or the protein levels (Fig. 3, A and B). Intuitively, this seemed to contradict to the observed high efficacy of miR-9 in inhibiting reporter gene expression (Fig. 2). However, the high efficacy of exogenous miR-9 as measured in the reporter gene assay (Fig. 2) does not necessarily translate into effective inhibition of endogenously expressed DRD2 by exogenous miR-9 in Fig. 3. It is known that the inhibitory effect of an exogenous miR on its target gene expression may not be detectable in cells where the same miR is endogenously expressed at a high levels, whereas its target gene has relatively low expression (65). In our cellular model miR-9 is expressed at a high level (∼8-fold more than miR-326) and DRD2 at a much lower level (data not shown). The endogenous miR-9 is expressed in such a high level that it may have already saturated all the miR-9 targeting site of the lowly expressed DRD2. Consequently, the transfected exogenous miR-9, even at a high concentration (50 nm), did not show any additive effect on the endogenous expression of DRD2. To test for the endogenous miR-9-mediated repression of DRD2, we transfected the cells by antisense 2′-O-methyl-modified oligoribonucleotide (63, 64) of miR-9 (anti-miR-9). As predicted, overexpression of anti-miR-9 (45 nm) in NT2 cells led to a substantial increase of DRD2 protein abundances (Fig. 3B), suggesting a strong endogenous inhibitory effect of miR-9 on DRD2 expression in NT2 cells.
Genetic Variation in the Seed Sequence of the DRD2 3′-UTR Alters the Effect of miR-326
rs1130354 is within the 7-bp “seed sequence” shared by miR-9 and miR-326, whereas rs6274 is outside the seed sequence (Fig. 1); both SNPs thus could possibly affect miR interactions. For each SNP, we transfected a reporter gene construct containing the DRD2 3′-UTR sequence with one of the two alleles together with synthetic precursor miRs into CHO and NT2 cell lines (Fig. 2). As shown in Fig. 4, A and B, the effect of exogenous miR-9 or miR-326 on reporter gene expression in cells carrying the minor allele G of rs6274 (pD2UTR-rs6274-G) was similar to that in cells transfected with the T allele (pD2UTR-wt), suggesting rs6274 did not disrupt the base pairing between either of the miRs and 3′-UTR of DRD2 mRNA. However, the minor allele G of rs1130354 (pD2UTR-rs1130354-G) abolished the inhibitory effect of miR-326. Furthermore, we observed a complete reversal of the miR-326-mediated repression of the reporter gene expression by allele G of rs1130354, indicating that the sequence flanking rs1130354 is likely the only miR-326 target site at the 3′-UTR of DRD2 mRNA, consistent with the bioinformatics prediction by TargetScan (Fig. 1B) but not by PicTar (Fig. 1A). The fact that rs1130354 only influences the effect of miR-326 but no miR-9 on DRD2 suggests miR-9 and miR-326 do not share the seed sequence for targeting DRD2 3′-UTR, i.e. both RNAs do not compete with each other at the SNP site.
FIGURE 4.

Both reporter gene assay and in silico RNA-folding structure analysis supported functionality of the allele G of rs1130354 (but not rs6274). Allele G of rs1130354 abolished the miR-326 (but not miR-9)-mediated inhibition of luciferase activity in transfected CHO cells (A) and NT2 cells (B). For both CHO and NT2 cells, SNP did not affect the inhibitory effect of miR-9 on reporter gene expression (ANOVA p > 0.05), but it did influence the inhibitory effect of miR-326 on reporter gene expression (ANOVA p < 0.0001). *** indicates p < 0.0001 from Student's t test. C, effects of minor alleles of rs1130354 and rs6274 on RNA-folding structures between miR-326 and DRD2 3′-UTR. Allele G of rs1130354, but not rs6274, disrupts the stem part of the typical stem-loop RNA-folding structure required for miR function. The arrow indicates the SNP site on DRD2 3′-UTRs in each folding structure.
The observed effect of rs1130354 and rs6274 was consistent with in silico analysis (57) of the SNP effect on RNA-folding structures formed by miR326 and its target sequence in DRD2 (Fig. 4C). With the major alleles of both SNPs, the base-pairing between DRD2 3′-UTR mRNA and the mature miR-326 results in a typical “stem-loop” structure essential for miR-mediated expression repression. The minor (or “mutant”) allele G of rs1130354 disrupts the stem part of this essential structure, and the minimum folding energy (ΔG) of the structure increases from −25.5 kcal/mol (major allele) to −23.6 kcal/mol (i.e. a less stable secondary RNA folding structure). rs6274 does not show any allelic effect on the stem-loop folding structure or the minimum folding energy.
Next, we attempted to determine whether rs1130354 functions independently from other known regulatory variants of DRD2, namely, the promoter SNP rs1799732 (−141C Ins/Del) (28), the missense SNP rs1801028 (Ser311→Cys) (23), the functional synonymous SNP rs6277 (C975T) (32), and the intronic splicing SNPs rs2283265 and rs1076560 (30). We genotyped rs1130354 in our MGS European ancestry sample in which genotype data were already available (48, 49) for the other reported functional SNPs listed above. We found that rs1130354 is a rare SNP in our MGS sample (minor allele frequency = 0.4%) and is not in LD with any other known functional variant (Fig. 5). This indicates that the functional allele of rs1130354 is not specifically in the same haplotype background with any other reported functional alleles in an individual and thus functions independently of them.
FIGURE 5.
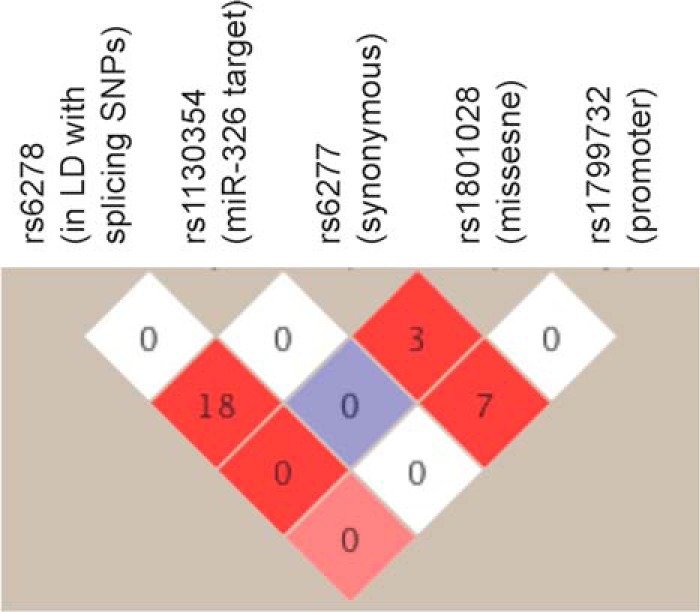
LD between the functional rs1130354 and other previously reported regulatory variants in DRD2. The number in each square is the pair-wise r2 value between SNPs, and the color represents the D′ of the comparison (white = 0 to red = 1).
miRNA Regulation of DRD2 in Differentiating Dopaminergic Neurons and in Human Brains
In human neurons and brain tissues, we further evaluated the physiological relevance of the observed post-transcriptional regulation of DRD2 by miR-326 and miR-9. Given the predominate role of the classical DA hypothesis of SZ pathogenesis, we first examined the dynamic expression changes of DRD2 and the two miRs during DA neuron differentiation. We generated three iPSC lines from different individuals and then differentiated the iPSCs into DA neurons (Fig. 6, A--C). We have achieved high efficiency (80%) of dopaminergic neuron differentiation as previously reported (53). In a single cell gene expression analysis (quantitative PCR on Fluidigm BioMark system) of 36 manually picked single cells from the day 30 DA neurons, 35 are MAP2 positive, of which 28 are TH+ (80%). This allowed us to measure miRs and DRD2 in a relatively homogenous DA neuron population. We found a substantial increase of DRD2 expression in early stage of DA neurons (day 20) compared with iPSCs (Fig. 6D) (∼95-fold increase; p = 4.7 × 10⁻⁵); thereafter, the DRD2 expression gradually decreased overtime with a 3.5-fold of decrease in day-45/50 neurons compared with day-20 neurons; p = 0.047). Interestingly, both miR-9 and miR-326 showed an inverse correlation of expression changes with the DRD2 (Spearman's rank correlation r = −0.4) during the DA neuronal differentiation, suggesting a contribution of post-transcriptional regulation of DRD2 by both miRs.
FIGURE 6.
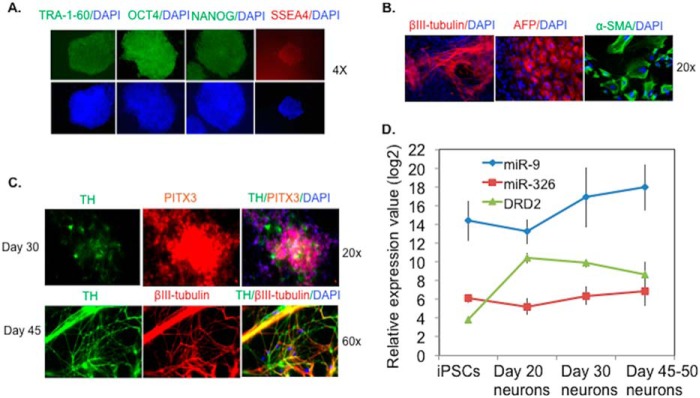
Dynamic expression changes of DRD2, miR-9 and miR-326 during DA neuron differentiation from human iPSCs. A, human iPSCs were characterized by positive immunofluorescence staining for pluripotent stem cell markers TRA-1–60, OCT4, NANOG, and SSEA4 (4× magnification). Three iPSC lines were generated from three different subjects. B, iPSCs were subjected to DA neuronal differentiation for 30 days (20× magnification) and 45 days (60× magnification). Neurons are βIII-tubulin+, and DA neurons are TH+ and PITX3+. DAPI stains nuclei. C, inverse correlation of DRD2 expression with miR-9 and miR-326 expressions during DA neuronal differentiation. DRD2 expression values were normalized to endogenous control GAPDH. Expression values of the two miRs were normalized to endogenous small RNA control RNU48. The y axis shows the relative expression values in log 2 scale. Multiplex quantitative PCR was used for expression quantification with three technical replicates per iPSC line, and the graphed data are the averages of the three iPSC lines.
Such inverse expression correlation between DRD2 and both miRs (miR-9 and miR-326) also exists in human brains. Among 16 brain regions with digital expression data available for DRD2 and both miRs (BrainSpan Atlas of the Developing Human Brain), we found negative Spearman's rank correlation of expression between DRD2 and both miRs in six brain regions (dorsolateral prefrontal cortex, inferolateral temporal cortex, ventrolateral prefrontal cortex, amygdaloid complex, cerebellar cortex, and striate cortex) (Fig. 7). There were 4 additional brain regions (hippocampus, anterior medial prefrontal cortex, orbital frontal cortex, posterior superior temporal cortex) that showed negative correlation of DRD2 expression with only miR-326 (r = −0.09 to −0.48; supplemental Table 2). Albeit the limited statistical power due to small sample size (n = ∼10) for each brain region, the inverse correlation between DRD2 and miR-326 was found statistically significant in three brain regions, dorsolateral prefrontal cortex (r = −0.90, p = 0.0003), inferolateral temporal cortex (r = −0.57, p = 0.033), and ventrolateral prefrontal cortex (r = −0.58, p = 0.039) (Fig. 7), suggesting a stronger effect of miR-326 than miR-9 on DRD2 expression changes.
FIGURE 7.
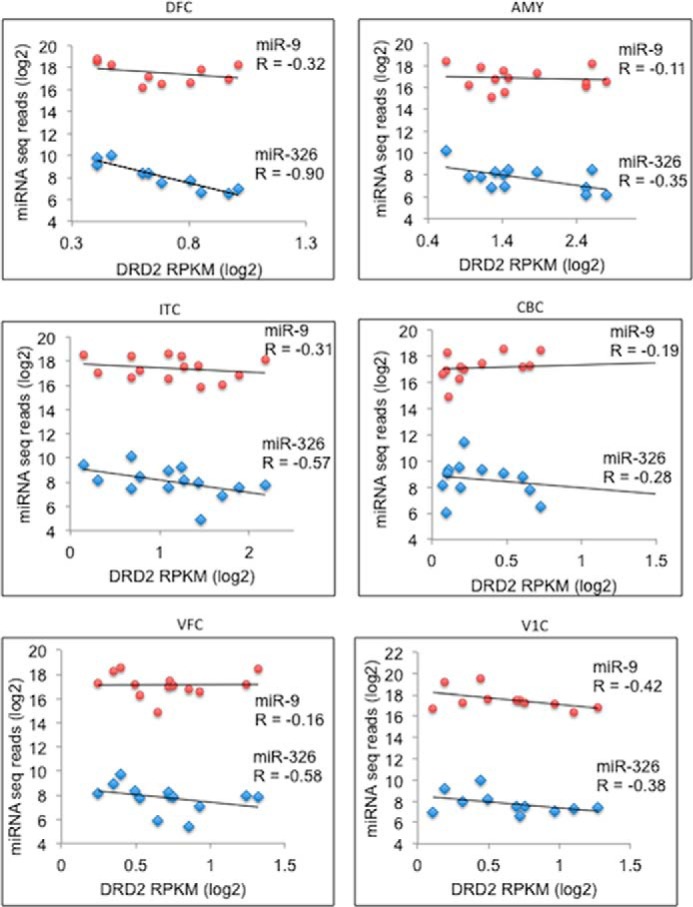
Spearman's rank expression correlation between DRD2 and miR-9 and miR-326 in developing human brains. Listed are brain regions (DFC, dorsolateral prefrontal cortex; ITC, inferolateral temporal cortex; VFC, ventrolateral prefrontal cortex; AMY, amygdaloid complex; CBC, cerebellar cortex; V1C, striate cortex) that showed inverse expression correlation (i.e. negative R) between DRD2 and miRs. In each panel, the x axis shows the expression values of DRD2 (RPKM, reads/kb transcript/million reads; in log 2 scale), and the y axis shows the expression values of miR-9 (red dots) or miR-326 (light blue dots). Each dot represents a unique brain sample with age ranging from 4 months to 23 years old.
DISCUSSION
DRD2 plays a central role in dysregulation of dopamine signaling pertinent to SZ (5–9). Here, we show that miR-326 and miR-9 can affect DRD2 expression and that the targeting of miR-326 to DRD2 mRNA is disrupted by a rare functional SNP (rs1130354) within the seed sequence of DRD2 3′-UTR. We have demonstrated the miR-mediated post-transcriptional regulatory mechanism of DRD2 in a neuronal cell model (NT2) co-expressing miR-9, miR-326, and DRD2 mRNA/protein. We further showed the pathophysiological relevance of the miR-mediated regulation of DRD2 in differentiating human DA neurons derived from iPSCs and in developing human brains. Given the central role of DRD2 in classic hyperdopaminergic hypothesis of SZ and its involvement in multiple other neuropsychiatric disorders (2–9), our study suggests a possible role of miR-9 and miR-326 in the pathophysiology of these disorders through modulating the DRD2 expression. Furthermore, as most antipsychotic drugs influence dopaminergic transmission through blocking DRD2 receptors, the demonstrated regulation of DRD2 by the two miRs may provide potential drug targets for treatment of disorders involving abnormal DRD2 function.
With reporter gene assays in two different cell lines, we confirmed the interactions between the 3′-UTR of DRD2 mRNA and exogenous miR-9 and miR-326. We also confirm the targeting of endogenous DRD2 mRNA by endogenously expressed miR-9 and miR-326 in NT2 cells. Our results contradict some bioinformatic predictions. For instance, as opposed to the PicTar prediction that there are multiple targeting sites of miR-326 in the 3′-UTR of DRD2, this study suggests the existence of a single miR-326 targeting site, because allele G of the functional rs1130354 completely reverses the miR-326-mediated repression of reporter gene expression (Fig. 4, A and B). Furthermore, although both miR-326 and miR-9 are predicted (PicTar) to share the same seed sequence, the seed-disrupting allele G of rs1130354 is found to only affect targeting of miR-326 to DRD2 3′-UTR. Thus, our results highlight the limitations of bioinformatic prediction of miR targets and support the previously proposed (65, 66) need for empirical validation of putative regulatory effects of an miR on its important target genes.
To explore the pathophysiological relevance of the observed miR-mediated DRD2 expression, we examined the co-expression of DRD2 and both miRs in differentiating DA neurons and in developing human brains. Co-expression (miRNA and targeted mRNA) analysis has becoming a general paradigm to identify bona fide targets and infer biological roles of miRNAs (67). We identified inverse expression correlations between DRD2 and the two miRs (miR-9 and miR-326) in the course of DA neuron differentiation from iPSC (Fig. 6) and in developing human brains (Fig. 7), suggesting a naturally occurring miR-9- and miR-326-mediated post-transcriptional regulation of DRD2 expression. Although miR-326 was expressed in a much lower level than miR-9 across different brain regions (∼676-fold less in average; Fig. 7 and supplemental Table 1), it showed an overall stronger effect than miR-9 on DRD2 expression variations between different individuals. This was reflected by the observation of more brain regions showing negative expression correlation of DRD2 with miR-326 (n = 10) than with miR-9 (n = 6) and with a bigger magnitude of effect from miR-326 (Fig. 7). The weaker expression correlation of DRD2 and miR-9 could be explained by the unparalleled high level of miR-9 expression than DRD2 expression, which may lead to the saturated binding of miR-9 on DRD2 3′-UTR and consequently makes the DRD2 expression less sensitive to the expression changes of miR-9. The less pronouncing effect of miR-9 on DRD2 expression variation in the brain is consistent with our observation from the in vitro cellular model NT2 cells, where overexpression of exogenous miR-9 did not result in significant changes of DRD2 expression (Fig. 3, A and B). It is noteworthy that the strongest negative correlation of DRD2 expression was found with miR-326 (r = −0.90, p = 0.0003) in the dorsolateral prefrontal cortex, a brain region where disturbances of glutamate, GABA, and dopamine neurotransmissions contribute to the deficits of working memory in schizophrenia (68). These results suggest the pathophysiological relevance of the miR-326-mediated post-transcriptional regulation of DRD2.
The demonstration of DRD2 regulation by miR-9 and miR-326 may also have implications in understanding the biological relevance of the genetic associations recently identified in genome-wide association studies of SZ. It is noteworthy that the associations of DRD2 and both miRs with SZ are nominally significant (10−6 < p < 10−3) in the recent meta-analysis of genome-wide association studies of SZ (Psychiatric Genetics Consortium; PGC1) (69) and a combined analysis with Swedish sample (PGC2) (70). The nominally associated SNPs (and their LD proxies) in MIR9–2 and MIR9–3 (two of the three MIR9 genes) are within ENCODE-annotated enhancers (histone methylation mark H3K4Me1) immediately upstream the MIR9 genes and thus likely affect MIR9 expression and may subsequently alter DRD2 expression. Furthermore, DRD2 and miR-9 have indirect functional connections to other genome-wide association study-implicated SZ loci. For instance, one of the expression repressors of miR-9, nuclear receptor subfamily 2 group E member 1 (NR2E1; also known as TLX) (71), is a target of miR-137 (72), the latter being one of the most strongly SZ-associated loci (69). Moreover, another genome-wide association study-implicated SZ susceptibility gene, ZNF804A, is a target of miR-137 (69, 73, 74) and also regulates transcription of DRD2 (75). We3 and others (76) have shown that the SZ risk allele of MIR137 locus likely reduces MIR137 expression. The SZ-risk allele at MIR137 locus thus would increase DRD2 expression through an intracellular regulation cascade of MIR137-TLX-MIR9-DRD2, which is congruent with the classic hyperdopaminergic hypothesis of SZ. Our empirical validation of the post-transcriptional regulation of DRD2 by miR-326 and miR-9 thus suggests that miR-mediated dysregulation of a gene network involving DRD2 may play an important role in SZ pathogenesis.
SNPs in miR target regions are implicated in the pathogenesis of, or susceptibility to some human disorders, e.g. hypertension (77), asthma (78), cancer (79, 80), and Tourette syndrome (81). The functional rs1130354 was not found associated with SZ in our MGS European ancestry sample (data not shown). However, rs1130354 (as well as the demonstrated effect of miRs on the expression of DRD2) might be important for other neuropsychiatric disorders and behavioral traits such as social detachment (82), neuroticism (27), and anxiety disorders (26), where dopamine and DRD2 play a central role in their pathophysiology. The demonstration of the functionality of rs1130354 in altering miRNA326 targeting of DRD2 thus warrants further an association test of rs1130354 with other neuropsychiatry disorders and behavioral phenotypes involving dysregulation of dopamine.
We acknowledge the limitation of our simplified cellular model for studying DRD2 regulation. Despite the demonstrated post-transcriptional regulation of DRD2 by both miR-9 and miR-326, transcriptional regulation likely remains a predominate mechanism in shaping the cellular RNA abundance (43). Furthermore, we only examined the post-transcriptional regulatory mechanism mediated by the 3′-UTR of DRD2 without considering the possible combined functional effects from other known regulatory variants, such as the functional promoter, splicing, and coding synonymous SNPs (28, 30–32). Nonetheless, we revealed an miR-based (miR-9 and miR-326) post-transcriptional regulatory mechanism of DRD2 expression. As DRD2 activation in the brain initiates a cascade of intracellular signaling that modulates neurotransmission of importance to the pathogenesis of several neuropsychiatric diseases (for review see Ref. 83), our study may help to understand how DRD2 expression regulation is relevant to the pathogenesis of SZ and other neuropsychiatric disorders as well as to develop more effective clinical treatment of these disorders by modulating with the effect of miRs on DRD2 expression.
Supplementary Material
Acknowledgments
We thank Dr. Gustavo Mostoslavsky (Boston University) for providing the STEMCCA polycistron vector and Drs. Yongchao Ma (Northwestern University), Zhiping Pang (Robert Wood Johnson Medical School), and Mark Tomishima (Sloan-Kettering Institute) for advising on neuronal differentiation.
This work was supported, in whole or in part, by National Institutes of Health Grant R21MH102685 (to J. D.). This work was also supported by a Brain and Behavior Research Foundation (formerly NARSAD) Young Investigator Award, NorthShore University HealthSystem Research Career Development Award, and the NorthShore University HealthSystem 2011 Pilot Award (all to J.D.).

This article contains supplemental Table 1.
J. Duan, J. Shi, C. Leites, D. He, W. Moy, and A. R. Sanders, manuscript in preparation.
- SZ
- schizophrenia
- SNP
- single nucleotide polymorphism
- TH
- tyrosine hydroxylase
- LD
- linkage disequilibrium
- miR
- microRNA
- MGS
- Molecular Genetics of Schizophrenia
- DA
- dopaminergic
- iPSC
- human induced pluripotent stem cell
- ANOVA
- analysis of variance.
REFERENCES
- 1. Carlsson A., Lindqvist M. (1963) Effect of chlorpromazine or haloperidol on formation of 3-methoxytyramine and normetanephrine in mouse brain. Acta Pharmacol. Toxicol. 20, 140–144 [DOI] [PubMed] [Google Scholar]
- 2. Creese I., Burt D. R., Snyder S. H. (1976) Dopamine receptor binding predicts clinical and pharmacological potencies of antischizophrenic drugs. Science 192, 481–483 [DOI] [PubMed] [Google Scholar]
- 3. Seeman P., Lee T. (1975) Antipsychotic drugs: direct correlation between clinical potency and presynaptic action on dopamine neurons. Science 188, 1217–1219 [DOI] [PubMed] [Google Scholar]
- 4. Lieberman J. A., Kane J. M., Alvir J. (1987) Provocative tests with psychostimulant drugs in schizophrenia. Psychopharmacology 91, 415–433 [DOI] [PubMed] [Google Scholar]
- 5. Snyder S. H. (1976) The dopamine hypothesis of schizophrenia: focus on the dopamine receptor. Am. J. Psychiatry 133, 197–202 [DOI] [PubMed] [Google Scholar]
- 6. Snyder S. H. (1974) Proceedings: drugs, neurotransmitters, and psychosis. Psychopharmacol. Bull. 10, 4–5 [PubMed] [Google Scholar]
- 7. Seeman P. (1987) Dopamine receptors and the dopamine hypothesis of schizophrenia. Synapse 1, 133–152 [DOI] [PubMed] [Google Scholar]
- 8. Howes O. D., Kambeitz J., Kim E., Stahl D., Slifstein M., Abi-Dargham A., Kapur S. (2012) The nature of dopamine dysfunction in schizophrenia and what this means for treatment. Arch. Gen. Psychiatry 69, 776–786 [DOI] [PMC free article] [PubMed] [Google Scholar]
- 9. Mita T., Hanada S., Nishino N., Kuno T., Nakai H., Yamadori T., Mizoi Y., Tanaka C. (1986) Decreased serotonin S2 and increased dopamine D2 receptors in chronic schizophrenics. Biol. Psychiatry 21, 1407–1414 [DOI] [PubMed] [Google Scholar]
- 10. Abi-Dargham A., Laruelle M. (2005) Mechanisms of action of second generation antipsychotic drugs in schizophrenia: insights from brain imaging studies. Eur. Psychiatry 20, 15–27 [DOI] [PubMed] [Google Scholar]
- 11. Seeman P., Kapur S. (2000) Schizophrenia: more dopamine, more D2 receptors. Proc. Natl. Acad. Sci. U.S.A. 97, 7673–7675 [DOI] [PMC free article] [PubMed] [Google Scholar]
- 12. Mackay A. V., Iversen L. L., Rossor M., Spokes E., Bird E., Arregui A., Creese I., Synder S. H. (1982) Increased brain dopamine and dopamine receptors in schizophrenia. Arch. Gen. Psychiatry 39, 991–997 [DOI] [PubMed] [Google Scholar]
- 13. Zakzanis K. K., Hansen K. T. (1998) Dopamine D2 densities and the schizophrenic brain. Schizophr. Res. 32, 201–206 [DOI] [PubMed] [Google Scholar]
- 14. Goldsmith S. K., Shapiro R. M., Joyce J. N. (1997) Disrupted pattern of D2 dopamine receptors in the temporal lobe in schizophrenia. A postmortem study. Arch. Gen. Psychiatry 54, 649–658 [DOI] [PubMed] [Google Scholar]
- 15. Tallerico T., Novak G., Liu I. S., Ulpian C., Seeman P. (2001) Schizophrenia: elevated mRNA for dopamine D2(Longer) receptors in frontal cortex. Brain Res. Mol. Brain Res. 87, 160–165 [DOI] [PubMed] [Google Scholar]
- 16. Abi-Dargham A., Gil R., Krystal J., Baldwin R. M., Seibyl J. P., Bowers M., van Dyck C. H., Charney D. S., Innis R. B., Laruelle M. (1998) Increased striatal dopamine transmission in schizophrenia: confirmation in a second cohort. Am. J. Psychiatry 155, 761–767 [DOI] [PubMed] [Google Scholar]
- 17. Laruelle M., Abi-Dargham A., van Dyck C. H., Gil R., D'Souza C. D., Erdos J., McCance E., Rosenblatt W., Fingado C., Zoghbi S. S., Baldwin R. M., Seibyl J. P., Krystal J. H., Charney D. S., Innis R. B. (1996) Single photon emission computerized tomography imaging of amphetamine-induced dopamine release in drug-free schizophrenic subjects. Proc. Natl. Acad. Sci. U.S.A. 93, 9235–9240 [DOI] [PMC free article] [PubMed] [Google Scholar]
- 18. Breier A., Su T. P., Saunders R., Carson R. E., Kolachana B. S., de Bartolomeis A., Weinberger D. R., Weisenfeld N., Malhotra A. K., Eckelman W. C., Pickar D. (1997) Schizophrenia is associated with elevated amphetamine-induced synaptic dopamine concentrations: evidence from a novel positron emission tomography method. Proc. Natl. Acad. Sci. U.S.A. 94, 2569–2574 [DOI] [PMC free article] [PubMed] [Google Scholar]
- 19. Farde L., Nordström A. L., Wiesel F. A., Pauli S., Halldin C., Sedvall G. (1992) Positron emission tomographic analysis of central D1 and D2 dopamine receptor occupancy in patients treated with classical neuroleptics and clozapine. Relation to extrapyramidal side effects. Arch. Gen. Psychiatry 49, 538–544 [DOI] [PubMed] [Google Scholar]
- 20. Kellendonk C., Simpson E. H., Polan H. J., Malleret G., Vronskaya S., Winiger V., Moore H., Kandel E. R. (2006) Transient and selective overexpression of dopamine D2 receptors in the striatum causes persistent abnormalities in prefrontal cortex functioning. Neuron 49, 603–615 [DOI] [PubMed] [Google Scholar]
- 21. Li Y. C., Kellendonk C., Simpson E. H., Kandel E. R., Gao W. J. (2011) D2 receptor overexpression in the striatum leads to a deficit in inhibitory transmission and dopamine sensitivity in mouse prefrontal cortex. Proc. Natl. Acad. Sci. U.S.A. 108, 12107–12112 [DOI] [PMC free article] [PubMed] [Google Scholar]
- 22. Gejman P. V., Ram A., Gelernter J., Friedman E., Cao Q., Pickar D., Blum K., Noble E. P., Kranzler H. R., O'Malley S. (1994) No structural mutation in the dopamine D2 receptor gene in alcoholism or schizophrenia. Analysis using denaturing gradient gel electrophoresis. JAMA 271, 204–208 [PubMed] [Google Scholar]
- 23. Cravchik A., Sibley D. R., Gejman P. V. (1996) Functional analysis of the human D2 dopamine receptor missense variants. J. Biol. Chem. 271, 26013–26017 [DOI] [PubMed] [Google Scholar]
- 24. Glatt S. J., Faraone S. V., Tsuang M. T. (2003) Meta-analysis identifies an association between the dopamine D2 receptor gene and schizophrenia. Mol. Psychiatry 8, 911–915 [DOI] [PubMed] [Google Scholar]
- 25. Volkow N. D., Fowler J. S., Wang G. J., Swanson J. M., Telang F. (2007) Dopamine in drug abuse and addiction: results of imaging studies and treatment implications. Arch. Neurol. 64, 1575–1579 [DOI] [PubMed] [Google Scholar]
- 26. Sipilä T., Kananen L., Greco D., Donner J., Silander K., Terwilliger J. D., Auvinen P., Peltonen L., Lönnqvist J., Pirkola S., Partonen T., Hovatta I. (2010) An association analysis of circadian genes in anxiety disorders. Biol. Psychiatry 67, 1163–1170 [DOI] [PubMed] [Google Scholar]
- 27. Jönsson E. G., Cichon S., Gustavsson J. P., Grünhage F., Forslund K., Mattila-Evenden M., Rylander G., Asberg M., Farde L., Propping P., Nöthen M. M. (2003) Association between a promoter dopamine D2 receptor gene variant and the personality trait detachment. Biol. Psychiatry 53, 577–584 [DOI] [PubMed] [Google Scholar]
- 28. Arinami T., Gao M., Hamaguchi H., Toru M. (1997) A functional polymorphism in the promoter region of the dopamine D2 receptor gene is associated with schizophrenia. Hum Mol. Genet. 6, 577–582 [DOI] [PubMed] [Google Scholar]
- 29. Zhang Y., Bertolino A., Fazio L., Blasi G., Rampino A., Romano R., Lee M. L., Xiao T., Papp A., Wang D., Sadée W. (2007) Polymorphisms in human dopamine D2 receptor gene affect gene expression, splicing, and neuronal activity during working memory. Proc. Natl. Acad. Sci. U.S.A. 104, 20552–20557 [DOI] [PMC free article] [PubMed] [Google Scholar]
- 30. Moyer R. A., Wang D., Papp A. C., Smith R. M., Duque L., Mash D. C., Sadee W. (2011) Intronic polymorphisms affecting alternative splicing of human dopamine D2 receptor are associated with cocaine abuse. Neuropsychopharmacology 36, 753–762 [DOI] [PMC free article] [PubMed] [Google Scholar]
- 31. Sullivan D., Pinsonneault J. K., Papp A. C., Zhu H., Lemeshow S., Mash D. C., Sadee W. (2013) Dopamine transporter DAT and receptor DRD2 variants affect risk of lethal cocaine abuse: a gene-gene-environment interaction. Transl. psychiatry 3, e222. [DOI] [PMC free article] [PubMed] [Google Scholar]
- 32. Duan J., Wainwright M. S., Comeron J. M., Saitou N., Sanders A. R., Gelernter J., Gejman P. V. (2003) Synonymous mutations in the human dopamine receptor D2 (DRD2) affect mRNA stability and synthesis of the receptor. Hum Mol. Genet. 12, 205–216 [DOI] [PubMed] [Google Scholar]
- 33. Hirvonen M., Laakso A., Någren K., Rinne J. O., Pohjalainen T., Hietala J. (2004) C957T polymorphism of the dopamine D2 receptor (DRD2) gene affects striatal DRD2 availability in vivo. Mol. Psychiatry 9, 1060–1061 [DOI] [PubMed] [Google Scholar]
- 34. Rodriguez-Jimenez R., Hoenicka J., Jimenez-Arriero M. A., Ponce G., Bagney A., Aragues M., Palomo T. (2006) Performance in the Wisconsin Card Sorting Test and the C957T polymorphism of the DRD2 gene in healthy volunteers. Neuropsychobiology 54, 166–170 [DOI] [PubMed] [Google Scholar]
- 35. Frank M. J., Moustafa A. A., Haughey H. M., Curran T., Hutchison K. E. (2007) Genetic triple dissociation reveals multiple roles for dopamine in reinforcement learning. Proc. Natl. Acad. Sci. U.S.A. 104, 16311–16316 [DOI] [PMC free article] [PubMed] [Google Scholar]
- 36. Jacobsen L. K., Pugh K. R., Mencl W. E., Gelernter J. (2006) C957T polymorphism of the dopamine D2 receptor gene modulates the effect of nicotine on working memory performance and cortical processing efficiency. Psychopharmacology 188, 530–540 [DOI] [PubMed] [Google Scholar]
- 37. Voisey J., Swagell C. D., Hughes I. P., Barnes M., Burton S. C., van Daal A., Morris C. P., Lawford B. R., Young R. M. (2010) A DRD2 polymorphism predicts PANSS score variability in schizophrenia patients treated with antipsychotics. Psychiatry Res. 177, 367–368 [DOI] [PubMed] [Google Scholar]
- 38. Whitmer A. J., Gotlib I. H. (2012) Depressive rumination and the C957T polymorphism of the DRD2 gene. Cogn. Affect. Behav. Neurosci. 12, 741–747 [DOI] [PMC free article] [PubMed] [Google Scholar]
- 39. Zeng Y., Yi R., Cullen B. R. (2005) Recognition and cleavage of primary microRNA precursors by the nuclear processing enzyme Drosha. EMBO J. 24, 138–148 [DOI] [PMC free article] [PubMed] [Google Scholar]
- 40. Okamura K., Hagen J. W., Duan H., Tyler D. M., Lai E. C. (2007) The mirtron pathway generates microRNA-class regulatory RNAs in Drosophila. Cell 130, 89–100 [DOI] [PMC free article] [PubMed] [Google Scholar]
- 41. Djuranovic S., Nahvi A., Green R. (2012) miRNA-mediated gene silencing by translational repression followed by mRNA deadenylation and decay. Science 336, 237–240 [DOI] [PMC free article] [PubMed] [Google Scholar]
- 42. Pasquinelli A. E. (2012) MicroRNAs and their targets: recognition, regulation, and an emerging reciprocal relationship. Nat. Rev. Genet. 13, 271–282 [DOI] [PubMed] [Google Scholar]
- 43. Duan J., Shi J., Ge X., Dölken L., Moy W., He D., Shi S., Sanders A. R., Ross J., Gejman P. V. (2013) Genome-wide survey of interindividual differences of RNA stability in human lymphoblastoid cell lines. Sci. Rep. 3, 1318. [DOI] [PMC free article] [PubMed] [Google Scholar]
- 44. Yuva-Aydemir Y., Simkin A., Gascon E., Gao F. B. (2011) MicroRNA-9: functional evolution of a conserved small regulatory RNA. RNA Biol. 8, 557–564 [DOI] [PMC free article] [PubMed] [Google Scholar]
- 45. Kefas B., Comeau L., Floyd D. H., Seleverstov O., Godlewski J., Schmittgen T., Jiang J., diPierro C. G., Li Y., Chiocca E. A., Lee J., Fine H., Abounader R., Lawler S., Purow B. (2009) The neuronal microRNA miR-326 acts in a feedback loop with notch and has therapeutic potential against brain tumors. J. Neurosci. 29, 15161–15168 [DOI] [PMC free article] [PubMed] [Google Scholar]
- 46. Ferretti E., De Smaele E., Miele E., Laneve P., Po A., Pelloni M., Paganelli A., Di Marcotullio L., Caffarelli E., Screpanti I., Bozzoni I., Gulino A. (2008) Concerted microRNA control of Hedgehog signalling in cerebellar neuronal progenitor and tumour cells. EMBO J. 27, 2616–2627 [DOI] [PMC free article] [PubMed] [Google Scholar]
- 47. Zhang L. J., Lachowicz J. E., Sibley D. R. (1994) The D2S and D2L dopamine receptor isoforms are differentially regulated in Chinese hamster ovary cells. Mol. Pharmacol. 45, 878–889 [PubMed] [Google Scholar]
- 48. Sanders A. R., Duan J., Levinson D. F., Shi J., He D., Hou C., Burrell G. J., Rice J. P., Nertney D. A., Olincy A., Rozic P., Vinogradov S., Buccola N. G., Mowry B. J., Freedman R., Amin F., Black D. W., Silverman J. M., Byerley W. F., Crowe R. R., Cloninger C. R., Martinez M., Gejman P. V. (2008) No significant association of 14 candidate genes with schizophrenia in a large European ancestry sample: implications for psychiatric genetics. Am. J. Psychiatry 165, 497–506 [DOI] [PubMed] [Google Scholar]
- 49. Shi J., Levinson D. F., Duan J., Sanders A. R., Zheng Y., Pe'er I., Dudbridge F., Holmans P. A., Whittemore A. S., Mowry B. J., Olincy A., Amin F., Cloninger C. R., Silverman J. M., Buccola N. G., Byerley W. F., Black D. W., Crowe R. R., Oksenberg J. R., Mirel D. B., Kendler K. S., Freedman R., Gejman P. V. (2009) Common variants on chromosome 6p22.1 are associated with schizophrenia. Nature 460, 753–757 [DOI] [PMC free article] [PubMed] [Google Scholar]
- 50. Sommer C. A., Sommer A. G., Longmire T. A., Christodoulou C., Thomas D. D., Gostissa M., Alt F. W., Murphy G. J., Kotton D. N., Mostoslavsky G. (2010) Excision of reprogramming transgenes improves the differentiation potential of iPS cells generated with a single excisable vector. Stem Cells 28, 64–74 [DOI] [PMC free article] [PubMed] [Google Scholar]
- 51. Sommer C. A., Stadtfeld M., Murphy G. J., Hochedlinger K., Kotton D. N., Mostoslavsky G. (2009) Induced pluripotent stem cell generation using a single lentiviral stem cell cassette. Stem Cells 27, 543–549 [DOI] [PMC free article] [PubMed] [Google Scholar]
- 52. Park I. H., Daley G. Q. (2009) Human iPS cell derivation/reprogramming. Curr. Protoc. Stem Cell Biol., 10.1002/9780470151808.sc04a01s8 [DOI] [PubMed] [Google Scholar]
- 53. Kriks S., Shim J. W., Piao J., Ganat Y. M., Wakeman D. R., Xie Z., Carrillo-Reid L., Auyeung G., Antonacci C., Buch A., Yang L., Beal M. F., Surmeier D. J., Kordower J. H., Tabar V., Studer L. (2011) Dopamine neurons derived from human ES cells efficiently engraft in animal models of Parkinson's disease. Nature 480, 547–551 [DOI] [PMC free article] [PubMed] [Google Scholar]
- 54. Schneider C. A., Rasband W. S., Eliceiri K. W. (2012) NIH Image to ImageJ: 25 years of image analysis. Nat. Methods 9, 671–675 [DOI] [PMC free article] [PubMed] [Google Scholar]
- 55. Lewis B. P., Burge C. B., Bartel D. P. (2005) Conserved seed pairing, often flanked by adenosines, indicates that thousands of human genes are microRNA targets. Cell 120, 15–20 [DOI] [PubMed] [Google Scholar]
- 56. Krek A., Grün D., Poy M. N., Wolf R., Rosenberg L., Epstein E. J., MacMenamin P., da Piedade I., Gunsalus K. C., Stoffel M., Rajewsky N. (2005) Combinatorial microRNA target predictions. Nat. Genet. 37, 495–500 [DOI] [PubMed] [Google Scholar]
- 57. Rehmsmeier M., Steffen P., Hochsmann M., Giegerich R. (2004) Fast and effective prediction of microRNA/target duplexes. RNA 10, 1507–1517 [DOI] [PMC free article] [PubMed] [Google Scholar]
- 58. Barrett J. C., Fry B., Maller J., Daly M. J. (2005) Haploview: analysis and visualization of LD and haplotype maps. Bioinformatics 21, 263–265 [DOI] [PubMed] [Google Scholar]
- 59. Misiuta I. E., Saporta S., Sanberg P. R., Zigova T., Willing A. E. (2006) Influence of retinoic acid and lithium on proliferation and dopaminergic potential of human NT2 cells. J Neurosci. Res. 83, 668–679 [DOI] [PubMed] [Google Scholar]
- 60. Sodja C., Fang H., Dasgupta T., Ribecco M., Walker P. R., Sikorska M. (2002) Identification of functional dopamine receptors in human teratocarcinoma NT2 cells. Brain Res. Mol. Brain Res. 99, 83–91 [DOI] [PubMed] [Google Scholar]
- 61. Gunter K. K., Aschner M., Miller L. M., Eliseev R., Salter J., Anderson K., Gunter T. E. (2006) Determining the oxidation states of manganese in NT2 cells and cultured astrocytes. Neurobiol Aging 27, 1816–1826 [DOI] [PubMed] [Google Scholar]
- 62. Fang H., Chartier J., Sodja C., Desbois A., Ribecco-Lutkiewicz M., Walker P. R., Sikorska M. (2003) Transcriptional activation of the human brain-derived neurotrophic factor gene promoter III by dopamine signaling in NT2/N neurons. J. Biol. Chem. 278, 26401–26409 [DOI] [PubMed] [Google Scholar]
- 63. Chen J. F., Mandel E. M., Thomson J. M., Wu Q., Callis T. E., Hammond S. M., Conlon F. L., Wang D. Z. (2006) The role of microRNA-1 and microRNA-133 in skeletal muscle proliferation and differentiation. Nat. Genet. 38, 228–233 [DOI] [PMC free article] [PubMed] [Google Scholar]
- 64. Schratt G. M., Tuebing F., Nigh E. A., Kane C. G., Sabatini M. E., Kiebler M., Greenberg M. E. (2006) A brain-specific microRNA regulates dendritic spine development. Nature 439, 283–289 [DOI] [PubMed] [Google Scholar]
- 65. Kuhn D. E., Martin M. M., Feldman D. S., Terry A. V., Jr., Nuovo G. J., Elton T. S. (2008) Experimental validation of miRNA targets. Methods 44, 47–54 [DOI] [PMC free article] [PubMed] [Google Scholar]
- 66. Thomson D. W., Bracken C. P., Goodall G. J. (2011) Experimental strategies for microRNA target identification. Nucleic Acids Res. 39, 6845–6853 [DOI] [PMC free article] [PubMed] [Google Scholar]
- 67. Gennarino V. A., D'Angelo G., Dharmalingam G., Fernandez S., Russolillo G., Sanges R., Mutarelli M., Belcastro V., Ballabio A., Verde P., Sardiello M., Banfi S. (2012) Identification of microRNA-regulated gene networks by expression analysis of target genes. Genome Res. 22, 1163–1172 [DOI] [PMC free article] [PubMed] [Google Scholar]
- 68. Volk D. W., Lewis D. A. (2010) Prefrontal cortical circuits in schizophrenia. Curr. Top. Behav. Neurosci. 4, 485–508 [DOI] [PubMed] [Google Scholar]
- 69. Schizophrenia Psychiatric Genome-Wide Association Study (GWAS) Consortium (2011) Genome-wide association study identifies five new schizophrenia loci. Nat. Genet. 43, 969–976 [DOI] [PMC free article] [PubMed] [Google Scholar]
- 70. Ripke S., et al. (2013) Genome-wide association analysis identifies 13 new risk loci for schizophrenia. Nat. Genet. 45, 1150–1159 [DOI] [PMC free article] [PubMed] [Google Scholar]
- 71. Zhao C., Sun G., Ye P., Li S., Shi Y. (2013) MicroRNA let-7d regulates the TLX/microRNA-9 cascade to control neural cell fate and neurogenesis. Sci. Rep. 3, 1329. [DOI] [PMC free article] [PubMed] [Google Scholar]
- 72. Sun G., Ye P., Murai K., Lang M. F., Li S., Zhang H., Li W., Fu C., Yin J., Wang A., Ma X., Shi Y. (2011) miR-137 forms a regulatory loop with nuclear receptor TLX and LSD1 in neural stem cells. Nat. Commun. 2, 529. [DOI] [PMC free article] [PubMed] [Google Scholar]
- 73. Kwon E., Wang W., Tsai L. H. (2013) Validation of schizophrenia-associated genes CSMD1, C10orf26, CACNA1C, and TCF4 as miR-137 targets. Mol. Psychiatry 18, 11–12 [DOI] [PubMed] [Google Scholar]
- 74. Kim A. H., Parker E. K., Williamson V., McMichael G. O., Fanous A. H., Vladimirov V. I. (2012) Experimental validation of candidate schizophrenia gene ZNF804A as target for hsa-miR-137. Schizophr. Res. 141, 60–64 [DOI] [PMC free article] [PubMed] [Google Scholar]
- 75. Girgenti M. J., LoTurco J. J., Maher B. J. (2012) ZNF804a regulates expression of the schizophrenia-associated genes PRSS16, COMT, PDE4B, and DRD2. PLoS ONE 7, e32404. [DOI] [PMC free article] [PubMed] [Google Scholar]
- 76. Guella I., Sequeira A., Rollins B., Morgan L., Torri F., van Erp T. G., Myers R. M., Barchas J. D., Schatzberg A. F., Watson S. J., Akil H., Bunney W. E., Potkin S. G., Macciardi F., Vawter M. P. (2013) Analysis of miR-137 expression and rs1625579 in dorsolateral prefrontal cortex. J. Psychiatr Res. 47, 1215–1221 [DOI] [PMC free article] [PubMed] [Google Scholar]
- 77. Sethupathy P., Borel C., Gagnebin M., Grant G. R., Deutsch S., Elton T. S., Hatzigeorgiou A. G., Antonarakis S. E. (2007) Human microRNA-155 on chromosome 21 differentially interacts with its polymorphic target in the AGTR1 3′ untranslated region: a mechanism for functional single-nucleotide polymorphisms related to phenotypes. Am. J. Hum. Genet. 81, 405–413 [DOI] [PMC free article] [PubMed] [Google Scholar]
- 78. Tan Z., Randall G., Fan J., Camoretti-Mercado B., Brockman-Schneider R., Pan L., Solway J., Gern J. E., Lemanske R. F., Nicolae D., Ober C. (2007) Allele-specific targeting of microRNAs to HLA-G and risk of asthma. Am. J. Hum. Genet. 81, 829–834 [DOI] [PMC free article] [PubMed] [Google Scholar]
- 79. Landi D., Gemignani F., Naccarati A., Pardini B., Vodicka P., Vodickova L., Novotny J., Försti A., Hemminki K., Canzian F., Landi S. (2008) Polymorphisms within micro-RNA binding sites and risk of sporadic colorectal cancer. Carcinogenesis 29, 579–584 [DOI] [PubMed] [Google Scholar]
- 80. Yu Z., Li Z., Jolicoeur N., Zhang L., Fortin Y., Wang E., Wu M., Shen S. H. (2007) Aberrant allele frequencies of the SNPs located in microRNA target sites are potentially associated with human cancers. Nucleic Acids Res. 35, 4535–4541 [DOI] [PMC free article] [PubMed] [Google Scholar]
- 81. Abelson J. F., Kwan K. Y., O'Roak B. J., Baek D. Y., Stillman A. A., Morgan T. M., Mathews C. A., Pauls D. L., Rasin M. R., Gunel M., Davis N. R., Ercan-Sencicek A. G., Guez D. H., Spertus J. A., Leckman J. F., Dure L. S., 4th, Kurlan R., Singer H. S., Gilbert D. L., Farhi A., Louvi A., Lifton R. P., Sestan N., State M. W. (2005) Sequence variants in SLITRK1 are associated with Tourette's syndrome. Science 310, 317–320 [DOI] [PubMed] [Google Scholar]
- 82. Farde L., Gustavsson J. P., Jönsson E. (1997) D2 dopamine receptors and personality traits. Nature 385, 590. [DOI] [PubMed] [Google Scholar]
- 83. Tritsch N. X., Sabatini B. L. (2012) Dopaminergic modulation of synaptic transmission in cortex and striatum. Neuron 76, 33–50 [DOI] [PMC free article] [PubMed] [Google Scholar]
Associated Data
This section collects any data citations, data availability statements, or supplementary materials included in this article.