Abstract
MULTIPROSPECTOR, a multimeric threading algorithm for the prediction of protein–protein interactions, is applied to the genome of Saccharomyces cerevisiae. Each possible pairwise interaction among more than 6000 encoded proteins is evaluated against a dimer database of 768 complex structures by using a confidence estimate of the fold assignment and the magnitude of the statistical interfacial potentials. In total, 7321 interactions between pairs of different proteins are predicted, based on 304 complex structures. Quality estimation based on the coincidence of subcellular localizations and biological functions of the predicted interactors shows that our approach ranks third when compared with all other large-scale methods. Unlike other in silico methods, MULTIPROSPECTOR is able to identify the residues that participate directly in the interaction. Three hundred seventy-four of our predictions can be found by at least one of the other studies, which is compatible with the overlap between two different other methods. From the analysis of the mRNA abundance data, our method does not bias towards proteins with high abundance. Finally, several relevant predictions involved in various functions are presented. In summary, we provide a novel approach to predict protein–protein interactions on a genomic scale that is a useful complement to experimental methods.
Cellular operations, such as enzymatic activity, immunological recognition, DNA repair and replication, and cell signaling, are largely sustained by various types of protein–protein interactions (Alberts et al. 1994). Because many of the properties of complex systems seem to be more closely determined by their interactions than by the characteristics of their individual components, protein–protein interactions have been extensively studied over the past several decades (Frieden 1971; Legrain et al. 2001).
Being a model system relevant to human biology, baker's yeast (Saccharomyces cerevisiae) has attracted special interest from the scientific community. As biology enters the postgenomic era, genome-wide explorations of the protein–protein interactions in yeast have been initiated using a variety of high-throughput experimental techniques (Marcotte et al. 1999; Uetz et al. 2000; Ito et al. 2001; Tong et al. 2001; Zhu et al. 2001; Gavin et al. 2002; Ho et al. 2002). These approaches can be divided into two categories: the top-down proteomic approach and the bottom-up genomic approach (Ito et al. 2001). In the former approach, multiprotein complexes are purified and analyzed by mass spectrometry. This analysis provides a valuable outline of a higher-order map of the protein network; however, the question of whether two proteins within the same complex directly interact requires further investigation (Gavin et al. 2002; Ho et al. 2002). In the latter type of approach, each protein encoded in the genome of interest is expressed and examined for mutual interactions by in vitro assays such as the yeast two-hybrid system (Uetz et al. 2000; Ito et al. 2001) and protein chip analysis (Zhu et al. 2001). Based on these binary interaction data, a protein–protein interaction network can be constructed (Ito et al. 2001).
Due to the labor-intensive nature of experimental approaches, in silico algorithms for studying protein–protein interactions have also been formulated over the past several years (Marcotte et al. 1999; Overbeek et al. 1999; Huynen et al. 2000; Lu et al. 2002, 2003). With the successful advent of genome sequencing efforts, pure sequence-based approaches such as conserved gene neighboring (Huynen et al. 2000), co-occurrence of genes (Pellegrini et al. 1999), protein fusion (Marcotte et al. 1999), and an in silico two-hybrid system (Pazos and Valencia 2002) have been developed to predict protein–protein interactions. Because these methods are sequence-based, the question of which residues in the protein–protein interface actually interact often cannot be addressed, with the notable exception of the approach of Pazos and Valencia (2002). Another type of computational method, docking, is designed to reveal the spatial relationship between the interacting pairs; however, contemporary docking algorithms cannot assess which proteins interact and which do not (Gilson and Honig 1988; Helmer-Citterich and Tramontano 1994; Vakser and Aflalo 1994; Janin 1995; Gabb et al. 1997). In addition, docking requires the knowledge of the tertiary structure of both partners prior to predicting the quaternary structure; this makes docking unsuitable for genomic-scale predictions, where most protein structures have not yet been experimentally determined. Moreover, as a practical matter, the expensive computational time that docking algorithms consume prevents them from being used in genome-scale protein quaternary structure prediction.
Due to the limitations of each of the experimental and theoretical methods, none of them covers more than 60% of the proteins in the yeast genome, and among the available 80,000 interactions generated by the large-scale studies mentioned above, only a small fraction (3%) is supported by more than one method. This suggests that any specific method may have special strengths toward certain functional groups and may complement other methods (von Mering et al. 2002); thus, new approaches based on different principles are still needed to explore protein–protein interactions on a genomic scale.
Our recently developed multimeric threading algorithm, MULTIPROSPECTOR, was previously shown to predict protein–protein interactions with a reasonable degree of success, and can be applied on a genomic scale (Lu et al. 2002). The principle of this algorithm is based on protein structure; however, it does not require the knowledge of the query proteins' structure. The application of this method to the prediction on the whole proteome of yeast and the detailed evaluation of the results will provide us with a benchmark for further large-scale predictions. But the problem still remains that there is no genome whose protein–protein interactions are completely characterized by biophysical methods that determine the molecular weight and structure of the complexes. Therefore it is very difficult to fully assess the accuracy of any method.
The organization of this paper is as follows: In the Methods section, we briefly describe MULTIPROSPECTOR, and introduce the data sources of our analysis. In the Results section, we first present the general statistics for the genome-scale predictions in S. cerevisiae. Next, we analyze the predicted interactions with respect to their structures and functions, compare our predictions with interaction data determined by other approaches, and then we present examples of some biologically relevant predictions. Finally, in the Discussion section, we summarize the present work, highlight its significance, and discuss its limitations.
METHODS
MULTIPROSPECTOR Procedure
MULTIPROSPECTOR is a two-phase procedure. Phase I involves single-chain threading, where each sequence is independently threaded and assigned a list of possible candidate structures according to the Z-scores of the alignments. A permissive Z-score cutoff is used so that sequences that weakly prefer monomers but strongly prefer multimers are not missed. The Z-score for the Kth structure having energy EK is given by
 |
1 |
where <E> and σ are the mean and standard deviation values of the energy of the probe in all templates of the structural database. The Z-score gives the average number of standard deviations between the Kth and the random fold energy. In this phase, we employed our single-chain threading algorithm PROSPECTOR (Protein Structure Predictor Employing Combined Threading to Optimize Results; Skolnick and Kihara 2001).
Phase II uses multichain threading, where a set of probe sequences, each at least weakly assigned to a monomer template structure that is part of a complex, is then threaded in the presence of each other in the associated quaternary structure. If the interfacial energy and Z-scores are sufficiently favorable, then the sequences are assigned this quaternary structure. The details of this method were given previously (Lu et al. 2002).
Since the original publication of MULTIPROSPECTOR (Lu et al. 2002), two improvements have been introduced: the first improvement is the implementation of a new threading protocol in PROSPECTOR. In the newer version of PROSPECTOR, the query protein sequence is first threaded against the threading templates in the normal direction; then, the reversed query sequence is threaded against the threading templates again. Instead of using the Z-score of the energy from the normal sequence threading to indicate the significance of alignments, the Z-score of the energy difference between the normal sequence threading and the reversed sequence threading is used. By doing this, the specificity of the algorithm has been greatly improved (J. Skolnick, in prep.). The second improvement is an expanded multimer template library. Our current database was updated in February 2002 and is composed of 768 protein complexes, among which 617 are homodimers and 151 are heterodimers (as of December 2002, the size of our database increased by about 10%). The selection of the database of protein complexes is described else-where (Lu et al. 2002). The thresholds of this new version of MULTIPROSPECTOR are subsequently reset: The medium and confident Z-scores have been empirically set to be 6.0 and 9.0, respectively (good Z-scores are positive), instead of the previously used 2.0 and 5.0. The threshold of interfacial energy E0 has been set at -15.0.
Data Sources
The yeast proteome is obtained from the Web site of the KEGG database (Kyoto Encyclopedia of Genes and Genomes, http://www.genome.ad.jp/kegg/; Kanehisa et al. 2002). The corresponding amino acid sequences and functional annotations of the total 6298 open reading frames (ORFs) are subsequently downloaded.
Subcellular localizations of yeast proteins are downloaded from the MIPS (Munich Information Center for Protein Sequences) Comprehensive Yeast Genome Database (http://mips.gsf.de/proj/yeast/CYGD/db/index.html), the TRIPLES database (TRansposon-Insertion Phenotypes, Localization, and Expression in Saccharomyces, http://ygac.med.yale.edu/triples/), and Mark Gerstein′s Lab Web site (http://bioinfo.mbb.yale.edu). The combined data set has 3810 entries, 830 of which give more than one subcellular localization; for the rest, there are 1215 cytoplasmic proteins, 890 nuclear proteins, 475 mitochondria proteins, 136 endoplasmic reticulum (ER) proteins, 102 membrane proteins, 42 cytoskeleton proteins, 40 Golgi proteins, and 80 others.
We compared our predictions with the data set evaluated in a recent assessment of large-scale protein–protein interaction analyses (von Mering et al. 2002). The data listed in that article are from interaction studies employing various methods: yeast two-hybrid assays, mass spectrometry of purified complexes such as tandem affinity purification (TAP) and high-throughput mass spectrometric protein complex identification (HMS-PCI), correlated mRNA expression (synexpression), genetic interactions (synthetic lethality), and in silico predictions through genome analysis (conserved gene neighborhood, co-occurrence of genes, and gene fusion events). The list of protein–protein interactions predicted by each method can be obtained from the supplementary information that accompanies the paper (von Mering et al. 2002). In von Mering et al. (2002), high confidence interactions are defined as those supported by two or more of the above-mentioned methods. An interaction confirmed by only one of those methods is considered to be of medium or low confidence, depending of how many times the interaction is found in the data set. Among the 78,390 interactions listed by those authors, 2455 interactions are high-confidence, 9400 are medium-confidence, and 66,535 are low-confidence.
Distribution of Predicted Interactions According to Functional Categories
We assign each of the 6298 yeast ORFs to one of 12 categories related to broad biological functions (or to the category “uncharacterized”) as in von Mering et al. (2002). Next, based on the predicted interactions under analysis, we calculate the protein interaction density for each pairwise combination of the 13 functional categories. The protein interaction density (PID) is defined as the ratio of the number of observed protein interaction pairs to the total number of possible pairwise combinations of protein pairs belonging to the corresponding categories (Ge et al. 2001).
RESULTS
Completion of Protein–Protein Interaction Predictions by MULTIPROSPECTOR
All of the 6298 unique ORFs encoded by the S. cerevisiae genome including their amino acid sequences and functional annotations are downloaded from the KEGG database and threaded against our structural template library. The current template library is a representative set of Protein Data Bank (PDB) structures and contains 3405 protein folds where the sequence identity between each two folds is less than 35%. These 3405 templates are composed of 616 chains from homodimers, 255 heterodimers, and 2534 chains from monomers or higher-order multimers. The fold library can be found on our Web site at http://bioinformatics.buffalo.edu/proint/.
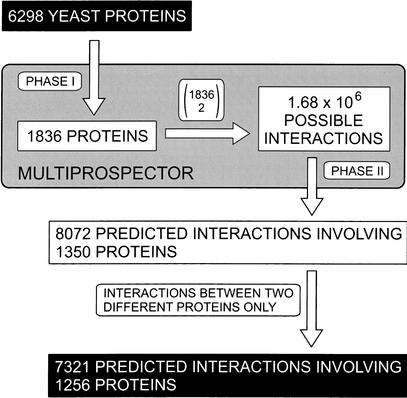
The procedure to predict protein–protein interactions using MULTIPROSPECTOR is illustrated in Figure 1. There are 1836 (out of 6298) proteins that have at least medium-confident hits (Z-score > 6.0) to the threading templates after Phase I threading. Because only when both proteins have hits in the threading templates can we proceed to Phase II, we only calculate the pairwise combinations of these 1836 proteins, that is, over one and a half million possible binary interactions in total. Analysis of the calculation results (Z-scores and interfacial energies) provides 8072 predicted interactions involving 1350 proteins, among which 7321 are interactions between two different protein partners. In the following analyses, only these 7321 interactions involving 1256 unique proteins are considered. From this point on, when we mention our predicted interactions, we are referring to these 7321 interactions.
Figure 1.
Procedure for genomic-scale prediction of protein–protein interactions by MULTIPROSPECTOR.
Subcellular Localizations of Predicted Interactions
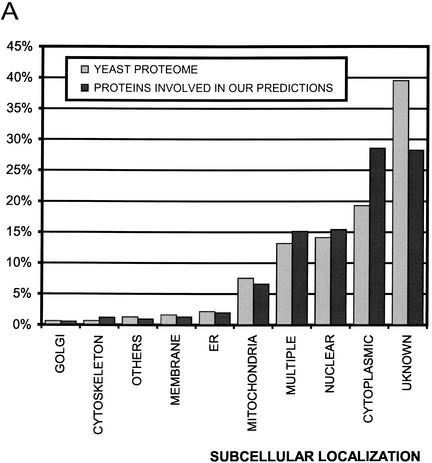
The subcellular localization of the 1256 proteins involved in the predicted interactions is examined (Fig. 2A). The results show that our predictions are somewhat biased towards the cytoplasmic compartment and against unknown locations.
Figure 2.
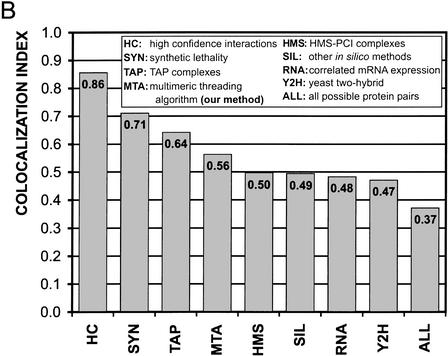
Subcellular localization of yeast proteins. (A) Distribution of subcellular localization of yeast proteome compared with proteins involved in our predicted interactions. (B) Comparison of colocalization index, which is defined as the ratio of the number of protein pairs in which both partners have the same subcellular localization to the number of protein pairs where both partners have any sub-cellular localization annotation.
Subcellular localization data also helps us to assess the quality of our predictions. Two predicted interacting partners sharing the same subcellular location annotation are more likely to form a true interaction. Thus, we calculate the colocalization index for different protein interaction data and for all possible yeast protein pairs. The colocalization index is defined as the ratio of the number of protein pairs in which both partners have the same subcellular localization (Nsame) over the number of protein pairs where both partners have any subcellular localization annotation (Nany), that is,
 |
2 |
The number of predicted interactions with both proteins having known subcellular localizations (not necessarily the same) is 3603. When both partners are required to be colocalized, the number of interactions decreases to 2028, and thus the colocalization index is 0.56. Figure 2B compares the colocalization indexes for high-confidence interactions, interactions identified by several high-throughput methods, and for all possible pairs of yeast proteins. We can see that the quality of our predictions is lower than the high-confidence interactions, but our method ranks third among the compared high-throughput approaches.
Structural Groups of Predicted Interactions
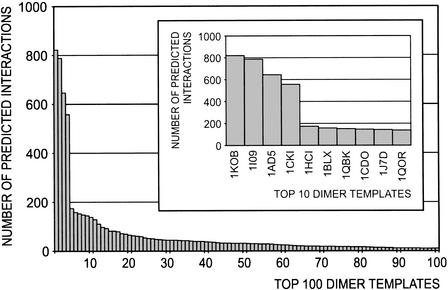
The 7321 predicted interactions are based on 304 out of 768 templates in our complex database. We plotted the number of predicted interactions assigned to each one of the top 100 dimer templates that originated the largest number of predictions (Fig. 3).
Figure 3.
Structural groups of predicted interactions: the number of predictions assigned to the protein complexes in our dimer database. The 100 most populous complexes are shown. The inset is an enlargement for the top 10 complexes.
The top ten of such complexes are: 1KOB (twitchin kinase fragment), 1I09(glycogen synthase kinase-3 beta), 1AD5 (src family tyrosine kinase), 1CKI (casein kinase I delta), 1HCI (rod domain alpha-actinin), 1CDO (liver class I alcohol dehydrogenase), 1QBK (nuclear transport complex karyopherin-beta2-Ran GppNHp), 1J7D (ubiquitin conjugating enzyme complex), 1BLX (cyclin-dependent kinase CDK6 / inhibitor p19INK4D), and 1QOR (quinone oxidoreductase).
Functional Groups of Predicted Interactions
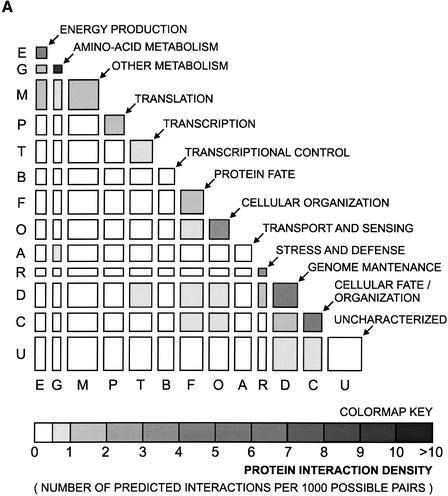
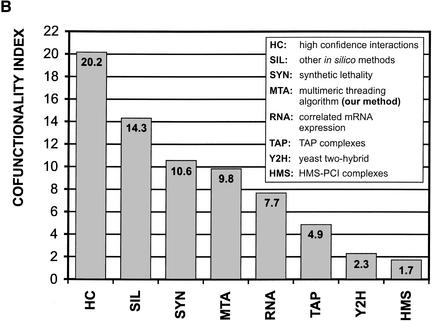
To assess the accuracy of our predicted interactions, we calculate their distribution according to the biological functions of the interactors. Although proteins from different groups of biological functions can still interact with each other, it has been shown that the degree to which interacting proteins are annotated with the same functional category is a measure of quality for the predicted interactions (von Mering et al. 2002). The distribution of our predicted interactions in functional categories is represented in Figure 4A through a matrix of protein interaction density. This result shows that our predictions cluster fairly well on the diagonal, where the homofunctional interactions are represented. In order to quantify the extension of this clustering, we calculate the cofunctionality index. The cofunctionality index is defined as the ratio of the average protein interaction density for homofunctional interactions (PIDhomofunc) over the average protein interaction density for heterofunctional interactions (PIDheterofunc), that is,
 |
3 |
We analyze our predictions as well as large-scale data sets of protein–protein interactions from other approaches (von Mering et al. 2002). First, we compute the matrices of protein interaction density associated with the data sets to be compared (data not shown); next we calculate the corresponding cofunctionality indexes. Figure 4B shows that the cofunctionality index for our method is about half of the index for high-confidence interactions and ranks third among the compared large-scale approaches.
Figure 4.
Functional group predicted interaction. (A) Distribution of our predicted interactions in functional categories. Each axis on the matrix of protein density represents the yeast proteome, which has been subdivided into 13 functional categories. The width and the height of each cell, except for the “Uncharacterized,” which is too large to be shown in scale, is proportional to the number of proteins in the corresponding categories. (B) Comparison of cofunctionality index, which is defined as the ratio of the average protein interaction density for homofunctional interactions (diagonal of the matrix in A) to the average protein interaction density for heterofunctional interactions.
The distributions of predicted interactions in functional categories are also compared by calculating the correlation coefficients between corresponding cells in each pair of matrices of protein interaction density. The results are shown in Table 1. The distribution that shows the highest correlation coefficient with the distribution of our predicted interactions is that of the high-confidence interactions (0.739). If we compare the correlation between the distribution of high-confidence interactions with the distributions of interactions revealed by all large-scale methods, ours has the third highest correlation coefficient.
Table 1.
Comparison of Distributions of Predicted Interactions in Functional Categories for Large-Scale Studies
| MTAa | TAPb | HMSc | Y2Hd | RNAe | SILf | SYNg | |
|---|---|---|---|---|---|---|---|
| TAP | 0.170 | ||||||
| HMS | 0.461 | 0.346 | |||||
| Y2H | 0.436 | 0.518 | 0.325 | ||||
| RNA | 0.701 | 0.087 | 0.384 | 0.060 | |||
| SIL | 0.556 | 0.350 | 0.474 | 0.023 | 0.740 | ||
| SYN | 0.578 | 0.332 | 0.107 | 0.677 | 0.016 | 0.005 | |
| HCh | 0.739 | 0.488 | 0.542 | 0.318 | 0.869 | 0.799 | 0.248 |
Our Multimeric Threading Algorithm.
TAP complexes.
HMS-PCI complexes.
Yeast two-hybrid.
Correlated mRNA expression.
Other in silico methods.
Synthetic lethality.
High confidence interactions, i.e., the interactions determined by at least two different large-scale methods.
Comparison With the Existing Yeast Interaction Data
We next examine the overlap of our predicted interactions with the existing yeast interaction data listed by von Mering et al. (2002). The overlap of the 7321 predicted interactions with all of the 78,390 existing yeast interactions is 374, among which 49 are of high confidence, 63 are of medium confidence, and 262 are of low confidence.
The overlapping interactions of different large-scale studies are listed in Table 2. The percentage of the interactions between our predicted interactions is at the same magnitude as the overlap between any other two large-scale studies.
Table 2.
Overlap of Interactions Between Large-Scale Studies
| MTAa | TAPb | HMSc | Y2Hd | RNAe | SILf | SYNg | |
|---|---|---|---|---|---|---|---|
| MTA | 7321h | ||||||
| TAP | 103i | 18027 | |||||
| HMS | 166 | 1728 | 33013 | ||||
| Y2H | 57 | 156 | 146 | 5125 | |||
| RNA | 44 | 192 | 124 | 8 | 16496 | ||
| SIL | 21 | 124 | 57 | 7 | 98 | 7446 | |
| SYN | 37 | 55 | 37 | 17 | 2 | 5 | 886 |
Our Multimeric Threading Algorithm.
TAP complexes.
HMS-PCI complexes.
Yeast two-hybrid.
Correlated mRNA expression.
Other in silico methods.
Synthetic lethality.
Number of interactions determined by the corresponding large-scale study.
Number of overlapping interactions between the corresponding large-scale studies.
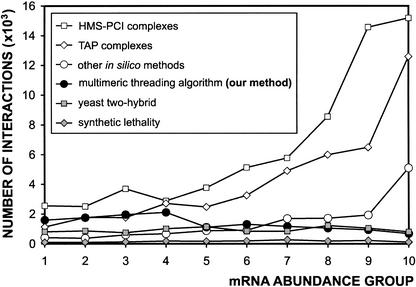
The possible bias towards proteins of high abundance is also assessed. Because the protein abundance in yeast is unavailable, mRNA expression level is often used as a substitute (Gygi et al. 1999). The number of predicted interactions is plotted against the abundance of the mRNA expression. The results show that unlike other in silico predictions, ours are not correlated with the protein abundance (Fig. 5), which makes our method more capable of revealing the interactions with low abundance.
Figure 5.
Correlation between predicted interactions and mRNA abundance. The yeast proteome is divided into ten groups of equal size according to their mRNA expression levels and is arranged in an increasing abundance order from 1–10. The results from five high-throughput studies as well as ours are compared.
Biological Significance of the Predicted Interactions
Our predictions are significant in part because they promote some of the low-confidence interactions to high-confidence interactions. Benchmarks against a set of trusted interactions have shown that high-confidence interactions, that is, those identified by at least two high-throughput methods, are more accurate than low-confidence interactions (von Mering et al. 2002). Our predictions have 262 common interactions with the low-confidence interactions and thus promote them to high-confidence interactions. This is shown in the following two examples, where the biological functions of the two interacting proteins make the predictions even more convincing.
Msh5p [YDL154W] and Hsl7p [YBR133C]
Msh5p is a member of the MutS family of proteins able to recognize specific DNA structures associated with recombination intermediates. The role of Msh5p in S. cerevisiae is to facilitate the crossover between homologous chromosomes, ensuring that they segregate at the first meiotic division (Hollingsworth et al. 1995). The points of crossover maintain the two homologous dyads together until the attachment of the spindle fibers and the migration of the chromatids to opposite poles of the cell. Hsl7p is a component of the budding yeast spindle, present in a protein complex that is functionally related to the chromosome segregation (Wigge and Kilmartin 2001). The interaction between Msh5p and Hslp7 has only been shown in a two-hybrid large-scale experiment (Uetz et al. 2000). Our result increases the confidence of this interaction that links two clearly correlated biological processes: resolution of crossovers and chromosome segregation.
Lcp5p [YER127W] and Mpp10p [YJR002W]
Lcp5p was first identified in a screen for synthetic lethal mutations with a temperature-sensitive allele of poly(A) polymerase (Wiederkehr et al. 1998). Consistent with its role in precursor ribosomal RNA (pre-rRNA) processing, Lcp5p is located in the nucleolus and is associated with the yeast homolog of the small nucleolar RNA U3, or U3 snoRNA. The small nucleolar RNAs are essential for production of ribosomal RNA, whether marking individual nucleotides for modification or assisting the cleavage of pre-rRNA (Terns and Terns 2002). U3 snoRNA interacts with at least eight proteins that have not been found in other snoRNP complexes, Mpp10p being one of them (Dunbar et al. 1997). Unlike other U3 snoRNP components, sequences in the 3′ domain are not sufficient for Mpp10p association. Instead, a conserved sequence element in the U3 snoRNA hinge region is required, placing Mpp10p near the 5′ domain that carries out the pre-rRNA base-pairing interactions (Wormsley et al. 2001). Although various protein components of the U3 snoRNP, including Mpp10p and Lcp5p, have been found in the same protein complex (Gavin et al. 2002), it is not known whether these proteins interact directly with one another (Terns and Terns 2002). The prediction made by our method increases the confidence level of interactions not only by confirming a previous result as in the first example, but also by proposing a physical contact between two proteins within the same complex.
The following two examples show that our method is able to identify interactions whose veracity is beyond any reasonable doubt, but are missed by all other high-throughput analyses.
Gcr1p [YPL075W] and Rap1p [YNL216W]
Gcr1p is a transcriptional activator of glycolytic genes, and Rap1p is a transcriptional regulator that can play a role in either repression or activation, depending upon the context of its binding site. Both DNA binding proteins can be coimmunoprecipitated from whole-cell extracts, suggesting that they form a complex in vivo (Tornow et al. 1993).
Sdc25p [YLL016W] and Ras1p [YOR101W]
Sdc25p is a GDP/GTP exchange factor (GEF) and Ras1p is a GTP-binding protein that activates adenylate cyclase in the presence of guanine nucleotides. The Sdc25p carboxyl-terminal domain has been shown to directly interact with Ras1p, acting as a GDP dissociation stimulator that enhances the regeneration of the active form of the protein (Crechet et al. 1990).
Most significantly, our method predicts interactions that have not been identified anywhere but have interesting biological implications. In the existing yeast interaction data generated by other high-throughput methods, 5321 yeast proteins participate in at least one interaction; meanwhile the remaining 977 yeast proteins have not yet been assigned to any protein–protein interaction. In the present study, in addition to revealing more combinations among some of the 5321 proteins, we predict 230 new interactions involving 125 of the above mentioned 977 yeast proteins. The next example is a novel prediction that was selected from these 230 predicted interactions, and still needs to be confirmed by experiments.
Dot1p [YDR440W] and Yku70p [YMR284W]
DOT1 was identified in a genetic screening for genes whose overexpression disrupts telomeric silencing (Singer et al. 1998). Telomeric silencing or telomere-position effect is a phenomenon in which a normally active gene is repressed because of its chromosomal location near the telomeres (protein-DNA structures at the ends of eukaryotic chromosomes). In an independent screening, DOT1 was also identified as a silencing factor that affects meiotic checkpoint control, ensuring proper chromosome segregation by preventing meiotic progression when recombination and chromosome synapsis are defective (San-Segundo and Roeder 2000). A recent report confirmed that Dot1p methylates Lys79 of histone H3, a conserved residue located at the surface of the histone octamer, where methylation could affect the interaction with other proteins (Ng et al. 2002). The intrinsic histone H3 methyltransferase activity of Dot1p is specific to nucleosomal substrates and is a key aspect of its function in telomeric silencing, probably by modulating chromatin structure (Lacoste et al. 2002).
Yku70p was first shown to promote accurate repair of double-strand breaks with cohesive ends (Boulton and Jackson 1996). The Yku70p/Yku80p heterodimer, the yeast homolog of mammalian Ku70p/Ku80p that binds to the ends of double-stranded DNA with high affinity (Mimori and Hardin 1986), is also present at the telomeres, and it is required for the integrity of telomeric heterochromatin (Laroche et al. 1998; Mishra and Shore 1999). Moreover, it has been shown that the Yku heterodimer participates in telomeric silencing, likely through the recruitment or activation of silent information regulators, or SIR proteins (Mishra and Shore 1999). Thus, the likelihood of the physical interaction between Yku70p and Dot1p predicted in our study is reinforced by the fact that both proteins bind to the same highly specific chromosomal regions and share similar functional roles in telomeric silencing.
DISCUSSION
In the present work, we applied our recently developed multimeric threading algorithm, MULTIPROSPECTOR, to genomic-scale predictions of the protein–protein interactions in S. cerevisiae. This approach predicts 7321 interactions between pairs of different proteins. The accuracy of our predictions was assessed and compared with other large-scale interaction data sets generated by various methods (von Mering et al. 2002). A few interesting predictions have also been discussed.
Although several high-throughput methods have been designed to identify protein–protein interactions in yeast, the connection between these interactions with three-dimensional structures is rarely studied (Aloy and Russell 2002). Our approach is strongly based on structures of existing protein–protein complexes. Furthermore, our method is fast enough for genomic-scale interaction prediction, where millions of possible interacting protein pairs need to be evaluated. Because this approach is based on a different principle from those existing methods, the prediction results are a useful complement.
A significant portion of our predicted interactions is based on structures of kinase complexes. This is due to the relatively large number of proteins in the yeast genome that are classified as kinases (Hunter and Plowman 1997) and the very high connectivity that they exhibit in the yeast interactome (Wuchty 2002). Moreover, because of the richness of kinases in the PDB, fruit of their biological significance and diversity, kinases are also well represented in our complex database.
One limitation that affects the coverage of our approach is the reduced number of solved protein complexes in the PDB. However, as the size of the PDB grows (Sussman et al. 1998), the number of solved complex structures also greatly increases. As our multimeric database expands, our method will be able to make more predictions.
The performance of this approach also depends on the accuracy of the single-chain threading, PROSPECTOR, the first step of multimeric threading. However, PROSPECTOR has been shown to do comparatively better than alternative threading approaches developed previously (Skolnick and Kihara 2001). In addition, PROSPECTOR-based multimeric threading has been tested on a benchmark set comprised of 40 homodimers, 15 heterodimers, and 69 monomers, and achieves a relatively low error rate (Lu et al. 2002).
Another possible error source is the accuracy and specificity of the interfacial energies that have been used in MULTIPROSPECTOR to differentiate multimers from monomers. These statistical interfacial potentials are derived from a highquality dimer database that consists of 271 homodimers and 69 heterodimers (Lu et al. 2002). Although the potentials derived from homodimers only and those from heterodimers only show a high correlation coefficient of 0.92 (Lu et al. 2003), more detailed classification of the protein interfaces will probably be able to improve our potentials.
The results of other in silico methods were similar (see the correlation with high-confidence interactions in Table 1, the number of predicted interactions in Table 2, and the colocalization index in Fig. 2B) if not better (cofunctionality index in Fig. 4B) than the ones obtained by MULTIPROSPECTOR. However, our approach has an important advantage over other sequence-based in silico methods. Analyses of test cases (Lu et al. 2002) show that MULTIPROSPECTOR can predict 68% and 74% of the true interfacial residues in homo- and heterodimers, respectively (L. Lu, in prep.). Thus, besides predicting interactions between proteins, our method also identifies the residues of each protein that participate directly in the interaction.
A common problem for various high-throughput approaches is generating a significant fraction of false positive predictions. At this stage, it is still impossible to accurately assess the false-positive rate because the complete interaction network is not yet available in yeast. However, the correctness can be implicitly assessed by subcellular localization and functional group analysis, as shown in Figures 2B and 4B. These analyses strongly suggest that the quality of our approach is better than the average of existing high-throughput methods. We also realize that more stringent criteria than mere functional analyses are necessary to fully evaluate the quality of the predictions made by our method, because it predicts the quaternary structure of the complexes as well as whether or not two proteins interact. To perform such an evaluation would require a large set of proteins whose protein–protein interactions are completely characterized by biophysical methods that determine both the structures and the thermodynamics of the complexes. At this stage, it is impractical to prepare such a large-scale benchmark; nevertheless, such a benchmark would greatly assist with the validation of any protein–protein interaction prediction method.
Regardless of its limitations, MULTIPROSPECTOR is one of the first attempts to employ a structure-based threading method to study the protein–protein interactions on a genomic scale. Compared with large-scale interaction data from various other approaches, our method achieved fairly good accuracy. Thus, it can be one of the useful tools in proteomics studies.
Acknowledgments
This research was supported in part by Grant GM-48835 from the Division of General Medical Sciences of the U.S. NIH. We thank Peer Bork and Christian von Mering for generously providing us with some of the interaction data.
The publication costs of this article were defrayed in part by payment of page charges. This article must therefore be hereby marked “advertisement” in accordance with 18 USC section 1734 solely to indicate this fact.
Article and publication are at http://www.genome.org/cgi/doi/10.1101/gr.1145203.
References
- Alberts, B., Bray, D., Lewis, J., Raff, M., Roberts, K., and Watson, J.D. 1994. Molecular biology of the cell, chapter 3. Garland Publishing Inc., New York, London.
- Aloy, P. and Russell, R.B. 2002. Interrogating protein interaction networks through structural biology. Proc. Natl. Acad. Sci. 99: 5896–5901. [DOI] [PMC free article] [PubMed] [Google Scholar]
- Boulton, S.J. and Jackson, S.P. 1996. Saccharomyces cerevisiae Ku70 potentiates illegitimate DNA double-strand break repair and serves as a barrier to error-prone DNA repair pathways. EMBO J. 15: 5093–5103. [PMC free article] [PubMed] [Google Scholar]
- Crechet, J.B., Poullet, P., Mistou, M.Y., Parmeggiani, A., Camonis, J., Boy-Marcotte, E., Damak, F., and Jacquet, M. 1990. Enhancement of the GDP-GTP exchange of RAS proteins by the carboxyl-terminal domain of SCD25. Science 248: 866–868. [DOI] [PubMed] [Google Scholar]
- Dunbar, D.A., Wormsley, S., Agentis, T.M., and Baserga, S.J. 1997. Mpp10p, a U3 small nucleolar ribonucleoprotein component required for pre-18S rRNA processing in yeast. Mol. Cell. Biol. 17: 5803–5812. [DOI] [PMC free article] [PubMed] [Google Scholar]
- Frieden, C. 1971. Protein–protein interaction and enzymatic activity. Annu. Rev. Biochem. 40: 653–696. [DOI] [PubMed] [Google Scholar]
- Gabb, H.A., Jackson, R.M., and Sternberg, M.J. 1997. Modeling protein docking using shape complementarity, electrostatics and biochemical information. J. Mol. Biol. 272: 106–120. [DOI] [PubMed] [Google Scholar]
- Gavin, A.C., Bosche, M., Krause, R., Grandi, P., Marzioch, M., Bauer, A., Schultz, J., Rick, J.M., Michon, A.M., Cruciat, C.M., et al. 2002. Functional organization of the yeast proteome by systematic analysis of protein complexes. Nature 415: 141–147. [DOI] [PubMed] [Google Scholar]
- Ge, H., Liu, Z., Church, G.M., and Vidal, M. 2001. Correlation between transcriptome and interactome mapping data from Saccharomyces cerevisiae. Nat. Genet. 29: 482–486. [DOI] [PubMed] [Google Scholar]
- Gilson, M.K. and Honig, B. 1988. Calculation of the total electrostatic energy of a macromolecular system: Solvation energies, binding energies, and conformational analysis. Proteins 4: 7–18. [DOI] [PubMed] [Google Scholar]
- Gygi, S.P., Rochon, Y., Franza, B.R., and Aebersold, R. 1999. Correlation between protein and mRNA abundance in yeast. Mol. Cell. Biol. 19: 1720–1730. [DOI] [PMC free article] [PubMed] [Google Scholar]
- Helmer-Citterich, M. and Tramontano, A. 1994. PUZZLE: A new method for automated protein docking based on surface shape complementarity. J. Mol. Biol. 235: 1021–1031. [DOI] [PubMed] [Google Scholar]
- Ho, Y., Gruhler, A., Heilbut, A., Bader, G.D., Moore, L., Adams, S.L., Millar, A., Taylor, P., Bennett, K., Boutilier, K., et al. 2002. Systematic identification of protein complexes in Saccharomyces cerevisiae by mass spectrometry. Nature 415: 180–183. [DOI] [PubMed] [Google Scholar]
- Hollingsworth, N.M., Ponte, L., and Halsey, C. 1995. MSH5, a novel MutS homolog, facilitates meiotic reciprocal recombination between homologs in Saccharomyces cerevisiae but not mismatch repair. Genes & Dev. 9: 1728–1739. [DOI] [PubMed] [Google Scholar]
- Hunter, T. and Plowman, G.D. 1997. The protein kinases of budding yeast: Six score and more. Trends Biochem. Sci. 22: 18–22. [DOI] [PubMed] [Google Scholar]
- Huynen, M., Snel, B., Lathe III, W. and Bork, P. 2000. Predicting protein function by genomic context: Quantitative evaluation and qualitative inferences. Genome Res. 10: 1204–1210. [DOI] [PMC free article] [PubMed] [Google Scholar]
- Ito, T., Chiba, T., Ozawa, R., Yoshida, M., Hattori, M., and Sakaki, Y. 2001. A comprehensive two-hybrid analysis to explore the yeast protein interactome. Proc. Natl. Acad. Sci. 98: 4569–4574. [DOI] [PMC free article] [PubMed] [Google Scholar]
- Janin, J. 1995. Protein–protein recognition. Prog. Biophys. Mol. Biol. 64: 145–166. [DOI] [PubMed] [Google Scholar]
- Kanehisa, M., Goto, S., Kawashima, S., and Nakaya, A. 2002. The KEGG databases at GenomeNet. Nucleic Acids Res. 30: 42–46. [DOI] [PMC free article] [PubMed] [Google Scholar]
- Lacoste, N., Utley, R.T., Hunter, J.M., Poirier, G.G., and Cote, J. 2002. Disruptor of telomeric silencing-1 is a chromatin-specific histone H3 methyltransferase. J. Biol. Chem. 277: 30421–30424. [DOI] [PubMed] [Google Scholar]
- Laroche, T., Martin, S.G., Gotta, M., Gorham, H.C., Pryde, F.E., Louis, E.J., and Gasser, S.M. 1998. Mutation of yeast Ku genes disrupts the subnuclear organization of telomeres. Curr. Biol. 8: 653–656. [DOI] [PubMed] [Google Scholar]
- Legrain, P., Wojcik, J., and Gauthier, J.M. 2001. Protein–protein interaction maps: A lead towards cellular functions. Trends Genet. 17: 346–352. [DOI] [PubMed] [Google Scholar]
- Lu, H., Lu, L., and Skolnick, J. 2003. Development of united statistical potentials describing protein–protein interactions. Biophys. J. 84: 1895–1901. [DOI] [PMC free article] [PubMed] [Google Scholar]
- Lu, L., Lu, H., and Skolnick, J. 2002. MULTIPROSPECTOR: An algorithm for the prediction of protein–protein interactions by multimeric threading. Proteins 49: 350–364. [DOI] [PubMed] [Google Scholar]
- Marcotte, E.M., Pellegrini, M., Ng, H.L., Rice, D.W., Yeates, T.O., and Eisenberg, D. 1999. Detecting protein function and protein–protein interactions from genome sequences. Science 285: 751–753. [DOI] [PubMed] [Google Scholar]
- Mimori, T. and Hardin, J.A. 1986. Mechanism of interaction between Ku protein and DNA. J. Biol. Chem. 261: 10375–10379. [PubMed] [Google Scholar]
- Mishra, K. and Shore, D. 1999. Yeast Ku protein plays a direct role in telomeric silencing and counteracts inhibition by rif proteins. Curr. Biol. 9: 1123–1126. [DOI] [PubMed] [Google Scholar]
- Ng, H.H., Feng, Q., Wang, H., Erdjument-Bromage, H., Tempst, P., Zhang, Y., and Struhl, K. 2002. Lysine methylation within the globular domain of histone H3 by Dot1 is important for telomeric silencing and Sir protein association. Genes & Dev. 16: 1518–1527. [DOI] [PMC free article] [PubMed] [Google Scholar]
- Overbeek, R., Fonstein, M., D'Souza, M., Pusch, G.D., and Maltsev, N. 1999. The use of gene clusters to infer functional coupling. Proc. Natl. Acad. Sci. 96: 2896–2901. [DOI] [PMC free article] [PubMed] [Google Scholar]
- Pazos, F. and Valencia, A. 2002. In silico two-hybrid system for the selection of physically interacting protein pairs. Proteins 47: 219–227. [DOI] [PubMed] [Google Scholar]
- Pellegrini, M., Marcotte, E.M., Thompson, M.J., Eisenberg, D., and Yeates, T.O. 1999. Assigning protein functions by comparative genome analysis: Protein phylogenetic profiles. Proc. Natl. Acad. Sci. 96: 4285–4288. [DOI] [PMC free article] [PubMed] [Google Scholar]
- San-Segundo, P.A. and Roeder, G.S. 2000. Role for the silencing protein Dot1 in meiotic checkpoint control. Mol. Biol. Cell 11: 3601–3615. [DOI] [PMC free article] [PubMed] [Google Scholar]
- Singer, M.S., Kahana, A., Wolf, A.J., Meisinger, L.L., Peterson, S.E., Goggin, C., Mahowald, M., and Gottschling, D.E. 1998. Identification of high-copy disruptors of telomeric silencing in Saccharomyces cerevisiae. Genetics 150: 613–632. [DOI] [PMC free article] [PubMed] [Google Scholar]
- Skolnick, J. and Kihara, D. 2001. Defrosting the frozen approximation: PROSPECTOR—A new approach to threading. Proteins 42: 319–331. [PubMed] [Google Scholar]
- Sussman, J.L., Lin, D., Jiang, J., Manning, N.O., Prilusky, J., Ritter, O., and Abola, E.E. 1998. Protein Data Bank (PDB): Database of three-dimensional structural information of biological macromolecules. Acta Crystallogr. D Biol. Crystallogr. 54: 1078–1084. [DOI] [PubMed] [Google Scholar]
- Terns, M.P. and Terns, R.M. 2002. Small nucleolar RNAs: Versatile trans-acting molecules of ancient evolutionary origin. Gene Expr. 10: 17–39. [PMC free article] [PubMed] [Google Scholar]
- Tong, A.H., Evangelista, M., Parsons, A.B., Xu, H., Bader, G.D., Page, N., Robinson, M., Raghibizadeh, S., Hogue, C.W., Bussey, H., et al. 2001. Systematic genetic analysis with ordered arrays of yeast deletion mutants. Science 294: 2364–2368. [DOI] [PubMed] [Google Scholar]
- Tornow, J., Zeng, X., Gao, W., and Santangelo, G.M. 1993. GCR1, a transcriptional activator in Saccharomyces cerevisiae, complexes with RAP1 and can function without its DNA binding domain. EMBO J. 12: 2431–2437. [DOI] [PMC free article] [PubMed] [Google Scholar]
- Uetz, P., Giot, L., Cagney, G., Mansfield, T.A., Judson, R.S., Knight, J.R., Lockshon, D., Narayan, V., Srinivasan, M., Pochart, P., et al. 2000. A comprehensive analysis of protein–protein interactions in Saccharomyces cerevisiae. Nature 403: 623–627. [DOI] [PubMed] [Google Scholar]
- Vakser, I.A. and Aflalo, C. 1994. Hydrophobic docking: A proposed enhancement to molecular recognition techniques. Proteins 20: 320–329. [DOI] [PubMed] [Google Scholar]
- von Mering, C., Krause, R., Snel, B., Cornell, M., Oliver, S.G., Fields, S., and Bork, P. 2002. Comparative assessment of large-scale data sets of protein–protein interactions. Nature 417: 399–403. [DOI] [PubMed] [Google Scholar]
- Wiederkehr, T., Pretot, R.F., and Minvielle-Sebastia, L. 1998. Synthetic lethal interactions with conditional poly(A) polymerase alleles identify LCP5, a gene involved in 18S rRNA maturation. RNA 4: 1357–1372. [DOI] [PMC free article] [PubMed] [Google Scholar]
- Wigge, P.A. and Kilmartin, J.V. 2001. The Ndc80p complex from Saccharomyces cerevisiae contains conserved centromere components and has a function in chromosome segregation. J. Cell Biol. 152: 349–360. [DOI] [PMC free article] [PubMed] [Google Scholar]
- Wormsley, S., Samarsky, D.A., Fournier, M.J., and Baserga, S.J. 2001. An unexpected, conserved element of the U3 snoRNA is required for Mpp10p association. RNA 7: 904–919. [DOI] [PMC free article] [PubMed] [Google Scholar]
- Wuchty, S. 2002. Interaction and domain networks of yeast. Proteomics 2: 1715–1723. [DOI] [PubMed] [Google Scholar]
- Zhu, H., Bilgin, M., Bangham, R., Hall, D., Casamayor, A., Bertone, P., Lan, N., Jansen, R., Bidlingmaier, S., Houfek, T., et al. 2001. Global analysis of protein activities using proteome chips. Science 293: 2101–2105. [DOI] [PubMed] [Google Scholar]
WEB SITE REFERENCES
- http://bioinformatics.buffalo.edu/proint/; predicted interactions.
- http://www.genome.ad.jp/kegg/; KEGG database.
- http://bioinfo.mbb.yale.edu; Mark Gerstein's Lab Web site.
- http://mips.gsf.de/proj/yeast/CYGD/db/index.html; MIPS Comprehensive Yeast Genome Database.
- http://ygac.med.yale.edu/triples/; TRIPLES database.


