

Abstract
Motor function in humans can be characterized with tests of locomotion, strength, balance, and endurance. The aim of our project was to establish an analogous test battery to assess motor function in mice. Male C57BL/6 mice were studied at 3 (n = 87), 20 (n = 48) and 26 (n = 43) months of age. Tests assessed locomotion, strength, balance/coordination, and endurance capacity in mice. Motor function was reduced in the older groups of mice for the locomotion, strength, and endurance subdomains (p < 0.001). As indicated with a summary score, motor function declined by 7.4 % from 3 to 20 months and by 13.5 % from 20 to 26 months. Based on comparison with previously published data in humans, the magnitude and relative time course of changes were similar in mice and humans in each subdomain except balance/coordination. Power calculations confirmed that the age-associated differences depicted by several of the individual tests and domain summary scores would be sufficient to assess the efficacy of interventions aimed at prevention or treatment of motor dysfunction with aging. The current study describes a mouse model that characterizes age-associated changes in clinically relevant domains of motor function and indicates that the preclinical model can be used to test strategies to attenuate age-associated declines in motor function.
Electronic supplementary material
The online version of this article (doi:10.1007/s11357-013-9589-9) contains supplementary material, which is available to authorized users.
Keywords: Aging, Motor function, Mouse model, Translation, Strength, Endurance
Introduction
Older adults comprise the fastest growing segment of the population, and advanced age and associated chronic health conditions are major risk factors for physical limitations projected to require a large portion of heath care resources (High et al. 2012; Manton et al. 2009). Because the number of older adults is expected to double between now and 2050 (Statistics FIFoA-R 2008), these associations suggest that the incidence of physical impairment and associated costs will increase dramatically in the absence of effective interventions (Carter et al. 2012; Olshansky et al. 2009). Successful interventions in aging must preserve healthspan, or the portion of life span during which function, independence and productivity are maintained, thus compressing the period of morbidity, disability and functional deficits at end of life (Fries 2003; Kirkland 2013). Recent efforts have been made in defining healthspan and new outcomes for animal studies evaluating interventions in aging, but much work remains to translate evaluations of functional deficit in model systems to clinical interventions (Anisimov et al. 2012; Carter et al. 2012; Kirkland and Peterson 2009; Rae et al. 2010).
To evaluate the effectiveness of an intervention on extending healthspan and limiting functional decline, however, there must first exist an adequate battery of tests to assess functional decline in a clinically meaningful way. Motor function is a biomarker of health among middle-aged and older adults, and locomotion, strength, balance, and endurance are independent motor-related predictors of adverse health outcomes (Cho et al. 2004; Cooper et al. 2011; Manini et al. 2007; Newman et al. 2006), including disability (Brach and VanSwearingen 2002; Guralnik et al. 1995; Fried and Guralnik 1997; Rantanen et al. 1999) and mortality (Buchman et al. 2007; Rantanen et al. 2012; Stanaway et al. 2011; Studenski et al. 2011; Verstergaard et al. 2009). As declines in motor function across the life span depend on the demands of the task (Enoka et al. 2003), incorporating batteries of functional tests to assess multiple subdomains of motor function is common in clinical practice and aging research in humans (Guralnik et al. 1994; Reuben et al. 2013; Rikli and Jones 1999; Simonsick et al. 2001). Although behavioral outcomes have been assessed in aging rodents (Bickford et al. 2000; Forster and Lal 1999; Joseph et al. 1999; Shukitt-Hale et al. 2009), these established tests have not been integrated into a functional battery capable of assessing the effectiveness of interventions based on multiple motor domains. Moreover, no set of behavioral assessments in rodents have been validated against established declines in motor function with aging in humans. The absence of test batteries that include these properties limits the tools available to assess healthspan-enhancing interventions that might be translatable to humans (Carter et al. 2012; Kirkland 2013; Kirkland and Peterson 2009).
The purpose of the present study was to develop and assess the validity of a battery of tests to characterize motor function in mice. Three cohorts of male C57BL/6 mice were tested at ages consistent with young, late middle age, and older adult humans based on median survival time and corresponding percent survival. The tests quantified performance with measures of locomotion, strength, balance/coordination, and endurance. The model was validated descriptively by comparing the magnitude and time course of declines in performance across the three groups of mice with those observed in humans. The individual tests used to assess function were selected based on their wide use and established validity in aging research (Carter et al. 2002; Ingram 1983, 1988; Ingram and Reynolds 1986; Shukitt-Hale et al. 2009; Sumien et al. 2006).
Materials and methods
Animals
Male C57BL/6 mice were obtained from Charles River at 2 months of age (n = 87) and from the National Institute on Aging (n = 91; 48 at 19 months and 43 at 25 months). Upon arrival at the University of Colorado Boulder, mice were ear punched for identification and housed in groups (~3–4 per cage). Mice were acclimated to our existing colony in the animal care facility for 4 weeks under a 12-h light/dark schedule (7 am to 7 pm light cycle) with food and water ad libitum. Mice were tested approximately 1 month later at 3, 20, or 26 months of age. Each mouse was tested to assess locomotion, strength, balance and coordination, and endurance. Mice were organized into six cohorts, and cohorts were tested on separate weeks. The 20-month-old mice were tested first to establish the battery (one cohort), and the 3- and 26-month-old mice were tested subsequently in a counter-balanced manner across age (three cohorts of young and two cohorts of old mice, ~20–30 per cohort).
Motor function test battery
All testing occurred in a subsection of the vivarium in which the animals were housed. Test sessions occurred in the afternoon hours of the light cycle (11 am to 5 pm), and each test occurred at the same time of day with little variation within or across cohorts. One investigator (JNJ) conducted each test in all sessions and was assisted by another investigator who had extensive training with the procedures. The experimental apparatus (Fig. 1) were cleaned with ethanol between the testing of each mouse.
Fig. 1.
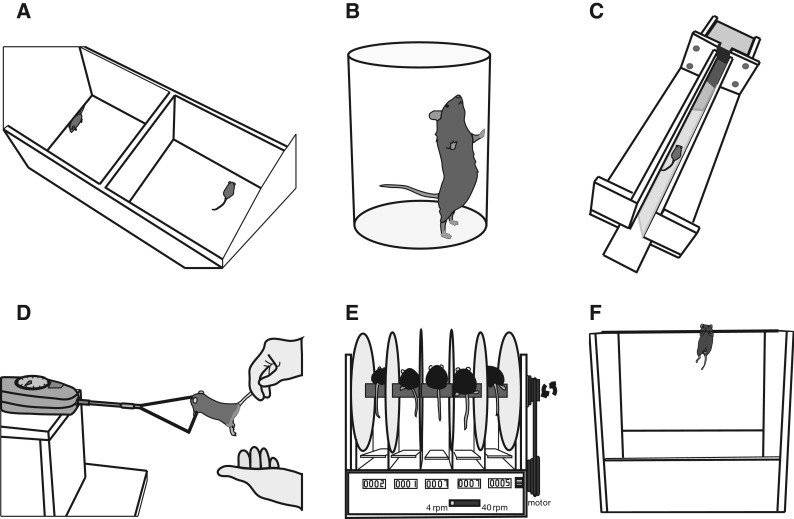
Experimental apparatus. Multiple devices were used to characterize subdomains of motor function in mice. Locomotion was quantified as the distance traveled during 5 min in an open field (a), rearing counts during 3 min in a 12.5-cm-diameter cylinder (b), and average walking speed along an 80-cm track (c). Grip strength was measured with a custom-built device attached to a load cell (d). Balance was measured as the maximal time on a rota-rod that accelerated from 4 to 40 rpm over 5 min (e) and time to grasp a tightrope with hindlimbs (f). Endurance was quantified as tightrope hang time (f) and time and distance on a rota-rod rotating at a normalized speed (e)
In developing the test battery, commonly used assessments of motor performance were aligned with the subdomains that comprise the Motor Function Domain of the National Institutes of Health (NIH) Toolbox (Reuben et al. 2013). Several of the tests selected for the battery have been described in detail previously and have demonstrated reliability and validity across multiple ages in mice or rats (Altun et al. 2007; Carter et al. 2002; Fahlström et al. 2012; Ingram 1983, 1988; Ingram and Reynolds 1986; Joseph et al. 1983; Sumien et al. 2006). Tests that could be incorporated simply and efficiently with minimal time to complete were given preference, as these would limit burden for both investigators and animals. The entire battery was designed so that testing would require <1 week, ~3 h/day. The test schedule is presented in Table S1.
Locomotion
Locomotion was characterized with measures of exploratory behavior and gait speed as assessed by behavior in an open field arena, rearing cylinder, and walking track.
Open field distance
Explorative locomotion in mice was examined as the total distance traveled during 5 min in a novel arena, referred to as the open field (Fig. 1a). The custom built open field apparatus comprised two side-by-side arenas (40 × 40 × 30 cm [L × W × H], each) with matte white finish, diffuse lighting source, and top mounted video-recorder for offline multi-arena video tracking (EthoVision XT; Noldus Information Technology, Leesburg, VA, USA). Open field tests were performed once for each mouse (Montiglio et al. 2010). The distance covered during the open-field test correlates with distance traveled in voluntary wheel running in both male and female in-bred mouse strains (Careau et al. 2012). Body mass was recorded at the end of testing.
Rearing counts
Locomotor behavior was further assessed as exploratory rearing in a cylinder (Fig. 1b). The mice were placed in a clear plexiglass cylinder (12.5 diam. × 14 cm [H]) and an observer counted the number of rears during a single 3-min bout. A rear was defined as lifting forepaws, typically to reach the sidewalls of the cylinder, and extending upward from hindlimbs, and was completed when forepaws returned to the floor of the cylinder.
Scurry speed
Scurry speed was calculated from the average time to traverse 80 cm along a straight track (Fig. 1c). The walking track comprised a custom-built, elevated platform with a narrow channel (3.5 × 80 × 15 cm) and a dark box with a removable melamine top panel. Mice were first allowed to acclimate to the dark box for ~1 min, and then were placed on the elevated platform at the other end of the track. An air puff was used to urge the mice to traverse the straight track to reach the dark box. A timer was started once the mouse entered the track and stopped once the head crossed the threshold of the dark box. The time taken to traverse the track and the number of air puffs needed to complete the walk were recorded. Five trials were recorded: two initial practice trials and three experimental trials, with 30 s in the dark box between trials. Experimental trials were excluded when the mouse required more than two air puffs to reach the dark box; only two trials were excluded from young and old animal groups. The apparatus used to assess scurry speed was not developed until after the 20-month-old mice had been tested.
Strength
Grip strength of the forelimbs was measured and normalized to body mass. A customized grip strength device was used that included a force transducer (0.5 kg, Imada PS Series, Northbrook, IL, USA) attached to a trapeze grip of ~1.5 mm diameter (Fig. 1d). The method was similar to one reported previously (Cabe et al. 1978; Ingram 1983). Briefly, the mouse was grasped by its tail, suspended just above the trapeze bar, and lowered until it successfully grasped the bar with both forepaws. A gradual horizontal tug was then applied until the mouse released its grip. Five trials were taken with 30 s between trials. Trials in which the mouse forcefully jerked the bar rather than simply releasing its grip were excluded. Body mass was recorded prior to strength testing.
Balance/coordination
Balance was challenged under dynamic conditions with tests that required mice to respond to a perturbation: an accelerating rota-rod test and latency to hindlimb grasp when suspended from a tightrope.
Accelerating rota-rod test
The time to fall from a five-station accelerating rota-rod (Ugo Basile, Comerio, Italy) was recorded on three trials separated by an inter-trial interval of ~1 h (Fig. 1e). The rota-rod was accelerated during each trial from 4 to 40 rpm over a 5-min period and a cut-off time was set at 6 min (Kulesskaya et al. 2011). On the day prior to testing, each mouse was introduced to the test by replacing it on the rota-rod until it could maintain its balance while the rod accelerated for 90 s.
Hindlimb grasp
The latency to hindlimb grasp was recorded as a measure of motor coordination during the tightrope suspension test (Fig. 1f). The mouse was suspended above soft bedding by grasping a taut cotton string (2 mm diam, 50 cm [L]) with its forepaws. The test involved recording the time it took the mouse to grasp the string with its hindlimbs.
Endurance
Endurance was measured as how long the mouse could perform the tightrope test and run on the rota-rod.
Tightrope
Tightrope suspension time was determined with the same apparatus used to assess hindlimb grasp (Fig. 1f) using a previously described protocol (Ingram 1983; Miquel and Blasco 1978). Briefly, the mouse was suspended by its forepaws from the string in the center until one of two events occurred: (a) fall into soft bedding below or (b) an escape in which the mouse traversed along the string to the support panels. If a mouse fell, the time to the fall was recorded. If a mouse did not fall or escape a score of 60 s was recorded. If a mouse escaped within 60 s, the recorded score was 120 s minus the time to escape.
Rota-rod run
The maximal time and distance run until falling off the rota-rod were recorded. The test was conducted 24–48 h after the accelerating rota-rod test. The maximal time each mouse could remain on the three accelerating rota-rod trials was used to set the speed for the rota-rod run. Mice with similar maximal speeds were run at the same time on the five-panel rota-rod. The test comprised four consecutive phases: refresh, warm-up, endurance 1, and endurance 2. In the refresh period, the rota-rod was accelerated to 25 % of maximal baseline speed and maintained for 2 min. Next, the mice performed a warm-up run during which the rota-rod was accelerated to 50 % of maximum for 5 min. Mice that fell during either the refresh or warm-up phases were immediately replaced on the rota-rod to continue running. Subsequently, the rota-rod was accelerated to 75 % of maximum speed for the endurance 1 phase and the time to falling off the rota-rod was recorded. When a mouse did not fall after 10 min, the rota-rod was further accelerated to 100 % of maximum speed for the endurance 2 phase for up to 30 min or until a fall. The speed of each phase was recorded and used to determine the total distance run in all phases.
Normalization of motor function scores
The performance on each test was normalized to a similar scale for direct comparison of test results within and between subdomains. Performance on each test was rescaled to values ranging from 0 to 1, where 0 indicated the worst performance across all three age groups (Carter et al. 2002), with the formula: Score= 1 − (worst performance/current performance). Scores for each test within a subdomain were then averaged to create mean subdomain scores for locomotion, strength, balance and coordination, and endurance. An overall motor function summary score was then calculated as the average of the four subdomain scores.
Statistical analysis
Prior to primary analysis, normality was assessed with the Shapiro–Wilk's test, and homogeneity of variance between age groups was examined with Levene's test for each measure. As the variance in performance within a group was greater in the oldest age group for all measures, except locomotion, comparisons of individual tests between age groups were performed using the Welch ANOVA (one-way, 2 df), and Games–Howell test for post-hoc group comparisons. Because 16 hypotheses of an age effect were tested, a Bonferroni-adjusted significance level of 0.003 was calculated to account for the increased possibility of type I error. Linear regression equations were used to assess the relative significance of each test within the battery or subdomain to the motor function summary score. Stepwise multiple-regression models were used to explain the motor function summary scores based on individual test scores or average subdomain scores. The α-level for all statistical analyses was set at 0.05, and all data are presented as mean ± SD within the text and tables and mean ± SEM within figures. The statistical procedures were performed with SPSS Statistics (version 21; SPSS, Inc., Chicago, IL, USA).
Results
Test outcomes across ages
Original data from each test in the motor function battery are presented in Table 1. Age-related declines were observed for each measure (p < 0.001 main effect for age, each test), but post hoc analyses indicated that the decreases across age groups varied among individual tests. The normalized motor function scores (0–1 scale, with 0 being the worst performer) for each test for the three groups of mice demonstrate similar age-related declines in performance to the absolute scores shown in Table 1 and are reported in Table S1.
Table 1.
Test battery outcomes for 3-, 20-, and 26-month-old C57Bl/6 male mice
| 3 months (n = 87) | 20 months (n = 48) | 26 months (n = 42) | |
|---|---|---|---|
| Body mass (g) | 26.0 ± 1.9 | 35.2 ± 2.4 | 31.2 ± 2.7 |
| Locomotion | |||
| Open field distance (cm) | 1859 ± 265 | 1740 ± 431 | 1357 ± 398*† |
| Rearing counts | 25.4 ± 6.7 | 10.6 ± 6.3* | 8.6 ± 8.2* |
| Walking speed (cm/s) | 11.0 ± 4.2 | – | 8.2 ± 3.8* |
| Strength | |||
| Forepaw grip strength (g) | 130 ± 14 | 96.7 ± 15.1* | 79.7 ± 13.3*† |
| Grip strength normalized to body mass (g/g) | 5.58 ± 0.55 | 2.80 ± 0.44* | 2.55 ± 0.44* |
| Balance and Coordination | |||
| Average accelerating rota-rod time (s) | 240 ± 57 | 181 ± 76* | 164 ± 62* |
| Time to hindlimb grasp (s) | 5.0 ± 2.4 | 8.3 ± 7.2* | 16.7 ± 13.1* |
| % capable of hindlimb grasp | 100 | 77 | 36 |
| Endurance | |||
| Tightrope hang time (s) | 84.0 ± 32.5 | 62.4 ± 34 | 23.6 ± 24.2*† |
| Tightrope score relative to body mass (s/g) | 3.5 ± 1.4 | 1.8 ± 1.0* | 0.8 ± 0.8*† |
| Rota-rod run time (s) | 864 ± 356 | 670 ± 478 | 461 ± 328* |
| Rota-rod run distance (m) | 24.4 ± 9.9 | 15.7 ± 8.6* | 14.2 ± 11.6* |
Mean±SD
*p < 0.0003 compared with young mice
†p < 0.0003 compared with 20-month-old mice
Locomotion
Open-field distance was less for 26-month-old mice compared with 3-month-old mice (p < 0.001), but there was no significant difference between 3- and 20-month-old mice (p = 0.27). Rearing counts were greater in 3-month-old mice compared with both older age groups (p < 0.001), but there was no additional decline with age from 20 to 26 months (p = 0.53). Scurry speed was only assessed in 3- and 26-month-old mice and was faster for the 3-month-old mice (p < 0.001).
Strength
Forepaw grip strength decreased progressively across the three ages (p < 0.001). When grip strength was normalized to body mass (3 months: 23.8 ± 2.4 g, 20 months: 35.1 ± 2.4 g, 26 months: 31.6 ± 2.6 g; p < 0.001); however, there was no longer a statistical difference in strength between 20- and 26-month-old mice (p = 0.01) given the Bonferroni criterion.
Balance/coordination
Average time that mice could remain on an accelerating rota-rod was less in both 20- and 26-month-old mice than in 3-month-old mice (p = 0.001 and p < 0.001, respectively), but was not different between 20- and 26-month-old mice (p = 0.57). The same relation was observed for the time on the accelerating rota-rod for the last trial with the 3-month-old mice lasting longer (274 ± 71.7 s, p < 0.001) and no statistically significant difference between the two older groups (20 months: 183 ± 77 s; 26 months: 205 ± 84 s, p = 0.42). When coordination was assessed as the time to grasp a tightrope with the hind limbs when suspended by the forepaws, the time was less for the 3-month-old mice (p < 0.001) and not statistically significant between 20- and 26-month-old mice (p = 0.07). Additionally, fewer mice in the older group were able to perform the hindlimb grasp. The same relations were observed when performance was normalized to a 0–1 scale for motor function scoring.
Endurance
Tightrope hang time declined across the three age groups when normalized to body mass (p < 0.001 all), but the difference in absolute time was not statistically significant between 20- and 26-month-old mice (p = 0.01). Run time on the rota-rod was not significantly different between 3- and 20-month-old (p = 0.12) or 20- and 26-month-old (p = 0.03) mice, but run time for 26-month-old mice was less than that for 3-month-old mice (p < 0.001). The 3-month-old mice ran further than both the 20-month-old (p < 0.001) and 26-month-old (p < 0.001), but the difference between the 20- and 26-month-old mice was not statistically significant (p = 0.83).
Subdomain and summary scores
The subdomain scores and motor function summary score are shown in Fig. 2. Age-related declines were observed in each subdomain score and the motor function summary score (age main effect, p < 0.001 all). Post-hoc analysis indicated that the progressive decline from the 3- to 26-month-old mice were statistically significant for the motor function summary score, and for the strength and endurance subdomain scores (p < 0.001 all). An age-related decline in locomotion scores was observed between each age group, but a non-significant trend was observed between 3- and 20-month-old mild (p = 0.01). The coordination score was statistically greater for the 3-month-old mice compared with the two older groups (p < 0.001), but the difference between the 20- and 26-month-old mice was not statistically significant (p = 0.58).
Fig. 2.

Motor function subdomain and summary scores (mean ± SEM) for the three groups of mice. Scores for each test in the motor function battery were converted to a 0–1 scale in which 0 was the worst performance. The scores for each test within a subdomain were averaged to create a subdomain score. Locomotion (a) was based on the average scores for distance traveled in an open field, rearing counts, and walking speed. Strength score (b) was based on the scores for grip strength and grip strength normalized to body mass. Coordination score (c) combined the scores for the time to hindlimb grasp and average time to remain on an accelerating rota-rod. Endurance score (d) corresponded to the scores for the tightrope time normalized to body mass and the time and distance for the rota-rod run. Summary score (e) represent the average score of the subdomain scores. *p < 0.0003 compared with 3-month-old mice. † p < 0.01 between 20- and 26-month-old mice
A power analysis was conducted to estimate the sample size needed to attenuate or reverse age-related deficits in the motor function summary score given a known effectiveness for an intervention (Fig. 3). Attenuation effects were determined by the decline in motor function summary score from 20 to 26 months. For example, if an intervention could prevent additional declines in function from 20 to 26 months it would be 100 % effective at attenuating future decline, and given the difference between the expected and observed scores at 26 months, a sample size of only seven mice would be needed. Similarly, reversal effects were determined by the difference in scores between young mice to mice 20 and 26 months of age. An intervention capable of restoring function in 20-month-old mice to that of young animals would require five mice, and if function in 26-month-old mice were restored to young, only four mice would be sufficient to reach statistical significance.
Fig. 3.

Power analyses to indicate the number of mice required to attenuate (a) or reverse (b) deficits in the summary performance score from the known effectiveness of an intervention. An attenuation effect of 100 % indicates that an intervention has the capacity to improve the mean score in 26-month-old mice to similar values for 20-month-old mice (a). An intervention that has a reversal effect of 100 % can change the scores for 20-month (closed circles) and 26-month-old mice (open circles) to values similar to those for 3-month-old mice (b)
Relations between subdomains and summary scores
The relative contribution of each test and subdomain score to the motor function summary score was assessed with stepwise linear regression models (Tables 2 and 3). Absolute grip strength explained more of the variance in the summary score (R2 = 0.83, p < 0.001) than any other single variable (Table 2). The inclusion of four additional test scores (endurance rota-rod distance, normalized tightrope time, walking speed, and accelerating rota-rod time) resulted in the model explaining 98 % of the variance in the motor function summary score. In contrast, scores from all four subdomains were necessary to explain 98 % of the variance in the motor function summary score (Table 3). The subdomain score with the greatest explanatory power for the motor function summary score was endurance (R2 = 0.65, p < 0.001).
Table 2.
Relative contributions of the test scores to the regression model to explain the variance in the motor function summary score
| Beta | Standard error | Part | R 2 | |
|---|---|---|---|---|
| Performance score | ||||
| Grip strength | 0.203 | 0.005 | 0.162 | 0.83 |
| Rota-rod distance | 0.087 | 0.005 | 0.069 | 0.90 |
| Tightrope time per body mass | 0.190 | 0.004 | 0.178 | 0.94 |
| Walking speed | 0.060 | 0.004 | 0.067 | 0.97 |
| Accelerating rota-rod | 0.109 | 0.010 | 0.044 | 0.98 |
| Rearing count | 0.068 | 0.004 | 0.078 | 0.99 |
| Rota-rod time | 0.125 | 0.007 | 0.070 | 0.99 |
| Time to hindlimb grasp | 0.095 | 0.005 | 0.083 | 1.00 |
| Open field distance | 0.070 | 0.006 | 0.049 | 1.00 |
Variables (normalized scores) are listed in the order of their entry into the stepwise regression model. All of the listed variables explained statistically significant amounts of the variance in the motor function summary score (p < 0.001). Part correlations and the cumulative R 2 values as test scores are added to the regression equation indicate the relative contribution of each test in explaining the variance in the motor function summary score. The excluded variables were the scores for grip strength normalized to body mass and absolute tightrope time
Table 3.
Relative significance of the subdomain scores in explaining the variance in the motor function summary score
| Beta | Standard Error | Part | R 2 | |
|---|---|---|---|---|
| Motor function summary score | ||||
| Endurance | 0.369 | 0.013 | 0.382 | 0.65 |
| Strength | 0.153 | 0.010 | 0.222 | 0.85 |
| Locomotion | 0.230 | 0.011 | 0.302 | 0.93 |
| Coordination | 0.199 | 0.012 | 0.227 | 0.98 |
Variables (average subdomain scores) are listed in order of entry into the stepwise model to explain the variance in the motor function summary score (p < 0.001). Part correlations and cumulative R 2 values as subdomains are added to the regression equation indicate the relative contribution of each subdomain in explaining the variance in the motor function summary score
Comparison with declines in humans
The validity of the model was examined descriptively by comparing the current results with the magnitude and time course of declines for humans reported in peer-reviewed publications (Fig. 4, expanded in Table S2). Criteria for inclusion in the comparison were: (1) standard tests consistent within the subdomain construct; (2) mean ± SD for young adults aged 20–29 years; and (3) mean ± SD for older adults with 10-year increments. Data from 21 published articles were included, with normative data from 30 standard tests (see Table S2). The percent decline for each older group of humans from the young group (20–29 years) was calculated for each test and averaged to indicate the relative decrease in each subdomain score (Fig. 4). Similarly, the percent decline from young mice (3 months) was calculated for the 20- and 26-month-old mice and listed in Table S1 under the two age increments of comparable biological age. Because the values are descriptive, no statistical comparisons were performed. Overall, the results indicate that the percent declines are similar for humans and mice in all subdomains except balance/coordination. The dissociation in the latter subdomain was due to earlier declines in balance scores for mice than humans.
Fig. 4.

Comparison between humans (black bars) and mice (gray bars) of age-related declines (%) in strength (a), locomotion (b), balance (c), and endurance (d). Percent declines from young humans (20–29 years) were calculated from representative studies within each subdomain (see Table S2). In the present study, the percent declines from young mice (3 months) for each subdomain are presented for 20-month and 26-month-old mice and listed between age categories at similar percentages of mean human life span
Discussion
The current study represents the first steps in developing an assessment battery of functional motor outcomes in mice. The main tasks accomplished in this study were: (1) the development of a translational battery of tests to characterize age-related declines in motor function in mice; (2) establishment of a normalization procedure to standardize tests scores for each of four subdomains and a motor function summary score; (3) identification of tests and subdomains that explained most of the variance in the motor function summary score; and (4) the examination of evidence indicating similar declines in subdomain scores for the preclinical model and adult humans. Although the specific tests incorporated in the battery have been developed previously (Altun et al. 2007; Carter et al. 2002; Fahlström et al. 2012; Ingram 1983, 1988; Ingram and Reynolds 1986; Joseph et al. 1983; Shukitt-Hale et al. 2009; Sumien et al. 2006), the synthesis of these tests into clinically relevant subdomains of motor function represents a novel approach that should facilitate translational assessments.
Normalized test battery
Investigating healthspan in an effort to characterize the age-related disablement process and identify appropriate interventions requires measures of physical function that can distinguish meaningful gradations of capacity and change over a wide range of ages and abilities in people (Simonsick et al. 2001) and animal models (Kirkland and Peterson 2009). Although previous work has examined the influence of age on behavior in animals (Ingram 1983) and has reported that age-related declines in motor function are predictive of life span in rats (Altun et al. 2007; Carter et al. 2002) and mice (Fahlström et al. 2012; Ingram and Reynolds 1986), the absence of a common assessments describing changes in function may present a barrier to translation. One approach to improve translation is to identify specific clinically relevant tests in mice to characterize function in subdomains, and to normalize absolute performance outcomes to scores that can be compared across subdomains in those animals, as well as with motor function in humans. Moreover, the collation of multiple measures into a composite index affords greater sensitivity in detecting the progressive decline in motor function with advancing age (Markowska and Breckler 1999; de Fiebre et al. 2006; Carter et al. 2012). Normalization procedures have been used to combine performance outcomes to predict life span in rats (Carter et al. 2002); however, these performance outcomes do not map to functional measures widely used in the human literature to predict disability, independent living status, and mortality (Guralnik et al. 1994, 1995, 2000).
The relative significance of each normalized test score and subdomain scores on the motor function summary score was assessed by multiple regression models. The stepwise regression model for individual normalized test scores demonstrated that although grip strength, rota-rod run distance, and tightrope test entered into the model first, grip strength and tightrope score normalized to body mass had the greatest part correlations (r = 0.16, and r = 0.18, respectively), and thus were more strongly and independently related to the motor function summary score (Table 2). However, when subdomain scores were used to predict performance, the endurance score explained most of the variance in the motor function summary scores (r = 0.38, Table 3). The likely reason for the greater predictive value of the endurance subdomain can be seen from the stepwise regression model from individual tests: whereas grip strength test alone was most predictive of summary motor function, two tests of endurance were also strongly predictive. When these two endurance tests were combined into a subdomain score, the endurance subdomain was more predictive overall. The regression analyses indicate that function in mice is best characterized by multiple tests, but in particular tests of strength and endurance need to be included in studies to examine the effectiveness of interventions to reduce age-associated declines in motor function.
Power and validity
The power calculations depicted in Fig. 3 demonstrate that the summary motor function score obtained from the battery should have sufficient power to detect the effects of an intervention with potential to attenuate or reverse age-related deficits in motor function. If an intervention can attenuate 50 % of the additional declines in motor function that occur from age 20 to 26 months, for example, then 24 animals would be needed to detect a significant effect. Similarly, an intervention that could reverse 50 % of the decrease in motor function from 3- to 20-month-old mice, a sample of 27 mice per group would be needed to evaluate the intervention. These sample size estimates are well within previously recommended guidelines of approximately 50 animals per group when using rodent models to evaluate pharmacological interventions in aging (Anisimov et al. 2012).
In an attempt to establish the translational validity of the battery of tests used in the current study, we provided a descriptive comparison of age-associated changes in motor function for humans and mice (Fig. 4, and expanded in Table S2). The differences in the four motor function subdomain scores across the three groups of mice approximated those reported for humans of similar relative biological age. The one difference was for the balance/coordination subdomain. Declines of 6–11 % have been reported in adults aged 50–69 years in tests of static and dynamic balance, whereas coordination declined by 35 % in 20-month-old mice based on accelerating rota-rod and time to hindlimb grasp. Thus, the tests used in the current study to assess this particular measure of motor function appear to translate less well to humans than the other tests. Although there appeared to be a difference in the magnitude of change in the endurance score for mice (10–21 %) compared with humans (17–48 %), the lack of a comparable literature on changes in endurance for humans compromised the comparison for this subdomain. For example, the magnitude of decline was similar for rota-rod run score of mice (19–30 %) and running race times for humans (17–48 %).
Limitations and future directions
The battery includes 12 tests of motor function for C57BL/6 mice that mapped onto four subdomains of motor function relevant to age-related functional impairments and disability in humans. Although the motor function summary score was sensitive to differences across the three groups of mice, the tests that contributed to the subdomain scores for locomotion and coordination explained the least amounts of the variance in the summary score. Interventions that target either locomotion or balance and coordination, therefore, may need to identify additional tests to evaluate the effectiveness of the intervention, such as tasks requiring bridge walking (de Fiebre et al. 2006; Sumien et al. 2006), or beam balance (Altun et al. 2007; Fahlström et al. 2012).
Future work is needed to extend the model to other mouse strains and other preclinical model species such as rats, and to include comparisons of functional declines in both males and females. Moreover, longitudinal studies would provide greater insight into the rate of age-related declines in motor function across subdomains as well as underlying mechanisms leading to functional declines. The identification of functional biomarkers, such as those assayed in the current study, are essential to establishing the efficacy of interventions aimed at slowing declines in health-span (Carter et al. 2012; Rae et al. 2010), and future work should establish the sensitivity of the model to detect the capacity of late-life interventions to attenuate or reverse functional deficits.
Concluding remarks
This work represents a test battery and composite scoring system to characterize declines in four subdomains of motor function across young and older C57BL/6 mice. Age-related declines were observed in locomotion, strength, balance and coordination, and endurance, as well as a motor function summary score. The cross-sectional declines in locomotion, strength, and endurance in mice were comparable to those observed in humans, thus demonstrating a degree of construct validity for the test battery. Although much work remains to validate and expand this test battery to other species and to determine its sensitivity to late-life interventions, the current model is the first to describe functional scores that are relevant to healthspan in aging humans, and thus represents a significant translational step in biomedical aging research on this topic.
Electronic supplementary material
(DOC 34 kb)
(DOC 96 kb)
Acknowledgments
The authors thank Mike Pont Carpentry, LLC, for design, development, and construction of customized experimental apparatus (Mike Pont Carpentry, LLC, Boulder, Colorado; mikepontcarpentry.com). This work was supported by NIH AG013038 (DRS).
References
- Altun M, Bergman E, Edstrom E, Johnson H, Ulfake B. Behavioral impairments of the aging rat. Physiol Behav. 2007;92:9111–9923. doi: 10.1016/j.physbeh.2007.06.017. [DOI] [PubMed] [Google Scholar]
- Anisimov VN, Zabezhinski MA, Popovich IG, Pliss GB, Bespalov VG, Alexandrov VA, Studov AN, Anikin IV, Alimova IN, Egormin PA, Panchenko AV, Piskunova TS, Semenchenko AV, Tyndyk ML, Yurova MN. Rodent models for the preclinical evaluation of drugs suitable for pharmacological intervention in aging. Expert Opin Drug Discov. 2012;7(1):85–95. doi: 10.1517/17460441.2012.642361. [DOI] [PubMed] [Google Scholar]
- Bickford PC, Gould T, Briederick L, Chadman K, Pollock A, Young D, Shukitt-Hale B, Joseph J. Antioxidant-rick diets improve cerebellar physiology and motor learning in aged rats. Brain Res. 2000;866:211–217. doi: 10.1016/S0006-8993(00)02280-0. [DOI] [PubMed] [Google Scholar]
- Brach JS, VanSwearingen JM. Physical impairment and disability: relationship to performance of activities of daily living in community-dwelling older men. Phys Ther. 2002;82:752–761. [PubMed] [Google Scholar]
- Buchman AS, Wilson RS, Boyle PA, Buenias JL, Bennet DA. Change in motor function and risk of mortality in older persons. J Am Geriatr Soc. 2007;55:11–19. doi: 10.1111/j.1532-5415.2006.01032.x. [DOI] [PubMed] [Google Scholar]
- Cabe PA, Tilson HA, Mitchell CL, Dennis R. Simple recording grip strength device. Pharmacol Biochem Behav. 1978;8(1):101–102. doi: 10.1016/0091-3057(78)90131-4. [DOI] [PubMed] [Google Scholar]
- Careau V, Bininda-Emonds ORP, Ordonez G, Garland T. Are voluntary wheel running and open-field behavior correlated in mice? Different answers from comparative and artificial selection approaches. Behav Genet. 2012;42:830–844. doi: 10.1007/s10519-012-9543-0. [DOI] [PubMed] [Google Scholar]
- Carter CS, Sonntag WE, Onder G, Pahor M. Physical performance and longevity in aged rats. J Gerontol A Biol Sci Med Sci. 2002;57A(5):B193–B197. doi: 10.1093/gerona/57.5.B193. [DOI] [PubMed] [Google Scholar]
- Carter CS, Marzetti E, Leeuwenburgh C, Manini T, Foster TC, Groban L, Scarpace PJ, Morgan D. Usefulness of preclinical models for assessing the efficacy of late-life interventions for sarcopenia. J Gerontol A Biol Sci Med Sci. 2012;67A(1):17–27. doi: 10.1093/gerona/glr042. [DOI] [PMC free article] [PubMed] [Google Scholar]
- Cho B, Scarpace D, Alexander NB. Tests of stepping as indicators of mobility, balance and fall-risk in balance-impaired older adults. J Am Geriatr Soc. 2004;52:1168–1173. doi: 10.1111/j.1532-5415.2004.52317.x. [DOI] [PubMed] [Google Scholar]
- Cooper R, Kuh D, Cooper C, Gale CR, Lawlor DA, Matthews F, Hardy R, FALCon and HALCyon Study Teams Objective measures of physical capability and subsequent health: a systematic review. Age Ageing. 2011;40:14–23. doi: 10.1093/ageing/afq117. [DOI] [PMC free article] [PubMed] [Google Scholar]
- de Fiebre NEC, Sumien N, Forster MJ, de Fiebre CM. Spatial learning and psychomotor performance of C57BL/6 mice: age sensitivity and reliability of individual differences. AGE. 2006;28:235–253. doi: 10.1007/s11357-006-9027-3. [DOI] [PMC free article] [PubMed] [Google Scholar]
- Enoka RM, Christou EA, Hunter SK, Kornatz KW, Semmler JG, Taylor AM, Tracy BL (2003) Mechanisms that contribute to differences in motor performance between young and old adults. J Electromyogr Kinesiol 13(1):1–12 [DOI] [PubMed]
- Fahlström A, Zeberg H, Ulfake B. Changes in behaviors of male C57BL/6J mice across adult life span and effects of dietary restriction. AGE. 2012;34:1435–1452. doi: 10.1007/s11357-011-9320-7. [DOI] [PMC free article] [PubMed] [Google Scholar]
- Forster MJ, Lal H. Estimating age-related changes in psychomotor function: influence of practice and of level of caloric intake in different genotypes. Neurobiol Aging. 1999;20:167–176. doi: 10.1016/S0197-4580(99)00041-X. [DOI] [PubMed] [Google Scholar]
- Fried LP, Guralnik JM. Disability in older adults: evidence regarding significance, etiology and risk. J Am Geriatr Soc. 1997;45:92–100. doi: 10.1111/j.1532-5415.1997.tb00986.x. [DOI] [PubMed] [Google Scholar]
- Fries JF. Measuring and monitoring success in compressing morbidity. Ann Intern Med. 2003;139(5):455–459. doi: 10.7326/0003-4819-139-5_Part_2-200309021-00015. [DOI] [PubMed] [Google Scholar]
- Guralnik JM, Simonsick EM, Ferucci L, Glynn RJ, Berkman LF, Blazer DG, Scherr PA, Wallace RB. A short physical performance battery assessing lower extremity function: association with self-reported disability and prediction of mortality and nursing home admission. J Gerontol. 1994;49(2):M85–M94. doi: 10.1093/geronj/49.2.M85. [DOI] [PubMed] [Google Scholar]
- Guralnik JM, Ferrucci L, Simonsick EM, Salive ME, Walace RB. Lower extremity function in persons over the age of 70 as a predictor of subsequent disability. N Engl J Med. 1995;332:556–561. doi: 10.1056/NEJM199503023320902. [DOI] [PMC free article] [PubMed] [Google Scholar]
- Guralnik JM, Ferrucci L, Pieper CF, Leveille SG, Markides KS, Ostir GV, Studenski S, Berkman LF, Wallace RB. Lower extremity function and subsequent disability: consistency across studies, predictive models, and value of gait speed alone compared with the short physical performance battery. J Gerontol A Biol Sci Med Sci. 2000;55:M221–M231. doi: 10.1093/gerona/55.4.M221. [DOI] [PMC free article] [PubMed] [Google Scholar]
- High KP, Akbar AN, Nikolich-Zugich J (2012) Translational research in immune senescence: assessing the relevance of current models. Semin Immunol 24(5):373–382 [DOI] [PMC free article] [PubMed]
- Ingram DK. Toward the behavioral assessment of biological aging in the laboratory mouse: concepts, terminology, and objectives. Exp Aging Res. 1983;9(4):225–238. doi: 10.1080/03610738308258457. [DOI] [PubMed] [Google Scholar]
- Ingram DK. Motor performance variability during aging in rodents. Assessment of reliability and validity of individual differences. Ann NY Acad Sci. 1988;515:70–96. doi: 10.1111/j.1749-6632.1988.tb32969.x. [DOI] [PubMed] [Google Scholar]
- Ingram DK, Reynolds MA. Assessing the predictive validity of psychomotor tests as measures of biological age in mice. Exp Aging Res. 1986;12(3):155–162. doi: 10.1080/03610738608259454. [DOI] [PubMed] [Google Scholar]
- Joseph JA, Bartus RT, Clody D, Morgan D, Finch C, Beer B, Sesack S. Psychomotor performance in the senescent rodent: reduction of deficits via striatal dopamine receptor up-regulation. Neurobiol Aging. 1983;4(4):313–319. doi: 10.1016/0197-4580(83)90008-8. [DOI] [PubMed] [Google Scholar]
- Joseph JA, Shukitt-Hale B, Denisova NA, Bielinski D, Martin A, McEwen JJ, Bickford PC. Reversals of age-related declines in neuronal signal transduction, cognitive, and motor behavioral deficits with blueberry, spinach, or strawberry dietary supplementation. J Neurosci. 1999;19(18):8114–8121. doi: 10.1523/JNEUROSCI.19-18-08114.1999. [DOI] [PMC free article] [PubMed] [Google Scholar]
- Kirkland JL. Translating advances from the basic biology of aging into clinical application. Exp Gerontol. 2013;48:1–5. doi: 10.1016/j.exger.2012.11.014. [DOI] [PMC free article] [PubMed] [Google Scholar]
- Kirkland JL, Peterson C. Healthspan, translation, and new outcomes for animal studies of aging. J Gerontol A Biol Sci Med Sci. 2009;64(2):209–212. doi: 10.1093/gerona/gln063. [DOI] [PMC free article] [PubMed] [Google Scholar]
- Kulesskaya N, Rauvala H, Voikar V. Evaluation of social and physical enrichment in modulation of behavioural phenotype in C57BL/6J female mice. PLoS ONE. 2011;6(9):e24755. doi: 10.1371/journal.pone.0024755. [DOI] [PMC free article] [PubMed] [Google Scholar]
- Manini T, Visser M, Won-Park S, Patel KV, Strotmeyer ES, Chen H, Goodpaster B, De Rekeneire N, Newman AB, Simonsick EM, Kritchevsky SB, Ryder K, Schwartz AV, Harris TB. Knee extension cutpoints for maintaining mobility. J Am Geriatr Soc. 2007;55:451–457. doi: 10.1111/j.1532-5415.2007.01087.x. [DOI] [PubMed] [Google Scholar]
- Manton KG, Gu Xi‐Liang, Ullian A, Tolley HD, Headen AE, Lowrimore G (2009) Long‐term economic growth stimulus of human capital preservation in the elderly. PNAS 106(50):21080–21085 [DOI] [PMC free article] [PubMed]
- Markowska AL, Breckler SJ. Behavioral biomarkers of aging: illustration of a multivariate approach for detecting age-related behavioral changes. J Gerontol A Biol Sci Med Sci. 1999;54:B549–B566. doi: 10.1093/gerona/54.12.B549. [DOI] [PubMed] [Google Scholar]
- Miquel J, Blasco M. A simple technique for evaluation of vitality in aging mice, by testing their muscular coordination and vigor. Exp Gerontol. 1978;13:389–396. doi: 10.1016/0531-5565(78)90049-9. [DOI] [PubMed] [Google Scholar]
- Montiglio PO, Garant D, Thomas D, Réale D. Individual variation in temporal activity patterns in open-field tests. Anim Behav. 2010;80:905–912. doi: 10.1016/j.anbehav.2010.08.014. [DOI] [Google Scholar]
- Newman AB, Simonsick EM, Naydeck BL, Boudreau RM, Kritchevsky SB, Nevitt MC, Pahor M, Satterfield S, Brach JS, Studenski SA, Harris TB (2006) Association of long‐distance corridor walk performance with mortality, cardiovascular disease, mobility limitation, and disability. JAMA 295:2018–2026 [DOI] [PubMed]
- Olshansky SJ, Goldman DP, Zheng Y, Rowe JW. Aging in America in the twenty-first century: demographic forecasts from the MacArthur Foundation Research Network on an Aging Society. Milbank Q. 2009;87(4):842–862. doi: 10.1111/j.1468-0009.2009.00581.x. [DOI] [PMC free article] [PubMed] [Google Scholar]
- Rae MJ, Butler RN, Campisi J, et al. The demographic and biomedical case for late-life interventions in aging. Sci Transl Med. 2010;2:40cm21. doi: 10.1126/scitranslmed.3000822. [DOI] [PMC free article] [PubMed] [Google Scholar]
- Rantanen T, Guralnik JM, Foley D, Masaki K, Leveille S, Curb JD, White L. Midlife grip strength as a predictor of old age disability. JAMA. 1999;281:558–560. doi: 10.1001/jama.281.6.558. [DOI] [PubMed] [Google Scholar]
- Rantanen T, Masaki K, He Q, Ross GW, Wilcox BJ, White L. Midlife muscle strength and human longevity up to age 100 years: a 44-year prospective study among a decedent cohort. AGE. 2012;34:563–570. doi: 10.1007/s11357-011-9256-y. [DOI] [PMC free article] [PubMed] [Google Scholar]
- Reuben DB, McCreath HE, Bohannon RW, Want YC, Bubela DJ, Beaumont J, Rine RM, Lai JS, Gershon RC. Motor assessment using the NIH Toolbox. Neurology. 2013;80(11 S3):S65–S75. doi: 10.1212/WNL.0b013e3182872e01. [DOI] [PMC free article] [PubMed] [Google Scholar]
- Rikli RE, Jones CJ (1999) Development and validation of a functional fitness test for community‐residing older adults. J Aging Phys Act 7:129–161
- Shukitt-Hale B, Cheng V, Joseph JA. Effects of blackberries on motor and cognitive function in aged rats. Nutr Neurosci. 2009;12(3):135–140. doi: 10.1179/147683009X423292. [DOI] [PubMed] [Google Scholar]
- Simonsick EM, Newman AB, Nevitt MC, Kritchevsky SB, Ferrucci L, Guralnik JM, Harris T. Measuring higher level physical function in well-functioning older adults: expanding familiar approaches in the Health ABC Study. J Gerontol A Biol Sci Med Sci. 2001;56A(10):M644–M649. doi: 10.1093/gerona/56.10.M644. [DOI] [PubMed] [Google Scholar]
- Stanaway FF, Gnjidic D, Blyth FM, Le Couteur DG, Naganathan V, Waite L, Seibel MJ, Handelsman DJ, Sambrook PN, Cumming RG. How fast does the Grim Reaper walk? Receiver operator characteristics curve analysis in healthy men aged 70 and older. BMJ. 2011;343:d7679. doi: 10.1136/bmj.d7679. [DOI] [PMC free article] [PubMed] [Google Scholar]
- Older Americans 2008: key indicators of wellbeing. Washington: U.W. Government Printing Office; 2008. [Google Scholar]
- Studenski S, Perera S, Patel K, Rosano C, Faulkner K, Inzitari M, Brach J, Chandler J, Cawthon P, Connor EB, Nevitt M, Visser M, Kritchevsky S, Badinelli S, Harris T, Newman AB, Cauley J, Ferrucci L, Guralnik J (2011) Gait speed and survival in older adults. JAMA 305(1):50–58 [DOI] [PMC free article] [PubMed]
- Sumien N, Sims MN, Taylor HJ, Forster MJ. Profiling psychomotor and cognitive aging in four-way cross mice. AGE. 2006;28:265–282. doi: 10.1007/s11357-006-9015-7. [DOI] [PMC free article] [PubMed] [Google Scholar]
- Verstergaard S, Patel KV, Walkup MP, Pahor M, Marsh AP, Espeland MA, Studenski S, Gill TM, Church T, Guralnik JM. Stopping to rest during 400-meter walk and incident mobility disability in persons with functional limitations. J Am Geriatr Soc. 2009;57:260–265. doi: 10.1111/j.1532-5415.2008.02097.x. [DOI] [PMC free article] [PubMed] [Google Scholar]
Associated Data
This section collects any data citations, data availability statements, or supplementary materials included in this article.
Supplementary Materials
(DOC 34 kb)
(DOC 96 kb)