

Significance
In eukaryotes, gene expression is controlled by short regulatory DNA sequences called enhancers. Understanding how an enhancer selects its target promoter(s) is a major challenge in the field of gene regulation. Advances in genomic technologies have enabled rapid and comprehensive identification of active promoters and enhancers for many cell types. However, there is a lack of methods to link bona fide enhancers and their target promoters. Here, we develop and integrate multiple genomic features into a statistical predictor for enhancer–promoter interactions. Systematic analyses of the predicted interactions across 12 cell types reveals several global features of enhancer–promoter communication. Our approach presents a systematic and effective strategy to decipher the mechanisms underlying enhancer and promoter communication.
Keywords: chromatin interaction, genomics, bioinformatics, gene regulation, 3C
Abstract
Enhancer mapping has been greatly facilitated by various genomic marks associated with it. However, little is available in our toolbox to link enhancers with their target promoters, hampering mechanistic understanding of enhancer–promoter (EP) interaction. We develop and characterize multiple genomic features for distinguishing true EP pairs from noninteracting pairs. We integrate these features into a probabilistic predictor for EP interactions. Multiple validation experiments demonstrate a significant improvement over state-of-the-art approaches. Systematic analyses of EP interactions across 12 cell types reveal several global features of EP interactions: (i) a larger fraction of EP interactions are cell type specific than enhancers; (ii) promoters controlled by multiple enhancers have higher tissue specificity, but the regulating enhancers are less conserved; (iii) cohesin plays a role in mediating tissue-specific EP interactions via chromatin looping in a CTCF-independent manner. Our approach presents a systematic and effective strategy to decipher the mechanisms underlying EP communication.
Transcriptional enhancers represent the primary basis for differential gene expression. These elements regulate cell type specificity, development, and metazoan evolution, with many human diseases resulting from altered enhancer action (1, 2).
A key gap in our knowledge is an understanding of how enhancers select specific promoters for activation. Linkage of enhancers and target promoters is challenged by enhancer properties. First, increasing evidence suggests that enhancers are not located adjacent to their target promoters. Instead, they are positioned tens of kilobases away and contact their targets via long-range interactions (3–6). Second, enhancers are position independent, i.e., they may be located either upstream or downstream of the regulated promoter.
Experimental approaches to identifying enhancer targets have largely relied on chromosome conformation capture (3C) (7) and its variants such as circularized chromosome conformation capture (4C) and genome-wide chromosome conformation capture (Hi-C) (8), all of which determine the relative frequency of direct physical contact between linearly separated DNA sequences. Unlike 3C and 4C, Hi-C is a truly genome-wide technology, but its current resolution (1 Mbp) in general is not high enough to distinguish individual enhancer–promoter (EP) interactions (9). Newer methods such as ChIP-loop (10) and chromatin interaction analysis with paired-end tag sequencing (ChIA-PET) (11) combine the principles of 3C and ChIP to identify chromatin interactions mediated by protein factors. However, the assays are technically challenging and currently have a high false-negative rate (5, 12). Therefore, computational work, if successful, can complement experimental protocols and allow prioritization of future experiments much more effectively.
The most common computational approach is assigning the nearest promoter of an enhancer as its target. Improvements to this basic approach have been introduced by using insulator sites as an additional constraint (13), by correlating histone modification patterns at enhancers and their nearest promoters (14) or transcript levels of promoters within a given genomic domain (15), and by correlating Dnase I hypersensitivity signals at enhancers and promoters (16). The latter four approaches demonstrate that signals pertaining to EP interactions could be extracted from various types of genomic data to make predictions. However, current methods either still focus on the nearest promoter (13, 14) or only use limited types of genomic feature (15, 16). Furthermore, no rigorous characterization of the performance of these methods was reported.
Here, we introduce an integrated method for predicting enhancer targets (IM-PET). Leveraging abundant omics data, we develop multiple features and integrate them probabilistically to make robust predictions of EP pairs. The selected features are based on our current understanding of enhancer structure, function, and evolution. Using both computational and experimental validations, we show IM-PET significantly outperforms state-of-the-art methods. By analyzing global EP interactome across multiple cell types, we gain better insights into the mechanisms of enhancer and promoter communication.
Results
A Set of Discriminative Features for Identifying EP Pairs.
We devised and tested the following features for their abilities to discriminate a set of ∼2,000 real and noninteracting EP pairs that are selected based on published ChIA-PET data for K562 and MCF-7 cells (5). These pairs were selected using stringent ChIA-PET threshold and evidence of active enhancers and promoters (Materials and Methods and SI Appendix, Fig. S1).
Feature 1: Enhancer and target promoter activity profile correlation (EPC).
Recently, Ernst et al. (14) have shown that correlation between enhancer and promoter histone modification patterns can be used to infer their interactions. We extended this approach and asked whether there is a correlation in the activities of enhancers and promoters across multiple cell types. We estimated enhancer activity using the score computed by our previously developed CSI-ANN algorithm for predicting enhancers using histone modification signature (17). For promoters, we used fragments per kilobase of exon sequence per million reads (FPKM) values from RNA-Seq data to represent their activities. As shown in Fig. 1A, the average correlation between real EP pairs is significantly higher than that of noninteracting pairs (P = 1.1E-53, t test).
Fig. 1.

Discriminative features and performance evaluation by cross-validation. (A) Enhancer and target promoter activity profile correlation (EPC); (B) TF and target promoter expression correlation (TPC); (C) coevolution of enhancer and target promoter (COEV); (D) distance constraint between enhancer and target promoter (DIS); “real pairs,” pairs selected using K562 and MCF-7 ChIA-PET data; “non-pairs,” noninteracting pairs according to ChIA-PET data; “all pairs,” EP pairs formed by extracting all promoters within 2 Mbp of an enhancer. “nearest pair,” EP pair in which the promoter is closest to the enhancer among all promoters in the genome. P values are based on one-sided Student t test. n = 2,234 for all tests. (E) ROC curve. Numbers next to circles indicate thresholds for predicting EP pairs using the Thurman et al. method. PreSTIGE made two sets of predictions: high- and low-confidence sets.
Feature 2: Transcription factor and target promoter correlation (TPC).
Transcriptional regulation requires both regulatory DNA sequences and transcription factors (TFs). EPC score described above reflects correlation between regulatory DNA sequences only. We next examined the correlation between the expression of TFs that bind to an enhancer and the activity of the target promoter. We found that real EP pairs have significantly higher TPC scores than noninteracting pairs (P = 1.1E-16, t test) (Fig. 1B).
Feature 3: Coevolution of enhancer and target promoter (COEV).
We asked whether true EP pairs tend to coevolve, whereas noninteracting pairs do not. The evolutionary constraint between interacting EP pairs can be quantified by two complementary measures: sequence similarity and conserved synteny. Because TF binding sites within enhancers and promoters may have high turnover rate (18), the latter measure becomes important in such cases for capturing coevolution between promoters and enhancers (19, 20). Therefore, we integrated both measures to compute a COEV score. As shown in Fig. 1C, the COEV scores of real EP pairs are significantly higher than those of noninteracting pairs (P = 2.5E-11, t test).
Feature 4: Distance constraint between enhancer and target promoter (DIS).
Although enhancer location relative to its target promoter is not strictly constrained, empirical data do show a trend toward shorter distance. The median distance for real EP pairs in our training set is 14,792 and 16,682 bp for K562 and MCF-7 cell, respectively, and there is a monotonic decline in the frequency of EP pairs with increasing distance (SI Appendix, Fig. S3). However, the distance distribution of real EP pairs is significantly different from that of nearest pairs (P = 1.3E-67, t test) and that of nonspecific interactions that arise due to random collision of chromatin fiber (P = 3.2E-44, t test) (Fig. 1D).
Performance Assessment of the IM-PET Algorithm.
Using the four features described above, we trained a random-forest (RF) classifier (21) for predicting EP pairs (SI Appendix, Fig. S1). To assess the prediction accuracy, we performed a fivefold cross-validation and used receiver operating characteristic (ROC) curve to quantify the performance. We compared IM-PET to four state-of-the-art methods: nearest-promoter, PreSTIGE (15), and the methods by Ernst et al. (14) and by Thurman et al. (16) (SI Appendix, Experimental Procedures). PreSTIGE predicts EP pairs by pairing cell type-specific H3K4me1 signals with genes that are specifically expressed in each cell type across a panel of diverse cell types. The method by Ernst et al. predicts EP pairs using histone modification profile correlation between nearest candidate pairs with 125-kbp distance. The method by Thurman et al. predicts EP pairs using DNase I hypersensitive site (DHS) correlation of all candidate pairs within 500-kbp distance. By integrating multiple features, our method has an area under curve (AUC) value of 94%, 27% higher than the Ernst et al. approach (AUC = 67%) and much higher than that of PreSTIGE, nearest-promoter, and Thurman et al. methods (Fig. 1E).
To determine whether our model was overfitted, we conducted cross-validation experiments using a range of RF model parameters and cross-validation schemes. Our results suggest the model is not overfitted (SI Appendix, Experimental Procedures, Table S2, and Fig. S4). We also trained models using two alternative statistical classifiers, support vector machine and logistic regression. In both cases, we found that integrating four features gave the best performance (SI Appendix, Fig. S5). Among the three classifiers, the RF classifier had the largest AUC value. We therefore chose to use RF classifier in our implementation of the IM-PET algorithm.
We also tested whether IM-PET performs well in other eukaryotic species. For this purpose, we obtained 831 EP pairs in Drosophila melanogaster from the RedFly database that are validated by in vivo transgenic reporter gene assays (3). Similar to our result using human data, the four selected features are able to discriminate true EP pairs from random ones. Cross-validation experiment shows that IM-PET achieved higher prediction accuracy than the nearest-promoter approach and the approach by Ernst et al. (SI Appendix, Fig. S6). These results suggest that the IM-PET algorithm is generally applicable to a range of species. A software package implementing the IM-PET algorithm is available at www.healthcare.uiowa.edu/labs/tan/IM-PET_Package.tgz.
Genome-Wide Prediction of EP Pairs in 12 Human Cell Types.
Chromatin signatures and cofactor ChIP-Seq data have enabled genome-wide identification of enhancers (13, 22–25). However, without linking target promoters to enhancers, it is difficult to understand the regulatory output of enhancers and draw connections in a regulatory network. Here, by applying the IM-PET algorithm, we assigned targets for a genome-wide compendium of enhancers across 12 cell types in human (Fig. 2A). Using CSI-ANN, we predicted 208,342 enhancers in total, averaging 17,362 enhancers per cell type. This set of predictions has high quality as 84% of them overlap with at least one of three other genomic marks for enhancers (distal DHS, sequence conservation, and p300 site; SI Appendix, Table S1). We also identified 161,999 active promoters in these cell types using RNA-Seq data and GENCODE annotation of transcripts (26). At a false-discovery rate (FDR) of 0.01 (SI Appendix, Experimental Procedures), we predicted 441,879 unique EP pairs across the 12 cell types, averaging 36,823 interactions per cell type (Table 1). The list of predicted EP pairs and relevant information can be downloaded from www.healthcare.uiowa.edu/labs/tan/EP_predictions.xlsx.
Fig. 2.
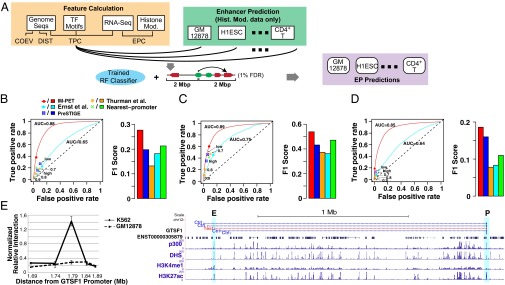
Genome-wide prediction and quality assessment of EP pairs in 12 cell types. (A) Schematic diagram for making genome-wide EP predictions using the IM-PET method. ROC curve and F1 score using additional ChIA-PET EP pairs (B), Hi-C EP pairs (C), and eQTL-gene pairs (D) as the gold-standard sets, respectively. F1 score is the harmonic mean of precision and recall. Numbers next to circles indicate thresholds for predicting EP pairs using the Thurman et al. method. PreSTIGE made two sets of predictions: high- and low-confidence sets. (E) 3C-qPCR validation of a predicted EP pair involving the transcript ENST00000305879 of the gene GTSF1. The EP pair is predicted in K562 but not in GM12878. The following tracks are shown from Top to Bottom: 3C-qPCR primer positions for negative controls (blue) and test (red) interactions; Refseq gene and transcript IDs (black) of the locus being tested; p300 ChIP-Seq peak; DHS ChIP-Seq peak; H3K4me1 ChIP-Seq peak; H3K27me3 ChIP-Seq peak. E, enhancer; P, promoter.
Table 1.
Summary statistics of predicted enhancers and promoter pairs in 12 human cell lines
| Cell type | No. predicted enhancers | No. cell-specific enhancers | No. promoters | No. cell-specific promoters | No. predicted EP pairs | Median distance, kbp | No. unique EP pairs |
| GM 12878 | 12,696 | 3,358 | 20,085 | 9,500 | 29,334 | 67 | 12,955 |
| H1 | 13,906 | 6,882 | 24,332 | 13,275 | 44,340 | 123 | 29,077 |
| HepG2 | 19,648 | 8,149 | 25,424 | 11,993 | 38,797 | 61 | 19,137 |
| HMEC | 18,689 | 2,852 | 20,759 | 8,511 | 27,313 | 60 | 6,847 |
| HSMM | 14,049 | 3,416 | 14,228 | 6,234 | 17,483 | 77 | 6,069 |
| HUVEC | 19,945 | 4,694 | 22,984 | 10,843 | 32,759 | 58 | 11,085 |
| IMR90 | 16,825 | 4,907 | 19,326 | 9,083 | 25,693 | 77 | 12,333 |
| K562 | 15,987 | 4,907 | 24,791 | 11,735 | 39,944 | 61 | 19,852 |
| MCF7 | 16,940 | 9,999 | 21,939 | 9,974 | 39,726 | 66 | 25,900 |
| NHEK | 19,111 | 2,932 | 25,853 | 10,003 | 36,154 | 59 | 11,653 |
| NHLF | 15,650 | 3,251 | 25,263 | 11,180 | 38,800 | 89 | 19,880 |
| CD4+ T | 21,796 | 10,198 | 29,480 | 18,870 | 71,536 | 111 | 41,409 |
Cell type-specific enhancers and EP pairs are defined as those occurring in only one cell type. Cell type-specific promoters are defined as those with an expression specificity rank in the top 25%.
To corroborate our predictions, we conducted a series of computational analyses as well as experimental validations. For computational validations, we use three types of orthogonal datasets to corroborate predictions made by the various methods, including ChIA-PET, high-resolution Hi-C, and expression quantitative trait locus (eQTL)–gene pairs.
First, we evaluated the predictions using additional ChIA-PET interactions from K562, MCF7, and CD4+ T cells (5, 6) that are not used during training the classifier. ROC curve analysis demonstrates that our set of predictions (1% FDR) had the highest balanced true- and false-positive rates (Fig. 2B). The data point representing our method is closest to the upper left corner that represents the performance of an ideal classifier. Our method also has the highest F1 score, which is the harmonic mean of precision and recall and quantifies the balanced performance. In addition to our predictions using 1% FDR cutoff, we constructed ROC curve across a range of prediction thresholds. Our method had a higher AUC value compared with the method by Ernst et al., suggesting further improvement at lowered prediction stringency.
Recently, Jin et al. used high-resolution Hi-C to identify a set of promoter–enhancer interactions in IMR90 cells (27). We further evaluated the predicted EP pairs using IMR90 Hi-C interactions. Both ROC curve analysis and F1 score demonstrate that our method had the highest balanced performance (Fig. 2C).
eQTLs are genetic variants associated with the expression of a gene. As another test of our EP predictions, we asked whether predicted pairs significantly overlap with reported eQTL–gene pairs. For GM12878 and HepG2 cells for which eQTL data are available, consistent with above results using genome-wide chromatin interaction data, our method (Fig. 2D) achieved the highest performance, further supporting our conclusion.
Validation Using Chromosome Conformation Capture Coupled with Quantitative PCR.
We performed chromosome conformation capture coupled with quantitative PCR (3C-qPCR) on nine randomly selected predictions. Of those, four pairs were predicted only in GM12878 cells and three pairs were predicted only in K562 pairs and one pair was predicted in both cell types. For most pairs, we conducted 3C-qPCR in both cell types and performed 16 experiments in total. For GM12878-specific pairs, the 3C-qPCR experiments done with K562 cells are additional negative controls that assess the prediction specificity, vice versa for K562 specific pairs. We achieved an 81% (13 of 16) validation rate. A recent carbon-copy chromosome conformation capture (5C) study estimated the false-positive rate of a single 5C experiment to be 20–47% (4), which suggests that our method has a similar accuracy as 5C. Of note, none of the test pairs was the nearest pair and detected by published 5C or ChIA-PET studies. In particular, two EP pairs separated by very long distances were validated by 3C. However, they were not detected by the previous 5C or ChIA-PET studies (4, 5). An example validation experiment involving a K562-specific interaction is shown in Fig. 2E. All validation results are shown in SI Appendix, Figs. S7–S12 and Tables S3 and S4.
Taken together, both computational and experimental validations confirmed the high quality of our predictions. We next used these predictions to investigate mechanisms governing EP interactions.
EP Interactions Have Higher Cell Type Specificity than Enhancers.
Although enhancers are known to function in a tissue-specific manner (1), quantitatively, it is not known how and to what extent they contribute to the cell-specific gene expression program in a cell. Consistent with recent large-scale chromatin interaction studies (4, 27, 28), we observed that each enhancer on average targets 2.92 promoters (Fig. 3A). About 32% of all enhancers are unique to a single cell type. However, we found that 49% of the EP interactions are unique to a single cell type. This trend holds true across the entire specificity spectrum (i.e., occurrence in 1–12 cell types). Fig. 3B plots the cumulative distributions of enhancers and EP pairs that are observed in at least 1, 2, and up to 12 cell types. Here, enhancers were predicted using 5% FDR cutoff and EP pairs were predicted using varied FDR cutoffs. As can be seen, the higher specificity of EP pairs is not an artifact of different thresholds used for enhancer and EP pair predictions because the trend is observed across a range of FDR thresholds (Fig. 3B and SI Appendix, Fig. S13).
Fig. 3.
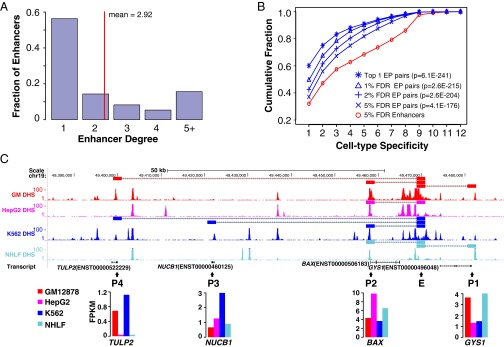
Cell type specificity of enhancer and promoter interactions. (A) Enhancer degree distribution; enhancer degree is defined as the number of promoters targeted by an enhancer. (B) Cumulative distributions of enhancers and EP pairs with decreasing degree of cell type specificity. Enhancers are predicted with 5% FDR cutoff. Given this set of enhancers, EP pairs were predicted at varied FDR cutoffs. P values are for comparing EP pair and enhancer curves using KS test. (C) An example constitutively active enhancer that has different promoter targets in four cell types. (Upper) Genome browser view of the predicted EP pairs and DHS-Seq signals. (Lower) Expression levels of the target promoters across four cell types. Positions of enhancers and target promoters are indicated by the letters “E” and “P,” respectively. FPKM, fragments per kilobase of exon per million fragments.
Our results suggest that cell type-specific EP interaction is more prevalent than cell type-specific activity of enhancers. In other words, nonspecific enhancers may be involved in specific promoter interactions in different cell types. Thus, besides their cell type-specific presence or absence, cell type-specific target selection may contribute a large part to cell type-specific gene expression. Fig. 3C shows an example enhancer that is constitutively active in four cell types. However, its target promoter(s) varies across the cell types. Importantly, the expression specificity of the predicted targets is consistent with the predicted EP specificity.
Promoters with High Expression Specificity Are Regulated by Multiple Enhancers That Have Lower Conservation Levels.
Previously, multiple enhancers controlling the same promoter have been identified in fly and termed “shadow enhancers.” It is suggested that they are important for ensuring the robust expression of genes with a critical role in development (29, 30). More recent 5C and ChIA-PET have revealed additional examples of promoters contacted by multiple enhancers (4, 5). To better characterize this phenomenon, we first calculated promoter degree, which is defined as the number of enhancers that interact with a given promoter using the set of predicted EP pairs. The degree distribution of promoters in EP pairs is shown in Fig. 4A. Consistent with a previous 5C study (4), we found that ∼40% of promoters interact with two or more enhancers.
Fig. 4.

Characteristics of promoters that are engaged in interactions with multiple enhancers. (A) Promoter degree distribution; (B) correlation between promoter degree and expression specificity. P value is based on one-sided correlation test, n = 441,879. (C) Correlation between promoter degree and conservation level of targeting enhancers. P value is based on one-sided correlation test, N = 441,879. (D) Genomic distribution of enhancers targeting promoters with different degrees. P value is based on one-sided proportion test. N(degree = 1) = 176,752; N(degree > 1) = 265,127.
To better understand shadow enhancers and their target promoters, we investigated several features, including promoter expression specificity and Gene Ontology (GO) term enrichment, enhancer sequence conservation, and genomic location bias. We computed an expression specificity rank for each promoter using the compendium of RNA-Seq data in 12 cell types. It is a value between 0 and 1, with 1 being the least specific (SI Appendix, Experimental Procedures).
First, we observed a significant positive correlation between the degree of a promoter and the expression specificity of the promoter (P = 3 × 10−94, correlation test) (Fig. 4B). Second, GO term analysis indicates that promoters controlled by three or more enhancers are more enriched in cell type-specific terms (SI Appendix, Table S5). Third, we observed a significant negative correlation between enhancer sequence conservation and the target promoter degree (P = 7.2 × 10−88, correlation test) (Fig. 4C), suggesting that shadow enhancers are less conserved. Finally, shadow enhancers tend to be more enriched in intergenic region compared with intron and UTRs (P = 5.8 × 10−109, proportion test) (Fig. 4D).
In summary, we found that promoters with high expression specificity are more likely to be regulated by multiple shadow enhancers. Furthermore, shadow enhancers are less conserved and more enriched in the intergenic region. Our result expands on the observation of shadow enhancers and suggests that there exists a genetic backup mechanism for EP communication to ensure accurate and robust cell type-specific gene expression.
Cohesin Mediates Chromatin Loop Formation and Regulates Cell Type-Specific Gene Expression in the Absence of CTCF.
Mechanisms of long-range EP interactions have remained poorly defined so far. Chromatin looping is an attractive mechanism for mediating EP interaction (7, 31, 32). CTCF, the most characterized mammalian insulator-binding protein, has been suggested to mediate chromatin loop formation between distal regulatory elements and promoters (33). In addition, the cohesin complex has been shown to colocalize with CTCF and facilitate the CTCF-mediated chromatin looping (34). However, cohesin alone has recently been implicated in tissue-specific transcriptional regulation in a CTCF-independent manner (35, 36).
To better define the role of cohesin in EP interaction, we performed an analysis of CTCF, cohesin, enhancers, and their target gene expression, taking advantage of our genome-wide collection of EP pairs. To identify looping interactions involving CTCF and cohesin, we used ChIP-Seq data to find pairs of CTCF and cohesin binding sites that overlap with our predicted EP pairs, i.e., occurring at both enhancers and promoters. We call those mirrored sites. We defined two kinds of mirrored cohesin sites: those that do not contain CTCF sites, which we call cohesin-not-CTCF (CNC) sites, and those that colocalize with CTCF sites, which we call cohesin-and-CTCF (CAC) sites (SI Appendix, Table S6). We found that mirrored CNC but not CAC sites significantly overlap with predicted EP pairs (Fisher’s exact test, Fig. 5A). Furthermore, for EP pairs that overlap with CNC sites, we found that the involved enhancers have higher cell type specificity than enhancers overlapping with CAC sites [P = 9.3 × 10−67, Kolmogorov–Smirnov (KS) test]. Similarly, the involved promoters have significantly higher cell type specificity than promoters overlapping with CAC sites (P = 3.4 × 10⁻¹⁴, t test) (Fig. 5B). Fig. 5C shows three example transcripts (LY9, SULT2A1, ADAMTS14) with high cell type-specific expression whose promoters are controlled by CNC but not CAC in GM12787, HepG2, and K562 cells, respectively.
Fig. 5.

Role of cohesin in mediating promoter and enhancer interaction and cell type-specific gene expression. (A) Cohesin-not-CTCF (CNC) but not cohesin-and-CTCF (CAC) sites significantly overlap with predicted EP pairs. P values are based on one-sided Fisher’s exact test. (B) CNC but not CAC sites significantly overlap with EP pairs with high specificity. Shown are bubble plots of the specificity of EP pairs mediated by mirrored CNC (red), CAC sites (blue), and all EP pairs (green, as reference). EP pairs are binned according to the specificity of the enhancer in the pair. Bubble size represents the fraction of EP pairs in each bin. y axis denotes the median promoter specificity of each EP pair bin. P value for expression specificity (pexpr) is based on one-sided Student t test. P value for enhancer specificity (penhancer) is based on one-sided KS test. N(CNC) = 17,737. N(CAC) = 3,700. (C) Example cell type-specific genes controlled by CNC sites. All track data (EP pair, ChIP-Seq, and RNA-Seq) are color-coded based on cell type, GM12878 (brown), HepG2 (magenta), and K562 (blue).
Previous studies have reported a large overlap between master regulators and cohesin without CTCF (36, 37). In addition, proteomic analysis showed direct interaction of cohesin subunits with OCT4 and NANOG in ES cells (38, 39). These results suggest that cell-specific TFs may be responsible for distinguishing CNC and CAC sites. We thereby investigated the TFs whose binding sites overlap with mirrored CNC and CAC sites. We found that TFs overlapping CNC sites show significantly higher expression specificity than those overlapping CAC sites (SI Appendix, Fig. S15, P = 8.3 × 10⁻²⁸, t test).
Taken together, our result suggests that cohesin can mediate chromatin looping without the involvement of CTCF. Such chromatin loops, compared with those mediated by both CTCF and cohesin, appear to specialize in regulating cell type-specific EP interactions and gene expression. Interactions between cell-specific TFs and cohesin may provide the specificity of CNC-mediated chromatin loops.
Discussion
Our method requires genome sequence, three histone modification ChIP-Seq, and RNA-Seq/microarray data. The latter two types of data are becoming widely available to hundreds of cell/tissue types in various organisms thanks to the wide adoption of next-gen sequencing technology and concerted effort to map the epigenome. As an alternative to histone modification data, DHS and transcriptional coactivator (e.g., p300) ChIP-Seq data can also be used in constructing the EPC feature. Thus, our method is generally applicable.
Among the four features used in the IM-PET method, distance constraint (DIS) is the most frequently used feature in previous approaches. However, selecting the nearest promoter or using a hard-set distance cutoff is not appropriate, as evidenced by recent 3C-based studies (4–6) as well as our comprehensive analysis presented here. A more principled way to use distance constraint is to express the probability of EP interaction as a function of distance. Here, we took advantage of the recently developed ChIA-PET technology (5) and used stringent criteria to extract a set of high confident EP pairs. We observed that the relation between distance and EP contact frequency could be modeled by a geometric distribution (SI Appendix, Fig. S3). Combining with the distance distribution of nonspecific interactions due to random collision of chromatin fiber, we introduced a probabilistic model of the DIS feature.
Besides DIS, we introduced three new features, EPC, TPC, and COEV. By combining features with different predictive power, we were able to achieve a significant improvement, demonstrating the value of an integrative approach. We analyzed the relative importance of the four features by assessing the impact of removing a feature on the model performance. We found that DIS and EPC are the most important features but all features contribute to the overall performance of the model (SI Appendix, Fig. S16). We expect that the performance of our method can be improved by incorporating additional features, such as the preference of enhancers for certain classes of promoters (40, 41) and the existence of tethering elements in promoters that capture enhancers (42).
Through the development and application of IM-PET, we produced a comprehensive catalog of enhancer targets in 12 human cell types. Our predictions are supported by a set of corroborating evidence. We expect that our work will have a significant impact on multiple aspects of enhancer biology, such as the basic mode of action and their involvement in disease etiology.
Materials and Methods
Definition of Promoters and Enhancers Used.
In this study, promoters are defined as 2 kbp upstream and 0.5 kbp downstream of a transcription start site annotated in GENCODE (26), a manually curated, high-quality set of transcripts in human genome. Enhancers in each cell type are predicted by CSI-ANN using cell type-specific histone modification data. We used 5% FDR as the cutoff, which yielded numbers of enhancers per cell that are consistent with published literature. Each predicted enhancer sequence is 2 kbp long. Judged by overlapping with various types of enhancer marks, the set of predicted enhancers also has high quality (SI Appendix, Table S1).
Preparation of Training Set EP Pairs.
Positive training set.
We selected the set of EP pairs based on a recently published ChIA-PET dataset. Using an anti-RNA polymerase II antibody, Li et al. (5) identified chromatin interactions involving promoters in human K562 and MCF-7 cells. Not all of these interactions are between promoters and enhancers. Thus, we first identified enhancers in these two cell types using the CSI-ANN algorithm (17) and three histone modifications that together uniquely mark active enhancers (H3K4me1, H3K4me3, and H3K27ac) (43). Next, we used the following stringent criteria to select enhancers that overlap with reported ChIA-PET interactions: (i) cis interactions with ≥ 5 PET counts (more stringent than the 3 counts used by the authors); (ii) one interacting site contains p300 site (enhancer marker) but not promoter, and the other interacting site contains promoter but not p300 site; (iii) promoters need to be expressed based on matching RNA-Seq data (i.e., FPKM value > 0). Using this set of stringent criteria, we extracted 1,124 and 1,110 enhancer and promoter pairs for K562 and MCF-7 cells, respectively. The selected enhancers have higher levels of histone marks and the selected target promoters have higher expression levels in the corresponding cell types (SI Appendix, Fig. S2), further supporting the quality of these interactions.
Negative training set.
A naïve approach to selecting negative training pairs is to randomly select a promoter for a given enhancer. However, the contact frequency between two noninteracting genomic loci in a chromatin fiber does not follow a uniform distribution. Instead, it is a function of the site separation distance in the following form (7):
where s denotes the sites separation distance, and the proportionality constant k reflects the efficiency of the cross-linking reaction. In our analysis, to generate a set of noninteracting EP pairs, for each enhancer, we first randomly selected a site based on the contact frequency distribution described above. Then we selected the closest promoter to that site as the candidate target. We also ensured that the selected promoter was not detected by ChIA-PET. Otherwise, we would use the next closest promoter to the site until it met our criteria. As a result, we selected a noninteracting promoter for each of all 2,234 enhancers in the positive training set.
Calculation of Feature Values.
EPC.
We first used the CSI-ANN algorithm to predict enhancers using histone modification ChIP-Seq datasets for each cell type. Next, for a given enhancer, its CSI-ANN scores across 11 cell types were used to construct an enhancer activity profile. For each promoter, its transcript expression levels across 11 cell lines were estimated from RNA-Seq data using FPKM. FPKM values were then used to construct a promoter activity profile. Pearson correlations were computed for all pairs of enhancer and promoter activity profiles and used as the EPC scores.
TPC.
We collected DNA binding motifs of 350 TFs from TRANSFAC (44), Jaspar (45), and Uniprobe (46). For a given enhancer and a TF, we calculated the binding probability of the TFs to the enhancer.
Given a sequence A of an enhancer and a position-specific scoring matrix (PSSM) M representing a TF binding motif, the binding probability can be approximated as follows (47):
where l is the length of A and g is the length of the background sequence, Sj is the score of the sequence word starting at position j according to the PSSM, and c represents the concentration of the TF in the cell. In our analysis, we used the sequence of the entire chromosome 1 as the background, and the mRNA expression level of the TF as an estimate of c.
We selected top five TFs for each enhancer based on the binding probabilities. For each of the five TFs, we calculated the Pearson correlation coefficients between the TF and the target gene expression. The mean correlation of the five was used as the final TPC score.
COEV.
We used the genome sequences of the following 15 mammalian species to calculate the COEV score: human, chimp, gorilla, orangutan, gibbon, rhesus, baboon, marmoset, tarsier, mouse lemur, tree shrew, mouse, rat, rabbit, and guinea pig.
It is known that regulatory DNA sequences may exhibit low conservation at the sequence level but higher level of synteny. Therefore, we considered both scenarios of evolutionary conservation: conserved sequence and conserved synteny.
To compute sequence conservation of a human enhancer or promoter, we extracted all of its homologous sequences in 14 mammal species, and computed the sequence similarity scores between the human sequence and its 14 homologous sequences separately. We used the alignment free algorithm ALF (version 1.0) to compute sequence similarity scores (48) as it is known that the order of TF binding sites in enhancers and promoters may not be conserved (18). We then scaled sequence similarities scores by their rank to between 0 and 1 so that the element with the highest similarity score was assigned a score of 1. We denote the normalized similarity scores as ASe,s and ASp,s for enhancer and promoter, respectively.
It is suggested that a real EP pair is more likely to be maintained in a conserved synteny block among different species (19, 20). Based on this idea, we defined a synteny score, , for each EP pair in species s. It equals to 1 if the distance between an enhancer and a promoter is less than 2 Mbp in species s, otherwise 0. We used the Liftover tool to find the syntenic regions covering every enhancer and promoter, and computed synteny scores for each EP pair in the training set based on 14 mammal species that are close to human.
Next, we combined sequence and synteny conservation information and compute a final coevolution score for each candidate pair as follows:
DIS.
The genomic distance between a transcription start site and the center of an enhancer region (2 kbp) was used for this feature.
Predictive Model and Performance Assessment.
Using the four features, we built a classifier using RF algorithm (21). The general idea of RF is to introduce some random perturbation in the process that generates single decision trees to get an ensemble of different trees. In the forest, each single tree is built based on a subset of randomly selected samples and a subset of randomly selected features; therefore, it is a weak classifier. However, the combination of all trees in a forest is a strong classifier. Our RF model consisted of 1,000 decision trees and each decision tree was built using 2/3 of randomly selected training data and 2 randomly selected features. We calculated the linkage score of an EP pair as the fraction of trees that classified the promoter as the enhancer target.
To evaluate the prediction accuracy of the model, we conducted a fivefold cross-validation. We partitioned the enhancers in the training set into five subsets. In each itinerary, we predicted targets for one-fifth of the enhancers. For each test enhancer, we extracted all promoters within the 2-Mbp window centered at the enhancer and computed a linkage score for each promoter using the RF model. This distance was chosen to cover 99.3% of training set of EP pairs. In total, we had 652,800 candidate EP pairs within all test windows, in which only 2,219 are true pairs according to the training set. We calculated the true- and false-positive rates of prediction sets using different decision thresholds. We averaged the true- and false-positive rates of fivefold cross validation to generate the ROC curve. Genome-wide predictions were also evaluated using ROC curves using additional external datasets (see SI Appendix for details).
3C-qPCR.
3C-qPCR was performed as previously described (11, 49). A total of 1 × 10⁷ cells were cross-linked with 1% formaldehyde for 10 min at room temperature. The reaction was quenched by the addition of 0.125 M glycine for 5 min at room temperature. After cell lysis, chromatin was digested using 400 units of HindIII (NEB) at 37 °C overnight. Digested DNA fragments were ligated using T4 DNA ligase (NEB) for 4 h at 16 °C. Samples were reverse cross-linked at 65 °C overnight and purified using QIAquick spin columns. DNA concentrations were measured using Nanodrop.
A control template containing all possible ligation products in equimolar amounts was used to check the amplification efficiency of each PCR primer set. Bacterial artificial chromosome (BAC) clones were used as control template to cover the genomic region under study. BAC DNA was digested using 1,000 units of HindIII (NEB) at 37 °C overnight. After DNA purification, digested DNA fragments were ligated using T4 DNA ligase (NEB) at 16 °C overnight. DNA was purified using QIAquick spin columns, and concentrations were measured using Nanodrop.
Genome regions for 3C-qPCR were chosen based on predicted EP interactions. All primers were designed to be within 25–100 bp from the nearest restriction enzyme digestion site. Quantitative real-time PCR was performed using SYBR Green chemistry on an ABI PRISM 7900. The linear range of amplification for BAC template and 3C template were determined by serial dilution. The template DNA was mixed with genomic DNA to obtain a final working concentration of total DNA (40 ng/µL). This amount of DNA template was used in subsequent experiments.
To quantify specific chromatin interactions, normalized relative amount of 3C product was calculated using the following formula:
where and quantify PCR products at the test locus in the 3C and BAC template, respectively, and and quantify PCR product at internal control locus in the 3C and BAC template, respectively.
Supplementary Material
Acknowledgments
We thank members of the K.T. Laboratory for helpful discussion. We thank David Eichmann, Lucas Van Tol, and the University of Iowa Institute for Clinical and Translational Science for providing computing support. This study was supported by National Institutes of Health Grant HG006130 (to K.T.).
Footnotes
The authors declare no conflict of interest.
This article is a PNAS Direct Submission. X.S.L. is a guest editor invited by the Editorial Board.
This article contains supporting information online at www.pnas.org/lookup/suppl/doi:10.1073/pnas.1320308111/-/DCSupplemental.
References
- 1.Visel A, Rubin EM, Pennacchio LA. Genomic views of distant-acting enhancers. Nature. 2009;461(7261):199–205. doi: 10.1038/nature08451. [DOI] [PMC free article] [PubMed] [Google Scholar]
- 2.Williamson I, Hill RE, Bickmore WA. Enhancers: From developmental genetics to the genetics of common human disease. Dev Cell. 2011;21(1):17–19. doi: 10.1016/j.devcel.2011.06.008. [DOI] [PubMed] [Google Scholar]
- 3.Gallo SM, et al. REDfly v3.0: Toward a comprehensive database of transcriptional regulatory elements in Drosophila. Nucleic Acids Res. 2011;39(Database issue):D118–D123. doi: 10.1093/nar/gkq999. [DOI] [PMC free article] [PubMed] [Google Scholar]
- 4.Sanyal A, Lajoie BR, Jain G, Dekker J. The long-range interaction landscape of gene promoters. Nature. 2012;489(7414):109–113. doi: 10.1038/nature11279. [DOI] [PMC free article] [PubMed] [Google Scholar]
- 5.Li G, et al. Extensive promoter-centered chromatin interactions provide a topological basis for transcription regulation. Cell. 2012;148(1-2):84–98. doi: 10.1016/j.cell.2011.12.014. [DOI] [PMC free article] [PubMed] [Google Scholar]
- 6.Chepelev I, Wei G, Wangsa D, Tang Q, Zhao K. Characterization of genome-wide enhancer-promoter interactions reveals co-expression of interacting genes and modes of higher order chromatin organization. Cell Res. 2012;22(3):490–503. doi: 10.1038/cr.2012.15. [DOI] [PMC free article] [PubMed] [Google Scholar]
- 7.Dekker J, Rippe K, Dekker M, Kleckner N. Capturing chromosome conformation. Science. 2002;295(5558):1306–1311. doi: 10.1126/science.1067799. [DOI] [PubMed] [Google Scholar]
- 8.Simonis M, Kooren J, de Laat W. An evaluation of 3C-based methods to capture DNA interactions. Nat Methods. 2007;4(11):895–901. doi: 10.1038/nmeth1114. [DOI] [PubMed] [Google Scholar]
- 9.van Steensel B, Dekker J. Genomics tools for unraveling chromosome architecture. Nat Biotechnol. 2010;28(10):1089–1095. doi: 10.1038/nbt.1680. [DOI] [PMC free article] [PubMed] [Google Scholar]
- 10.Horike S, Cai S, Miyano M, Cheng JF, Kohwi-Shigematsu T. Loss of silent-chromatin looping and impaired imprinting of DLX5 in Rett syndrome. Nat Genet. 2005;37(1):31–40. doi: 10.1038/ng1491. [DOI] [PubMed] [Google Scholar]
- 11.Fullwood MJ, et al. An oestrogen-receptor-alpha-bound human chromatin interactome. Nature. 2009;462(7269):58–64. doi: 10.1038/nature08497. [DOI] [PMC free article] [PubMed] [Google Scholar]
- 12.DeMare LE, et al. The genomic landscape of cohesin-associated chromatin interactions. Genome Res. 2013;23(8):1224–1234. doi: 10.1101/gr.156570.113. [DOI] [PMC free article] [PubMed] [Google Scholar]
- 13.Heintzman ND, et al. Histone modifications at human enhancers reflect global cell-type-specific gene expression. Nature. 2009;459(7243):108–112. doi: 10.1038/nature07829. [DOI] [PMC free article] [PubMed] [Google Scholar]
- 14.Ernst J, et al. Mapping and analysis of chromatin state dynamics in nine human cell types. Nature. 2011;473(7345):43–49. doi: 10.1038/nature09906. [DOI] [PMC free article] [PubMed] [Google Scholar]
- 15.Corradin O, et al. Combinatorial effects of multiple enhancer variants in linkage disequilibrium dictate levels of gene expression to confer susceptibility to common traits. Genome Res. 2014;24(1):1–13. doi: 10.1101/gr.164079.113. [DOI] [PMC free article] [PubMed] [Google Scholar]
- 16.Thurman RE, et al. The accessible chromatin landscape of the human genome. Nature. 2012;489(7414):75–82. doi: 10.1038/nature11232. [DOI] [PMC free article] [PubMed] [Google Scholar]
- 17.Firpi HA, Ucar D, Tan K. Discover regulatory DNA elements using chromatin signatures and artificial neural network. Bioinformatics. 2010;26(13):1579–1586. doi: 10.1093/bioinformatics/btq248. [DOI] [PMC free article] [PubMed] [Google Scholar]
- 18.Borok MJ, Tran DA, Ho MC, Drewell RA. Dissecting the regulatory switches of development: Lessons from enhancer evolution in Drosophila. Development. 2010;137(1):5–13. doi: 10.1242/dev.036160. [DOI] [PMC free article] [PubMed] [Google Scholar]
- 19.Ahituv N, Prabhakar S, Poulin F, Rubin EM, Couronne O. Mapping cis-regulatory domains in the human genome using multi-species conservation of synteny. Hum Mol Genet. 2005;14(20):3057–3063. doi: 10.1093/hmg/ddi338. [DOI] [PubMed] [Google Scholar]
- 20.Kikuta H, et al. Genomic regulatory blocks encompass multiple neighboring genes and maintain conserved synteny in vertebrates. Genome Res. 2007;17(5):545–555. doi: 10.1101/gr.6086307. [DOI] [PMC free article] [PubMed] [Google Scholar]
- 21.Breiman L. Random forests. Mach Learn. 2001;45(1):5–32. [Google Scholar]
- 22.Rada-Iglesias A, et al. A unique chromatin signature uncovers early developmental enhancers in humans. Nature. 2011;470(7333):279–283. doi: 10.1038/nature09692. [DOI] [PMC free article] [PubMed] [Google Scholar]
- 23.Creyghton MP, et al. Histone H3K27ac separates active from poised enhancers and predicts developmental state. Proc Natl Acad Sci USA. 2010;107(50):21931–21936. doi: 10.1073/pnas.1016071107. [DOI] [PMC free article] [PubMed] [Google Scholar]
- 24.Kim TK, et al. Widespread transcription at neuronal activity-regulated enhancers. Nature. 2010;465(7295):182–187. doi: 10.1038/nature09033. [DOI] [PMC free article] [PubMed] [Google Scholar]
- 25.Visel A, et al. ChIP-seq accurately predicts tissue-specific activity of enhancers. Nature. 2009;457(7231):854–858. doi: 10.1038/nature07730. [DOI] [PMC free article] [PubMed] [Google Scholar]
- 26.Harrow J, et al. GENCODE: The reference human genome annotation for The ENCODE Project. Genome Res. 2012;22(9):1760–1774. doi: 10.1101/gr.135350.111. [DOI] [PMC free article] [PubMed] [Google Scholar]
- 27.Jin F, et al. A high-resolution map of the three-dimensional chromatin interactome in human cells. Nature. 2013;503(7475):290–294. doi: 10.1038/nature12644. [DOI] [PMC free article] [PubMed] [Google Scholar]
- 28.Li G, et al. ChIA-PET tool for comprehensive chromatin interaction analysis with paired-end tag sequencing. Genome Biol. 2010;11(2):R22. doi: 10.1186/gb-2010-11-2-r22. [DOI] [PMC free article] [PubMed] [Google Scholar]
- 29.Hong JW, Hendrix DA, Levine MS. Shadow enhancers as a source of evolutionary novelty. Science. 2008;321(5894):1314. doi: 10.1126/science.1160631. [DOI] [PMC free article] [PubMed] [Google Scholar]
- 30.Perry MW, Boettiger AN, Levine M. Multiple enhancers ensure precision of gap gene-expression patterns in the Drosophila embryo. Proc Natl Acad Sci USA. 2011;108(33):13570–13575. doi: 10.1073/pnas.1109873108. [DOI] [PMC free article] [PubMed] [Google Scholar]
- 31.Li Q, Barkess G, Qian H. Chromatin looping and the probability of transcription. Trends Genet. 2006;22(4):197–202. doi: 10.1016/j.tig.2006.02.004. [DOI] [PubMed] [Google Scholar]
- 32.Gibcus JH, Dekker J. The context of gene expression regulation. F1000 Biol Rep. 2012;4:8. doi: 10.3410/B4-8. [DOI] [PMC free article] [PubMed] [Google Scholar]
- 33.Handoko L, et al. CTCF-mediated functional chromatin interactome in pluripotent cells. Nat Genet. 2011;43(7):630–638. doi: 10.1038/ng.857. [DOI] [PMC free article] [PubMed] [Google Scholar]
- 34.Dorsett D. Cohesin: Genomic insights into controlling gene transcription and development. Curr Opin Genet Dev. 2011;21(2):199–206. doi: 10.1016/j.gde.2011.01.018. [DOI] [PMC free article] [PubMed] [Google Scholar]
- 35.Faure AJ, et al. Cohesin regulates tissue-specific expression by stabilizing highly occupied cis-regulatory modules. Genome Res. 2012;22(11):2163–2175. doi: 10.1101/gr.136507.111. [DOI] [PMC free article] [PubMed] [Google Scholar]
- 36.Schmidt D, et al. A CTCF-independent role for cohesin in tissue-specific transcription. Genome Res. 2010;20(5):578–588. doi: 10.1101/gr.100479.109. [DOI] [PMC free article] [PubMed] [Google Scholar]
- 37.Kagey MH, et al. Mediator and cohesin connect gene expression and chromatin architecture. Nature. 2010;467(7314):430–435. doi: 10.1038/nature09380. [DOI] [PMC free article] [PubMed] [Google Scholar]
- 38.Nitzsche A, et al. RAD21 cooperates with pluripotency transcription factors in the maintenance of embryonic stem cell identity. PLoS One. 2011;6(5):e19470. doi: 10.1371/journal.pone.0019470. [DOI] [PMC free article] [PubMed] [Google Scholar]
- 39.van den Berg DL, et al. An Oct4-centered protein interaction network in embryonic stem cells. Cell Stem Cell. 2010;6(4):369–381. doi: 10.1016/j.stem.2010.02.014. [DOI] [PMC free article] [PubMed] [Google Scholar]
- 40.Smale ST. Core promoters: Active contributors to combinatorial gene regulation. Genes Dev. 2001;15(19):2503–2508. doi: 10.1101/gad.937701. [DOI] [PubMed] [Google Scholar]
- 41.Butler JE, Kadonaga JT. Enhancer-promoter specificity mediated by DPE or TATA core promoter motifs. Genes Dev. 2001;15(19):2515–2519. doi: 10.1101/gad.924301. [DOI] [PMC free article] [PubMed] [Google Scholar]
- 42.Calhoun VC, Stathopoulos A, Levine M. Promoter-proximal tethering elements regulate enhancer-promoter specificity in the Drosophila Antennapedia complex. Proc Natl Acad Sci USA. 2002;99(14):9243–9247. doi: 10.1073/pnas.142291299. [DOI] [PMC free article] [PubMed] [Google Scholar]
- 43.Calo E, Wysocka J. Modification of enhancer chromatin: What, how, and why? Mol Cell. 2013;49(5):825–837. doi: 10.1016/j.molcel.2013.01.038. [DOI] [PMC free article] [PubMed] [Google Scholar]
- 44.Matys V, et al. TRANSFAC and its module TRANSCompel: Transcriptional gene regulation in eukaryotes. Nucleic Acids Res. 2006;34(Database issue):D108–D110. doi: 10.1093/nar/gkj143. [DOI] [PMC free article] [PubMed] [Google Scholar]
- 45.Bryne JC, et al. JASPAR, the open access database of transcription factor-binding profiles: New content and tools in the 2008 update. Nucleic Acids Res. 2008;36(Database issue):D102–D106. doi: 10.1093/nar/gkm955. [DOI] [PMC free article] [PubMed] [Google Scholar]
- 46.Newburger DE, Bulyk ML. UniPROBE: An online database of protein binding microarray data on protein-DNA interactions. Nucleic Acids Res. 2009;37(Database issue):D77–D82. doi: 10.1093/nar/gkn660. [DOI] [PMC free article] [PubMed] [Google Scholar]
- 47.Stormo GD, Fields DS. Specificity, free energy and information content in protein-DNA interactions. Trends Biochem Sci. 1998;23(3):109–113. doi: 10.1016/s0968-0004(98)01187-6. [DOI] [PubMed] [Google Scholar]
- 48.Göke J, Schulz MH, Lasserre J, Vingron M. Estimation of pairwise sequence similarity of mammalian enhancers with word neighbourhood counts. Bioinformatics. 2012;28(5):656–663. doi: 10.1093/bioinformatics/bts028. [DOI] [PMC free article] [PubMed] [Google Scholar]
- 49.Hagège H, et al. Quantitative analysis of chromosome conformation capture assays (3C-qPCR) Nat Protoc. 2007;2(7):1722–1733. doi: 10.1038/nprot.2007.243. [DOI] [PubMed] [Google Scholar]
Associated Data
This section collects any data citations, data availability statements, or supplementary materials included in this article.