Abstract
The issue of protein dynamics and its implications in the biological function of proteins are arousing greater and greater interest in different fields of molecular biology. In cryo-electron tomography experiments one may take several snapshots of a given biological macromolecule. In principle, a large enough collection of snapshots of the molecule may then be used to calculate its equilibrium configuration in terms of the experimentally accessible degrees of freedom and, hence, to estimate its potential energy. This information would be crucial in order to analyze the biological functions of biomolecules by directly accessing the relevant dynamical indicators. In this article, we analyze the results of cryo-electron tomography experiments performed on monoclonal murine IgG2a antibodies. We measure the equilibrium distribution of the molecule in terms of the relevant angular coordinates and build a mechanical model of the antibody dynamics. This approach enables us to derive an explicit expression of the IgG potential energy. Furthermore, we discuss the configuration space at equilibrium in relation to results from other techniques, and we set our discussion in the context of the current debate regarding conformation and flexibility of antibodies.
It is now widely recognized that proteins are flexible objects and exist in populations of different structures, rather then in a single rigid conformation. In fact, collective motions of domains greatly enhance proteins' ability to bind other molecules. Textbooks usually show proteins naked, neglect crucial dynamical aspects such as fluctuations, and take little notice of the protein environment. Real proteins, however, are wiggling and jiggling, dressed by the hydration shell, and usually embedded in a cell or cell membrane (1).
Antibodies link antigens and immunological effector systems by means of highly mobile linkers that connect the hypervariable antigen-binding sites to the effector domain (Fc). Antibodies possess the structural flexibility to adapt to a huge variety of antigen shapes and sizes, whereas they share similar conserved Fc regions that interact with a limited number of effector systems, such as Fc receptors and complement (2, 3).
The antibody IgG is a glycoprotein with a molecular mass of 150 kDa, which binds to foreign agents such as viruses by subunits named fragment antigen-binding arms (Fab arms). Hinges connect two Fab arms to a stem that crystallizes easily (“Fc” stem), so that each antibody can bind to two antigens or to a single antigen with increased strength. It is known that the arms of the uncomplexed IgGs are highly flexible and have a wide range of variability of the reported values of Fab–Fab and Fab–Fc angles (4).
Two-dimensional electron microscopy and physiochemical experiments also support a hypothesis of inherent flexibility of the IgG molecules (4, 5). However, a great variability exists in the literature as to the average values of crucial structural parameters such as Fab–Fab and Fab–Fc angles (6); and, to our knowledge, no estimate exists of their probability distribution at equilibrium. Large-scale conformational differences have also been detected among three complete structures of intact and functional antibodies (subclasses human IgG1, murine IgG1, and murine IgG2a) solved by x-ray crystallography (6, 7). These differences are due, in part, to the high fragility of the IgG molecules and, more generally, to the limitations intrinsic to experimental techniques such as electron microscopy and x-ray analysis.
Electron microscopy analysis preceded crystallographic analysis (8, 9) of immunoglobulins by more than a decade and, for a time, has been the only way to analyze their 3D structure (see ref. 4 for a review). Once the x-ray structures were deduced, the role of electron microscopy gradually moved from gross structural analysis to address more sophisticated structural and functional questions. However, electron micrographs are 2D representations and necessarily present projected images, making interpretation in three dimensions very difficult. On the other hand, x-ray crystallography suffers from the inherent ambiguities associated with unpredictability of differential packing environments within the crystals. Electron tomography is a general method for 3D reconstruction of individual objects from a tilt series of electron microscope images (10–13). The electron tomography method is general in the sense that it can be applied to any transparent object (14–16); it is not restricted to symmetrical or regularly arranged objects (17–19) or to objects with a preferred orientation on a support grid (20, 21).
In cryo-electron tomography (cryo-ET) experiments the sample is quenched to the temperature of liquid nitrogen. Therefore, one gets a gallery of instantaneous snapshots of the system. In ref. 11, data from cryo-ET of individual IgG molecules in solution have been analyzed and have confirmed that the position of the Fab arms relative to the Fc stem may greatly differ from one molecule to another. In this article, we analyze a subset of high-resolution 3D snapshots from the same set of experiments. Our aim is 2-fold: reconstruct the equilibrium statistics of the principal structural parameters and use such information as the starting point for studying the dynamics of an individual immunoglobulin in solution. Hence, we first analyze the experimental images and introduce a statistical description of the IgG configuration. This study enables us to deduce our first important result, namely, the probability distributions of the Fab–Fab and Fab–Fc angles. We then build a simple mechanical model and derive an effective potential energy for the single antibody, which also allows us to calculate quantitative estimates of the relevant frequencies of the IgG motion. This model is the main result of this article.
In the following sections, we introduce our model and perform an analysis of the experimental data. We then detail the results and we summarize our findings and sketch the developments of the present work. The experimental method and the details of the imaging process are outlined in Appendix 1, which is published as supporting information on the PNAS web site.
The Model
The phase space of a system with n degrees of freedom can be parameterized by a vector ( ,
,  ) of n generalized coordinates (q1,..., qn) and n conjugate momenta (p1,..., pn), containing the information about the system configuration and velocity, respectively. When the system is in equilibrium with a thermal bath at temperature T, any point in the phase space can be occupied with a probability density
 |
[1] |
where K is the kinetic energy, V is the system potential, kB is the Boltzmann constant, and Z(T) is a temperature-dependent normalization factor. It is important to notice that, whereas in Cartesian coordinates the kinetic energy only depends on momenta, in general, it also depends on coordinates (as in the case of polar coordinates).
If the equilibrium probability density of a system is made accessible experimentally, it is in principle possible to invert Eq. 1 to extract information regarding the dynamical properties of the system. This possibility is the case in cryo-ET experiments, where a direct measure of the equilibrium distribution in the configuration space can be performed through a statistical analysis of an ensemble of different snapshots of the system. The equilibrium probability distribution in the configuration space results from the integration of Eq. 1 over the conjugate momenta pi:
 |
[2] |
where
 |
[3] |
The function  is the kinetic contribution to the equilibrium probability density and must be computed analytically to extract the potential from the measured
  . Once this analysis is done, we can calculate the potential V as:
 |
[4] |
where V0(T) is a constant, which depends only on temperature. We stress that the temperature enters Eq. 4 as a parameter. In particular, it should be noted that the derivation of Eq. 4 is rigorous only if the system is at thermodynamic equilibrium (at the temperature T). In general, the validity of this condition and the appropriate value of T that characterizes the collection of snapshots depend on the timescales set by both the experiment and the system dynamics.
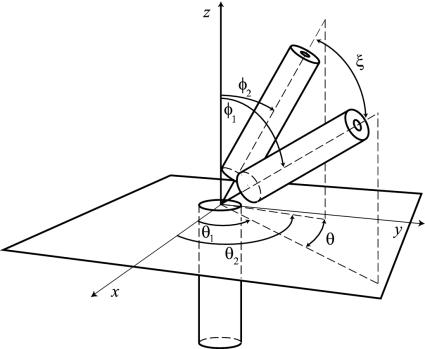
In our model, we consider the immunoglobulin molecule to be composed of three rigid rods freely jointed together in a common point (Fig. 1): namely, two (Fab) arms of equal mass M and length L and the (Fc) stem (pictorially, it may be visualized as a lobster). As a first approximation, we assume the three bodies to be connected in a single point and therefore neglect the translational offsets among the intersections of the Fab and Fc major axes. Furthermore, at this level of schematization, we do not take into account the intra-Fab distortions associated with flexion of the elbow regions. The Fc rod is aligned along the z axis and two angles are introduced to specify the position of each Fab relative to the Fc. The angles θi (i = 1, 2) are measured on the plane perpendicular to the Fc and identify the position of the Fab–Fc planes. The position of the Fab arms within those planes is then measured by the angles φi (i = 1, 2). Moreover, we denote with ξ the Fab–Fab separation in the Fab–Fab plane.
Fig. 1.
Coarse-grained model of an immunoglobulin molecule. The two Fab arms and the Fc are replaced by rigid rods freely jointed in the hinge region. The relative position of the Fab1,2–Fc arms is described by the two angles φi and θi (i = 1, 2), in the Fabi–Fc planes and in the plane perpendicular to Fc, respectively. The angle ξ measures the Fab–Fab separation in the Fab–Fab plane.
In the following text, we choose to parametrize the system as a function of the angles  and the associated conjugate momenta (actions)
  . In this case, the mathematical derivation of the Hamiltonian is straightforward and we get:
 |
[5] |
where
 |
[6] |
and I is the moment of inertia of a rod about an axis perpendicular to its end.
Let us stress that the choice of the set of variables  is not unique. A sensible alternative to our choice might well be to consider the Fab–Fab angle ξ (see Fig. 1), e.g., by adopting the set of coordinates (φ1, φ2, θ1, ξ). However, we note that, for any given values of φ1 and φ2, the angle ξ is confined to the interval |φ1 - φ2| < ξ < φ1 + φ2. As a consequence, one must take such entropic constraint into account in the derivation of Eq. 2 making the analytical calculation much more cumbersome.
The function  can be computed by inserting the expression 6 into Eq. 3. After the integration we obtain:
 |
[7] |
where we have dropped the temperature-dependent additive constant.
In the next section we first illustrate the derivation of the equilibrium density  from the experimental data and then discuss its statistical analysis.
Analysis of the Experimental Data
By using cryo-ET, we were able to reconstruct 3D volumes of IgG molecules in solution. The analysis of the reconstructed volumes allowed us to isolate 42 reliable structures of individual molecules. We operated the selection according to strict criteria: the objects that did not present a fully resolved structure were rejected. In particular, for all selected molecules, the Fc was identified and the broadening of the upper part of the segment clearly displayed. However, it was not possible to align consistently the Fc stems, and thus we could not systematically label the “left” and “right” Fab domains.
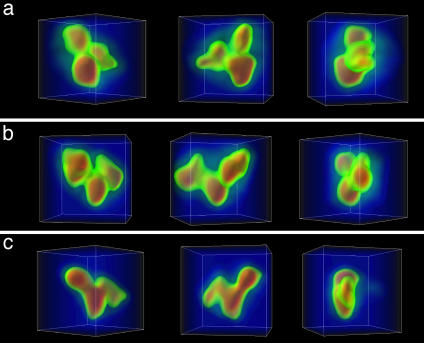
A typical gallery of reconstructed, individual IgG molecules is shown in Fig. 2. The densities are mapped with a continuous color coding, ranging from blue to red, clearly highlighting the large-scale structure of the antibody.
Fig. 2.
Gallery of individual IgG molecules visualized by volume rendering in three dimensions. Three different views of each tomogram are displayed. The box is 50 × 40 × 50 pixels.
For each molecule, we measured the Fab–Fab angle ξ and the two Fab–Fc angles φ1 and φ2 by approximating the three domains with ellipsoidal envelopes and measuring the angles formed by their major axes.
As already discussed in The Model, we parametrize the system in the space (φ1, φ2, θ1, θ2). However, we are interested in the relative motion of the two Fab arms. As a consequence, we consider the transformation to the relative coordinates θ = θ2 - θ1 and Ψ = [θ2 + θ1]/2, while keeping φ1 and φ2. The angle Ψ describes the motion of the center of mass of the two Fab arms projected on a plane perpendicular to the Fc stem. However, we recall that the “front” and “back” sides of the Fc domain are not distinguishable within our experimental resolution. Consequently, it appears reasonable to consider the probability ρ(φ1, φ2, θ) = |ρ(φ1, φ2, θ, Ψ)|Ψ, averaged over Ψ in the domain [0, 360°]. We note that, by doing this, we are also neglecting whatever energy is associated with a torsion of the two Fab arms as a whole with respect to the Fc axis.
We now wish to estimate the density profile ρ(φ1, φ2, θ) from the experimental data. The available population of our configurational ensemble is limited. Therefore, we have enough statistics to only access the coordinate space φ1, φ2, θ one angle at a time. Furthermore, we are not able to distinguish between the two Fab domains. Consequently, each molecule contributes two values to the population of the Fab–Fc angles. Accordingly, we assume that the density ρ(φ1, φ2, θ) can be factorized as the product of three 1D normalized functions in the following fashion∥:
 |
[8] |
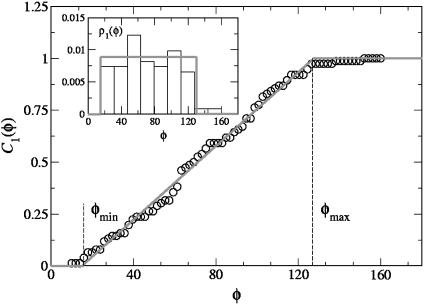
We show in Fig. 3 the normalized histogram of the experimental data ρ1(φ) with φ1 = φ2 = φ (Inset) and the corresponding normalized cumulative distribution. The latter is easily calculated from the data by noting that it is nothing but the rank-frequency plot with the axes inverted. In general, it is preferable to work with the cumulative distributions, because the low-statistics regions get more populated with the integration. The experimental data can be clearly interpreted by means of the uniform distribution in the interval [φmin, φmax]:
 |
[9] |
To determine the experimental cutoffs φmin and φmax, we fitted the experimental cumulative distribution. From the fit we found φmin ≈ 15° and φmax ≈ 127.6°.
Fig. 3.
Experimental cumulative distribution of the φ1, φ2 angles (○) and fit with the function  (red solid line). (Inset) Normalized histogram of the experimental data and plot of the square function 9 with φmin ≈ 15° and φmax ≈ 127.6° (red solid line).
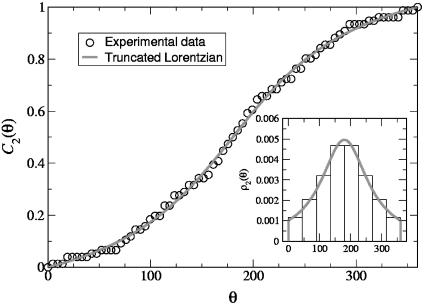
The projected angles θ can be straightforwardly obtained from the experimental values of φ1, φ2, and ξ. They are measured in the interval [0, 180°], because we cannot systematically identify the front and back broad sides of the Fc domain in the reconstructed data. Therefore, to extend the distribution domain to the interval [180°, 360°], we perform a reflection of the data around θ = 180°. In Fig. 4 we show the normalized histogram ρ2(θ) (Inset) and the corresponding normalized cumulative distribution. We found that a simple Lorentzian profile truncated in [0,360°] fitted the data extremely well:
 |
[10] |
where θ0 = 180°, and σθ is the only floating parameter. As we did for the ρ1(φ), we determined σθ by fitting the experimental cumulative distribution. From the fit we found σθ ≈ 91.6°.
Fig. 4.
Experimental cumulative distribution of the θ angles (○) and fit with the function  (red solid line). (Inset) Normalized histogram of the experimental data and plot of the truncated Lorentzian 10 with σθ ≈ 91.6°.
The Effective Potential
We are now able to compute the effective potential V(φ1, φ2, θ). By using Eqs. 8, 9, and 10, Eq. 7 can be written in the following manner:
 |
[11] |
where
 |
[12] |
As already mentioned, the temperature T0 is here a constant parameter. More precisely, the angular distributions obtained from the experimental snapshots of the IgG molecules are to be considered estimates of the equilibrium configuration at a temperature T0. (For a detailed description, see Appendix 3, which is published as supporting information on the PNAS web site.)
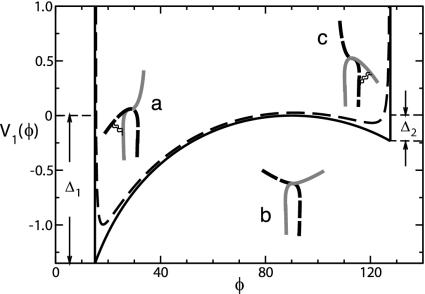
The potential V1(φ) describes the motion of the two Fab arms in the Fab–Fc planes. It arises from the combination of the flat experimental distribution of the φ angles and the centrifugal term from the integration of the kinetic part of the Hamiltonian (Fig. 5).
Fig. 5.
Solid line shows potential energy in the Fab–Fc planes (units of kBT0). The experimental values of the angular cutoff φmin ≈ 15° and φmax ≈ 127.6° are explicitly drawn as rigid walls. Dashed line shows smoothed potential (see text). The relative Fab–Fc position is also represented in the two wells and at the barrier as a sketch of the two heavy chains mutually crossing in the hinge region.
We are now able to understand the experimental evidence of equiprobability of any φ values in the Fab–Fc planes. It is the combined effect of two different competing energy terms. On the one side, the centrifugal term favors configurations at values close to φ = 90°. In fact, the rotation around the Fc axis of a Fab arm in such configurations has the lowest kinetic energy. On the other side, one has the potential energy V1(φ). It may be speculated that the latter in turn arises from the combination of two distinct energy terms. A greater and greater price is paid the more the chains are bent in the hinge region. However, an energy gain may also occur in some configurations in terms of contacts between the CH1 and CH2 subdomains. As a result, we can sketch the trend of V1(φ) as the a single arm moves from φmin to φmax in the following fashion. Let us represent the IgG molecule at the simple level of two mutually crossing identical (heavy) chains and isolate one of them for reference (Fig. 5, red chain). The configuration at φmin has the lowest energy, which means that, even though no new contacts can be formed in this configuration, there is also no bending energy price to pay at all (configuration a). The more the Fab rotates toward the Fc, the more it costs to be bent. In particular, it takes about 2kBT0 to bend the chain at an angle φ = 90° (configuration b). However, some energy may be regained past φ = 90° in terms of the new contacts made available, which gives a gain of about kBT0/2 (configuration c). This makes φ ≈ 90° a barrier that separates two local minima at φ ≈ φmin and φ ≈ φmax.
The combined effect of this double-minimum energy landscape and the centrifugal energy result in a uniform distribution of the Fab–Fc angles. As we show in Appendix 2, the two Fab arms are characterized by an average separation ξ ≈ 110°. Translated into the φ domain, this information means that the two local minima at φ ≈ φmin and φ ≈ φmax are occupied by one Fab at a time.
Of course, the true potential will be a smooth function of φ in the two binding regions. An example of what a more realistic V1(φ) might look like is the dashed curve in Fig. 5, which is the graph of the function
 |
[13] |
where the rigid walls have been replaced by moderate (φ-1)-like repulsive terms. The smoothing of the rigid walls causes the two cuspids at φ = φmin and φ = φmax to become new differentiable minima at φ ≈ 20° and φ ≈ 117°.
By using Eq. 13, we can estimate the characteristic frequencies ωφ associated with small oscillations in the two wells as  , where
  evaluated at the bottom of the well, while M ≈ 8 × 10-23 kg and L ≈ 80 Å are the Fab mass and length, respectively. We get
  and
and  .
.
For small values of θ - θ0, the potential energy V2(θ) can be expanded as follows:
 |
[14] |
where we have introduced the elastic force constant
 |
[15] |
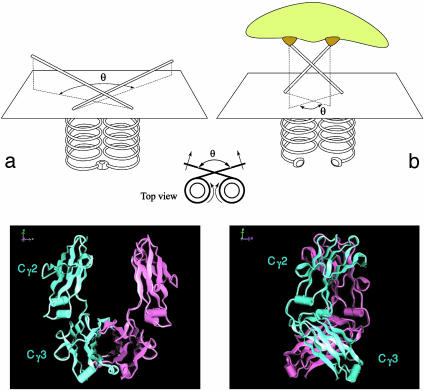
Therefore, for small displacements about the equilibrium position θ0 = 180°, V2(θ) is an elastic energy that accounts for small oscillations in the plane orthogonal to the Fc. Hence, it describes the deviations from the equilibrium planar Y-like shape of the immunoglobulin. We may interpret such elastic energy as sketched in Fig. 6.
Fig. 6.
(Upper) Schematization of the halves of an Fc stem. The chains are explicitly shown to cross at the hinge level. (a) Unbound antibody. (b) Antibody–antigen complex (Lower) Two views of the crystal structure of the Fc domain from human immunoglobulin IgG. The two heavy chains have different colors (from the web site of M. Clark, available at www.path.cam.ac.uk/~mrc7/igs/mikeimages.html#Model).
With no antigen bound at the Fab-binding sites, antiintegral oscillations of the two Fab arms correspond to rotations of the two halves of the Fc stem against each other around the vertical axis (Fig. 6a). Such rotation is in turn opposed by the contacts between the two CH3 immunoglobulin domains at the Fc end (see the crystal structure of the Fc in Fig. 6). The net result is a force that opposes oscillations away from the planar θ = 180° configuration. On the other hand, we may imagine that, when the antibody binds an antigen, the same elastic energy might be used to weaken the contacts in the Fc tail, thus making it easier for the back region to open up and bind to other molecules. This would be extremely useful, e.g., in the binding process of the antibody–antigen complex to the specific receptors on immune cells (Fig. 6b).
We stress that the strength of such elastic force is rather small. This corresponds to a very broad distribution in the range 0 < θ < 2θ0, with a large standard deviation σθ ≈ θ0/2. Correspondingly, we note that the hinges cannot be expected to transmit mechanical energy between the Fabs and Fc domains as perfectly rigid joints because of their intrinsic bendability. In other words, only a limited portion of the energy involved in any displacements of either domain will be effectively transferred in the above-mentioned fashion. We may imagine the remaining energy to be evenly dissipated in the deformation of the hinges themselves.
The characteristic frequency ωθ associated with small oscillations in the potential well V2(θ) depends, in general, on the values of φ1 and φ2. Yet, we can estimate ωθ by linearizing the equations of motion of the system in the vicinity of the equilibrium positions of the system. These positions are the two degenerate configurations Ω1 = (φmin, φmax, θ0) and (φmax, φmin, θ0), plus the arms-down and arms-up configurations at Ω2 = (φmax, φmax, θ0) and Ω3 = (φmin, φmin, θ0), respectively. However, we observe that the latter arrangement is assigned a very small probability of occurrence in terms of the corresponding ξ and θ. Hence, we are left with the two characteristic frequencies:
 |
[16] |
By inserting the best-fit result σθ ≈ 91.6° in Eq. 15 we get  and
and  . However, we observe that the frequency
  is nearly twice
  . As a consequence, it is the latter that should be regarded as the value setting the frequency scale in θ. Unfortunately, the precise value of T0, in general, will depend in a complicated fashion on the solvent viscosity and the characteristic timescales of the molecular vibrations as compared with the timescale of the temperature quench. To be more precise, the ambient temperature Tamb ≈ 20°C is only an upper bound. On the other hand, a lower bound can be identified at the temperature T∞, which marks the divergence of water viscosity. At such temperatures, a transition occurs in the solvent from a liquid to a solid (glasslike) phase during the quenching process. We can estimate T∞ by fitting the experimental values of the water viscosity measured in the interval [0,100°C] (22). We found T∞ ≈ -45°C (data not shown). Such a value is in excellent agreement with the accepted estimate of the singularity point of liquid water Ts ≈ 228 K, where the Cp, isothermal expansivity and isothermal compressibility all diverge. At that point, it is believed that water becomes a rigid gel with a structure closely resembling that of ice I, when quenched at 106–107°C/s (ref. 23 and references therein and ref. 24).
We remark that the use of the two limiting values Tamb and T∞ in 16 results in a difference of <10% in the estimates of the frequencies of small oscillations. By choosing T0 = T∞ we therefore obtain:
 |
[17] |
Conclusions
In the first part of this work we measured the experimental probability distributions of the relevant angular coordinates of an IgG molecule at equilibrium. We showed that the average value of the Fab–Fab angle is ≈110°. Its distribution is a broad bell-shaped function, with a standard deviation of ≈30°. This finding correlates well with the estimates obtained by other dynamical measurements, such as dielectric relaxation experiments on bovine IgG (25) (ξ ≈ 126°) and immunoelectron microscopy studies (4) (ξ = 127 ± 32° for IgG2). A worst agreement is found with the only IgG2 intact structure from x-ray crystallography, namely, murine IgG2A mAb 231 [PDB ID code 1IGT (26)]. We observe that the measured values of the Fab–Fab angle of 172° might be affected by unpredictable errors originating by the special packing environment within the crystal. Of course, this shortcoming of x-ray crystallography is unavoidable when applied to highly flexible systems such as antibodies. The results from the other two x-ray structures of intact IgG antibodies are ξ ≈ 148° [PDB ID code 1IGY (27)] and ξ ≈ 117° [PDB ID code 1HZH (28)]. However, both the latter molecules are IgG1 antibodies. Consequently, the differences in hinge conformation between IgG1 and IgG2 species do not allow a straight comparison of our results with those structures.
We note that our findings may also point the correct way to normal mode analysis of antibodies, whereby crystal structures modified according to more accurate structural measurements would seem the appropriate equilibrium positions to use in the analysis.
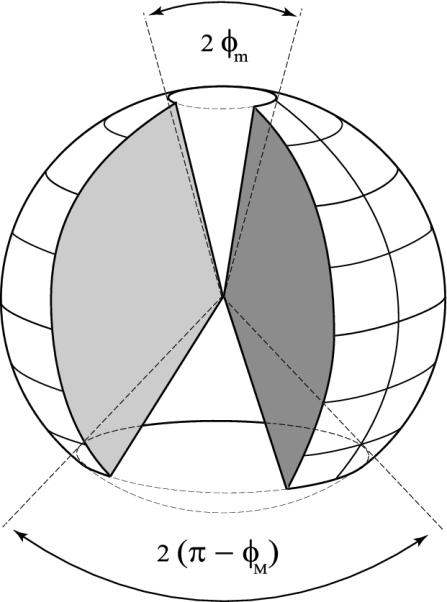
Furthermore, we showed that the Fab–Fc angles are approximately uniformly distributed between the two limiting values φmin ≈ 15° and φmax ≈ 127.6°. Such boundaries reflect the excluded-volume steric constraints imposed by the molecular structure. We can give a pictorial description of the configuration space of an IgG molecule by following the spatial arrangement of Fig. 1. The only constraint is φmin < φ1 and φ2 < φmax. Hence, it is enough to cut away from a sphere of radius L two cones of aperture 2φmin and 2(180° - φmax), respectively (Fig. 7). Therefore, no matter where the Fab arms are positioned with respect to the Fc, the molecule always has two accessible regions. The extension of the banned regions can be quantified in terms of the corresponding solid-angle fractions as
 |
[18] |
These estimates show that, on average, the IgG molecules prefer to confine the motion of the Fab arms in a region corresponding to ≈80% of the whole solid angle. Of course, an identical scenario holds at any position of the Fc stem with respect to a given absolute reference frame. In summary, the angular distance between either Fab and the Fc cannot be smaller than ≈50°. This fact may have interesting implications in the neutralization mechanisms of the antigen–antibody complexes, which require the interaction of the Fc domain with different biological units, such as specific receptors on immune cells.
Fig. 7.
Representation of the IgG configuration space. The vertical axis of the sphere coincides with the Fc stem; the hinge region lies at its center.
In the second part of the work, we established a connection between the measured angular distributions and the dynamics of the antibody. In particular, we derived an explicit expression for the potential energy function of the molecule based on a simple mechanical model. The inverse path may then be taken to investigate the equilibrium distribution of a single IgG in solution through computer simulation of its Langevin dynamics. Preliminary results (not reported here) confirm the consistency of our procedure. In particular, the dynamical approach opens the way to direct access to different dynamical indicators, potentially linked to the biological functions of the antibody. These indicators include two-point time-correlation functions between selected degrees of freedom, such as Fab–Fab angles and Fab–Fc angles or Fab1–Fc and Fab2–Fc angles. In addition, straight access to the molecule dynamics may be used for comparison with results from different experimental techniques, such as dielectric relaxation measurements or fluorescence resonance energy transfer microscopy.
Supplementary Material
Acknowledgments
L.B. received financial support from Ente Cassa di Risparmio di Firenze.
This paper was submitted directly (Track II) to the PNAS office.
Abbreviations: cryo-ET, cryo-electron tomography; Fab arms, fragment antigen-binding arms.
Footnotes
An argument to test a posteriori the validity of our theoretical framework (including the hypothesis of factorization) is provided in Appendix 2, which is published as supporting information on the PNAS web site.
References
- 1.Fenimore, P. W., Frauenfelder, H., McMahon, B. H. & Parak, F. G. (2002) Proc. Natl. Acad. Sci. USA 99, 16047-16051. [DOI] [PMC free article] [PubMed] [Google Scholar]
- 2.Burton, D. R. (1985) Mol. Immunol. 22, 161-206. [DOI] [PubMed] [Google Scholar]
- 3.Burton, D. R. (1990) Trends Biochem. Sci. 15, 64-69. [DOI] [PubMed] [Google Scholar]
- 4.Roux, K. (1999) Int. Arch. Allergy Immunol. 120, 85-99. [DOI] [PubMed] [Google Scholar]
- 5.Nezlin, R. (1990) Adv. Immunol. 48, 1-40. [DOI] [PubMed] [Google Scholar]
- 6.Saphire, E. O., Stanfield, R. L., Max Crispin, M. D., Parren, P. W. H. I., Rudd, P. M., Dwek, R. A., Burton, D. R. & Wilson, I. A. (2002) J. Mol. Biol. 319, 9-18. [DOI] [PubMed] [Google Scholar]
- 7.Harris, L. J., Larson, S. B., Skaletsky, E. & McPherson, A. (1998) Immunol. Rev. 163, 35-43. [DOI] [PubMed] [Google Scholar]
- 8.Huber, R., Deisenhofer, J., Colman, P. M. & Matsushima, M. (1976) Nature 264, 415-420. [DOI] [PubMed] [Google Scholar]
- 9.Silverton, E. W., Navia, M. A. & Davies, D. R. (1977) Proc. Natl. Acad. Sci. USA 74, 5140-5144. [DOI] [PMC free article] [PubMed] [Google Scholar]
- 10.Skoglund, U., Andersson, K., Strandberg, B. & Daneholt, B. (1986) Nature 319, 560-564. [DOI] [PubMed] [Google Scholar]
- 11.Sandin, S., Öfverstedt, L.-G., Wikström, A.-C., Wrange, Ö. & Skoglund, U. (2004) Structure (London) 12, 409-415. [DOI] [PubMed] [Google Scholar]
- 12.Gilbert, P. F. C. (1972) Proc. R. Soc. London Ser. B 182, 89-102. [DOI] [PubMed] [Google Scholar]
- 13.Hoppe, W., Gassmann, J., Hunsmann, N., Schramm, H. J. & Sturm, M. (1974) Hoppe-Seyler's Z. Physiol. Chem. 355, 1483-1487. [PubMed] [Google Scholar]
- 14.Skoglund, U. & Daneholt, B. (1986) Trends Biochem. Sci. 11, 499-503. [Google Scholar]
- 15.Frank, J. (1995) Curr. Opin. Struct. Biol. 5, 194-201. [DOI] [PubMed] [Google Scholar]
- 16.Skoglund, U., Öfverstedt, L.-G. & Daneholt, B. (1997) in RNP Particles, Splicing and Autoimmune-Diseases, ed. Schenkel, J. (Springer, Heidelberg), pp. 72-94.
- 17.De Rosier, D. J. & Klug, A. (1968) Nature 217, 130-134. [DOI] [PubMed] [Google Scholar]
- 18.Crowther, R. A., De Rosier, D. J. & Klug, A. (1970) Proc. R. Soc. London Ser. A 317, 319-340. [Google Scholar]
- 19.De Rosier, D. J. & Moore, P. B. (1970) J. Mol. Biol. 52, 355-369. [DOI] [PubMed] [Google Scholar]
- 20.Radermacher, M., Wagenknecht, T., Verschoor, A. & Frank, J. (1987) J. Microsc. (Oxford) 146, 113-136. [DOI] [PubMed] [Google Scholar]
- 21.Radermacher, M. (1988) J. Electron Microsc. Technol. 9, 359-394. [DOI] [PubMed] [Google Scholar]
- 22.Lide, D. R., ed. (1995) CRC Handbook of Chemistry and Physics (CRC Press, Boca Raton, FL), p. F-40.
- 23.Kanno, H., Yokoyama, H. & Yoshimura, Y. (2001) J. Phys. Chem. B. 105, 2019-2026. [Google Scholar]
- 24.Speedy, R. J. (1982) J. Phys. Chem. B 86, 982-991. [Google Scholar]
- 25.Hayashi, Y., Miura, N., Isobe, J., Shinyashiki, N. & Yagihara, S. (2000) Biophys. J. 79, 1023-1029. [DOI] [PMC free article] [PubMed] [Google Scholar]
- 26.Harris, L. J., Larson, S. B., Hasel, K. W. & McPherson, A. (1997) Biochemistry 36, 1581-1597. [DOI] [PubMed] [Google Scholar]
- 27.Saphire, E. O., Parren, P. W. H. I., Pantophlet, R., Zwick, M. B., Morris, G. M., Rudd, P. M., Dwek, R. A., Stanfield, R. L., Burton, D. R. & Wilson, I. A. (2001) Science 293, 1155-1159. [DOI] [PubMed] [Google Scholar]
- 28.Harris, L. J., Skaletski, E. & McPherson, A. (1995) Proteins Struct. Funct. 23, 285-289. [DOI] [PubMed] [Google Scholar]
Associated Data
This section collects any data citations, data availability statements, or supplementary materials included in this article.


