

Abstract
A more complete understanding of the relationship of cell physiology to genomic structure is desirable. Because of the intrinsic complexity of biological organisms, only the simplest cells will allow complete definition of all components and their interactions. The theoretical and experimental construction of a minimal cell has been suggested as a tool to develop such an understanding. Our ultimate goal is to convert a “coarse-grain” lumped parameter computer model of Escherichia coli into a genetically and chemically detailed model of a “minimal cell.” The base E. coli model has been converted into a generalized model of a heterotrophic bacterium. This coarse-grain minimal cell model is functionally complete, with growth rate, composition, division, and changes in cell morphology as natural outputs from dynamic simulations where only the initial composition of the cell and of the medium are specified. A coarse-grain model uses pseudochemical species (or modules) that are aggregates of distinct chemical species that share similar chemistry and metabolic dynamics. This model provides a framework in which these modules can be “delumped” into chemical and genetic descriptions while maintaining connectivity to all other functional elements. Here we demonstrate that a detailed description of nucleotide precursors transport and metabolism is successfully integrated into the whole-cell model. This nucleotide submodel requires fewer (12) genes than other theoretical predictions in minimal cells. The demonstration of modularity suggests the possibility of developing modules in parallel and recombining them into a fully functional chemically and genetically detailed model of a prokaryote cell.
The basic design rules relating the regulation of cellular function to genomic structure is of broad interest. Bioinformatics emerged as an approach to convert static linear sequence genomic data into an understanding of the dynamic nonlinear function of living organisms. Initial efforts have focused on identifying the proteins encoded in the genome and, subsequently, identifying protein function and regulatory elements in the genome. These efforts are able to address specific questions but cannot translate genomic data broadly into an understanding of cell function. We propose a reverse approach. We ask how we would design a cell to achieve expected functions and, from that design, how we would write the genomic instructions. This approach follows the typical engineering design approach where desired performance dictates functional design, which is then translated into blueprints. To accomplish this goal, we are constructing a chemically and genetically minimal cell computer model. By modeling the essential regulatory structure and functions to maintain a living cell, we expect to better understand the relationship of genomic instructions to cell function and regulation.
A “minimal cell” is a hypothetical cell possessing the minimum functions required for sustained growth and reproduction in a maximally supportive culture environment. This organism is considered to live in a rich environment with preformed nutrients and relatively constant temperature and pH.
Recent developments in bioinformatics and comparative genomics have produced several candidate minimal gene sets. Mushegian and Koonin (1) compared the protein sequences of Mycoplasma genitalium (the smallest genome among self-replicating organisms, 580 kbp) and Haemophilus influenzae (1,703 kbp), Gram-positive and -negative bacteria, respectively, identifying 240 orthologous genes. They estimated a minimal genome composed of 262 genes by adding 22 genes to the 240 identified initially to fill missing links in essential pathways. Hutchison et al. (2) compared the sequences of M. genitalium and its closest relative Mycoplasma pneumoniae and used transposons to knock out specific genes identified by bioinformatics analysis as potentially essential; the number of genes needed for survival was estimated to be 265-350. Other observations were: (i) single gene knockout experiments are not definitive, because interacting gene products need multiple gene knockouts to really determine what is essential; (ii) the functions of many genes that appear to be essential are unknown. In 2001, Peterson and Fraser (3) reviewed some of the difficulties in a minimal cell project.
Burgard et al. (4) estimated the minimum required growth-sustaining core of metabolic reactions of Escherichia coli under different culture conditions. They found that the minimal reaction network set depends highly on the nutrient environment and the growth requirements imposed. E. coli grown on a medium containing only glucose requires at least 224 metabolic reactions, whereas the same cell cultured in a rich optimally engineered medium could theoretically support growth with 122 metabolic reactions. As expected, they observed that the required reaction set becomes larger with increasing growth rate.
Recently, Kobayashi et al. (5) estimated 271 genes as the minimal set by systematically inactivating single genes in Bacillus subtilis; 192 indispensable genes were found, and 79 others were predicted from the literature.
Pollack et al. (6) published an extensive review of the metabolic activities of Mycoplasmas, developing a list of the minimum enzymatic functions necessary for independent cellular life. It is important to recognize that the presence of a gene is not evidence that the gene is expressed or necessarily expressible. Important work has also been done on the proteome of M. genitalium (7) determining whether genes are being expressed and to what extent.
Other work has focused on finding essential genes; these results will inform discussion on the minimal gene set. An in silico approach using random mutagenesis with transposons estimated that the Mycobacterium tuberculosis genome contains 35% of essential genes (8). Additionally, the highly compacted genome of Nanoarcheium equitans has been sequenced (9). A more direct approach to identifying essential genes is one with high-density transposon mutagenesis applied to the H. influenzae genome; this study estimated that 38% of the genes are critical for growth (10). Another study tested the deletion of two separate subsets of 53 unknown function genes in E. coli indicating 12 essential genes (11, 12). Judson and Mekalanos (13) describe a vector that allows the identification of essential genes in Gram-negative bacteria by replacing their natural promoter with PBAD (arabinose-inducible promoter). They applied this approach to Vibrio cholerae to characterize 16 genes; genome-wide analysis has not been demonstrated. A combination of antisense technology and regulated expression has been used for identification of essential genes from the human pathogen, Staphylococcus aureus (14). Identification of essential genes in eukaryotes has also been accomplished. Analysis of chromosome V of Saccharomyces cerevisiae by genetic footprinting indicated that ≈20% of the genes examined are essential (16).
Many investigators have made significant contributions to our understanding of bacterial metabolism. Some models are based primarily on stoichiometry, flux balance analysis, and metabolic control theory, (e.g., refs. 4, 17-20). Because these models are intrinsically static, they have limited ability to predict aspects of cell regulation and dynamic response (although by the addition of constraints, such as uptake rates of a nutrient, these models provide some insight into the dynamic state that can be achieved). Others have proposed methodology to incorporate more directly dynamic (kinetic) information into models of central metabolism (e.g., ref. 21). Others have attempted to model whole cells (22, 23), but those models, while attempting to be whole-cell models, neglect important nonmetabolic aspects of cell growth (e.g., control of chromosome replication or spatial issues associated with position of septa in cells). These studies and many others have contributed toward a systems biology perspective. However, so far all of these approaches are “in-complete” descriptions.
Incomplete descriptions may lead to inaccurate conclusions, because there is an implicit assumption in such studies. The assumption is illustrated by considering the metabolic flux analysis of an isolated pathway. As shown by Schlosser and Bailey (24), such analysis is correct only if the output of the pathway cannot influence any input into the pathway. Any cell model that is incomplete assumes that no output of the model either directly or indirectly can influence any input or state within the model. A whole-cell model simulates the dynamics of intracellular processes, predicts cell responses, permits a detailed view of the dynamic changes inside the cell, and provides a more complete test of pathway analyses and metabolic manipulations. A whole-cell model facilitates understanding of the basic principles of cell function.
A minimal cell can be defined with experimental, computational, and theoretical approaches. However, no matter which approach is used to define the problem, there is agreement that one of the most important features of a true minimal genome is that it has the ability to replicate (25). The base model is the Cornell E. coli model (26) that accounts for control of chromosome replication, cell division, cell shape, and volume changes. The prototype version of the Cornell E. coli model was reported in 1979 (27) and modified in 1983 and 1984 (26, 28) to simulate the growth of an individual cell using 18 components. The general structure of the model is sketched in Fig. 1. The model's cell pseudochemical components represent the aggregation of actual chemicals found within the cell. Each component lumps together species with similar chemistry and metabolic dynamics. The model includes: (i) pseudochemical reactions summarizing the stoichiometry relationships, (ii) kinetic relationships reflecting general dependencies of major metabolic pathways, (iii) metabolic control using the concentration of chemical components as signals, and (iv) evaluation of kinetic and stoichiometric parameters from independent experiments on cells growing exponentially in complex media. The Cornell E. coli model has been used to study glucose- (26) and ammonia-limited growth (28) and to simulate a population of cells (29, 30). Further work (31) expanded the model to include the uptake and incorporation of amino acids. More recently, the model was modified with a description of the control of the lac operon that provides the guidelines for general model modifications of transcription and translation mechanisms for future models (32, 33). The potential to use such single-cell models as tools in functional genomics has been discussed (34).
Fig. 1.

A sketch of the mixed minimal cell model, including diagrammatic inclusion of a genetically detailed nucleotide pathway (enclosed arrow in box), growing in a glucose, ammonium, free bases medium with glucose as the limiting nutrient. Solid lines and dashed lines indicate the flow of material and information, respectively. A1, ammonium ion; A2, glucose; P1, amino acids; PG, ppGpp; P2, free bases; P3, deoxyribonucleotides; P4, cell envelope precursors; M1, protein; M2RTI, immature “stable” RNA; M2RTM, mature r-RNA and t-RNA; M3, DNA; M2M, messenger RNA; W, waste products (CO2, H2O, and acetate); M4, nonprotein part of cell envelope; M5, glycogen; E1, enzyme that converts P2 to P3; E2, E3, molecules involved in crosswall formation and cell envelope synthesis. *, the material is present in the external environment (adapted from ref. 26).
In 2001, Browning and Shuler (35) generalized the Cornell E. coli model into a coarse-grain minimal cell model with dimensionless parameters. This model tested the proposition that the ratio of rate constants of a reaction to other rate constants is the key determinant of cellular behavior, not the precise numerical value of the rate constants. This proposition was confirmed for over two orders of magnitude change in the kinetic ratio. Although this model was complete, it was not sufficiently detailed chemically to function as a minimal cell model that could be related directly to genomic structure. We refer to that model as a coarse-grain minimal cell model because of the lumping of chemical species into aggregated pseudochemical components that act as modules inside the coarse-grain model.
We hypothesize that the modular nature of the model will allow us to expand the description of a lumped compartment to identify all stable chemical species and the corresponding genes minimally necessary for a functionally complete cell. A chemically detailed delumped compartment will still maintain interconnections with other modules in a whole-cell model, allowing the detailed module to be embedded in a fully complete cell model. Showing that a modular unit is fully functional within a complete cell model is a critical step toward a totally genomically defined minimal cell model. The process of model building is facilitated if modules can be attacked in parallel and then combined into a fully complete cell model. We tested this hypothesis with simulations of a coarse-grain and partially genomically detailed minimal cell model (or mixed minimal cell model) that takes two of the modules (P2, ribonucleotides and P3, deoxyribonucleotides) and converts them into the minimum set of distinct chemical and genes that support life.
Materials and Methods
The E. coli single-cell model has been fully described (26-28, 31, 36). The coarse-grain minimal cell model (35) consists of nearly 40 nonlinear equations, which compute the interactions, synthesis, and degradation of the model components as well as algebraic expressions monitoring cycle parameters. The structure of the mixed minimal cell model allows predictions of physical quantities such as cell size and shape. In addition, the increased complexity enables the model to respond more realistically to changes in the nutritional environment.
Kinetic Equations. We incorporated into the coarse-grain minimal cell model 28 nonlinear differential equations that describe nucleotide metabolism. The equations were formulated by writing pseudochemical reactions that include the relationship between the nucleotides inside the cell, developing kinetic relationships that reflect the metabolic pathways and including metabolic control using the concentration of the chemical components as signals. These kinetic relationships are typically semiempirical in form and reflect the known factors modulating activity. Tables 2 and 3, which are published as supporting information on the PNAS web site, describe the nomenclature for the symbols representing the macromolecules in nucleotide metabolism and all of the equations currently used in the nucleotide submodel, respectively.
Kinetic Parameters. The 28 nonlinear differential equations include 136 new parameters, as equilibrium rate constants, stoichiometric values, maximum rates, and saturation/inhibition constants. The exact numerical value of the kinetic parameters is not critical to a hypothetical minimal cell; however, these numbers need to be physiologically plausible (to allow the cell to divide for essentially an infinite number of generations). More importantly, they must be in the correct relationship to one another (for details, refer to ref. 35). We require experimental evidence for the existence of the genes to be included in the mixed minimal cell model. M. genitalium is the smallest organism alive, but very few of its enzymes have been characterized kinetically. Enzyme studies are also very limited for other Mycoplasma species. The best-characterized organisms for parameter estimation are E. coli, B. subtilis, Bacillus cereus, and, for some parameters, H. influenzae. The enzyme characterizations for these organisms yielded at least three or more kinetic parameters for orthologous genes in the different species. The parameter values vary significantly from one species to another.
Evaluation of Parameters. Values for the kinetic parameters and sources or justification are given in Table 4, which is published as supporting information on the PNAS web site; 27 of the new parameters were obtained from mass balances and stoichiometry. Most of the maximum rate constants can be determined from basic measurements on appropriate enzymes or by using mass balances to determine the maximum net synthesis rate. Some saturation constants were determined from references to the literature, whereas others are estimated based on a prior heuristic rule (27) as 1/25 of the normal intracellular concentration. The stoichiometries of the identified chemical reactions are used for the stoichiometric coefficients. Parameters were not adjusted to fit experimental data. In some cases, parameters in the literature were reported with several significant figures; in practice, the parameter values were rounded to three significant figures.
Results and Discussion
Transport. The utilization of any exogenous substrate depends on the activity of a membrane transport system that allows entry of the metabolite into the cell (36). A minimal cell would depend on the exogenous supply of many nutrients, because it would be missing most of the biosynthetic pathways that produce precursors of essential macromolecules. The percentage of genes devoted to transport in M. genitalium (10.7%) is not very different from H. influenzae (12.2%). A loss of specificity and broadened substrate selectivity so that a single carrier can transport several metabolites across the cell membrane explain the smaller number of transport systems in Mycoplasmas (37).
The transport mechanism in a mixed minimal cell model can be less specific than those of more evolved bacteria or multispecific (acting on several substrates) to compensate for the loss of specific transporters during genome compaction (37).
The current model already includes the transport of ammonia, glucose, and amino acids. The most important transporter to add to the model is a nucleotide precursor transporter. Experiments show that the incorporation of nucleosides, nucleotides, or free bases occurs in diverse prokaryotic organisms (38-45).
Nucleotide Precursor Transport System. Genomic comparison studies did not find any explicit free base, nucleoside, or nucleotide transporters in M. genitalium. Mushegian and Koonin (1) identified three polyamine transporters. A complete sequence analysis of M. pneumoniae did not identify transport systems for free bases that are essential components of Mycoplasmas growth media (46). One gene, nupG, is responsible for the transport of all nucleosides in E. coli (40), and comparable systems are found in B. cereus, B. subtilis, and H. influenzae. Based on the above observations, we include a single gene product for free base transport in the minimal cell using the following equation:
 |
1 |
In Eq. 1, the first term on the right-hand side, νA3, is for the maximum rate of transport; the second term shows the dependency on the external concentration of free bases CA3*; the third term reflects the saturable inhibition of uptake due to the intracellular free bases pool where P2 is the amount per cell of free bases and V is the cell volume; and the fourth term reflects the saturable dependence on cellular energy. P21T is the ATP level; KA3*, KP2, and KP2/21T are saturation or equilibrium constants.
After incorporation of the free base transporter into the mixed minimal cell model, we have a complete cell model with an explicit linkage to extracellular free bases. (Fig. 6, which is published as supporting information on the PNAS web site, shows the mass of free bases inside the cell. The simulation starts at the initial value and equilibrates after three generations.)
Nucleotide Metabolism. The majority of purines and pyrimidines are present intracellularly as nucleotides. Most of these nucleotides are present in the macromolecules RNA and DNA. Razin and Avigan (47) reported RNA contents ranging from 8 to 17% and DNA from 4 to 7% for eight Mollicute strains. DNA, RNA, and ATP and GTP usage as energy sources generate the greatest net demand for nucleotides. The nutritional source of nucleoside or nucleotide precursors is the medium or host tissues. The minimal requirements for nucleotide precursors for most Mycoplasma species have not been determined.
From the genome sequence of M. genitalium, 21 genes were found in the category of nucleotide transport and metabolism (48). Hutchison's minimal Mycoplasma genome gene set (2) includes 19 genes in this category. Mushegian and Koonin (1) included 23 genes for nucleotide metabolism in their minimal gene set; they also propose a pyrimidine nucleotide biosynthesis pathway. Kobayashi et al. (5) include 10 genes in the nucleotide category; they also point out that, due to single gene inactivation, the number of genes in their minimal gene set is likely to be underestimated. Missing steps to reach end pathway products are found in reviewing their diagrammatic pathways (see ref. 5). The list of essential genes by Kobayashi et al. (5) may not be complete, based on the diagramed pathways, although it is possible that some secondary activities of enzymes found to be essential could fill the “gaps.”
By combining the genes in M. genitalium, the different minimal gene sets proposed in the literature (experimental or theoretical), and the essential macromolecules needed by the cell, we simplified the proposed nucleotide metabolism. Our mixed minimal cell model contains not only the pathways for conversion of precursor molecules into macromolecules, but also how these pathways are regulated. Regulatory effectors and kinetic parameters have been determined for some of nucleotide metabolism enzymes. These studies provide us with some insight into the possible mechanisms for regulation of the nucleotide pools.
Fig. 2 shows the simplified pyrimidine pathway. The minimal cell lacks the capability for de novo synthesis of nucleotides from the simplest precursors but possesses a range of enzyme activities and transport functions to allow the use of free bases.
Fig. 2.
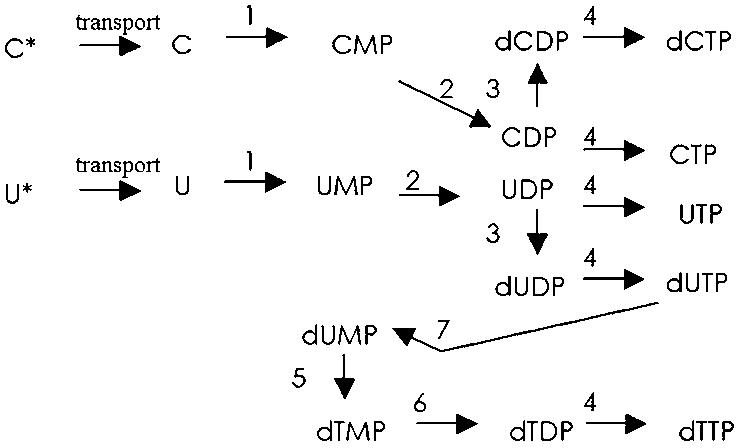
Pyrimidine nucleotide salvage and biosynthesis pathway.
Examination of Mycoplasma species (49) has provided an outline for pathways of purine nucleotide synthesis and salvage pathways. We propose a purine nucleotide metabolism pathway for a minimal cell. This pathway is shown in Fig. 3.
Fig. 3.
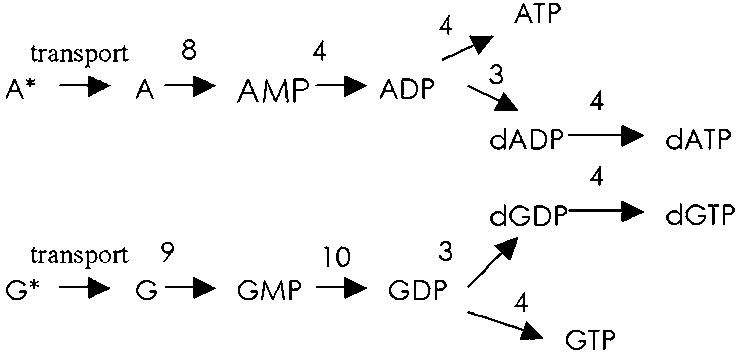
Purine nucleotide salvage and biosynthesis pathway.
One of the enzymes in the nucleotide metabolism, ribonucleotide reductase that transforms ribonucleotides to deoxyribonucleotides, is already in the Cornell E. coli model (E1 in Fig. 1).
Adenylate Kinase As Nucleoside Diphosphate Kinase (NDK). NDK is a ubiquitous enzyme that catalyzes the ATP-dependent synthesis of ribo- and deoxyribo-nucleoside triphosphates via a phosphoenzyme intermediate. The structures of NDKs are highly conserved from E. coli to human (43% identity; ref. 50). This enzyme is believed to be essential for DNA and RNA synthesis. Studies from the Gram-negative bacterium, Myxococcus xanthus have suggested that the enzyme may be essential for cell growth (51). However, an ndk gene disruption in E. coli did not affect cell viability except for a mutator phenotype (52). Furthermore, M. genitalium does not encode a homolog of this enzyme; Mushegian and Koonin (1) detected a novel ndk (MG268) among genes of unknown function. However, disruption of this gene in Hutchison's knockout experiments did not lead to cell death (2). In another study, Lu and Inouye found a complementing activity for the synthesis of nucleotides triphosphates (53). Assays for NDK activity in proteins in ndk-disrupted cells showed adenylate kinase was the complementing enzyme. Additionally, adenylate kinase is the only enzyme possessing complementary NDK activity among all of the nucleoside diphosphate kinases tested (53-55).
The experimental evidence allows us to include adenylate kinase as the gene that catalyzes reactions labeled 4 in Figs. 2 and 3.
Published literature from different bacteria (E. coli, B. subtilis, H. influenzae, and Mycoplasma species) and proposed minimal gene sets were carefully analyzed to produce the enzyme list (Table 1). This analysis provided a complete set of nucleotide pathways with steps that contain: precursor, first product, second product, and so forth, until the desired end product. The following section describes important characteristics of the enzymes to develop the kinetic models. We describe enzyme characteristics and then refer to the equation terms (right-hand side) that model the behavior of the enzyme. Table 3 contains all equations.
Table 1. Nucleotide metabolism enzymes.
| Enzyme | Mycoplasma identification and gene name | |
|---|---|---|
| 1 | Uracil phosporibosyltransferase | MG 030 upp |
| 2 | Cytidylate kinase | MG 330 cmk |
| 3 | Ribonucleotide reductase | MG 229 nrdf and MG 231 nrde |
| 4 | Adenylate kinase | MG 171 adk |
| 5 | Thymidylate synthase | MG 227 thya |
| 6 | Thymidylate kinase | MG 006 tmk |
| 7 | Deoxyuridine triphosphatase | MG 125 dut |
| 8 | Adenine phosphoribosyltransferase | MG 276 apt |
| 9 | Guanine phosphoribosyltransferase | MG 458 hpt |
| 10 | Guanylate kinase | MG 107 gmk |
Pyrimidine Metabolic Enzymes. Uracil phosphoribosyltransferase catalyzes the phosphorylation of uracil or cytidine (step 1 in Fig. 2). Binding assays show that the free enzyme has high affinity for UMP, and inhibition measurements show UMP acts as a competitive inhibitor (Table 3, second term, Eq. 8) (56, 57).
Cytidylate kinase (CK) catalyzes the phosphorylation of CMP to CDP (step 2 in Fig. 2), as well as UMP to UDP. Substrate specificity studies showed ATP as the preferred phosphate donor (Table 3, fourth term, Eq. 3). High concentrations of nucleotides inhibit CK. The most potent inhibitors are CMP, ADP, and CDP (Table 3, Eq. 3, fifth, sixth, and first terms, respectively). This enzyme is also endowed with a residual UMP kinase activity, phosphorylating UMP to UDP (58) (Table 3, Eq. 10). Although in E. coli a second enzyme, uridylate kinase, is primarily responsible for the phosphorylation of UMP, in B. subtilis, the two activities completely reside in only one protein (59). The residual UMP kinase activity for the E. coli CK protein and dual activity of the enzyme in B. subtilis and a number of other organisms (60-62) allow us to suggest a sole enzyme to perform reaction 2 in Fig. 2 in the model.
Ribonucleotide reductase (RR) catalyzes the production of deoxyribonucleotides in all living organisms (step 3 in Figs. 2 and 3). RR is a tightly regulated enzyme, because low concentrations of dNTPs are lethal to the cell, whereas high concentrations are mutagenic. A specific feature of ribonucleotide reduction is that a single protein reduces all four common ribonucleotides (63). The concentration of each dNTP is accounted for in the equations in the model describing substrate specificity. We include the substrate effect of the NTPs in Table 3, fifth and sixth terms; Eq. 4; fifth, sixth, and seventh terms, Eq. 9; fifth and sixth terms, Eq. 19; and fifth and sixth terms, Eq. 28.
Thymidylate synthase catalyzes the reduction of dUMP to yield dTMP (step 5 in Fig. 2). A presumptively disruptive hit in M. pneumoniae knockout experiments (2) showed this gene is nonessential, but as the authors point out, there are several possibilities why this might not be true: cells contain a functional duplicate gene, function supplied by other compounds from the medium, or crossfeeding. Additionally, an E. coli thymidylate synthase mutant, strain χ2913, requires thymidine supplements, because the deleted gene is essential for survival (64).
Thymidylate kinase (TK) belongs to a large super family of nucleoside monophosphate kinases. TK catalyzes the phosphorylation of thymidine monophosphate (step 6 in Fig. 2) using ATP as its preferred phosphoribosyl donor (Table 3, fourth term, Eq. 15). The adjusted pool of dTTP partly regulates the overall control of DNA synthesis, making the expression and regulation of thymidylate kinase crucial (Table 3, fifth term, Eq. 15).
Deoxyuridine triphosphatase catalyzes the hydrolysis of dUTP to dUMP and pyrophosphate (step 7, Fig. 2), which is an important feature to prevent uracil incorporation into DNA. This gene is essential for the viability of E. coli (65) and S. cerevisiae (66). dUMP is a weak competitive inhibitor (Table 3, second term, Eq. 12), and dUDP shows competitive inhibition (Table 3, fifth term, Eq. 12) (67).
Purine Metabolic Enzymes. Adenine phosphoribosyltransferase catalyzes the production of AMP (step 8, Fig. 3). This enzyme shows strong feedback inhibition by AMP, ADP, and ATP (Table 3, second, fifth, and sixth terms, respectively, Eq. 18) and particularly guanine nucleotides (49).
Guanine phosphoribosyltransferase, phosphor ylates guanosine to GMP (step 9, Fig. 3). This enzyme shows tight feedback inhibition by GTP (Table 3, fifth term, Eq. 24), to prevent excessive salvage of guanosine from the external environment (68).
Adenylate kinase belongs to a family of small monomeric enzymes catalyzing the phosphoribosyl transfer reaction of AMP to ADP (step 4, Figs. 2 and 3). AMP is a strong inhibitor of the enzyme (69), although the mechanisms of inhibition are not known (70). As a NDK, adenylate kinase can use only ATP but not GTP as phosphate donor (Table 3, fourth term, Eqs. 5, 6, 11, 13, 16, 21, 22, 27, and 28). AMP is a potent inhibitor of the NDK function (Table 3, fifth term in equations mentioned above).
Guanylate kinase (GK) catalyzes the reversible phosphoryl transfer from ATP to GMP(step 10, Fig. 3). Characterization of this enzyme has been impaired due to its low abundance (71). The yeast GK kinetic data follow Michaelis-Menten kinetics, with GMP partially inhibiting the enzyme (Table 3, second term, Eq. 25) (72).
Model Response to Integration of Detailed Pyrimidine/Purine Pathways. There are no direct experimental data with which to test the mixed minimal cell model. Therefore, we compared available data for several bacterial organisms over a range of growth rates for glucose limited growth to determine whether the overall response is physiologic in nature. This exercise is an examination of the verisimilitude of the mechanisms imbedded in the model. In Fig. 4, the model's predictions of cell size are compared to chemostat data, using transmission electron microscopy and gluteraldehyde fixed cells and measurements with a Coulter Counter. The model's predictions are in close agreement with the trends in terms of the shape and size from the observed data.
Fig. 4.
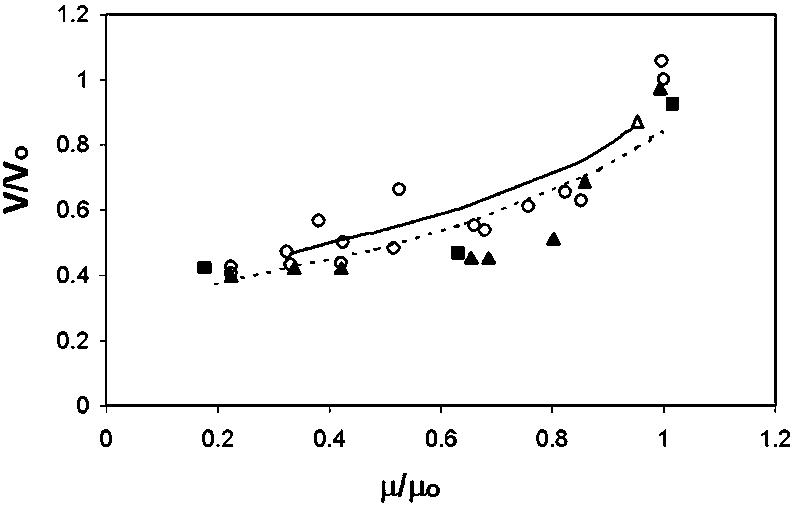
Relative cell volume (absolute cell volume/maximum cell volume) as a function of relative growth rate (absolute growth rate/maximum growth rate) for E. coli. Open circles, closed squares, open triangles, closed triangles, continuous line, and dashed line represent measurements from the Coulter Counter [(26); refs. 15 and 78]; volumes calculated from electron microscopy measurements of cell dimension with gluteraldehyde-fixed cells, the Cornell E. coli model; mixed minimal cell model, respectively.
Fig. 5 shows the model's prediction of percent RNA and data from E. coli (73), Kleibsiella aerogenes (74), Acinetobacter calcoaceticus (75), Aerobacter aerogenes (76), and Bacillus megaterium (76). The model predicts a trend similar to the experimental data, although the decrease in RNA with growth rate is less severe in the mixed minimal cell model than in the experimental measurements.
Fig. 5.
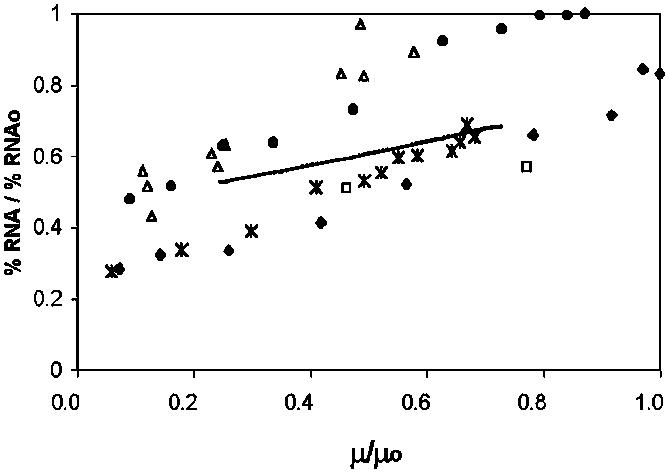
Relative RNA composition (absolute % RNA/maximum % RNA) of a variety of bacteria at different relative growth rates. Open squares, open triangles, full circles, asterisks, full diamonds, and continuous line represent E. coli (73); K. aerogenes (74); A. calcoaceticus (75); A. aerogenes (76); Bacillus megaterium (76), and mixed minimal cell model, respectively.
The model's design allows the user to obtain the amount of any of the components at any point in time of the cell cycle or cell generation. A clear example is shown in Fig. 7, which is published as supporting information on the PNAS web site. Simulations for Figs. 5, 6, 7 were run with total equal extracellular concentration of free bases in the environment of 1×10⁻³ g/ml.
Conclusion
While maintaining “connectivity,” we have described a mixed model (coarse grain-partial genomically detailed) allowing the prediction of interactions between the environment and the cellular physiological state with molecular level changes. Additionally, the results suggest that the problem of constructing a complete genetically and chemically detailed model using parallel delumping of modules is feasible because we have shown that we can evaluate the minimal cell responses from both the coarse-grain minimal cell model and mixed minimal cell model independent of each other.
In our mixed minimal cell model approach, we defined our pathways with essential functions and have found examples of specific genes that can accomplish these functions. We have constructed a pathway with 11 functions (12 genes), including secondary activity that permits growth from preformed nucleotides precursors and has complete nucleotide pathways. An example of secondary activity is the ensemble of functions that are performed by adenylate kinase for several steps in both pyrimidine and purine metabolism. It is certainly possible that a smaller set of genes might be found, but we believe that the set of functions is minimal.
This observation reminds us of one of the important challenges for comparative genomics: nonorthologous gene displacements (same function being performed by unrelated or very distantly related nonorthologous proteins). After a cross-kingdom comparison of 21 bacterial, 4 archea, and 1 eukaryote genome, only 80 genes (instead of 256) are universally present. Koonin (77) wrote: “It seems that a more general and hence more robust idea is a minimal set of functional niches, most of which can be filled by proteins that belong to two or more distinct families of orthologs. A conserved core of functions with a single, ubiquitous solution certainly exists.” We believe that the minimal cell model could reveal this last solution.
Our work shows that the modular nature of this model allows one to expand the description of a lumped compartment while still maintaining the interconnections and dynamic features with all other components in the whole-cell model. The ribonucleotide and deoxyribonucleotide modules contain the minimum number of essential functions and use fewer genes than previously proposed for other minimal gene sets that have verifiable complete nucleotide pathways.
Supplementary Material
Acknowledgments
We thank Kelvin Lee, Sam Browning, and Anjali Dhiman for helpful discussions. This work was supported in part by National Science Foundation Grant BES9909133 and the New York State Office of Science Technology and Academic Research.
Abbreviation: NDK, nucleoside diphosphate kinase.
References
- 1.Mushegian, A. & Koonin, E. (1996) Proc. Natl. Acad. Sci. USA 93 10268-10273. [DOI] [PMC free article] [PubMed] [Google Scholar]
- 2.Hutchison, C., Peterson, S., Gill, S., Cline, R., White, O., Fraser, C., Smith, H. & Venter, J. (1999) Science 286 2165-2169. [DOI] [PubMed] [Google Scholar]
- 3.Peterson, S. & Fraser, C. (2001) Genome Biol 2 1-8. [Google Scholar]
- 4.Burgard, A., Vaidyaraman, S. & Maranas, C. (2001) Biotechnol. Prog. 17 791-797. [DOI] [PubMed] [Google Scholar]
- 5.Kobayashi, K., Ehrlich, S., Albertini, A., Amati, G., Andersen, K., Arnaud, M., Asai, K., Ashikaga, S., Aymerich, S., Bessieres, P., et al. (2003) Proc. Natl. Acad. Sci. USA 100 4678-4683. [DOI] [PMC free article] [PubMed] [Google Scholar]
- 6.Pollack, J., Williams, M. & McElhaney, R. (1997) Crit. Rev. Microbiol. 23 269-354. [DOI] [PubMed] [Google Scholar]
- 7.Wasinger, V. (2000) Eur. J. Biochem. 267 1571-1582. [DOI] [PubMed] [Google Scholar]
- 8.Lamichhane, G., Zignol, M., Blades, N., Geiman, D., Dougherty, A., Grosset, J., Broman, K. & Bishai, W. (2003) Proc. Natl. Acad. Sci. USA 100 7213-7218. [DOI] [PMC free article] [PubMed] [Google Scholar]
- 9.Waters, E., Hohn, M., Ahel, I., Graham, D., Adams M., Barnstead, M., Beeson, K., Bibbs, L., Bolanos, R., Keller, et al. (2003) Proc. Natl. Acad. Sci. USA 100 12984-12988. [DOI] [PMC free article] [PubMed] [Google Scholar]
- 10.Akerley, B., Rubin, E., Novick, V., Amaya, K., Judson, N. & Mekalanos, J. (2002) Proc. Natl. Acad. Sci. USA 99 966-971. [DOI] [PMC free article] [PubMed] [Google Scholar]
- 11.Arigoni, F., Talabot, F., Peitsch, M., Edgerton, M., Meldrum, E., Allet, E., Fish, R., Jamotte, T., Curchod, M. & Loferer, H. (1998) Nat. Biotechnol. 16 851-856. [DOI] [PubMed] [Google Scholar]
- 12.Freiberg, C., Wieland, B., Spaltmann, F., Ehlert, K., Brotz, H. & Labischinski, H. (2001) J. Mol. Microbiol. Biotechnol. 3 483-489. [PubMed] [Google Scholar]
- 13.Judson, N. & Mekalanos, J. (2000) Nat. Biotechnol. 18 740-745. [DOI] [PubMed] [Google Scholar]
- 14.Ji, Y., Zhang, B., VanHorn, S., Warren, P., Woodnutt, G., Burnham, M. & Rosenberg, M. (2001) Science 293 2266-2269. [DOI] [PubMed] [Google Scholar]
- 15.Churchward, G., Estiva, E. & Bremer, H. (1981) J. Bacteriol. 145 1232-1238. [DOI] [PMC free article] [PubMed] [Google Scholar]
- 16.Smith, V., Chou, K., Lashkari, D., Botstein, D. & Brown, P. (1996) Science 274 2069-2074, and [DOI] [PubMed] [Google Scholar]; correction (1997) 275 464.
- 17.Burgard, A. & Maranas, C. (2001) Biotechnol. Bioeng. 74 364-375. [DOI] [PubMed] [Google Scholar]
- 18.Edwards, J., Covert, M. & Palsson, B. (2002) Environ. Microbiol. 4 133-140. [DOI] [PubMed] [Google Scholar]
- 19.Edwards, J. & Palsson, B. (2000) Proc. Natl. Acad. Sci. USA 97 5528-5533. [DOI] [PMC free article] [PubMed] [Google Scholar]
- 20.Karp, P., Riley, M., Paley, S., Pellegrini, A. & Krummenacker, M. (1998) Nucleic Acids Res. 26 50-53. [DOI] [PMC free article] [PubMed] [Google Scholar]
- 21.Chassagnole, C., Noisommit, N., Schmid, J., Mauch, K. & Reuss, M. (2002) Biotechnol. Bioeng. 79 53-73. [DOI] [PubMed] [Google Scholar]
- 22.Tomita, M. (2001) Trends Biotechnol. 19 205-210. [DOI] [PubMed] [Google Scholar]
- 23.Tomita, M., Hashimoto, K., Takahashi, K., Shimizu, T., Matsuzaki, Y., Miyoshi, F., Saito, K., Tanida, S., Yugi, K., Venter, J. & Hutchison, C. (1999) Bioinformatics 15 72-84. [DOI] [PubMed] [Google Scholar]
- 24.Schlosser, P. & Bailey, J. (1990) Math. Biosci. 100 87-114. [DOI] [PubMed] [Google Scholar]
- 25.Wegrzyn, G. (2001) J. Appl. Genet. 3 385-392. [PubMed] [Google Scholar]
- 26.Domach, M., Leung, S., Cahn, R., Cocks, G. & Shuler, M. (1984) Biotechnol. Bioeng. 26 203-216; [DOI] [PubMed] [Google Scholar]; reprinted (2000) Biotechnol. Bioeng. 67 827-840. [DOI] [PubMed] [Google Scholar]
- 27.Shuler, M., Leung, S. & Dick C. (1979) Ann. N.Y. Acad. Sci. 326 35-56. [Google Scholar]
- 28.Shuler, M. & Domach, M. (1983) ACS Symp. Series 207 93-133. [Google Scholar]
- 29.Kim, B. & Shuler, M. (1990) Biotechnol. Bioeng. 36 581-592. [DOI] [PubMed] [Google Scholar]
- 30.Domach, M. & Shuler, M. (1984) Biotechnol. Bioeng. 26 877-884. [DOI] [PubMed] [Google Scholar]
- 31.Shu, J. & Shuler, M. (1991) Biotechnol. Bioeng. 37 708-715. [DOI] [PubMed] [Google Scholar]
- 32.Laffend, L. & Shuler, M. (1994) Biotechnol. Bioeng. 43 388-398. [DOI] [PubMed] [Google Scholar]
- 33.Laffend, L. & Shuler, M. (1994) Biotechnol. Bioeng. 43 399-410. [DOI] [PubMed] [Google Scholar]
- 34.Shuler, M. (1999) J. Biotechnol. 71 225-228. [DOI] [PubMed] [Google Scholar]
- 35.Browning, S. & Shuler, M. (2001) Biotechnol. Bioeng. 76 187-192. [DOI] [PubMed] [Google Scholar]
- 36.Ataai, M. & Shuler, M. (1986) Plasmid 16 204-212. [DOI] [PubMed] [Google Scholar]
- 37.Saurin, W. & Dassa, E. (1996) Mol. Microbiol. 22 389-390. [PubMed] [Google Scholar]
- 38.Pandley, N. (1984) FEMS Microbiol. Lett. 21 11-14. [Google Scholar]
- 39.McIvor, R. & Kenny, G. (1978) J. Bacteriol. 135 483-489. [DOI] [PMC free article] [PubMed] [Google Scholar]
- 40.MunchPetersen, A. & Jensen, N. (1990) Eur. J. Biochem. 190 547-551. [DOI] [PubMed] [Google Scholar]
- 41.MunchPetersen, A., Mygind, B., Nicolaisen, A. & Pihl, N. (1979) J. Biol. Chem. 254 3730-3737. [PubMed] [Google Scholar]
- 42.Bremer, E. (1988) J. Biol. Chem. 263 2493-2499. [PubMed] [Google Scholar]
- 43.Hafida, B. & Bremer, E. (1993) J. Biol. Chem. 268 17945-17503. [Google Scholar]
- 44.Youil, R. & Finch, L. (1988) J. Bacteriol. 170 5922-5924. [DOI] [PMC free article] [PubMed] [Google Scholar]
- 45.Fleischmann, R., Adams, M., White, O., Clayton, R., Kirkness, E., Kerlavage, A., Bult, C., Tomb, J., Dougherty, B. & Merrick, J. (1995) Science 269 496-512. [DOI] [PubMed] [Google Scholar]
- 46.Himmelreich, R., Hilbert, H., Plagens, H., Pirkl, E., Li, B. & Herrmann, R. (1996) Nucleic Acids Res. 24 4420-4449. [DOI] [PMC free article] [PubMed] [Google Scholar]
- 47.Razin, S. & Avigan, J. (1963) J. Gen. Microbiol. 33 477-487. [DOI] [PubMed] [Google Scholar]
- 48.Fraser, C., Gocayne, J., White, O., Adams, M., Clayton, R., Fleischmann, R., Bult, C., Kerlavage, A., Sutton, G. & Kelley, J. (1995) Science 270 397-403. [DOI] [PubMed] [Google Scholar]
- 49.Finch, L. & Mitchell, A. (1990) Zbl. Suppl. 20 172-180. [Google Scholar]
- 50.Almaula, N., Lu, Q., Delgado, J., Belkin, S. & Inouye, M. (1995) J. Bacteriol. 177 2524-2529. [DOI] [PMC free article] [PubMed] [Google Scholar]
- 51.Munozdorado, J., Almaula, N., Inouye, S. & Inouye, M. (1993) J. Bacteriol. 175 1176-1181. [DOI] [PMC free article] [PubMed] [Google Scholar]
- 52.Lu, Q., Zhang, X., Almaula, N., Mathews, C. & Inouye, M. (1995) J. Mol. Biol. 254 337-341. [DOI] [PubMed] [Google Scholar]
- 53.Lu, Q. & Inouye, M. (1996) Proc. Natl. Acad. Sci. USA 93 5720-5725. [DOI] [PMC free article] [PubMed] [Google Scholar]
- 54.Gentry, D., Bengra, C., Ikehara, K. & Cashel, M. (1993) J. Biol. Chem. 268 14316-14321. [PubMed] [Google Scholar]
- 55.Jong, A. & Campbell, J. (1984) J. Biol. Chem. 259 14394-14398. [PubMed] [Google Scholar]
- 56.Tu, A. & Turnbough, C. (1997) J. Bacteriol. 179 6665-6673. [DOI] [PMC free article] [PubMed] [Google Scholar]
- 57.Lundegaard, C. & Jensen, K. (1999) Biochemistry 38 3327-3334. [DOI] [PubMed] [Google Scholar]
- 58.Bucurenci, N., Sakamoto, H., Briozzo, P., Palibroda, N., Serina, L., Sarfati, R., Labesse, G., Briand, G., Danchin, A., Barzu, O., et al. (1996) J. Biol. Chem. 271 2856-2862. [DOI] [PubMed] [Google Scholar]
- 59.Schultz, C., Ylisastigui, L., Serina, L., Sakamoto, H., Mantsch, H., Neuhard, J., Barzu, O. & Gilles, A. (1997) Arch. Biochem. Biophys. 340 144-153. [DOI] [PubMed] [Google Scholar]
- 60.Liljelund, P., Sanni, A., Friesen, J. & Lacroute, F. (1989) Biochem. Biophys. Res. Commun. 165 464-473. [DOI] [PubMed] [Google Scholar]
- 61.Wiesmuller, L., Noegel, A., Barzu, O., Gerisch, G. & Schleicher, M. (1990) J. Biol. Chem. 265 6339-6345. [PubMed] [Google Scholar]
- 62.Okajima, T., Goto, S., Tanizawa, K., Tagaya, M., Fukui, T., Shimofuruya, H. & Suzuki, J. (1995) J. Biochem. 117 980-986. [DOI] [PubMed] [Google Scholar]
- 63.Reichard, P. (2002) Arch. Biochem. Biophys. 397 149-155. [DOI] [PubMed] [Google Scholar]
- 64.Erlanson, D., Braisted, A., Raphael, D., Randal, M., Stroud, R., Gordon, E. & Wells, J. (2000) Proc. Natl. Acad. Sci. USA 97 9367-9372. [DOI] [PMC free article] [PubMed] [Google Scholar]
- 65.Elhajj, H., Zhang, H. & Weiss, B. (1988) J. Bacteriol. 170 1069-1075. [DOI] [PMC free article] [PubMed] [Google Scholar]
- 66.Gadsden, M., McIntosh, E., Game, J., Wilson, P. & Haynes, R. (1993) EMBO J. 12 4425-4431. [DOI] [PMC free article] [PubMed] [Google Scholar]
- 67.Larsson, G., Nyman, P. & Kvassman, J. (1996) J. Biol. Chem. 271 24010-24016. [DOI] [PubMed] [Google Scholar]
- 68.Petersen, C. (1999) J. Biol. Chem. 274 5348-5356. [DOI] [PubMed] [Google Scholar]
- 69.Sheng, X., Li, X. & Pan, X. (1999) J. Biol. Chem. 274 22238-22242. [DOI] [PubMed] [Google Scholar]
- 70.Sinev, M., Sineva, E., Ittah, V. & Haas, E. (1996) FEBS Lett. 397 273-276. [DOI] [PubMed] [Google Scholar]
- 71.Li, Y., Zhang, Y. & Yan, H. (1996) J. Biol. Chem. 271 28038-28044. [DOI] [PubMed] [Google Scholar]
- 72.Lecoq, K., Konrad, M. & Daignan, B. (2000) Genetics 156 953-961. [DOI] [PMC free article] [PubMed] [Google Scholar]
- 73.Bremer, H. & Dennis, P. (1996) in Escherichia coli and Salmonella: Cellular and Molecular Biology, ed. Neidhardt, F. (Am. Soc. Microbiol., Washington, DC), pp. 1553-1569.
- 74.Mulder, M., Vandergulden, H., Postma, P. & Vandam, K. (1988) Biochim. Biophys. Acta 936 406-412. [DOI] [PubMed] [Google Scholar]
- 75.Dupreez, J., Lategan, P. & Toerien, D. (1984) FEMS Microbiol. Lett. 23 71-75. [Google Scholar]
- 76.Herbert, D. (1958) in Recent Progress in Microbiology, ed. Tunevall, G. (Almquist and Wilsell, Stockholm), pp. 381-396.
- 77.Koonin, E. (2000) Annu. Rev. Genom. Hum. Genet. 1 99-116. [DOI] [PMC free article] [PubMed] [Google Scholar]
- 78.Helmstet, C. (1974) J. Mol. Biol. 84 21-36.4598366 [Google Scholar]
Associated Data
This section collects any data citations, data availability statements, or supplementary materials included in this article.