

Abstract
Previously we have shown that thioamides can be incorporated into proteins as minimally perturbing fluorescence- quenching probes to study protein dynamics, folding, and aggregation. Here, we show that the spontaneity of photoinduced electron transfer between a thioamide and an excited fluorophore is governed by the redox potentials of each moiety according to a Rehm-Weller-type model. We have used this model to predict thioamide quenching of various common fluorophores, and we rigorously tested more than a dozen examples. In each case, we found excellent agreement between our theoretical predictions and experimental observations. In this way, we have been able to expand the scope of fluorophores quenched by thioamides to include dyes suitable for microscopy and single molecule studies, including fluorescein, Alexa Fluor 488, BODIPY FL, and rhodamine 6G. We describe the photochemistry of these systems and explore applications that demonstrate the utility of thioamide quenching of fluorescein to studying protein folding and proteolysis.
Fluorescence quenching experiments can provide valuable information about protein associations, structure, and dynamics.1–3 These studies often require site-specific incorporation of two spectroscopic labels into the protein of interest.4,5 Following photoexcitation, energy transfer from one label to the other leads to a change in fluorescence, which is interpreted to extract information about the distance between the probes. Structural information inferred from these distance measurements can be used to generate dynamic models of protein motion or to analyze biological processes.6,7 Unfortunately, common chromophores tend to be bulky and can disrupt the protein structure if they are arbitrarily introduced into the protein. Smaller reporter pairs that circumvent this problem so that they could be incorporated at almost any position increase the utility of this approach.
Here, we show that a thioamide, which can be prepared as a single-atom substitution in a peptide bond, can be used to develop such a minimalist probe pair by partnering it with one of a variety of fluorophores. This technique is applied in a proof-of-principle experiment as a demonstration of its utility in studying protease activity and monitoring protein folding. We describe mechanistic studies indicating that quenching arises from photoinduced electron transfer and discuss considerations that should be made for selecting an appropriate fluorophore. Additionally, the model we present should allow investigators to design novel probe pairs using our system by determining whether particular dyes will be quenched by thioamides a priori.
Non-radiative energy transfer can occur through a number of processes that lead to fluorescence quenching. Common mechanisms include Förster resonance energy transfer (FRET), Dexter electron exchange, exciplex formation, and photoinduced electron transfer (PET).8–12 Unlike FRET and Dexter transfer, which require spectral overlap between the donor and acceptor, PET is governed by redox chemistry and is not inherently restricted to any spectral window.13 Many PET quenching probes have been identified that operate only over very short distances — e.g., in van der Waals contact with an excited fluorophore — and they have found wide utility in both single-molecule and ensemble studies of nucleic acids or proteins. 14–16 In particular, tryptophan (Trp) and guanine have been employed in these applications since they are easily incorporated and are efficient PET quenchers of several fluorophores, including some borondipyrromethene (BODIPY), coumarin, oxazine, and xanthene dyes.17–19 Unfortunately, the general applicability of this technique is somewhat limited by the relatively large size of the quenchers; Trp mutants would be destabilizing at many positions in a protein.
In this respect, thioamide probes (such as 1) are attractive alternatives to conventional PET quenchers. Electrochemically, thioamides (Eox = 0.97 V vs. SCE) are similar to Trp20 (0.81 V), but substantially different from naturally- occurring oxoamides (3.04 V).21 Many small-molecule fluorescent sensors exploit this difference in oxidation potentials. These sensors often consist of a fluorophore tethered to a thioamide quencher and respond to analyte-induced desulfurization to give an oxoamide with a concomitant gain of fluorescence.22,23 In a protein context, thioamide bonds are nearly isosteric analogs of amide bonds24 and, using semi-synthesis techniques, we have recently shown that they can be inserted at almost any position in a sequence with minimal perturbation to native structure.25,26 Ultimately, we envision applications in which a fluorophore could be incorporated at a few positions in a protein where it is well-tolerated, and the thio- amide bond could be scanned through the backbone to obtain many measurements.
Previously, we have shown that thioamides quench the fluorescence of several aromatic amino acids including p-cyanophenylalanine, tyrosine, tryptophan, 7-azatryptophan, 7-methoxycoumarin-4-yl alanine, and acridon-2-yl alanine through FRET or PET mechanisms. 25,27 The small size of these fluorophores and the relative ease with which they can be genetically incorporated into a protein make them useful tools for a number of applications in studying protein folding or protein-protein interactions. However, the photophysical properties of these probes, particularly their high energy (i.e., short wavelength) excitation energies and low extinction coefficients, prevent them from being used to study protein dynamics in vivo or in single molecule studies. Here, we report our findings that thioamides quench many fluorophores that are extremely bright and are excited with visible light, including rhodamine 6G (9), BODIPY FL (10), 5-carboxyfluorescein (Fam, 12), and Alexa Fluor 488 (14). We have performed thorough photophysical characterization of Fam, including evaluation of the impact of various common linkers (15 – 17) used for attachment to proteins and the importance of direct contact with the thioamide for quenching. Finally, we include demonstrations of the application of Fam quenching to monitoring proteolysis with a model trypsin substrate and to tracking the conformation of α-synuclein (αS), a protein whose misfolding is implicated in the pathogenesis of Parkinson’s disease.
Results and Discussion
Photoinduced Electron Transfer
The Gibbs free energy of electron transfer (ΔGET) from some donor molecule (D) to some acceptor molecule (A) is determined as follows in Rehm-Weller models of electron transfer28
| (1) |
where F is the Faraday constant; Eox(D) and Ered (A) are the oxidation and reduction potentials of the electron donor and acceptor molecules, respectively; E0,0 is the zero vibrational electronic excitation energy of the fluorophore, calculated as the average energy of the absorption and emission wavelengths of the fluorescent transition; and C is a term accounting for Coulombic interactions, which are typically assumed to be negligible in water. The fluorophore can serve as either electron donor or acceptor, depending on the choice of quencher. In both cases, the spontaneity of electron transfer (the sign of ΔGET) can be used to predict whether quenching will occur.
We began our investigation by examining the predictive power of this model. Thioacetamide was taken to be a representative thioamide donor (Eox = 0.97 V vs. SCE21) and a variety of common fluorophores (Fig. 1) were chosen as acceptors. Using Equation (1), we estimated ΔGET values that spanned −0.86 to +0.3 eV (Table 1). We expected thioamides to quench only those fluorophores for which the sign of ΔGET is negative. To test these predictions, we recorded the steady-state fluorescence of each fluorophore in three solutions at pH 7.00: 100 mM sodium phosphate (buffer), 50 mM acetamide in buffer, and 50 mM thioacetamide in buffer. By comparing the fluorescence intensities of the buffer and thioacetamide solutions, we determined the quenching efficiencies reported in Table 1 as EQ(SS). Since fluorescence quenching was observed in thioacetamide solutions and not in acetamide solutions, we attribute quenching solely to the thioamide moiety. There was excellent agreement between our theoretical predictions and experimental results.
Figure 1.

Chromophore Structures. The chemical structures of a thioamide (e.g., thioalanine, Ala′) and fluorophores investigated in this study.
Table 1.
Thioamide Quenching of Selected Dyes and Their Photophysical and Electrochemical Properties.
| Fluorophore | λex/λem [nm] | Ered a [V/SCE] | E0,0b [eV] | ΔGETc [eV] | EQ(SS)d[%] | τe [ns] | EQ(τ)f [%] | Volumeg [Å3] | Ref. |
|---|---|---|---|---|---|---|---|---|---|
| Coumarin102 (4) | 393/487 | −2.18 | 2.85 | 0.30 | 0 | 5.79 | 0 | 264 | 29 |
| NBDg (2) | 467/538 | −0.94 | 2.47 | −0.56 | 27 ± 1 | 1.08 | 19 ± 1 | 137 | 30 |
| Alexa Fluor 488 (14) | 488/518 | −0.635 | 2.46 | −0.86 | 47 ± 1 | 4.03 | 42 ± 1 | 424 | 31 |
| 5-carboxyfluorescein (12) | 492/518 | −0.71 | 2.46 | −0.78 | 44 ± 1 | 4.04 | 40 ± 1 | 346 | 32 |
| Fluorescein isothiocyanate (16) | 492/517 | 41 ± 1 | 3.48 | 36 ± 2 | |||||
| Fluorescein maleimide (17) | 492/516 | 44 ± 1 | 3.66 | 37 ± 2 | |||||
| Fluorescein click (15) | 494/521 | 44 ± 1 | 3.95 | 39 ± 1 | |||||
| BODIPY FL (10) | 502/510 | −1.07 | 2.43 | −0.39 | 61 ± 4 | 6.13 | 55 ± 1 | 258 | 32 |
| Acridine Orange (3) | 502/525 | −1.4 | 2.40 | −0.03 | 3 ± 1 | 1.83 | 8 ± 1 | 305 | 33 |
| Rhodamine R6G (13) | 526/556 | −0.95 | 2.28 | −0.36 | 16 ± 1 | 3.99 | 20 ± 1 | 460 | 34 |
| BODIPY R6G (9) | 528/547 | −0.97 | 2.31 | −0.37 | 45 ± 1 | 5.28 | 46 ± 1 | 317 | 32 |
| Cy3 (7) | 550/570 | ≤ −1.24 | 2.21 | ≥0 | 0 | 0.22 | 0 | 341 | 32,35 |
| Resorufin (5) | 571/585 | −0.47 | 2.13 | −0.69 | 51 ± 1 | 2.76 | 42 ± 1 | 202 | 36 |
| Texas Red (11) | 582/602 | −1.12 | 2.08 | 0.01 | 0 | 4.23 | 0 | 535 | 32 |
| Cy5 (8) | 651/674 | −0.88 | 1.88 | −0.03 | 0 | 0.97 | 0 | 347 | 37–39 |
| ATTO655 (6) | 655/684 | −0.42 | 1.86 | −0.47 | 7 ± 1 | 2.00 | 11 ± 1 | 463 | 40 |
recorded by various methods;
calculated as the average energy of λex and λem;
calculated with Equation (1);
thioamide quenching efficiencies with standard error calculated as where FThio is the fluorescence at λem in 50 mM thioacetamide and F0 is the fluorescence at λem in buffer at 298 K;
fluorescence lifetimes of fluorophores in buffer,
thioamide quenching efficiencies with errors estimated from fits calculated as where τThio is the fluorescence lifetime in 50 mM thioacetamide and τ0 is the fluorescence lifetime in buffer at 298 K;
molecular volume calculated from energy-minimized structures (semi-empirical AM1 method) in Spartan (Wavefunction, Inc.).
Several observations from these studies are worth noting. First, the sign of ΔGET can be used to determine if a particular dye will be quenched, but there is no clear connection between the magnitude of ΔGET and EQ. This finding is not unexpected, given the complicated nature of excited state dynamics. In principle, a Marcus theory description of the Arrhenius expression could be used to calculate rate constants for PET; however, without detailed knowledge of all of the other photophysical rates, EQ values are best determined experimentally. Of course, the efficiency of quenching depends not only on the quenching rate constant, but also on the fluorescence lifetime. If the singlet excited state lifetime is longer, quenching can be more efficient, even if ΔGET is less favorable. For example, BODIPY FL (10), Rhodamine R6G (13), and BODIPY R6G (9) all have nearly identical driving forces, but varied quenching that depends on τ. Atto655 (6) is quenched less than these dyes, despite having a more negative ΔGET, due to its short lifetime. Second, care should be taken when interpreting ΔGET values close to zero. The reported Ered values for a given fluorophore can vary considerably, especially since different electrochemical techniques for measuring its redox potential can give different results. The cyanine dyes are a convenient example. Lenhard examined 46 of these dyes with phase-selective second-harmonic alternating current voltammetry and found redox potentials that differed non-systematically by an average of 32 mV from literature values determined by other methods.41 Although we were unable to find an exact value for the reduction potential of Cy3 (7), some estimates suggest that it is at least below −1.24 V (vs. SCE), which corresponds to ΔGET ≥ 0 and is consistent with the observation that thioamides do not quench Cy3.35,38 Third, although we calculated ΔGET = − 0.03 eV for Cy5 (8), no quenching was observed. It may be possible to assign this discrepancy to uncertainty in the reported reduction potential, for which literature values span a range of at least 40 mV,38,39 but it is also reasonable to attribute the difference to approximations inherent in our treatment of the Rehm-Weller model, specifically with respect to Coulombic and solvent effects.29 Finally, it is important to emphasize that even though we were able to use this model to successfully predict thioamide quenching assuming the thioamide to be the electron donor and the dye to be the electron acceptor, it is possible that the roles are reversed for some of the dyes. Further work, such as direct observation of transient radicals, is necessary to determine the direction of PET.
Mechanistic Studies
We conducted additional experiments to determine the nature of the quenching mechanism, particularly whether these results were the consequence of dynamic or static processes. In a purely dynamic PET quenching mechanism, the quencher interacts with an excited-state molecule, but does not affect molecules remaining in the ground state. Reductions in the steady-state fluorescence intensity arise from the decreased time the fluorophore spends in excited states and from the addition of new non-radiative decay pathways. These phenomena result in shortened fluorescence lifetimes. This is not the case for static quenching, wherein the quencher forms a non-emissive ground-state complex with the fluorophore, but does not affect excited molecules. The steady-state fluorescence intensity is attenuated since fewer molecules are excited upon irradiation; however, the fluorescence lifetimes of those molecules that are excited remain unchanged. Since the two quenching mechanisms can be readily distinguished by their effects on fluorescence lifetimes, we used time-correlated, single-photon counting (TCSPC) spectroscopy to measure the lifetime of each sample. We calculated time-resolved quenching efficiencies, listed as EQ(τ) in Table 1, by comparing the average lifetime of each fluorophore in the presence and absence of thioacetamide. These results agree very well with those we obtained for EQ(SS). In all cases where we observed a reduction in steady-state fluorescence intensity, we found corresponding decreases in fluorescence lifetimes consistent with a dynamic quenching mechanism. Furthermore, we found no evidence for the formation of ground-state complexes in the absorption spectra of dilute or concentrated solutions of each fluorophore in all three solvents (see Supporting Information, Fig. S2 – S17).
To determine if any static component might also contribute to the quenching mechanism, we conducted Stern-Volmer experiments with Fam. We recorded the steady-state and time-resolved fluorescence of Fam in buffered solutions ranging in thioacetamide concentration from 0 mM to 65 mM. To analyze the dynamic quenching process, we fit our TCSPC data to a linear model with a Stern-Volmer constant KSV,τ = 13.36 ± 0.04 M−1 (Fig. 2). We used this value to calculate a quenching rate constant, kQ = 3.31 ± 0.01 × 10⁹ M−s−1. This value compares favorably to the prediction of the Smoluchowski equation for a diffusion- limited process in which bimolecular collisions result in quenching: k2 = 8.2 × 10⁹ M−1 s−1. The discrepancy in kQ and k2 can be attributed to a quenching efficiency factor (fQ) of 0.40 that accounts for the fact that not all collisions are productive, but could also simply result from the coarse nature of the model.
Figure 2.

Thioacetamide Quenching of 5-carboxyfluorescein. Steady-state (solid trace) and time-resolved (dotted trace) Stern-Volmer plots of thioacetamide quenching 5-carboxyfluorescein in 100 mM phosphate buffer, pH 7.00 at 298 K. Steady-state data are fit to quadratic models and time-resolved data are fit to linear models as described in text. Error bars are standard error or estimated from fits.
The steady-state data were fit to linear and quadratic Stern-Volmer models as described in the Supporting Information. We found superior fits for the quadratic model, which incorporated both dynamic (KD) and static (KS) components: KD = 13.68 ± 0.51 M−1 and KS = 0.84 ± 0.31 M−1 (Fig. 2). The dynamic component was nearly the same as that determined from TCSPC measurements and the static component was minimal. Taken together, these findings suggest that thioamide quenching arises almost exclusively from a dynamic mechanism. We have performed a similar analysis of Alexa Fluor 488 and found that thioamide quenching also occurs primarily through dynamic electron transfer (see Supporting Information, Fig. 20).
In practical terms, quenching is likely to require transient contact between the thioamide and the fluorophore. To test this hypothesis, we synthesized several short peptides containing a C-terminal Cys labeled with Fam-maleimide (Fam-Cys or ψ, 17) and either leucine or thioleucine (denoted Leu′ or L′) at the N-terminus separated by Pro-Pro (P2), Gly-Gly (G2), Pro-Pro-Pro (P3), or Gly-Gly-Gly (G3) spacers. We did not observe quenching in the thioamide P2, G2, or P3 peptides relative to the corresponding oxoamide peptides, but we saw a small amount of quenching in the G3 peptides (6 ± 0.4 %). The chief difference between the P3 and G3 peptides is the flexibility of the peptide spacer, and so we interpret these results to mean contact between the thioamide and fluorophore is necessary for quenching to occur. (Fig. 3) Since no quenching was observed in the P2 or G2 peptides, proximity alone seems to be insufficient. Analysis of the ensembles of conformations generated using Monte-Carlo computational methods for all four peptide scaffolds support this conclusion, since increased fluorophore-thioamide contact is observed in the G3 peptide relative to the others (see Supporting Information, Fig. S23 – S25).
Figure 3.
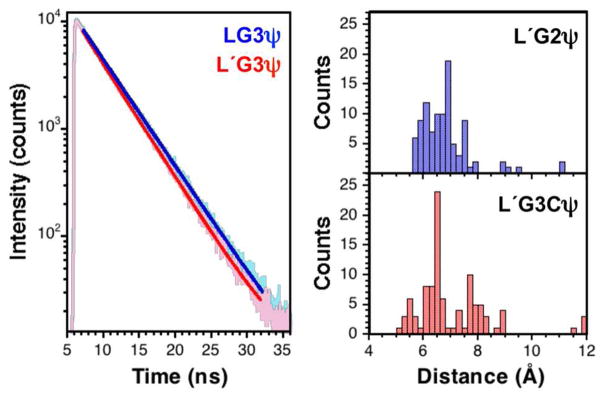
Quenching in Glycine Peptides. Left: Fluorescence lifetime measurements of fluorescein labelled peptides. Single- exponential fits of fluorescence lifetime measurements of LG3ψ and L′G3ψ. Right: Histograms showing the distribution of C1 – C2 distances in the conformer ensembles generated from Monte Carlo simulations. See Supporting Information for descriptions of simulations.
Linker studies
Since all of these fluorophores are typically attached to a protein through post-translational covalent modification, we examined the effect of various chemical linkers on quenching. We selected fluorescein as a representative fluorophore and covalently attached it to 6-hexanoic acid, glycine, and cysteine through azide-alkyne (Fam-Click, 15), isothiocyanate (FITC, 16), and maleimide (Fam-Cys, ψ, 17) chemistries, respectively. Our findings are summarized in Table 1. We observed that the choice of linker had minor effects on the electronic structure of the fluorophore as judged by its spectral properties. The wavelengths of maximum emission or absorption for each conjugate changed by no more than 3 nm relative to that of the parent Fam.
The lifetime decays of free Fam (τ = 4.04 ± 0.01 ns) and Fam-Click (τ = 3.95 ± 0.01 ns) could be fit using a single-exponential function. There was a 44 ± 1% reduction of the steady-state fluorescence and a 40 ± 1% decrease in the fluorescence lifetimes of both dyes in the presence of 50 mM thioacetamide. On the other hand, FITC and Fam-Cys required bi-exponential models for satisfactory fits. For Fam-Cys we found τ1 = 3.78 ± 0.02 ns (87.9% by amplitude; 95.5% by intensity) and τ2 = 1.29 ± 0.14 ns (12.1% by amplitude; 4.5% by intensity) in buffer. In the presence of 50 mM thioacetamide, we found τ1 = 2.58 ± 0.01 ns (63.5% by amplitude; 76.3% by intensity) and τ2 = 1.39 ± 0.03 ns (36.5% by amplitude; 23.7% by intensity). Although the long-lifetime component τ1 is unambiguously quenched by thioacetamide, given the errors associated with τ2, it is difficult to determine if the short component is also quenched, though its relative contribution increases considerably. When computed using the average lifetime (τAvg), Fam-Cys EQ(τ) is essentially the same as Fam-Click EQ(τ) (37 ± 2%), as is Fam-Cys steady-state quenching: E(Q(SS) = 44 ± 1%.
Thioacetamide quenching was slightly less efficient for FITC with EQ(τ) = 36 ± 2% and EQ(SS) = 41 ± 1%. Specifically, we found long (τ1 = 3.67 ± 0.02 ns; 81% by amplitude, 92% by intensity) and short (τ2 = 1.32 ± 0.09 ns; 19% by amplitude, 8% by intensity) lifetime components that accounted for the observed decay trace in buffer. Both components were quenched by 50 mM thioacetamide (τ1 = 2.38 ± 0.01 ns; 75.8% by amplitude, 88.6% by intensity and τ2 = 0.96 ± 0.05 ns; 24.2% by amplitude, 11.4% by intensity). Previous reports have shown that FITC adducts have lower quantum yields than other fluorescein adducts and, indeed, the intensity-weighted average lifetime of the conjugate in buffer (τavg = 3.48 ± 0.08 ns) was roughly 15% less than that of Fam.42 We attribute this difference, not observed for the other conjugates, to the linker. Upon reaction with amines, isothiocyanates produce thioureas, which are chemically similar to thioamides. We speculated that the thiourea functional group might act as an intramolecular quencher and attenuate the fluorescence of fluorescein. To test this hypothesis, we measured the fluorescence of Fam in buffered solutions of 50 mM urea and 50 mM thiourea. Although we observed no difference in the spectral properties in either solution relative to those of Fam in buffer, we found thiourea to have the same steady-state fluorescence quenching efficiency (45 ± 1%) as thioacetamide. In spite of the inherent quenching due to the thiourea linker in FITC adducts, these labels can still be used in thioamide quenching probe pairs.
Monitoring Protease Activity
We applied these lessons to the design of profluorescent substrates for monitoring protease activity in real time. The strategy, which is illustrated in Figure 4, employs a short peptide that is labeled with a thioamide and fluorophore on opposite ends such that its fluorescence is quenched. When the intervening amino acid sequence is recognized by a proteolytic enzyme, the peptide is cleaved, allowing the fluorophore and thioamide to diffuse away from each other with a concomitant gain of fluorescence. We used this approach in a proof-of-principle experiment to examine the proteolysis of the short peptide A′AFKGψ by trypsin (A′ represents thioalanine, ψ represents Fam-Cys). Upon addition of trypsin to a 1.4 μM solution of the peptide, we observed an increase in fluorescence at a rate (~ 0.1 μM/min over the first 5 min) falling in the middle of the very broad range of previous measurements of trypsin kinetics with canonical small peptide substrates (3.5 × 10⁻⁵ – 50 μM/min under the conditions of our experiment, see Supporting Information, Table S2).43–45 In the absence of protease, the thiopeptide fluorescence remained nearly constant. The fluorescence of the corresponding oxoamide peptide (AAFKGψ) was constant in the presence and absence of protease, showing that the changes observed with A′AFKGψ could be exclusively attributed to thioalanine quenching of Fam. (see Supporting Information, Fig. S26)
Figure 4.

Protease Activity. Left: A cartoon illustrating the cleavage of a profluorescent peptide substrate by a protease as described in the text. Right: Fluorescence of 1.4 μM A′AFKGψ peptide in the presence (blue circles) and absence (red squares) of 250 μg/mL trypsin in 67 mM sodium phosphate buffer, pH 7.6. Excitation was at 494 nm and emission was monitored at 522 nm. Shaded areas represent standard error as calculated from at least three independent trials.
As the range of trypsin data exemplify, enzyme kinetics can vary enormously with substrate structure.46 We believe that small thioamide probes will allow investigators to obtain Michaelis-Menten parameters that more accurately reflect those of native substrates than larger fluorophore- quencher pairs. We are currently investigating the scope of this method with several classes of proteases and in a variety of matrices, including cell lysate.
Monitoring Protein Folding
We have also applied the Fam/thioamide probe pair to monitoring the refolding of an intrinsically-disordered protein, αS. The aggregation of αS, which is believed to underlie Parkinson’s disease pathology, occurs by formation of soluble β-sheet rich oligomers that eventually convert into larger, insoluble fibrils.47 Understanding the structural dynamics of the meta-stable αS monomers may help to explain what primes αS for oligomerization and subsequent fibrillization. 48 We have previously shown that we can monitor conformational changes in monomeric αS, using urea or trimethylamine oxide (TMAO) to denature or compact αS, respectively.26,49 These experiments used p-cyanophenylalanine (Cnf) and thioamide labels to track the distances between pairs of residues in the 8 to 30 Å range over which this FRET probe pair is useful.27 Our studies complemented similar studies by Deniz and coworkers using longer range FRET pairs.50 We can use Fam/thioamide pairs to observe short distance interactions that are not resolvable by Cnf/thioamide pairs. Moreover, Fam/thioamide studies can be performed with very dilute solutions or in complex mixtures for which UV range excitation of Cnf would result in high levels of background fluorescence.
In a proof-of-principle experiment, we have examined αS constructs labeled with Fam at position 114 or 125 and with a thioglutamate at position 130 or 137 (αSψ114E′137 or αSψ125E′130). Oxoamide control experiments (αSψ114 or αSψ125) were essential to proper data interpretation. Fam fluorescence in the oxoamide proteins is quenched by the addition of 4 M TMAO, which could lead to an overestimation of thioamide quenching without appropriate correction. (see Supporting Information, Fig. S37 – S39) In order to minimize the influence of concentration matching on measurements of quenching efficiency, we determined EQ(τ) values for the labeled αS constructs in varying TMAO concentrations by performing TCSPC experiments.
In 0 M TMAO, no thioamide-specific quenching was observed for either set of constructs. This indicates that there is no contact between the Fam labels and the thioamides prior to TMAO addition. Little change in EQ(τ) was observed in 2M TMAO, but upon further compaction in 4 M TMAO, substantial quenching (EQ(τ) = 19%) was observed for αSψ114E′137, while no quenching (EQ(τ) = 0%) was observed for αSψ125E′130. This implies that during compaction, the C-terminal tail of αS folds back on the 114 region, but that positions 125 and 130 are not oriented properly for quenching, despite their proximity in the amino acid sequence. These experiments show that Fam quenching by thioamides can be used to observe changes in interactions between regions of a protein during a conformational change. Since near van der Waals contact is required, one can interpret positive thioamide quenching results as showing direct contact between two residues in the protein sequence. Unlike our Cnf experiments, where one could observe a decrease in interchromophore distance in lower concentrations of TMAO, no change in quenching is observed in 2 M TMAO here.26 This indicates that sufficient compaction to bring the 114 region into contact with Glu137 only occurs in 4 M TMAO. If this probe system can successfully be applied at the single molecule level, it will nicely complement fluorophore pairs such as fluorescein and rhodamine that cannot provide highly local contact information.
Conclusions
In summary, we have shown that the free energy of electron transfer can be successfully used to predict whether thioamides quench various fluorophores through photoinduced electron transfer, including dyes suitable for microscopy and single molecule studies, such as fluorescein, Alexa Fluor 488, BODIPY FL, and rhodamine 6G. We have described the photochemistry of these systems, and in the case of fluorescein, analyzed the impact of common linkers used to attach these dyes to proteins. We have also explored preliminary applications demonstrating the utility of thioamide quenching to studying proteolysis and the folding of an intrinsically disordered protein. Attempts to extend the protease results to applications with cultured cells and the αS results to single molecule fluorescence correlation spectroscopy (FCS) experiments are underway.
Methods
Small Molecule Fluorescence Spectroscopy
Fluorescence measurements in the presence and absence of 50 mM acetamide or 50 mM thioacetamide were conducted for each fluorophore in 100 mM sodium phosphate buffer, pH 7.00. Concentrated stocks of each fluorophore in buffer were prepared immediately prior to use, with the exception of Alexa Fluor 488, BODIPY FL, BODIPY R6G, Cy3, and Cy5. Concentrated stocks of these dyes were prepared one day prior to use to allow the succinimidyl esters to hydrolyze. Spectroscopic grade ethanol was added to the BODIPY R6G sample to aid in dissolution. NBD and fluorescein conjugates were prepared as described in the Supporting Information. For each fluorophore, samples were prepared by diluting the concentrated stock with additional buffer and 100 mM solutions of acetamide or thioacetamide in buffer such that all solutions of a given fluorophore were equimolar. Steady-state fluorescence spectra were collected as the average of three scans at 25 °C of three samples of each solution using Cary Eclipse fluorometer (currently Agilent Technologies). Excitation wavelengths are given in the Supporting Information. The EQ values reported in Table 1 are the average of three trials.
Small Molecule Fluorescence Lifetime Measurements
Time-resolved fluorescence measurements were performed on freshly prepared samples using the Time-Correlated Single Photon Counting (TCSPC) method. The TCSPC system consisted of a blue diode laser generating 10 MHz output pulses at 405 nm, a subtractive double monochromator with an MCP-PMT, and a TCSPC computer board. Emission was monitored at the wave-length of maximum fluorescence. Data analysis was performed with FluoFit software (Picoquant) using an exponential decay model as described in the Supporting Information.
Small Molecule Absorbance Spectroscopy
UV-visible spectra were acquired of dilute and concentrated solutions of each fluorophore in 100 mM sodium phosphate buffer, pH 7.00; in 50 mM thioacetamide; and in 50 mM acetamide in quartz cells with 1.00 cm path lengths. Representative spectra are shown in the Supporting Information.
Molecular Volume Calculations
The ground-state geometries of each fluorophore were optimized at the AM1 level and the molecular volume was calculated using Spartan (Wavefunction, Inc.). Reactive handles were not included in these calculations.
Thiourea Quenching of 5-Carboxyfluorescein
The quenching efficiency of thiourea was determined by comparing the fluorescence of Fam in the presence and absence of thiourea or urea. A concentrated stock of Fam in 100 mM sodium phosphate buffer, pH 7.00 was used to prepare solutions that were 1.6 μM fluorophore in pure buffer, 50 mM thiourea and buffer, or 50 mM urea and buffer. Fluorescence spectra of each sample were acquired in triplicate at 25 °C using the same parameters described above for the thioacetamide experiments.
Stern-Volmer Experiments
Concentrated stock solutions of Fam or A488 in 100 mM sodium phosphate buffer, pH 7.00, were diluted with 100 mM thioacetamide and buffer to prepare samples of uniform dye concentration and variable thioacetamide concentration (0, 2.5, 5, 15, 25, 35, 50, and 65 mM). The Fam solutions were excited at 492 nm and emission was recorded from 500 to 600 nm. The A488 solutions were excited at 475 nm and emission was recorded from 485 to 600 nm. For all steady-state measurements, the excitation and emission slit widths were 5 nm, the scan rate was 120 nm/min, the data pitch was 1.0 nm, and the averaging time was 0.1 s. Measurements were made in 1.00 cm quartz cuvettes at 25 °C. For Fam, the fluorescence intensity at 522 nm was averaged from three separate trials to obtain values for Stern-Volmer calculations. The fluorescence intensity at 516 nm from three separate trials was averaged to obtain values for Stern-Volmer calculations for the A488 samples. A thorough description of the data analysis can be found in the Supporting Information.
Peptide Synthesis
Peptides were synthesized on solid phase using standard Fmoc chemistry and purified to homogeneity by reverse-phase high performance liquid chromatography (HPLC). Thioamide benzotriazole precursors were either commercially available or synthesized according to literature precedent. Explicit protocols are provided in the Supporting Information.
Protease Experiments
A sample of trypsin type II from porcine pancreas was dissolved in cold 1 mM hydrochloric acid at a concentration of 2.5 mg/mL. Concentrated stocks of AAFKGψ and A′AFKGψ peptides in 67 mM sodium phosphate buffer, pH 7.6 were prepared and cooled on ice. Samples were prepared in triplicate immediately before fluorescence measurements were taken such that the final concentration of peptide was approximately 1.4 μM and the final concentration of trypsin was 250 μg/mL. Samples of equimolar peptide in an equivalent HCl/buffer solution in the absence of enzyme were used as controls. The fluorescence of each sample was measured over the course of 45 min with the kinetics module of a Varian Cary Eclipse fluorescence spectrophotometer fitted with a Peltier multicell holder. The excitation wavelength was 494 nm and the emission wavelength was 522 nm.
Protein Semi-synthesis
Thioamide-labeled αS constructs were synthesized by ligation of an expressed protein fragment corresponding to αS1-113 or αS1-124 as intein fusions. After ligation to the corresponding thiopeptide, αS114-140C114E′137 or αS125-140C125E′130, the protein was labeled with fluorescein-maleimide, and purified by fast protein liquid chromatography (FPLC), followed by HPLC. Full descriptions of protein synthesis and characterization are given in Supporting Information.
αS Refolding Experiments
Tris buffers (20 mM Tris, 100 mM NaCl, pH 7.5) containing trimethylamine oxide (TMAO) were prepared such that upon addition of protein (absorbance of final solution at 492 nm was between 0.11 and 0.07, corresponding to 1.47 - 1.07 uM), the final TMAO concentrations were 0 M, 2 M, and 4 M. Fluorescence lifetimes were measured immediately following sample dilution in TMAO (to a final volume of 125 μL) using a Photon Technologies International (PTI) Quantamaster™ 40 with a 486 nm pulsed light-emitting diode (LED) light source using time-correlated single photon counting (TCSPC) detection. Full details are given in Supporting Information.
Supplementary Material
Figure 5.

Refolding assay. Left: Monomeric double-labeled αS is mixed with TMAO to induce compaction and an increase in quenching efficiency, determined from TCSPC measurements (EQ(τ)= 1− τThio/τ0). Right: EQ(τ)of αSψ114E′137 (blue) or αSψ125E′130 (red) determined at varying concentrations of TMAO. Error bars represent the uncertainty in the fitted average lifetime values for each condition. Fits to raw TCSPC data are shown in Supporting Information.
Acknowledgments
This work was supported by funding from the University of Pennsylvania, the Alfred P. Sloan Foundation (BR2012-085 to E.J.P.), the National Science Foundation (NSF CHE-1150351 to E.J.P.), and the National Institutes of Health (NIH NS081033 to E.J.P.). We thank Rakesh Kohli for assistance with HRMS (supported by NIH RR-023444) and MALDI-MS (supported by NSF MRI-0820996). We thank Jeff Saven for use of the fluorometer and we are grateful to Tom Troxler for assistance with the TCSPC measurements collected at the Ultrafast Optical Processes Laboratory at the University of Pennsylvania (supported by NIH P41GM104605). J.M.G. thanks the University of Pennsylvania for a dissertation completion fellowship and Xing Chen for assistance with peptide synthesis. S.B. thanks the Parkinson’s Disease Foundation for a summer fellowship. B.S.C. thanks the Penn Undergraduate Research Mentorship program for funding.
Footnotes
Notes
The authors declare no competing financial interests.
Materials, detailed descriptions of all experimental procedures, calculations, and representative spectral data, their associated fits and residuals. This material is available free of charge via the Internet at http://pubs.acs.org.
References
- 1.Eftink MR. Methods Biochem Anal. 1991;35:127–205. doi: 10.1002/9780470110560.ch3. [DOI] [PubMed] [Google Scholar]
- 2.Royer CA. Chem Rev. 2006;106:1769–1784. doi: 10.1021/cr0404390. [DOI] [PubMed] [Google Scholar]
- 3.Weiss S. Nat Struct Biol. 2000;7:724–729. doi: 10.1038/78941. [DOI] [PubMed] [Google Scholar]
- 4.Sinkeldam RW, Greco NJ, Tor Y. Chem Rev. 2010;110:2579–2619. doi: 10.1021/cr900301e. [DOI] [PMC free article] [PubMed] [Google Scholar]
- 5.Ha T, Ting AY, Liang J, Caldwell WB, Deniz AA, Chemla DS, Schultz PG, Weiss S. Proc Natl Acad Sci USA. 1999;96:893–898. doi: 10.1073/pnas.96.3.893. [DOI] [PMC free article] [PubMed] [Google Scholar]
- 6.Lavis LD, Raines RT. ACS Chem Biol. 2008;3:142–155. doi: 10.1021/cb700248m. [DOI] [PMC free article] [PubMed] [Google Scholar]
- 7.Taraska JW. Curr Opin Struct Biol. 2012;22:507–513. doi: 10.1016/j.sbi.2012.02.004. [DOI] [PMC free article] [PubMed] [Google Scholar]
- 8.Dexter DL. J Chem Phys. 1953;21:836–850. [Google Scholar]
- 9.Forster T. Discuss Faraday Soc. 1959;(27):7–17. [Google Scholar]
- 10.Gould IR, Young RH, Mueller LJ, Farid S. J Am Chem Soc. 1994;116:8176–8187. [Google Scholar]
- 11.Benelli T, Tomasulo M, Raymo FM. Molecular Switches. Wiley-VCH Verlag GmbH & Co. KGaA; 2011. pp. 697–717. [Google Scholar]
- 12.Hurenkamp JH, de Jong JJD, Browne WR, van Esch JH, Feringa BL. Org Biomol Chem. 2008;6:1268–1277. doi: 10.1039/b719095f. [DOI] [PubMed] [Google Scholar]
- 13.Ueno T, Urano Y, Setsukinai K-i, Takakusa H, Kojima H, Kikuchi K, Ohkubo K, Fukuzumi S, Nagano T. J Am Chem Soc. 2004;126:14079–14085. doi: 10.1021/ja048241k. [DOI] [PubMed] [Google Scholar]
- 14.Hudgins RR, Huang F, Gramlich G, Nau WM. J Am Chem Soc. 2002;124:556–564. doi: 10.1021/ja010493n. [DOI] [PubMed] [Google Scholar]
- 15.Crisalli P, Hernandez AR, Kool ET. Bioconj Chem. 2012;23:1969–1980. doi: 10.1021/bc300344b. [DOI] [PMC free article] [PubMed] [Google Scholar]
- 16.Schuler B, Hofmann H. Curr Opin Struct Biol. 2013;23:36–47. doi: 10.1016/j.sbi.2012.10.008. [DOI] [PubMed] [Google Scholar]
- 17.Togashi DM, Szczupak B, Ryder AG, Calvet A, O’Loughlin M. J Phys Chem A. 2009;113:2757–2767. doi: 10.1021/jp808121y. [DOI] [PubMed] [Google Scholar]
- 18.Doose S, Neuweiler H, Sauer M. ChemPhysChem. 2009;10:1389–1398. doi: 10.1002/cphc.200900238. [DOI] [PubMed] [Google Scholar]
- 19.Sun QF, Lu R, Yu AC. J Phys Chem B. 2012;116:660–666. doi: 10.1021/jp2100304. [DOI] [PubMed] [Google Scholar]
- 20.DeFelippis MR, Murthy CP, Faraggi M, Klapper MH. Biochemistry. 1989;28:4847–4853. doi: 10.1021/bi00437a049. [DOI] [PubMed] [Google Scholar]
- 21.Bordwell FG, Algrim DJ, Harrelson JA., Jr J Am Chem Soc. 1988;110:5903–5904. [Google Scholar]
- 22.Chae MY, Czarnik AW. J Am Chem Soc. 1992;114:9704–9705. [Google Scholar]
- 23.Song KC, Kim JS, Park SM, Chung KC, Ahn S, Chang SK. Org Lett. 2006;8:3413–3416. doi: 10.1021/ol060788b. [DOI] [PubMed] [Google Scholar]
- 24.Choudhary A, Raines RT. Chem Bio Chem. 2011;12:1801–1807. doi: 10.1002/cbic.201100272. [DOI] [PMC free article] [PubMed] [Google Scholar]
- 25.Batjargal S, Wang YJ, Goldberg JM, Wissner RF, Petersson EJ. J Am Chem Soc. 2012;134:9172–9182. doi: 10.1021/ja2113245. [DOI] [PMC free article] [PubMed] [Google Scholar]
- 26.Wissner RF, Batjargal S, Fadzen CM, Petersson EJ. J Am Chem Soc. 2013;135:6529–6540. doi: 10.1021/ja4005943. [DOI] [PMC free article] [PubMed] [Google Scholar]
- 27.Goldberg JM, Batjargal S, Petersson EJ. J Am Chem Soc. 2010;132:14718–14720. doi: 10.1021/ja1044924. [DOI] [PubMed] [Google Scholar]
- 28.Rehm D, Weller A. Isr J Chem. 1970;8:259–271. [Google Scholar]
- 29.Seidel CAM, Schulz A, Sauer MHM. J Phys Chem. 1996;100:5541–5553. [Google Scholar]
- 30.Xu Z, Kim GH, Han SJ, Jou MJ, Lee C, Shin I, Yoon J. Tetrahedron. 2009;65:2307–2312. [Google Scholar]
- 31.Chen H, Ahsan SS, Santiago-Berrios MEB, Abruna HD, Webb WW. J Am Chem Soc. 2010;132:7244–7245. doi: 10.1021/ja100500k. [DOI] [PMC free article] [PubMed] [Google Scholar]
- 32.Torimura M, Kurata S, Yamada K, Yokomaku T, Kamagata Y, Kanagawa T, Kurane R. Anal Sci. 2001;17:155–160. doi: 10.2116/analsci.17.155. [DOI] [PubMed] [Google Scholar]
- 33.Guha SN, Mittal JP. J Photochem Photobiol. 1995;92:181–188. [Google Scholar]
- 34.Sauer M, Han KT, Müller R, Nord S, Schulz A, Seeger S, Wolfrum J, Arden-Jacob J, Deltau G, Marx NJ, Zander C, Drexhage KH. J Fluorescence. 1995;5:247–261. doi: 10.1007/BF00723896. [DOI] [PubMed] [Google Scholar]
- 35.Sanborn ME, Connolly BK, Gurunathan K, Levitus M. J Phys Chem B. 2007;111:11064–11074. doi: 10.1021/jp072912u. [DOI] [PubMed] [Google Scholar]
- 36.Çakir S, Arslan E. Chem Pap. 2010;64:386–394. [Google Scholar]
- 37.Vogelsang J, Kasper R, Steinhauer C, Person B, Heilemann M, Sauer M, Tinnefeld P. Angew Chem, Int Ed. 2008;47:5465–5469. doi: 10.1002/anie.200801518. [DOI] [PubMed] [Google Scholar]
- 38.Stein IH, Capone S, Smit JH, Baumann F, Cordes T, Tinnefeld P. ChemPhysChem. 2012;13:931–937. doi: 10.1002/cphc.201100820. [DOI] [PubMed] [Google Scholar]
- 39.Dietrich A, Buschmann V, Müller C, Sauer M. Rev Mol Biotechnol. 2002;82:211–231. doi: 10.1016/s1389-0352(01)00039-3. [DOI] [PubMed] [Google Scholar]
- 40.Vogelsang J, Cordes T, Forthmann C, Steinhauer C, Tinnefeld P. Proc Natl Acad Sci USA. 2009;106:8107–8112. doi: 10.1073/pnas.0811875106. [DOI] [PMC free article] [PubMed] [Google Scholar]
- 41.Lenhard J. J Imaging Sci. 1986;30:27–35. [Google Scholar]
- 42.Klonis N, Sawyer WH. Photochem Photobiol. 2003;77:502–509. doi: 10.1562/0031-8655(2003)077<0502:ttgmtf>2.0.co;2. [DOI] [PubMed] [Google Scholar]
- 43.Walsh KA. Methods Enzymol. 1970;19:41–63. [Google Scholar]
- 44.Grant GA, Eisen AZ. Biochemistry. 1980;19:6089–6095. doi: 10.1021/bi00567a022. [DOI] [PubMed] [Google Scholar]
- 45.Evnin LB, Vasquez JR, Craik CS. Proc Natl Acad Sci USA. 1990;87:6659–6663. doi: 10.1073/pnas.87.17.6659. [DOI] [PMC free article] [PubMed] [Google Scholar]
- 46.Lottenberg R, Christensen U, Jackson CM, Coleman PL, Laszlo L. Methods Enzymol. 1981;80:341–361. doi: 10.1016/s0076-6879(81)80030-4. [DOI] [PubMed] [Google Scholar]
- 47.Auluck PK, Caraveo G, Lindquist S. Annu Rev Cell Develop Biol. 2010;26:211–233. doi: 10.1146/annurev.cellbio.042308.113313. [DOI] [PubMed] [Google Scholar]
- 48.Drescher M, Huber M, Subramaniam V. Chem Bio Chem. 2012;13:761–768. doi: 10.1002/cbic.201200059. [DOI] [PubMed] [Google Scholar]
- 49.Wissner RF, Wagner AM, Warner JB. Synlett. 2013;24:2454–2458. doi: 10.1055/s-0033-1339853. [DOI] [PMC free article] [PubMed] [Google Scholar]
- 50.Ferreon ACM, Moosa MM, Gambin Y, Deniz AA. Proc Natl Acad Sci USA. 2012;109:17826–17831. doi: 10.1073/pnas.1201802109. [DOI] [PMC free article] [PubMed] [Google Scholar]
Associated Data
This section collects any data citations, data availability statements, or supplementary materials included in this article.