

Abstract
Dysregulation in the circadian system induced by variants of clock genes has been associated with type 2 diabetes. Evidence for the role of cryptochromes, core components of the system, in regulating glucose homeostasis is not supported by CRY1 candidate gene association studies for diabetes and insulin resistance in human, suggesting possible dietary influences. The purpose of this study was to test for interactions between a CRY1 polymorphism, rs2287161, and carbohydrate intake on insulin resistance in two independent populations: a Mediterranean (n=728) and an European origin North American population (n=820). Linear regression interaction models were performed in two populations to test for gene–diet interactions on fasting insulin and glucose and two insulin-related traits, homeostasis model assessment of insulin resistance (HOMA-IR) and quantitative insulin sensitivity check index (QUICKI). In addition, fixed effects meta-analyses for these interactions were performed. Cohort-specific interaction analyses showed significant interactions between the CRY1 variant and dietary carbohydrates for insulin resistance in both populations (p<0.05). Findings from the meta-analyses of carbohydrate–single nucleotide polymorphism interactions indicated that an increase in carbohydrate intake (% of energy intake) was associated with a significant increase in HOMA-IR (p=0.011), fasting insulin (p=0.007) and a decrease in QUICKI (p=0.028), only among individuals homozygous for the minor C allele. This novel finding supports the link between the circadian system and glucose metabolism and suggests the importance this CRY1 locus in developing personalized nutrition programs aimed at reducing insulin resistance and diabetes risk.
Keywords: Carbohydrate intake, CRY1, diabetes, gene–diet interaction, genetic epidemiology
INTRODUCTION
The circadian biological clock governs numerous aspects of human physiology including feeding behavior, sleep/wake cycle and metabolism (Ahn et al., 2010; Major et al., 2011; Mondul et al., 2011). This system is maintained endogenously via the co-expression of a group of genes referred to as clock genes, and is additionally synchronized by external cues including changes in light exposure, in physical activity and in dietary intake (Duguay & Cermakian, 2009; Quintero et al., 2003; Schibler et al., 2003). Recently, the role of the circadian system in contributing to insulin resistance has been explored (Shi et al., 2013). Many hormones that modulate insulin secretion, glucose homeostasis and feeding, including orexin, leptin and glucagon, are regulated cyclically by the circadian system (Turek et al., 2005). As a result of this regulation, the loss of circadian rhythmicity caused by dysregulation of the expression of these genes can have a profound impact on glucose homeostasis. Consequently, clock variants discovered through genome-wide association studies have been associated specifically with diabetes and insulin resistance (Bouatia-Naji et al., 2009; Dupuis et al., 2010).
The cryptochromes (Cry1 and Cry2) constitute the negative limb of the core clock and appear to play an important role in regulating gluconeogenesis (Hatori & Panda, 2010). In mouse studies, circadian changes in hepatic Cry1/2 expression were sufficient to modulate gluconeogenesis (Zhang et al., 2010). The knockdown of Cry1/2 elevated circulating glucose concentrations and also increased glucose production in primary hepatocytes. Because of this known influence of cryptochromes in regulating glucose homeostasis, genetic variants in CRY1 and CRY2 genes may be linked with risk for insulin resistance or type 2 diabetes.
Given the high prevalence of type 2 diabetes, identifying modifiable factors, specifically dietary components that could modulate the risk of the disease together with clock genetic variants, could help to identify nutrition-based and genetic interventions for individuals at risk for diabetes (Ordovas & Corella, 2004). Very few studies have focused on analyzing the potential interactions between clock variants and modifiable risk factors. Earlier studies have assessed the role of carbohydrate intake as a risk factor for type 2 diabetes (Meyer et al., 2000), and more recent gene–diet interaction studies have identified genetic variants that could modify the association between carbohydrate intake and diabetes traits (Corella et al., 2006; Smith et al., 2012; Zheng et al., 2013). These studies provide promising insights for diabetes prevention and treatment.
Since evidence for the role of CRY1 in regulating glucose homeostasis is not supported by CRY1 candidate gene association studies for diabetes and insulin resistance in human, the investigation of potential gene–diet interactions that could explain the lack of direct association is warranted. These interactions could result from known pathways linking dietary intake to circadian genes, most commonly investigated for rs1801260, a variant located 3′ downstream of CLOCK (Garaulet et al., 2009). However, of particular interest is rs2287161, a variant located 3′ downstream of CRY1. The association between this common variant and known circadian disruption phenotypes suggests further functionality in other circadian phenotypes (Soria et al., 2010). In addition, recent advancements in the Encyclopedia of DNA Elements (ENCODE) project indicate that rs2287161 is likely to affect the binding of several transcription factors across multiple cell types, including HepG2 and adipocytes, potentially resulting in dysregulation of the gene (Raney et al., 2011).
The purpose of this study was to test for interaction between the CRY1 rs2287161 polymorphism and carbohydrate intake on glucose and insulin-related traits. In order to increase the confidence that the interaction identified is sound, results from a Mediterranean discovery cohort were validated in an independent European origin North American population. In addition, a meta-analysis of both cohorts provided an overall effect size and significance level for these interactions.
MATERIALS AND METHODS
Study participants and study design
A total of 1548 participants from two independent populations (Mediterranean and North American) were investigated for this study. All participants provided written informed consent, and the experimental protocol conforms to international ethical standards (Portaluppi et al., 2010).
Mediterranean population
The study sample consisted of 728 subjects (81% women) (age: mean=39.3 years, SD=12.4 years; body mass index (BMI): mean=31.2 kg/m2, SD=5.5 kg/m2), residents of Murcia (Spain) who voluntarily attended five nutrition clinics in southeast Spain with the objective of losing weight. The participants followed a Mediterranean diet and supervised behavioral modification. All procedures were in accordance with good clinical practice. Patient data were codified to guarantee anonymity.
North American population
The study sample consisted of 820 (50.5%) women (age: mean=48.3 years, SD=15.9 years; BMI: mean=28.5 kg/m2, SD=5.5 kg/m2) who participated in the Genetics of Lipid Lowering Drugs and Diet Network (GOLDN) study. GOLDN is part of the Program for Genetic Interactions Network and is funded by the NIH through the University of Alabama at Birmingham and in collaboration with the University of Utah, Washington University, Tufts University, University of Texas, University of Michigan, University of Minnesota and Fairview University of Minnesota Medical Center. The majority of participants were re-recruited from three-generational pedigrees from two National Heart, Lung and Blood Institute Family Heart Study field centers (Minneapolis, MN and Salt Lake City, UT) (Higgins et al., 1996). Nearly all individuals were of European descent. The details of the study are available at https://dsgweb.wustl.edu/goldn/. The protocol was previously approved by the institutional review boards at each of the above-referenced institutions.
Laboratory measurements
In both populations, blood samples were drawn after an overnight fast. Anthropometric data, including height, weight and waist circumference, were measured by using standard techniques. BMI was calculated as weight (kg)/height (m)2. Plasma concentrations of glucose, cholesterol, triglyceride and lipoproteins were determined (Sánchez-Moreno et al., 2011; Shen et al., 2007). Insulin was determined through a solid-phase, two-site chemiluminescent immunometric assay (IMMULITE 2000 Insulin). Homeostasis model assessment of insulin resistance (HOMA-IR; fasting glucose × fasting insulin/22.5) was used to assess insulin resistance (IR). The quantitative insulin sensitivity (IS) check index (QUICKI; 1/(log (fasting insulin μU/mL) + log (fasting glucose mg/dL))) was used to assess IS (Katz et al., 2000).
Carbohydrate intake
Mediterranean population
To evaluate habitual dietary intake before the treatment, intake was determined by a 24-hour dietary recall, including 24-hour recalls of food intake from all days of the week in the total population. Total energy intake and macronutrient composition were analyzed with the nutritional evaluation software program, Grunumur (Murcia, Spain) (Pérez-Llamas et al., 2004), on the basis of Spanish food composition tables. Total carbohydrate included both complex carbohydrate and simple sugars and was analyzed as percentages of total energy consumption from total carbohydrate. To construct the categorical variables, carbohydrate intake (% of energy) was classified into two groups according to the median carbohydrate intake of this population.
North American population
Dietary intake was estimated using the Diet History Questionnaire (DHQ), a food-frequency questionnaire developed by the National Cancer Institute. It consists of 124 food items and includes both portion size and dietary supplement questions (Subar et al., 2001). The food list and nutrient database used with the DHQ are based on national dietary data [US Department of Agriculture (USDA) 1994–1996 Continuing Survey of Food Intakes by Individuals, available from the USDA Food Surveys Research Group]. Intake of total carbohydrate included both complex carbohydrate and simple sugars and was expressed percentages of total energy consumption from total carbohydrate. To construct the categorical variables, carbohydrate intake (% of energy) was also classified into two groups according to the median carbohydrate intake of this population.
DNA isolation and genotype analysis
DNA was isolated from blood (Qiagen, Hilden, Germany). For the Mediterranean population, we performed the genotyping for CRY1 rs2287161 using a TaqMan assay with allele-specific probes on the ABI Prism 7900HT Sequence Detection System (Applied Biosystems, Foster City, CA). For the North American population, genome-wide genotyping was conducted by using Affymetrix Genome-Wide Human Single Nucleotide Polymorphism (SNP) Array 6.0 and MACH (Markov Chain-based haplotyper V1.0.16, Ann Arbor, MI; http://www.sph.umich.edu/csg/abecasis/MaCH/, MACH 1.0, Nov.18, 2012) was used to impute the rs2287161 autosomal SNP using the phased haplotypes for CEU from HapMap (release 22, build 36) as a reference panel (high imputation quality: R2=0.7) (Li et al., 2010). The imputed SNP genotype was determined by categorizing the SNP dosage into three groups using 0.66 and 1.33 for cutoff values. Genotype frequencies were consistent with Hardy–Weinberg equilibrium in both populations.
SNPs in the CRY1 locus were examined in silico for a potential function in relevant tissues through modulation of transcription factor binding, expression quantitative trait loci (eQTL) or mRNA splicing. The rs2287161 locus was selected for this analysis because of its allele-specific disruption of transcription factor binding, as predicted by the tool RegulomeDB (Stanford, CA) (Boyle et al., 2012).
Statistical analyses
We applied analysis of variance and Student’s t test to compare crude means. Normality of continuous variables was examined. Natural logarithmic transformations were applied to HOMA-IR, insulin and glucose values. We tested different genetic inheritance models, and a recessive model was applied in the final analyses for CRY1 rs2287161; therefore, major G allele carriers (CG + GG) were compared against minor C allele homozygotes (CC).
First, we assessed for associations between CRY1 rs2287161 and our outcomes of interest using multivariate linear regression models including main effects term. To study gene–diet interactions, we further included interaction terms in our models. Carbohydrate intake was considered dichotomously in the interaction models. We fitted separate models for each population including the same variables for the interaction terms and for the multivariate adjustments. In the Mediterranean population, the analyses were adjusted for sex, age, BMI, study number and clinic location. In the North American population, self-reported diabetic (n=60) and non-white (n=6) individuals were excluded from the analyses to achieve homogeneity between the two populations, and analyses were adjusted for sex, age, BMI, center location and family structure. All statistical analyses were performed using R statistical software (v. 3.0.0, Vienna, Austria). A two-tailed p value of <0.05 was considered statistically significant.
Meta-analyses
We conducted inverse variance-weighted, fixed effects meta-analyses meta-analysis for the interaction between the CRY1 rs2287161 variant and carbohydrate intake on fasting insulin and glucose, and two insulin-related traits, HOMA-IR and QUICKI, using METAL (University of Michigan, Center for Statistical Genetics, Ann Arbor, MI; www.sph.umich.edu/csg/abecasis/metal/) (Willer et al., 2010). Cohort-specific interaction analyses included in the meta-analysis were adjusted for age, sex, BMI and other cohort-specific adjustments. Carbohydrate intake was expressed categorically. The sample size for the interaction analysis on HOMA-IR was 1482. Heterogeneity across studies was tested using Cochran’s Q statistic and quantified by using the I2 statistic. Statistical significance was defined at a level of 0.0125, based on Bonferroni correction for four total interaction tests.
RESULTS
General characteristics of participants in both the Mediterranean (n=728) and North American (n=820) populations are listed in Table 1. Briefly, the Mediterranean population was generally younger and had a higher prevalence of obesity than the North American population. Differences between these populations were also found in the dietary carbohydrate intake, with a higher total carbohydrate intake (g/day) and percentage of carbohydrate intake found in the North American population. Significant differences were also evident in fasting insulin and fasting glucose measures, with a healthier pattern evident in the Mediterranean population, although tobacco and alcohol use was much higher than in the North American population. The frequency of rs2287161 SNP was similar in both populations.
TABLE 1.
General characteristics of participants in both populations.
| Characteristics/measures | Mediterranean (n = 728)
|
North American (n = 754)
|
||
|---|---|---|---|---|
| M | SD | M | SD | |
| Age (years) | 39.3 | 12.4 | 48.3 | 15.9 |
| Sex (% female) | 81.5% | 50.0% | ||
| BMI (kg/m2) | 31.2 | 5.5 | 28.5 | 5.5 |
| Waist (cm) | 101.8 | 15.1 | 97.1 | 16.4 |
| HOMA-IR | 2.03 | 2.31 | 3.6 | 2.5 |
| QUICKI | 0.38 | 0.002 | 0.33 | 0.02 |
| Triglycerides (mg/dL) | 104.1 | 56.4 | 154.1 | 103.1 |
| Total cholesterol (mg/dL) | 195.4 | 37.8 | 192.6 | 39.8 |
| Fasting insulin (mU/L) | 8.92 | 8.2 | 14.1 | 8.3 |
| Fasting glucose (mg/dL) | 82.3 | 15.2 | 102.0 | 19.7 |
| Dietary intake | ||||
| Total energy (kcal/day) | 2077 | 716 | 2134 | 1261 |
| Proteins (% total energy) | 17.2 | 4.4 | 15.7 | 2.9 |
| Proteins (g/day) | 71.6 | 40.0 | 83.3 | 47.3 |
| Carbohydrates (% total energy) | 41.6 | 10.5 | 48.8 | 5.5 |
| Carbohydrates (g/day) | 151.5 | 79.0 | 256.8 | 145.7 |
| Fiber (g/day) | 18.8 | 11.4 | 19.1 | 10.5 |
| Fats (% total energy) | 42.4 | 9.5 | 35.4 | 7.0 |
| Fats (g/day) | 88.2 | 45.1 | 85.1 | 53.2 |
| MUFA (% total fat) | 19.3 | 6.4 | 13.3 | 2.9 |
| PUFA (% total fat) | 4.7 | 1.7 | 7.7 | 2.2 |
| SFA (% total fat) | 10.4 | 4.0 | 11.8 | 2.7 |
| Other characteristics | n | % | n | % |
|
| ||||
| BMI ≥ 30 kg/m2 | 380 | 52.2 | 282 | 34.4 |
| Drinkers | 440 | 75.6 | 407 | 49.6 |
| Smokers | 165 | 22.7 | 67 | 8.2 |
| Sedentary | 332 | 45 | 288 | 35.1 |
| CRY1 (rs2287161) | ||||
| CC | 182 | 25.0 | 220 | 26.8 |
| CG | 333 | 45.7 | 391 | 47.7 |
| GG | 213 | 29.3 | 209 | 25.5 |
HOMA-IR, homeostasis model assessment-estimated insulin resistance; QUICKI, quantitative insulin sensitivity check index; MUFA, monounsaturated fatty acids; PUFA, polyunsaturated fatty acids; SFA, saturated fatty acids; BMI, body mass index; M, mean; and SD, standard deviation.
Cohort-specific interaction analyses: Mediterranean population
Consistent with previous findings, no significant associations were evident between the CRY1 locus and fasting insulin, glucose and two insulin-related traits (p>0.05). We identified a significant differential effect across the genotypes at the CRY1 locus on HOMA-IR (p=0.004) when individuals were dichotomized into high and low carbohydrate intake groups based on the median carbohydrate intake (>41.65% vs <41.65%) (Figure 1). Among individuals homozygous for the minor C allele (CC), high carbohydrate intake was associated with a greater HOMA-IR as compared with low carbohydrate intake (p=0.002). Further adjustment for BMI did not modify the statistical significance of this interaction (p=0.010) (Table 2). However, regardless of carbohydrate intake, no significant differences in HOMA-IR were evident among carriers of the major G allele (GG + CG) (p=0.980). This CRY1 variant also showed significant interaction with carbohydrate intake for fasting insulin (p=0.007) and IS (QUICKI) (p=0.013), while no significant interaction was found between CRY1 rs2287161 and carbohydrate intake for fasting glucose (p=0.637).
FIGURE 1.
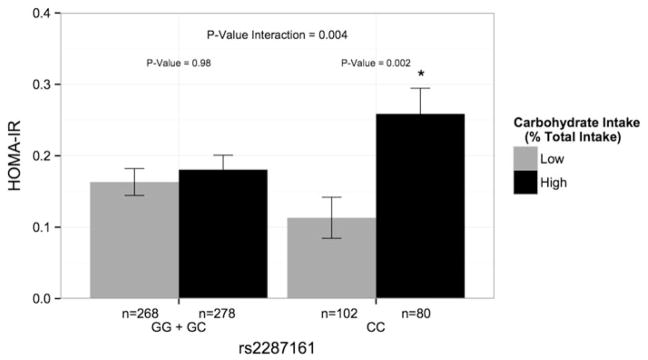
Gene–diet interaction for HOMA-IR in the Mediterranean population. Mean (± SE) HOMA-IR by CRY1 rs2287161 genotype according to total carbohydrate (% of total energy) intakes below and above the population median (41.65% of total energy). Allele was modeled recessively and estimated means were adjusted for age, sex, study number and clinic location. HOMA-IR, homeostasis model assessment-estimated insulin resistance.
TABLE 2.
Interactions between CRY1 variant (rs2287161) and carbohydrate intake (% of total energy) on glucose and insulin-related outcomes in two populations: Mediterranean and North American.
| Outcomec | Mediterranean (n = 728)a
|
North American (n = 754)b
|
Meta-analysis (n = 1482)
|
||||||
|---|---|---|---|---|---|---|---|---|---|
| β | SE | p Value | β | SE | p Value | β | SE | p Value | |
| HOMA-IRd | 0.12 | 0.047 | 0.010 | 0.0040 | 0.0023 | 0.074 | 0.0040 | 0.0016 | 0.011 |
| QUICKIe | −0.19 | 0.007 | 0.013 | −0.0003 | 0.00021 | 0.12 | −0.0003 | 0.0002 | 0.028 |
| Fasting insulin (mU/L) | 0.12 | 0.04 | 0.007 | 0.0040 | 0.0021 | 0.056 | 0.0040 | 0.0015 | 0.007 |
| Fasting glucose (mg/dL) | 0.011 | 0.023 | 0.637 | 0.00019 | 0.0011 | 0.862 | 0.0002 | 0.0008 | 0.806 |
Recessive model, adjusted for age, sex, BMI, study number and clinic location. Carbohydrate intake (% of total energy) dichotomized based on median intake.
Recessive model, adjusted for age, sex, BMI, center location and family structure. Carbohydrate intake (% of total energy) dichotomized based on median intake.
Natural logarithmic transformations were applied to HOMA-IR, fasting insulin and glucose to achieve normality.
HOMA-IR=[fasting glucose (mmol/l) × fasting insulin (mU/mL)]/22.5; HOMA-IR, homeostasis model assessment-estimated insulin resistance.
QUICKI=1/[log(fasting insulin (μU/mL)) + log(fasting glucose (mg/dl))]; QUICKI, quantitative insulin sensitivity check index.
Cohort-specific interaction analyses: North American population
To evaluate the plausibility of our findings, we investigated these interactions in a North American population. When dichotomized into high and low carbohydrate intake groups based on the median carbohydrate intake (>49.14% vs <49.14%), the identified differential effect across the genotypes at the CRY1 locus on HOMA-IR was marginally significant (p=0.074) (Table 2). Marginal significance was also evident on fasting insulin (p=0.056) and IS (QUICKI) (p=0.12), while no significance was evident for fasting glucose (p=0.86) (Table 2). However, when considered continuously, we identified a significant interaction between the CRY1 locus and carbohydrate intake on predicted HOMA-IR, consistent with that of the Mediterranean population (p=0.035) (Figure 2). Specifically, a greater carbohydrate intake was associated with greater HOMA-IR only among minor C homozygotes (CC) (p=0.009). These differences did not reach statistical significance among major G allele carriers (GG + CG) (p=0.360) (Figure 2). Moreover, we further identified significant interactions on fasting insulin (p=0.024) and IS (QUICKI) (p=0.024) but not on fasting glucose (p=0.762).
FIGURE 2.
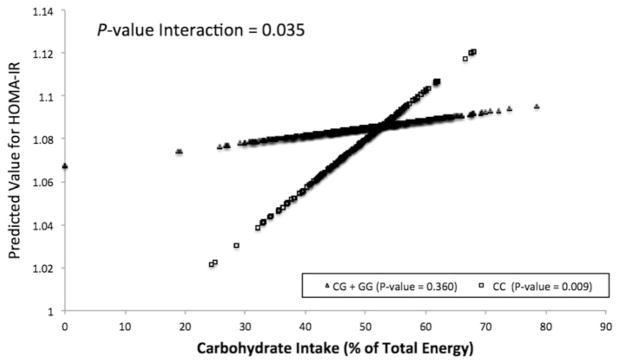
Gene–diet interaction for HOMA-IR in the North American population. Predicted values of HOMA-IR according to CRY1 rs2287161 genotype plotted against carbohydrate intake (% of total energy) evaluated continuously. Predicted values for HOMA-IR (natural log) were calculated from the regression model after adjustment for age, sex, BMI, center location and family structure. p Values indicate the statistical significance of the interaction term in the adjusted regression model, the statistical significance of the adjusted regression coefficient in the regression line corresponding to CRY1 minor allele homozygotes and the statistical significance of the adjusted regression coefficient in the regression line to carriers of the CRY1 major allele. HOMA-IR, homeostasis model assessment- estimated insulin resistance.
Meta-analyses of carbohydrate-SNP interactions on diabetes-related outcomes
Meta-analyzed estimates of CRY1 interaction with carbohydrate intake evaluated dichotomously on insulin-related traits are listed in Table 2. The CRY1 locus showed significant interactions with carbohydrate intake on insulin-related outcomes including HOMA-IR (p=0.011) (Figure 3), QUICKI (p=0.028) and fasting insulin (p=0.007). Significance of these interactions remained following Bonferroni correction for multiple comparisons (p<0.0125). However, there was no significant interaction on fasting plasma glucose concentrations (p=0.806). Tests for heterogeneity across studies did not reveal significant heterogeneity between the two populations for this outcome (p>0.05).
FIGURE 3.
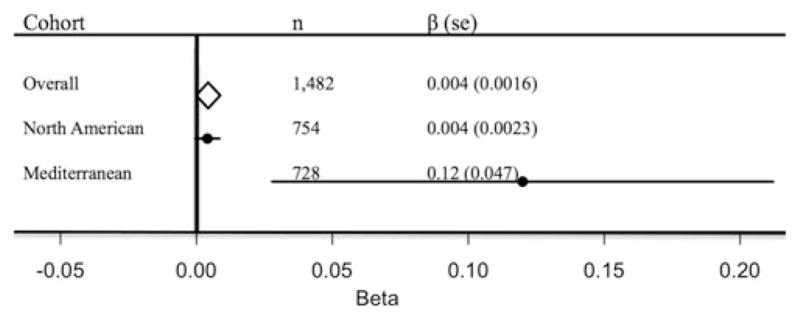
Forest plot of the interaction between CRY1 variant (rs2287161) and carbohydrate intake (% of total energy) for HOMA-IR in two independent populations. Allele modeled recessively and carbohydrate intake (% of total energy) was evaluated dichotomously. Cohort-specific interaction analyses adjusted for age, sex, BMI and cohort-specific covariates. The estimate from each cohort study is indicated by a filled circle and the horizontal line represents the 95% CI. The overall summary estimate and its 95% CI are indicated by the open diamond.
DISCUSSION
Our study has identified a novel interaction between the CRY1 rs2287161 SNP, carbohydrate intake and glucose metabolism using fasting glucose and insulin and two insulin-related traits, HOMA-IR and QUICKI, as outcomes. Moreover, the initial finding in the Mediterranean population is supported by its replication in an independent population. An increase in the proportion of carbohydrate intake led to a significant increase in HOMA-IR, fasting insulin and a decrease in QUICKI exclusively among participants homozygous for the minor C allele. Therefore, our data support that genetic variation at core clock genes, specifically CRY1, interacts with type 2 diabetes susceptibility factors (i.e. carbohydrate intake) to modulate IR and type 2 diabetes risk.
Other core clock genes have also been implicated in glucose metabolism, possibly due to the circadian system’s putative influence on IS via glucose and lipid metabolism (Jordan & Lamia, 2013; Prokopenko et al., 2009; Scott et al., 2008; Woon et al., 2007). This is the case of a variant near CRY2 that was found to be associated with elevated fasting glucose in humans (Liu et al., 2011). In addition, genetic variants within CLOCK, ARNTL1 and MTNRB1 have been associated with IR or type 2 diabetes. The lack of a direct association between rs2287161 and these traits suggests plausible interactions with environmental factors.
Moreover, genetic factors have also been identified as potential sources of variability in IS in response to carbohydrate intake, including those in the ADRB2 and PLIN1 genes (Corella et al., 2006; Martínez et al., 2003; Smith et al., 2012). Therefore, while it has been previously shown that diets higher in carbohydrate are associated with elevated insulin concentrations and decreased IS, these previously identified loci, along with the CRY1 locus, appear to modulate the contribution of dietary carbohydrate toward greater insulin resistance (Corella et al., 2006; Smith et al., 2012). The recognition of these interactions offers the potential to identify personalized modifiable lifestyle changes to reduce the risk of insulin resistance and type 2 diabetes (Ordovas & Corella, 2004).
Evidence from mouse knockdown studies supports the role of both CRY1 and CRY2 in regulating gluconeogenesis (Zhang et al., 2010). This regulation is possibly mediated through Cry1/2 temporal regulation of glucagon signaling, which triggers CREB phosphorylation thereby activating it (Hatori & Panda, 2010). Transcriptionally active p-CREB then drives the transcription of several important gluconeogenic genes, including PCK1 (encoding PEPCK) and G6PC (encoding G6Pase). These genes play integral roles in hepatic gluconeogenesis. Therefore, it is plausible that factors affecting the expression of CRY1/2 could impair hepatic regulation of glucose homeostasis through regulation of these regulatory genes and thus increase risk for diabetes in humans.
The exact mechanism by which the rs2287161 may contribute to the observed interaction is unknown. This variant was previously identified to be significantly associated with other common circadian disruption phenotypes (Soria et al., 2010). In addition, evidence from CHIP-seq experiments suggests that the variant is likely to disrupt the binding of transcription factors across multiple cell types (Raney et al., 2011). In human adipocytes, this allelic disruption impedes E2F4 transcription factor from binding, preventing H3K56 acetylation and thereby affecting transcriptional regulation of nearby genes (Lo et al., 2011). Results from a genomewide profile of H3K56 acetylation indicate that the highest level of H3K56 acetylation is associated with proteins in the type 2 diabetes pathways (Lo et al., 2011). Similarly, it is predicted that this variant hinders the regulatory function of RFX5, a regulatory transcription factor that is under circadian control in HepG2 cells (Boyle et al., 2012; Hughes et al., 2009). RFX5 binding is required for the transcriptional regulation of nearby genes in different cell types (Sengupta et al., 2002; Villard et al., 2000). Consequently, rs2287161 could effectively alter the expression of CRY1 in liver, resulting in gluconeogenesis dysregulation.
Accumulating evidence also suggests that core clock genes constituting the negative limb of the circadian system, such as the cryptochromes, reduce glucose output by the liver and insulin secretion by the pancreas (Bass, 2010). These findings are consistent with our results as the CRY1 rs2287161 is predicted to alter CRY1 regulation. Moreover, the lack of a proxy SNP for this CRY1 variant at r2>0.25 in the CEU population (Johnson et al., 2008) implies that either the rs2287161 itself or a rare undetected variant confers these allele-specific characteristics.
Major strengths of this investigation are the consistency of the findings across two independent populations and their potential clinical significance. Generally, the replication of gene–diet interactions is uncommon due to multiple factors inherent in cohort experimental designs and biological complexity. Nevertheless, the results from the meta-analyses showed consistent interactions, with no heterogeneity, between the two studies. These interactions remained significant following Bonferroni correction for multiple testing, despite the high correlations among the outcomes of interest.
Limitations to this investigation include the use of cross-sectional data, which limit interpretation of the link between the CRY1 variant and glucose metabolism. Longitudinal epidemiologic studies and biochemical experimentally based research are required to elucidate and strengthen the findings from this study. Despite its putative role in affecting transcription factor-binding site, as suggested by CHIP-seq experiments, there is no evidence yet from expression quantitative trait loci (cis-eQTL) analyses to suggest that the CRY1 variant influences the rhythmicity of CRY1 expression across relevant tissues including liver, muscle and adipose tissue. Furthermore, whether this interaction relates to changes in CRY1 circadian rhythmicity has not been explored. In addition, the pathway linking dietary carbohydrate intake to this circadian gene is unknown. Future studies need to clarify the exact function of the CRY1 variant in disrupting the transcription factor-binding region, and the role of carbohydrate intake, which may contribute to the development of potential future, targets for intervention.
In summary, this study revealed an interaction between a CRY1 variant and carbohydrate intake for glucose metabolism. This novel and replicated gene–diet interaction should foster more mechanistic research to precisely identify the molecular mechanisms elucidating the observed results. Moreover, this knowledge may be applied to clinical practice and contribute to personalized therapies for the prevention and treatment of metabolic disorders.
Acknowledgments
We acknowledge the participants and staff in the Mediterranean and North American cohorts for their important contributions. H. S. D. analyzed data and wrote the manuscript. D. K. A. and J. M. O. designed and conducted the research. C. E. S. and Y.-C. L. wrote the manuscript. L. D. P. and C.-Q. L. designed the research and wrote the manuscript. M. G. designed and conducted the research, wrote the manuscript and was primarily responsible for the final content. All authors read and approved the final manuscript. M. G. is the guarantor of this work.
Footnotes
DECLARATION OF INTEREST
The authors declare no conflict of interest. This study was supported by grants from Tomás Pascual and Pilar Gómez-Cuétara Foundations, Spanish Government of Science and Innovation (BFU2011-24720), Séneca Foundation from the Government of Murcia (15123/PI/10). National Heart, Lung, and Blood Institute grants HL-54776, National Institute of Diabetes and Digestive and Kidney Diseases, Grant Number DK075030 and by contracts 53-K06-5-10 and 58-1950-9-001 from the US Department of Agriculture Research. C. Smith is supported by K08 HL112845.
References
- Ahn J, Yu K, Stolzenberg-Solomon R, et al. Genome-wide association study of circulating vitamin D levels. Hum Mol Genet. 2010;19:2739–45. doi: 10.1093/hmg/ddq155. [DOI] [PMC free article] [PubMed] [Google Scholar]
- Bass J. High glucose, no cry. Nat Med. 2010;16:1074–6. doi: 10.1038/nm1010-1074. [DOI] [PubMed] [Google Scholar]
- Bouatia-Naji N, Bonnefond A, Cavalcanti-Proença C, et al. A variant near MTNR1B is associated with increased fasting plasma glucose levels and type 2 diabetes risk. Nat Genet. 2009;41:89–94. doi: 10.1038/ng.277. [DOI] [PubMed] [Google Scholar]
- Boyle AP, Hong EL, Hariharan M, et al. Annotation of functional variation in personal genomes using RegulomeDB. Genome Res. 2012;22:1790–7. doi: 10.1101/gr.137323.112. [DOI] [PMC free article] [PubMed] [Google Scholar]
- Corella D, Qi L, Tai ES, et al. Perilipin gene variation determines higher susceptibility to insulin resistance in Asian women when consuming a high-saturated fat, low-carbohydrate diet. Diabetes Care. 2006;29:1313–19. doi: 10.2337/dc06-0045. [DOI] [PubMed] [Google Scholar]
- Duguay D, Cermakian N. The crosstalk between physiology and circadian clock proteins. Chronobiol Int. 2009;26:1479–513. doi: 10.3109/07420520903497575. [DOI] [PubMed] [Google Scholar]
- Dupuis J, Langenberg C, Prokopenko I, et al. New genetic loci implicated in fasting glucose homeostasis and their impact on type 2 diabetes risk. Nat Genet. 2010;42:105–16. doi: 10.1038/ng.520. [DOI] [PMC free article] [PubMed] [Google Scholar]
- Garaulet M, Lee Y-C, Shen J, et al. CLOCK genetic variation and metabolic syndrome risk: Modulation by monounsaturated fatty acids. Am J Clin Nutr. 2009;90:1466–75. doi: 10.3945/ajcn.2009.27536. [DOI] [PMC free article] [PubMed] [Google Scholar]
- Hatori M, Panda S. CRY links the circadian clock and CREB-mediated gluconeogenesis. Cell Res. 2010;20:1285–8. doi: 10.1038/cr.2010.152. [DOI] [PubMed] [Google Scholar]
- Higgins M, Province M, Heiss G, et al. NHLBI Family Heart Study: Objectives and design. Am J Epidemiol. 1996;143:1219–28. doi: 10.1093/oxfordjournals.aje.a008709. [DOI] [PubMed] [Google Scholar]
- Hughes ME, DiTacchio L, Hayes KR, et al. Harmonics of circadian gene transcription in mammals. PLoS Genet. 2009;5:e1000442. doi: 10.1371/journal.pgen.1000442. [DOI] [PMC free article] [PubMed] [Google Scholar]
- Johnson AD, Handsaker RE, Pulit SL, et al. SNAP: A web-based tool for identification and annotation of proxy SNPs using HapMap. Bioinformatics. 2008;24:2938–9. doi: 10.1093/bioinformatics/btn564. [DOI] [PMC free article] [PubMed] [Google Scholar]
- Jordan SD, Lamia KA. AMPK at the crossroads of circadian clocks and metabolism. Mol Cell Endocrinol. 2013;366:163–9. doi: 10.1016/j.mce.2012.06.017. [DOI] [PMC free article] [PubMed] [Google Scholar]
- Katz A, Nambi SS, Mather K, et al. Quantitative insulin sensitivity check index: A simple, accurate method for assessing insulin sensitivity in humans. J Clin Endocrinol Metab. 2000;85:2402–10. doi: 10.1210/jcem.85.7.6661. [DOI] [PubMed] [Google Scholar]
- Li Y, Willer CJ, Ding J, et al. MaCH: Using sequence and genotype data to estimate haplotypes and unobserved genotypes. Genet Epidemiol. 2010;34:816–34. doi: 10.1002/gepi.20533. [DOI] [PMC free article] [PubMed] [Google Scholar]
- Liu C, Li H, Qi L, et al. Variants in GLIS3 and CRY2 are associated with type 2 diabetes and impaired fasting glucose in Chinese Hans. PLoS One. 2011;6:e21464. doi: 10.1371/journal.pone.0021464. [DOI] [PMC free article] [PubMed] [Google Scholar]
- Lo KA, Bauchmann MK, Baumann AP, et al. Genome-wide profiling of H3K56 acetylation and transcription factor binding sites in human adipocytes. PLoS One. 2011;6:e19778. doi: 10.1371/journal.pone.0019778. [DOI] [PMC free article] [PubMed] [Google Scholar]
- Major JM, Yu K, Wheeler W, et al. Genome-wide association study identifies common variants associated with circulating vitamin E levels. Hum Mol Genet. 2011;20:3876–83. doi: 10.1093/hmg/ddr296. [DOI] [PMC free article] [PubMed] [Google Scholar]
- Martínez JA, Corbalán MS, Sánchez-Villegas A, et al. Obesity risk is associated with carbohydrate intake in women carrying the Gln27Glu beta2-adrenoceptor polymorphism. J Nutr. 2003;133:2549–54. doi: 10.1093/jn/133.8.2549. [DOI] [PubMed] [Google Scholar]
- Meyer KA, Kushi LH, Jacobs DR, et al. Carbohydrates, dietary fiber, and incident type 2 diabetes in older women. Am J Clin Nutr. 2000;71:921–30. doi: 10.1093/ajcn/71.4.921. [DOI] [PubMed] [Google Scholar]
- Mondul AM, Yu K, Wheeler W, et al. Genome-wide association study of circulating retinol levels. Hum Mol Genet. 2011;20:4724–31. doi: 10.1093/hmg/ddr387. [DOI] [PMC free article] [PubMed] [Google Scholar]
- Ordovas JM, Corella D. Nutritional genomics. Annu Rev Genomics Hum Genet. 2004;5:71–118. doi: 10.1146/annurev.genom.5.061903.180008. [DOI] [PubMed] [Google Scholar]
- Pérez-Llamas F, Garaulet M, Herrero F, et al. Multivalent informatics application for studies of the nutritional status of the population. Assessment of food intake. Nutr Hosp. 2004;19:160–6. [PubMed] [Google Scholar]
- Portaluppi F, Smolensky MH, Touitou Y. Ethics and methods for biological rhythm research on animals and human beings. Chronobiol Int. 2010;27:1911–29. doi: 10.3109/07420528.2010.516381. [DOI] [PubMed] [Google Scholar]
- Prokopenko I, Langenberg C, Florez JC, et al. Variants in MTNR1B influence fasting glucose levels. Nat Genet. 2009;41:77–81. doi: 10.1038/ng.290. [DOI] [PMC free article] [PubMed] [Google Scholar]
- Quintero JE, Kuhlman SJ, McMahon DG. The biological clock nucleus: A multiphasic oscillator network regulated by light. J Neurosci. 2003;23:8070–6. doi: 10.1523/JNEUROSCI.23-22-08070.2003. [DOI] [PMC free article] [PubMed] [Google Scholar]
- Raney BJ, Cline MS, Rosenbloom KR, et al. ENCODE whole-genome data in the UCSC genome browser (2011 update) Nucleic Acids Res. 2011;39:D871–5. doi: 10.1093/nar/gkq1017. [DOI] [PMC free article] [PubMed] [Google Scholar]
- Sánchez-Moreno C, Ordovas JM, Smith CE, et al. APOA5 gene variation interacts with dietary fat intake to modulate obesity and circulating triglycerides in a Mediterranean population. J Nutr. 2011;141:380–5. doi: 10.3945/jn.110.130344. [DOI] [PMC free article] [PubMed] [Google Scholar]
- Schibler U, Ripperger J, Brown SA. Peripheral circadian oscillators in mammals: Time and food. J Biol Rhythms. 2003;18:250–60. doi: 10.1177/0748730403018003007. [DOI] [PubMed] [Google Scholar]
- Scott EM, Carter AM, Grant PJ. Association between polymorphisms in the Clock gene, obesity and the metabolic syndrome in man. Int J Obes (Lond) 2008;32:658–62. doi: 10.1038/sj.ijo.0803778. [DOI] [PubMed] [Google Scholar]
- Sengupta PK, Fargo J, Smith BD. The RFX family interacts at the collagen (COL1A2) start site and represses transcription. J Biol Chem. 2002;277:24926–37. doi: 10.1074/jbc.M111712200. [DOI] [PubMed] [Google Scholar]
- Shen J, Arnett DK, Peacock JM, et al. Interleukin1beta genetic polymorphisms interact with polyunsaturated fatty acids to modulate risk of the metabolic syndrome. J Nutr. 2007;137:1846–51. doi: 10.1093/jn/137.8.1846. [DOI] [PubMed] [Google Scholar]
- Shi S-Q, Ansari TS, McGuinness OP, et al. Circadian disruption leads to insulin resistance and obesity. Curr Biol. 2013;23:372–81. doi: 10.1016/j.cub.2013.01.048. [DOI] [PMC free article] [PubMed] [Google Scholar]
- Smith CE, Arnett DK, Corella D, et al. Perilipin polymorphism interacts with saturated fat and carbohydrates to modulate insulin resistance. Nutr Metab Cardiovasc Dis. 2012;22:449–55. doi: 10.1016/j.numecd.2010.09.003. [DOI] [PMC free article] [PubMed] [Google Scholar]
- Soria V, Martínez-Amorós E, Escaramís G, et al. Differential association of circadian genes with mood disorders: CRY1 and NPAS2 are associated with unipolar major depression and CLOCK and VIP with bipolar disorder. Neuropsychopharmacology. 2010;35:1279–89. doi: 10.1038/npp.2009.230. [DOI] [PMC free article] [PubMed] [Google Scholar]
- Subar AF, Thompson FE, Kipnis V, et al. Comparative validation of the Block, Willett, and National Cancer Institute food frequency questionnaires: The Eating at America’s Table Study. Am J Epidemiol. 2001;154:1089–99. doi: 10.1093/aje/154.12.1089. [DOI] [PubMed] [Google Scholar]
- Turek FW, Joshu C, Kohsaka A, Lin E. Obesity and metabolic syndrome in circadian Clock mutant mice. Science. 2005;308:1043–5. doi: 10.1126/science.1108750. [DOI] [PMC free article] [PubMed] [Google Scholar]
- Villard J, Peretti M, Masternak K, et al. A functionally essential domain of RFX5 mediates activation of major histocompatibility complex class II promoters by promoting cooperative binding between RFX and NF-Y. Mol Cell Biol. 2000;20:3364–76. doi: 10.1128/mcb.20.10.3364-3376.2000. [DOI] [PMC free article] [PubMed] [Google Scholar]
- Willer CJ, Li Y, Abecasis GR. METAL: Fast and efficient meta-analysis of genomewide association scans. Bioinformatics. 2010;26:2190–1. doi: 10.1093/bioinformatics/btq340. [DOI] [PMC free article] [PubMed] [Google Scholar]
- Woon PY, Kaisaki PJ, Bragança J, et al. Aryl hydrocarbon receptor nuclear translocator-like (BMAL1) is associated with susceptibility to hypertension and type 2 diabetes. Proc Natl Acad Sci USA. 2007;104:14412–7. doi: 10.1073/pnas.0703247104. [DOI] [PMC free article] [PubMed] [Google Scholar]
- Zhang EE, Liu Y, Dentin R, et al. Cryptochrome mediates circadian regulation of cAMP signaling and hepatic gluconeogenesis. Nat Med. 2010;16:1152–6. doi: 10.1038/nm.2214. [DOI] [PMC free article] [PubMed] [Google Scholar]
- Zheng J-S, Arnett DK, Parnell LD, et al. Genetic variants at PSMD3 interact with dietary fat and carbohydrate to modulate insulin resistance. J Nutr. 2013;143:354–61. doi: 10.3945/jn.112.168401. [DOI] [PMC free article] [PubMed] [Google Scholar]