Abstract
Background
Bronchial airway expression profiling has identified inflammatory subphenotypes of asthma, but invasiveness of this technique has limited its application to childhood asthma.
Objectives
To determine if the nasal transcriptome can proxy expression changes in the lung airway transcriptome in asthma. To determine if the nasal transcriptome can distinguish subphenotypes of asthma.
Methods
Whole transcriptome RNA-sequencing (RNA-seq) was performed on nasal airway brushings from 10 controls and 10 subjects with asthma, which was compared to established bronchial and small airway transcriptomes. Targeted RNA-seq nasal expression analysis was used to profile 105 genes in 50 subjects with asthma and 50 controls for differential expression and clustering analyses.
Results
We found 90.2% overlap in expressed genes and strong correlation in gene expression (ρ=0.87) between the nasal and bronchial transcriptomes. Previously observed asthmatic bronchial differential expression was strongly correlated with asthmatic nasal differential expression (ρ=0.77, p=5.6×10⁻⁹). Clustering analysis identified Th2-high and Th2-low subjects differentiated by expression of 70 genes including IL-13, IL-5, POSTN, CLCA1, and SERPINB2. Th2-high subjects were more likely to have atopy (O.R.=10.3, p=3.5×10⁻⁶), atopic asthma (OR=32.6, p=6.9×10⁻⁷), high blood eosinophils (OR=9.1, 2.6×10⁻⁶), and rhinitis (OR=8.3, p=4.1×10⁻⁶) compared to Th2-low subjects. Nasal IL-13 expression levels were 3.9-fold higher in asthmatic participants who experienced asthma exacerbation in the past year (p=0.01). Several differentially expressed nasal genes were specific to asthma and independent of atopic status.
Conclusion
Nasal airway gene expression profiles largely recapitulate expression profiles in the lung airways. Nasal expression profiling can be used to identify individuals with IL13-driven asthma and a Th2-skewed systemic immune response.
Clinical Implications
Nasal airway gene expression profiling can be used to easily identify the Th2-high subphenotype of asthma in children and also other genes dyregulated in the asthmatic airway but independent of atopic status.
Keywords: Nasal Airway Epithelium, Transcriptome, Th2, Asthma, Bronchial Airway Epithelium
INTRODUCTION
Asthma is the most common chronic childhood disease, affecting ~8.7 million children in the United States, and is characterized by chronic inflammation in the airways leading to reversible airway obstruction1. Microarray-based expression profiling of bronchial airway epithelium brushings has revealed multiple genes whose expression is dysregulated in adult asthma2. These studies found a pattern of Th2-driven inflammation that was characterized by expression of calcium-activated chloride channel regulator 1 (CLCA1), periostin (POSTN), and serpin peptidase inhibitor, clade B (SERPINB2)2, 3. This so-called “Th2-high” pattern was restricted to a subgroup (~50%) of the asthmatics screened, reflective of the known phenotypic heterogeneity of asthma3. The Th2-high subphenotype appeared to have clinical significance due to its association with improved inhaled corticosteroid response, higher IgE levels, and higher peripheral blood eosinophils3. Given that there are multiple novel biologic compounds targeting 4, 5 components of the Th2 inflammatory pathway16,17, the ability to profile expression changes in the asthma-affected airway would be valuable not only in elucidating the pathogenesis of asthma but also for predicting and monitoring response to therapy and tailoring individual treatment regimens. However, carrying out bronchoscopy for evaluation of endotype and response to therapy would be invasive. An alternative to bronchial brushings would increase the practical utility of such findings especially in children.
Similar to the bronchial airway epithelium, the nasal airway epithelium is populated by basal, ciliated, and secretory epithelial cells6. As such the nasal airway presents an easily accessible alternative to the bronchial airway that may reflect much of the dysfunction present in the asthmatic bronchial airway. Supporting this, analysis of expression for ~2300 genes in nasal and bronchial airway brushings indicated a close relationship between these two airway sites7. Furthermore, a small study indicated gene expression profiles were altered in the nasal brushings of subjects with asthma versus healthy controls8. Finally, children experiencing asthma exacerbations exhibited altered gene expression in the nasal airway compared to children whose asthma was stable8.
In this study we used high-depth whole transcriptome sequencing to comprehensively determine the degree to which the nasal airway serves as a biologic proxy for the bronchial airway. We also used novel targeted RNA-sequencing technology to profile gene expression of candidate airway biomarkers in a larger group of well-characterized children with asthma and healthy controls. These data were used to determine the relationship between the nasal transcriptome and subphenotypes of asthma.
METHODS
Subject Recruitment
Study subjects are a randomly selected subset of Puerto Rico islanders that were recruited as part of the ongoing Genes environments & Admixture in Latino Americans (GALA II) study described elsewhere9–11. Of the 100 study subjects who participated in this study 92 were re-contacted from their original GALA II study visit. Asthma was defined by physician diagnosis and the presence of two or more symptoms of coughing, wheezing, or shortness of breath in the 2 years prior to enrollment. Asthma exacerbations were defined by self-report of a subject having asthma symptoms requiring an emergency room visit. Atopy was defined by plasma testing with the Phadiatop Inhalant Multi-allergen Immunocap12 as a qualitative outcome. All study subjects had no history of smoking or recent nasal steroid use (within 4 weeks of recruitment). The study was approved by local institutional review boards, and written assent/consent was received from all subjects and their parents.
Nasal Brushing Collection and RNA Extraction
Methods for nasal epithelial cell collection and processing were developed in collaboration with the NIH/NIAID-sponsored Inner City Asthma Consortium, optimizing for collection and confirmation of columnar epithelial cell type, RNA yield, and specimen collector training. Briefly, nasal epithelial cells were collected from behind the inferior turbinate with a cytology brush using a nasal illuminator (Figure E1). The collected brush was submerged in RLT Plus lysis buffer plus beta-mercaptoethanol and frozen at -80 C until extraction. (See Online Repository Methods)
Whole Transcriptome Gene Expression and Tissue Comparison
RNA-seq libraries from 10 atopic asthmatics and 10 non-atopic controls were constructed and barcoded with the Illumina Tru Seq RNA Sample Preparation v2 protocol. Barcoded RNA-seq libraries from each of the 20 individuals were pooled and sequenced as 2×100bp paired-ends across two flow cells of an Illumina HiSeq 2000. Reads were mapped with Tophat (v2.0.6), quantified with Cufflinks (v2.0.2), and differential expression determined by Cuffdiff13–15. Hierarchical clustering of samples was done using the CummeRbund package (v2.0.0)16. Bronchial epithelial and small airway epithelium RNA-seq data sets were downloaded from the Sequence Read Archive. (See Online Repository Methods)
RNA Ampliseq Analysis
RNA Ampliseq libraries were prepared with a 105 gene multiplex design and sequenced using the Ion Torrent Proton on three P1 chips. Read counts mapping to target transcripts were tabulated using the torrent mapping alignment program (TMAP) and a Life Technologies in-house pipeline. Differential expression analysis was performed using the non-parametric SAMseq17 method available in the samr R package. High eosinophil count was tested as a dichotomous trait based on whether the subject’s eosinophil percentage was above their predicted normal range. Hierarchical clustering and heatmaps were generated with Spearman rank correlation coefficient for genes and random forest proximity metrics for sample clustering. (See Online Repository Methods)
Statistical Methods
All statistical analyses outside of the bioinformatics programs were performed in the R statistical package and are detailed in the Online Repository Methods.
RESULTS
Whole Transcriptome Gene Expression Signatures of the Nasal Airway Epithelium Mirror the Bronchial Airway Epithelium
We performed whole transcriptome sequencing of nasal airway epithelium brushings from 10 non-atopic controls and 10 atopic asthmatics (Table I). Sequencing resulted in an average of 1.1×10⁸ (+/− 4×10⁷) reads mapped per subject (Table EI). Mapped reads were used to generate FPKM gene expression levels, which revealed 16,148 expressed genes in the healthy nasal transcriptome (Table E1, Figure E2). We accessed publically available transcriptome sequencing data to generate transcriptomes for the healthy bronchial and lung small airways (6th generation airways) for comparison with our healthy nasal transcriptome18, 19. We removed 7,331 ubiquitously expressed genes from each airway data set, which were defined by expression in a diverse panel of 23 human and murine cell types and tissues20. This resulted in 8,828, 9,007, and 10,745 non-ubiquitously expressed genes in the nasal, bronchial, and small airway transcriptomes, respectively. Examining the overlap of the non-ubiquitously expressed nasal and bronchial genes we found that 90.2% of the genes expressed in the bronchial samples were also present in the nasal airway transcriptome (Figure 1A). This was only slightly lower than the overlap with small airway epithelium, which expressed 95.9% of the non-ubiquitous bronchial transcriptome (Figure 1B). In fact, the nasal transcriptome contained 78.7% of the genes expressed in the more distal small airway transcriptome (Figure 1C,D).
Table I.
Clinical data for subjects included in the nasal whole transcriptome and Ampliseq expression studies
| WTS | Ampliseq | |||||
|---|---|---|---|---|---|---|
| Control | Asthmatic | p-value | Control | Asthmatic | p-value | |
| Sample Size | 10 | 10 | 50 | 50 | ||
| Age | 15.2 ± 2.8 | 15.2 ± 2.5 | 0.991 | 15.3 ± 2.8 | 15.0 ± 3.1 | 0.682 |
| Gender (M/F) | 5/5 | 7/3 | 22/28 | 30/20 | ||
| FEV1 %-pred | 83.4–112.2 (92.1) | 68.8–92.7 (79.0) | 0.0003 | 83.2–126.9 (98.8) | 83.4 ± 16.9 | 2.62e-11 |
| Eosinophils* | L: 0.9–8.2 (2.7) H: 1.5–8 (5.8) |
L: 1.3–13.4 (4.7) H: 0.7-0.7 (0.7) (n=8) |
L: 0.159 H: 0.500 |
L: 0.2–11.6 (2.8) H: 0.5–8.6 (2.4) |
L: 0.7–15.6 (6.2) H: 0.7–14.7 (3.6) (n=45) |
L: 0.010 H: 0.226 |
| IgE† | 23.4–219.0 (38.2) | 17.4–2034.5 (158.7) (n=9) |
0.095 | 4.9–2999.6 (114.6) (n=47) |
8.6–2992.9 (182.5) (n=45) |
0.154 |
| Phadiatop (+/−) | 0/10 | 10/0 | 30/20 | 37/12 | ||
| Ancestry ‡ | (n=39) | (n=45) | ||||
| African | 0.12–0.51 (0.29) | 0.07–0.19 (0.15) | 0.001 | 0.08–0.51 (0.22) | 0.07–0.49 (0.19) | 0.693 |
| European | 0.43–0.74 (0.59) | 0.66–0.83 (0.73) | 0.001 | 0.43–0.84 (0.68) | 0.43–0.83 (0.69) | 0.534 |
| N. American | 0.06–0.14 (0.10) | 0.08–0.16 (0.11) | 0.247 | 0.06–0.22 (0.11) | 0.07–0.25 (0.11) | 0.917 |
All values are presented as either mean ± SD with P values calculated using a two-sided t-test, or when non-Normal as min-max (median) with P-values calculated by two-sided Wilcoxon Mann-Whitney rank test. Sample sizes differing from “Sample Size” row are noted.
Data categories are divided into low (L) and high (H) indicating normal ranges of 0.0–4.0 and 0.0–7.0, respectively.
Figure 1. Comparison of non-ubiquitous gene expression between airway tissues.
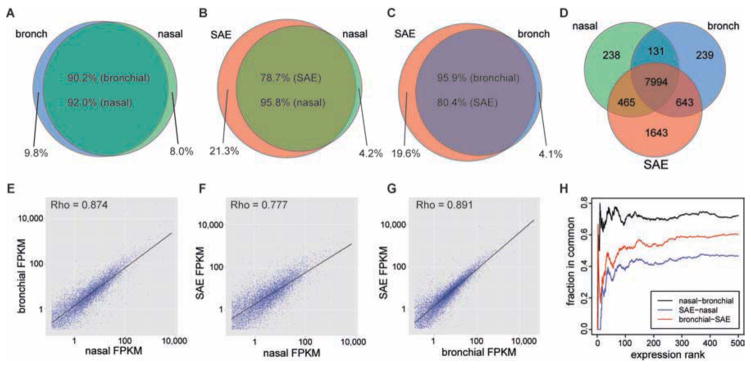
Overlap of expressed genes between nasal-bronchial (A), nasal-SAE (B), bronchial-SAE (C), and between all tissues (D). Scatter plot of mean expression levels for genes commonly expressed between nasal-bronchial (E), nasal-SAE (F), bronchial-SAE (G). Correspondence-at-top plot for the top 500 genes ranked by expression level from highest to lowest for each tissue (H).
We next examined whether expression levels of these genes were correlated between the different airway sites. We found a high correlation (ρ=0.87) between the nasal and bronchial transcriptomes, which was similar to the correlation between the bronchial and small airway transcriptomes (ρ=0.89) (Figure 1E,G). Strong correlation was also observed between nasal and small airway transcriptomes (ρ=0.78) (Figure 1F). Lastly, we examined concordance between the three data sets among the 500 most highly expressed genes. We found 72% overlap of these genes between nasal/bronchial airways, 60% between bronchial/small airways, and 47% between nasal/small airways (Figure 1H). Taken together, these results demonstrate that the composition and structure of the bronchial and lung small airway transcriptome is closely mirrored by that of the nasal airway.
The nasal airway transcriptome is altered in atopic asthma and expression changes reflect asthmatic differential expression in the bronchial airway
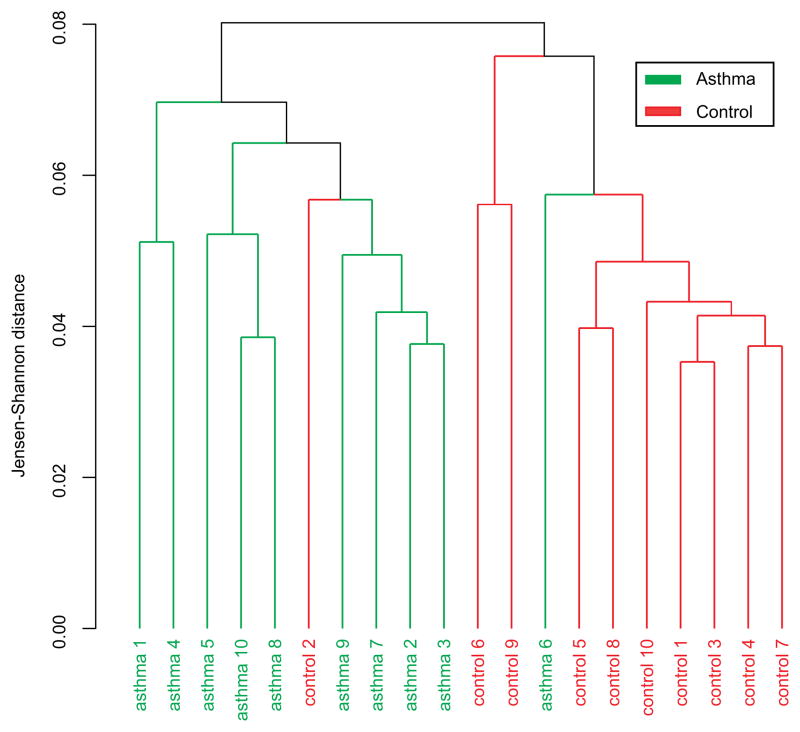
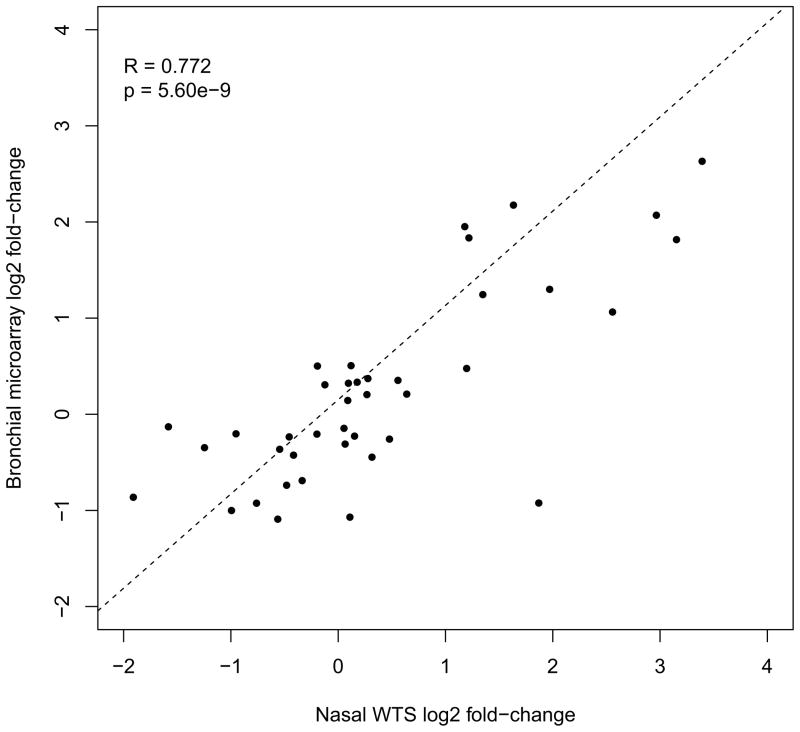
We performed an unsupervised cluster analysis of the entire nasal transcriptome data set to determine if nasal expression could be used to segregate the 10 atopic asthmatics from the 10 non-atopic healthy controls. Clustering using Jensen-Shannon distance separated asthmatics from controls, with only one outlier sample in each of two top-level clusters (Figure 2). We then performed an uncorrected analysis of differential expression for all gene transcripts to identify individual gene transcripts that might be driving the separate clustering of asthmatics, for later confirmation in a larger set of subjects. The 50 genes with the largest differential expression statistic are listed in Table EII. The gene with the lowest p value for differential expression was carboxypeptidase A3 (CPA3), a mast cell gene product. Interestingly, CPA3 was previously identified as the second most differentially expressed gene in the bronchial airway of subjects with asthma2. Therefore, we examined the ability of nasal airway expression to recapitulate the expression pattern in the bronchial airway of subjects with asthma. This was done by comparing the fold changes of the top 20 over- and under-expressed genes in the bronchial airway of subjects with asthma to the fold changes of these genes in the nasal airway of subjects with asthma2. Despite differences in expression platforms (microarray vs. RNA-seq), the direction and magnitude of fold-changes for these 40 bronchial genes were strongly correlated with the asthmatic fold-changes for these genes in our nasal data (ρ=0.77, p=5.6×10⁻⁹, Figure 3). These results suggest that the nasal airway gene expression profile is altered in asthma and that these changes are reflective of those observed in the bronchial airway of subjects with asthma.
Figure 2. Unsupervised clustering of subjects with atopic asthma and healthy controls using nasal transcriptome expression levels.
FPKM expression levels for all genes in the nasal whole transcriptome sequencing data were used for clustering.
Figure 3. Comparison of gene expression fold-changes in asthma between bronchial and nasal airway expression data for bronchial airway biomarker genes.
Scatter plot of previously reported bronchial airway gene expression log2 fold-changes in asthma, for the top 20 up- and down-regulated genes, versus the fold-changes in asthma for these genes in the nasal airway transcriptome data. Linear regression best-fit line shown.
Targeted RNA-seq of the nasal airway epithelium reveals a Th2 pattern associated with atopic asthma
We used targeted RNA-seq (Ampliseq) technology to quantitate expression of 105 genes (Table EIII). The Ampliseq assay included three gene groups: (1) we targeted the top 50 differentially expressed nasal genes in asthma for confirmation of our whole transcriptome sequencing; (2) the top 20 over- and 10 under-expressed genes in the asthmatic bronchial epithelium according to the study by Woodruff et al2, to validate the ability of nasal airway expression to proxy bronchial airway expression biomarkers of asthma; (3) to provide genetic and biological context, we targeted a select set of 29 “asthma candidate genes,” defined as such by being either implicated in Genome-wide Association Studies (GWAS) of asthma, other asthma genetic studies, or implicated in mechanistic studies of asthma.
We performed the Ampliseq assay in a larger group of Puerto Rican children with asthma (n=50) and controls (n=50) (Table I). To validate both gene expression methods, the 20 whole transcriptome subjects were a subset of these 100 subjects (Figure E3). These subjects were characterized by high rates of atopy in both cases (75.5%) and controls (60%). Additionally, we found that 62% of subjects with asthma and 14% of non-asthmatics self-reported rhinitis. The heterogeneity among both subjects with and without asthma in terms of these allergic phenotypes allowed us to investigate their relationship with nasal gene expression.
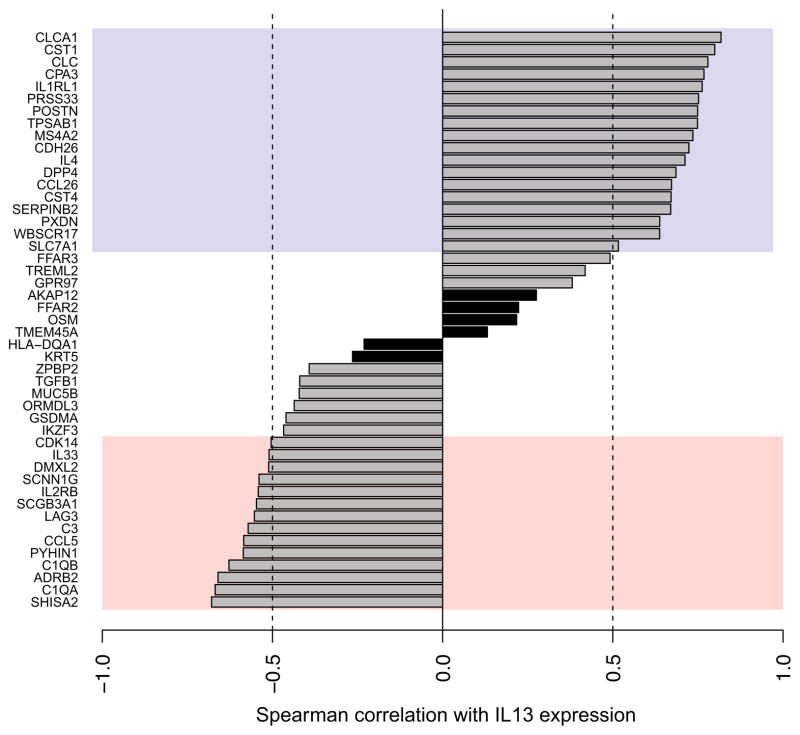
At our sequencing depth (1.3×10⁶ reads/sample), we were able to detect expression in the nasal airway for 103 of the 105 genes screened. The Ampliseq assay had the sensitivity to measure rare cytokine transcripts such as IL13, IL4, and IL5, which have been below detection level in prior microarray-based studies of bronchial airway gene expression2. We found that 48 of the 105 genes assayed were differentially expressed in asthma after correction for multiple testing, including 26 over- and 22 under-expressed genes (Table EIII). We note that 17 genes or 57% of the bronchial differential expression set screened, were also significantly differentially expressed in the nasal airways, strongly suggesting that gene expression among children with asthma is altered similarly in the bronchial and nasal airways (Table EIV). Among the differentially expressed genes we noted epithelial genes (e.g. POSTN, CLCA1, SERPINB2, DPP4, CST1, CST4) and mast cell genes (e.g. TPSAB1, MSA42, CPA3). The cardinal Th2 cytokine, IL13, was upregulated in children with asthma. IL-13 was shown in-vitro to drive upregulation of several genes differentially expressed in the bronchial epithelium of subjects with asthma. Therefore, we leveraged our ability to measure IL13 transcripts in the airway to examine the correlation between IL13 transcription levels and the other 47 differentially expressed genes in-situ. We found that 18 of the 26 upregulated genes exhibited a strong positive correlation (ρ>0.5) with IL13 levels, while 14 of the 22 downregulated genes exhibited a strong negative correlation (ρ<−0.5) with IL13 levels (Figure 4). Moreover, examining asthma severity, we found nasal IL13 levels were 3.9-fold higher (p=0.01) in subjects who experienced an asthma exacerbation in the past year versus those who did not (Figure E4). These data suggest that differential expression at both epithelial sites (nasal and bronchial) is orchestrated in common by an underlying Th2/IL-13 skew in the systemic immune system.
Figure 4. Correlation between Ampliseq nasal gene expression of IL13 and the other 47 genes differentially expressed in asthma.
Genes are ranked from top to bottom by decreasing Spearman correlation coefficient (ρ). Purple and pink regions correspond to levels of high positive (ρ > 0.5) and negative (ρ < −0.5) correlation, respectively. Significant IL13 correlations=clear bars, Non-significant IL13 correlations=black bars.
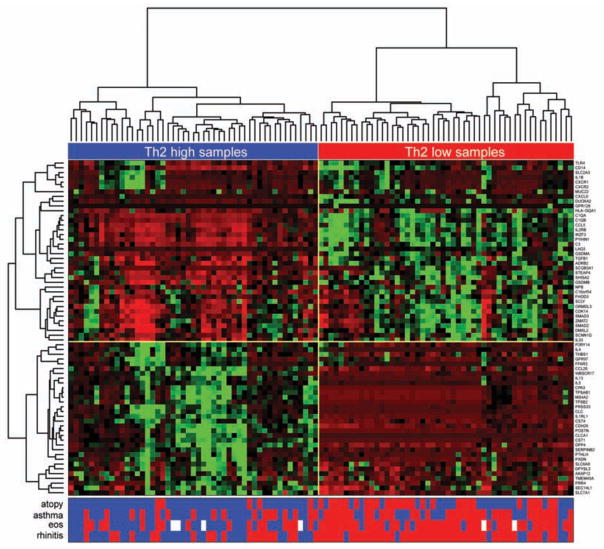
To investigate this idea we tested the genes for differential expression by atopic status, a measure of systemic Th2 immune system skew. We found 70 of the 103 expressed genes were differentially expressed by atopic status. We used hierarchical clustering of these 70 genes in all subjects to determine gene relationships and examine clustering of subjects with varying asthma and allergic status. The first branching point separated Th2-high (IL13 high) from Th2-low (IL13 low) subjects (Figure 5). The odds ratio for atopy, regardless of asthma status, was 10.33 among subjects with a Th2-high expression pattern (p=3.5×10⁻⁶). We also found 9.1-fold increased odds for high blood eosinophils among subjects with a Th2-high pattern, another measure of systemic Th2 skew (p=2.6×10⁻⁶). Self-reported rhinitis also clustered tightly with the Th2-high pattern (O.R.=8.3, p=4.1×10⁻⁶). Overall, 42 of the 48 differentially expressed genes in asthma were among the 70 differentially expressed genes in atopy suggesting that the atopic asthmatic subgroup was driving the majority of the differentially expressed genes by asthma status. The odds ratio for atopic asthma among subjects with a Th2-high pattern was 32.6 compared to non-atopic healthy controls (p=6.9×10⁻⁷).
Figure 5. Clustering of Ampliseq nasal gene expression levels in study subjects.
Clustering was generated using relative nasal expression levels for the 70 genes differentially expressed in atopy (n=99). Heatmap represents normalized expression counts (red=low; green=high) for each gene. The subject presence (blue) or absence (red) of atopy, asthma, eosinophil levels, and rhinitis are displayed directly below the heatmap. White squares=missing data.
Asthma-specific and Th2-independent gene expression in the nasal transcriptome
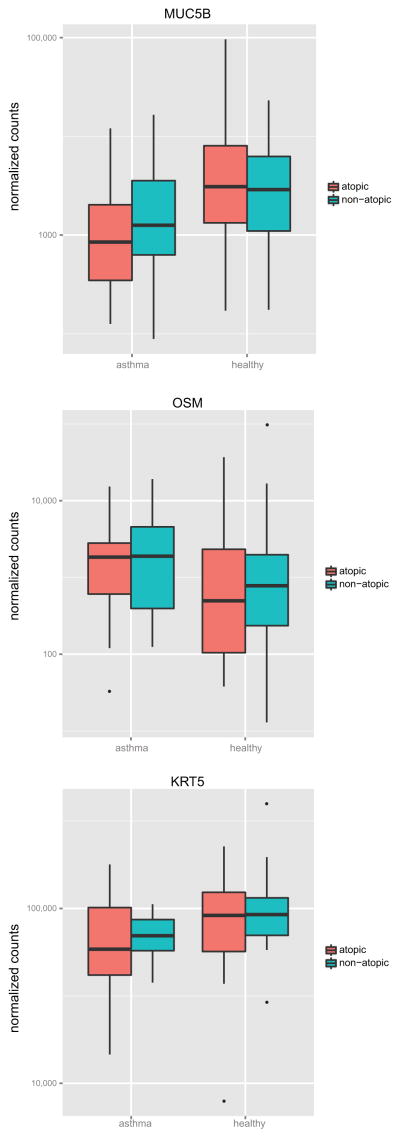
In contrast, six genes (cytokeratin-5 (KRT5), mucin 5b (MUC5B), zona pellucida binding protein 2 (ZPBP2), triggering receptor expressed on myeloid cells-like 2 (TREML2), oncostatin M (OSM), free fatty acid receptor 2 (FFAR2)) were associated with asthma and not atopy. None of these six genes were strongly correlated with IL-13 levels (0.5 > r > −0.5) (Figure 4). Differential expression in these genes was driven by both atopic and non-atopic subjects with asthma (Figure 6).
Figure 6. Boxplots of genes differentially expressed in asthma but not atopy in the nasal airway.
Ampliseq normalized expression counts for 3 of the 6 genes (MUC5B, OSM, KRT5) differential expressed in asthma but not atopy (+1 pseudocount and log10 scale) are plotted according to subject asthma and atopy status.
Asthma GWAS genes differentially expressed in Nasal Airway Epithelium
We were able to detect gene expression in the nasal airway brushings of all 16 asthma GWAS genes screened with the Ampliseq assay. We found nasal expression of 9 (56.3%) and 11 (68.8%) of these candidate genes were associated with asthma and atopy, respectively. The genes and their fold-changes in expression are listed in Table EV. Among the differentially expressed genes verified through large GWAS meta-analyses were the cytokine IL-33 and its receptor, IL1RL1 (ST2). Expression of IL1RL1 was strongly upregulated in both atopy and asthma, whereas IL-33 was downregulated in both of these groups.
The 17q21 asthma GWAS risk locus contains 5 genes. In the nasal Ampliseq assay we found ORMDL3 and GSDMB were highly expressed, IKZF3 moderately expressed, and GSDMA and ZPBP2 were lowly expressed. We found ORMDL3, IKZF3, and GSDMA were all downregulated in both atopic and asthmatics subjects. ZPBP2 and GSDMB were downregulated in just asthmatic and atopic subjects, respectively.
DISCUSSION
Transcriptional profiling of the bronchial airways has shown Th2 inflammation is present in only ~50% of subjects with asthma revealing the phenotypic heterogeneity of asthma3. Bronchial airway gene expression changes are associated with inhaled corticosteroid response2, clinical characteristics like eosinophil levels21, and have identified candidate genes (e.g. CLCA122) that upon further study have increased understanding of asthma pathogenesis.
However, the widespread application of these methods and findings to childhood asthma in large research studies and eventually clinical practice is impeded by the safety, expense, and time limitations presented by obtaining bronchoscopy brushings in children. In this study we used high-depth whole transcriptome sequencing to prove nasal airway brushings can perform as an excellent proxy for bronchial airway brushings in children with asthma. We found that over 90% of non-ubiquitous transcripts expressed in the bronchial airway are also expressed in the nasal airway, with strong correlation between expression of the two transcriptomes. The correlation in gene expression between the nasal and lung small airways was also strong, indicating that the nasal airways can also serve as a good surrogate for the bronchial and small airways. Our results confirm and extend to a whole transcriptome level the observations of prior studies, which reported large similarities in bronchial and nasal expression of surface receptor genes23, and a subset of bronchial genes examined by microarray7. Strikingly, we found unsupervised clustering of the nasal whole transcriptome data resulted in near complete separation of atopic asthmatics from healthy controls, an exciting result which will need to be confirmed in additional populations.
We demonstrate an IL-13 centric Th2 inflammation in the nasal airways of subjects with asthma that is analogous to the Th2 inflammation previously observed in the bronchial airways. The largest study of differential gene expression in the asthmatic bronchial airways identified a clear pattern of Th2-driven inflammation marked by the IL-13 responsive genes POSTN, CLCA1, and SERPINB2. We found both IL13 and these IL-13 responsive genes were all differentially expressed among subjects with asthma in our large targeted RNA-seq screen of the nasal airways. Moreover, 68% of the genes we associated with asthma in the targeted RNA-seq screen were strongly correlated with IL13 levels. Finally, we found the direction and fold-change of the top 40 differentially expressed genes in the bronchial airways was mirrored by our nasal transcriptome differential expression results.
As expected nasal Th2 inflammation was associated with rhinitis, but we found 17 Th2-high subjects had atopy but not rhinitis, showing the nasal signature is not just a manifestation of rhinitis, but rather a risk factor for rhinitis. We speculate that the common pattern of Th2 inflammation in both the bronchial and nasal airways is driven by an underlying Th2 skew systemic immune system. Supporting this, both atopy status and blood eosinophils levels were strongly associated with the Th2-high pattern of nasal gene expression, regardless of asthma status. Moreover, the Th2-high nasal expression pattern was present in 64% of subjects with asthma and we found 29 of these 32 subjects were atopic. Likewise, the bronchial airway profiling study found a Th2-high expression pattern in 53% of subjects with asthma, which were characterized by higher IgE levels and both higher blood and bronchoalveolar lavage eosinophils. These results suggest that Th2 airway inflammation is a part of the mechanistic basis of asthma in atopic or more systemically allergic individuals.
Identification of Th2-high subjects is feasible by nasal brushings and could have great impact on both biomedical and clinical research. For example, the ability to stratify subjects with asthma by the presence of Th2 airway inflammation should create a more homogeneous group of subjects with regard to asthma pathogenesis and increase the power of future biomedical and clinical research studies. Moreover, this stratification would allow the search for the genetic determinants of non-Th2 driven asthma, for which little is known regarding disease pathogenesis. The fact that 9 of the 16 asthma GWAS genes tested were differentially expressed in the nasal epithelium suggest there may be a genetic basis to these disease subphenotypes. The potential clinical utility of the bronchial Th2 inflammation signature has been shown, as response to inhaled steroids was almost entirely restricted to the bronchial Th2-high subjects. Moreover, it is straightforward to imagine Th2-high airway status would be a highly relevant biomarker in Th2 targeted therapeutic trials. Supporting this, serum levels of periostin have recently been used as biomarker in clinical trial of an IL-13 inhibitor4. Finally, our association of nasal IL-13 levels with asthma exacerbations suggests nasal airway expression levels may be predictive of loss in asthma control and useful for clinical management. Although encouraging these retrospective results will need to be further evaluated in prospective studies to determine their true clinical utility.
Interestingly, we identified six genes that were differentially expressed in asthma and not atopy. This observation suggests that there exists dysregulation in nasal airway expression beyond Th2 inflammation that is relevant to both atopic and non-atopic asthma. Nasal expression of both KRT5, a marker of basal airway epithelial cells, and MUC5B, a marker of secretory cells, was downregulated in asthma. Changes in the expression of these genes may reflect airway remodeling of subjects with chronic asthma, characterized by changes in the cellular and mucosal composition of the airway. Nasal overexpression of the OSM gene supports this idea, as OSM gene and protein expression (an interleukin-6 family member) has previously been shown to be upregulated in the sputum of asthmatics with irreversible airway obstruction25.
In conclusion, we find the nasal airways are an excellent less-invasive proxy for the bronchial airways in transcriptional profiling studies. The pattern of Th2 inflammation in nasal airways is highly similar to the Th2 pattern observed in the bronchial airways of subjects with asthma. We find this Th2 airway inflammation signature is highly enriched in atopic asthmatics. These data clearly show the useful of nasal airway brushings for subphenotyping of children with asthma in both research and clinical settings.
Supplementary Material
Acknowledgments
Funding Sources: Supported in part by, UCSF Dissertation Year Fellowship, and NIH Training Grant T32 GM007175 (to CRG); National Institutes of Health (ES015794, A I077439, AI079139, AI061774, HL088133, HL078885, HL104608, HL079055, CA113710, and DK064695), the Sandler Foundation, the American Asthma Foundation, and the National Institute On Minority Health And Health Disparities of the National Institutes of Health (P60MD006902) (to EGB); Colorado Career Development in Genetics and Genomics of Lung Diseases (K12HL090147), In-kind research support for Ampliseq assays and sequencing was received from Life Technologies (to MAS).
The authors acknowledge the families and patients for their participation and thank the numerous health care providers and community clinics and schools for their support and participation in GALA II. In particular, the authors thank the study coordinator Sandra Salazar; the recruiters who obtained the data: Jaime Colon and Vivian Medina.
Abbreviations
- GALA II
Genes-environments and Admixture in Latino Americans
- RNA-seq
RNA sequencing
- TMAP
torrent mapping alignment program
- GWAS
Genome-wide Association Studies
Footnotes
Publisher's Disclaimer: This is a PDF file of an unedited manuscript that has been accepted for publication. As a service to our customers we are providing this early version of the manuscript. The manuscript will undergo copyediting, typesetting, and review of the resulting proof before it is published in its final citable form. Please note that during the production process errors may be discovered which could affect the content, and all legal disclaimers that apply to the journal pertain.
References
- 1.Prevention CfDCa, editor. National Health Interview Survey 2004–2011. National Center for Health Statistics; [Google Scholar]
- 2.Woodruff PG, Boushey HA, Dolganov GM, Barker CS, Yang YH, Donnelly S, et al. Genome-wide profiling identifies epithelial cell genes associated with asthma and with treatment response to corticosteroids. Proc Natl Acad Sci U S A. 2007;104:15858–15863. doi: 10.1073/pnas.0707413104. [DOI] [PMC free article] [PubMed] [Google Scholar]
- 3.Woodruff PG, Modrek B, Choy DF, Jia G, Abbas AR, Ellwanger A, et al. T-helper type 2-driven inflammation defines major subphenotypes of asthma. Am J Respir Crit Care Med. 2009;180:388–395. doi: 10.1164/rccm.200903-0392OC. [DOI] [PMC free article] [PubMed] [Google Scholar]
- 4.Corren J, Lemanske RF, Hanania NA, Korenblat PE, Parsey MV, Arron JR, et al. Lebrikizumab treatment in adults with asthma. N Engl J Med. 2011;365:1088–1098. doi: 10.1056/NEJMoa1106469. [DOI] [PubMed] [Google Scholar]
- 5.Wenzel S, Ford L, Pearlman D, Spector S, Sher L, Skobieranda F, et al. Dupilumab in persistent asthma with elevated eosinophil levels. N Engl J Med. 2013;368:2455–2466. doi: 10.1056/NEJMoa1304048. [DOI] [PubMed] [Google Scholar]
- 6.Harkema JR, Carey SA, Wagner JG. The nose revisited: a brief review of the comparative structure, function, and toxicologic pathology of the nasal epithelium. Toxicol Pathol. 2006;34:252–269. doi: 10.1080/01926230600713475. [DOI] [PubMed] [Google Scholar]
- 7.Sridhar S, Schembri F, Zeskind J, Shah V, Gustafson AM, Steiling K, et al. Smoking-induced gene expression changes in the bronchial airway are reflected in nasal and buccal epithelium. BMC Genomics. 2008;9:259. doi: 10.1186/1471-2164-9-259. [DOI] [PMC free article] [PubMed] [Google Scholar]
- 8.Guajardo JR, Schleifer KW, Daines MO, Ruddy RM, Aronow BJ, Wills-Karp M, et al. Altered gene expression profiles in nasal respiratory epithelium reflect stable versus acute childhood asthma. J Allergy Clin Immunol. 2005;115:243–251. doi: 10.1016/j.jaci.2004.10.032. [DOI] [PubMed] [Google Scholar]
- 9.Borrell LN, Nguyen EA, Roth LA, Oh SS, Tcheurekdjian H, Sen S, et al. Childhood obesity and asthma control in the GALA II and SAGE II studies. Am J Respir Crit Care Med. 2013;187:697–702. doi: 10.1164/rccm.201211-2116OC. [DOI] [PMC free article] [PubMed] [Google Scholar]
- 10.Kumar R, Nguyen EA, Roth LA, Oh SS, Gignoux CR, Huntsman S, et al. Factors associated with degree of atopy in Latino children in a nationwide pediatric sample: The Genes-environments and Admixture in Latino Asthmatics (GALA II) study. J Allergy Clin Immunol. 2013 doi: 10.1016/j.jaci.2013.02.046. [DOI] [PMC free article] [PubMed] [Google Scholar]
- 11.Nishimura KK, Galanter JM, Roth LA, Oh SS, Thakur N, Nguyen EA, et al. Early Life Air Pollution and Asthma Risk in Minority Children: The GALA II & SAGE II Studies. Am J Respir Crit Care Med. 2013 doi: 10.1164/rccm.201302-0264OC. [DOI] [PMC free article] [PubMed] [Google Scholar]
- 12.Szefler SJ, Wenzel S, Brown R, Erzurum SC, Fahy JV, Hamilton RG, et al. Asthma outcomes: biomarkers. J Allergy Clin Immunol. 2012;129:S9–23. doi: 10.1016/j.jaci.2011.12.979. [DOI] [PMC free article] [PubMed] [Google Scholar]
- 13.Kim D, Pertea G, Trapnell C, Pimentel H, Kelley R, Salzberg SL. TopHat2: accurate alignment of transcriptomes in the presence of insertions, deletions and gene fusions. Genome Biol. 2013;14:R36. doi: 10.1186/gb-2013-14-4-r36. [DOI] [PMC free article] [PubMed] [Google Scholar]
- 14.Trapnell C, Roberts A, Goff L, Pertea G, Kim D, Kelley DR, et al. Differential gene and transcript expression analysis of RNA-seq experiments with TopHat and Cufflinks. Nat Protoc. 2012;7:562–578. doi: 10.1038/nprot.2012.016. [DOI] [PMC free article] [PubMed] [Google Scholar]
- 15.Trapnell C, Williams BA, Pertea G, Mortazavi A, Kwan G, van Baren MJ, et al. Transcript assembly and quantification by RNA-Seq reveals unannotated transcripts and isoform switching during cell differentiation. Nat Biotechnol. 2010;28:511–515. doi: 10.1038/nbt.1621. [DOI] [PMC free article] [PubMed] [Google Scholar]
- 16.Goff L, Trapnell C, Kelley D. CummeRbund: Visualization and Exploration of Cufflinks High-throughput Sequencing Data. 2012. [Google Scholar]
- 17.Li J, Tibshirani R. Finding consistent patterns: A nonparametric approach for identifying differential expression in RNA-Seq data. Stat Methods Med Res. 2011 doi: 10.1177/0962280211428386. [DOI] [PMC free article] [PubMed] [Google Scholar]
- 18.Beane J, Vick J, Schembri F, Anderlind C, Gower A, Campbell J, et al. Characterizing the impact of smoking and lung cancer on the airway transcriptome using RNA-Seq. Cancer Prev Res (Phila) 2011;4:803–817. doi: 10.1158/1940-6207.CAPR-11-0212. [DOI] [PMC free article] [PubMed] [Google Scholar]
- 19.Hackett NR, Butler MW, Shaykhiev R, Salit J, Omberg L, Rodriguez-Flores JL, et al. RNA-Seq quantification of the human small airway epithelium transcriptome. BMC Genomics. 2012;13:82. doi: 10.1186/1471-2164-13-82. [DOI] [PMC free article] [PubMed] [Google Scholar]
- 20.Ramskold D, Wang ET, Burge CB, Sandberg R. An abundance of ubiquitously expressed genes revealed by tissue transcriptome sequence data. PLoS Comput Biol. 2009;5:e1000598. doi: 10.1371/journal.pcbi.1000598. [DOI] [PMC free article] [PubMed] [Google Scholar]
- 21.Bhakta NR, Solberg OD, Nguyen CP, Nguyen CN, Arron JR, Fahy JV, et al. A qPCR-based metric of Th2 airway inflammation in asthma. Clin Transl Allergy. 2013;3:24. doi: 10.1186/2045-7022-3-24. [DOI] [PMC free article] [PubMed] [Google Scholar]
- 22.Yurtsever Z, Sala-Rabanal M, Randolph DT, Scheaffer SM, Roswit WT, Alevy YG, et al. Self-cleavage of human CLCA1 protein by a novel internal metalloprotease domain controls calcium-activated chloride channel activation. J Biol Chem. 2012;287:42138–42149. doi: 10.1074/jbc.M112.410282. [DOI] [PMC free article] [PubMed] [Google Scholar]
- 23.McDougall CM, Blaylock MG, Douglas JG, Brooker RJ, Helms PJ, Walsh GM. Nasal epithelial cells as surrogates for bronchial epithelial cells in airway inflammation studies. Am J Respir Cell Mol Biol. 2008;39:560–568. doi: 10.1165/rcmb.2007-0325OC. [DOI] [PMC free article] [PubMed] [Google Scholar]
- 24.Kabesch M, Schedel M, Carr D, Woitsch B, Fritzsch C, Weiland SK, et al. IL-4/IL-13 pathway genetics strongly influence serum IgE levels and childhood asthma. J Allergy Clin Immunol. 2006;117:269–274. doi: 10.1016/j.jaci.2005.10.024. [DOI] [PubMed] [Google Scholar]
- 25.Simpson JL, Baines KJ, Boyle MJ, Scott RJ, Gibson PG. Oncostatin M (OSM) is increased in asthma with incompletely reversible airflow obstruction. Exp Lung Res. 2009;35:781–794. doi: 10.3109/01902140902906412. [DOI] [PubMed] [Google Scholar]
- 26.Moffatt MF, Gut IG, Demenais F, Strachan DP, Bouzigon E, Heath S, et al. A large-scale, consortium-based genomewide association study of asthma. N Engl J Med. 2010;363:1211–1221. doi: 10.1056/NEJMoa0906312. [DOI] [PMC free article] [PubMed] [Google Scholar]
- 27.Torgerson DG, Ampleford EJ, Chiu GY, Gauderman WJ, Gignoux CR, Graves PE, et al. Meta-analysis of genome-wide association studies of asthma in ethnically diverse North American populations. Nat Genet. 2011;43:887–892. doi: 10.1038/ng.888. [DOI] [PMC free article] [PubMed] [Google Scholar]
- 28.Li X, Howard TD, Zheng SL, Haselkorn T, Peters SP, Meyers DA, et al. Genome-wide association study of asthma identifies RAD50-IL13 and HLA-DR/DQ regions. J Allergy Clin Immunol. 2010;125:328–335. e311. doi: 10.1016/j.jaci.2009.11.018. [DOI] [PMC free article] [PubMed] [Google Scholar]
- 29.Gudbjartsson DF, Bjornsdottir US, Halapi E, Helgadottir A, Sulem P, Jonsdottir GM, et al. Sequence variants affecting eosinophil numbers associate with asthma and myocardial infarction. Nat Genet. 2009;41:342–347. doi: 10.1038/ng.323. [DOI] [PubMed] [Google Scholar]
- 30.Himes BE, Sheppard K, Berndt A, Leme AS, Myers RA, Gignoux CR, et al. Integration of mouse and human genome-wide association data identifies KCNIP4 as an asthma gene. PLoS One. 2013;8:e56179. doi: 10.1371/journal.pone.0056179. [DOI] [PMC free article] [PubMed] [Google Scholar]
- 31.Myers RA, Himes BE, Gignoux CR, Yang JJ, Gauderman WJ, Rebordosa C, et al. Further replication studies of the EVE Consortium meta-analysis identifies 2 asthma risk loci in European Americans. J Allergy Clin Immunol. 2012;130:1294–1301. doi: 10.1016/j.jaci.2012.07.054. [DOI] [PMC free article] [PubMed] [Google Scholar]
- 32.Gignoux CR, Torgerson DG, Galanter J, Roth I, Eng C, Hu D, et al. Admixture Mapping From Existing Genome-Wide Association Data Identifies SMAD2 As A Population-Specific Risk Factor For Asthma In Latinos. ATS Conference Abstract; 2013. [Google Scholar]
- 33.Hirota T, Takahashi A, Kubo M, Tsunoda T, Tomita K, Doi S, et al. Genome-wide association study identifies three new susceptibility loci for adult asthma in the Japanese population. Nat Genet. 2011;43:893–896. doi: 10.1038/ng.887. [DOI] [PMC free article] [PubMed] [Google Scholar]
Associated Data
This section collects any data citations, data availability statements, or supplementary materials included in this article.


