Abstract
A microfluidic system for cell culture and drug response studies was developed to elucidate the effects of hypoxia on drug susceptibility. Drug response studies were performed in prostate cancer cells and Ramos B cells under normoxic and hypoxic conditions. A vacuum actuated microfluidic culture device was used for cell culture and PC3 cells were cultured in the chip up to 16 hours. Cells were treated with several concentrations of staurosporine and apoptosis was assayed using the fluorescent probes MitoTracker Red and Annexin-V. For hypoxic samples, the chip was placed in a hypoxia chamber and pre-conditioned at <1% oxygen before inducing the cells with staurosporine. Cells exposed to 2 μM staurosporine were 32% ± 10% apoptotic under normoxic conditions but only 1.5% ± 12% apoptotic under hypoxic conditions. As little as 1 hour of hypoxic preconditioning increased drug resistance. Cell apoptosis correlated with drug dose, although in each case hypoxia reduced the apoptotic fraction significantly. Given the rapid nature of cell adaptation to hypoxia, this chip and analysis approach can be used to identify compounds that can induce cell death in hypoxic tumor cells rapidly.
Introduction
Resistance to chemotherapy has been identified as a significant problem in the treatment of cancer (1,2). The behavior and prognosis of malignant tumors are influenced by heterogeneities in tumor microenvironment (3,4). One of the critical features of the solid tumor environment is hypoxia (1–4). Inadequate or defective vasculature in the tumor mass leads to decreased oxygen concentration in a subset of tumor masses causing them to be hypoxic. Hypoxia can be acute or chronic depending upon the length of hypoxic periods (5,6). In chronic hypoxia, the distance of the blood vessel from the tumor creates low oxygen concentration within the tumor mass for several days whereas acute hypoxia is caused by the fluctuations of the oxygen concentration and it is more transient in nature. Hypoxia has been detected previously in human prostate cancer cells (7). Movsas and coworkers have used oxygen microelectrodes during surgery to detect the presence of hypoxic regions in prostate cancer (8). In another study, positron emission tomography (PET) was used to detect the regional hypoxia on various kinds of cancer (9). Reports on tumor hypoxia suggest that hypoxic adaptation should be considered in management of solid tumors (10,11,12). Hypoxia has been associated with resistance of cancer cells towards radiotherapy and chemotherapy (1–4). Resistance to therapy may be developed because of several factors such as direct lack of oxygen, altered cellular metabolism of drugs under hypoxic conditions, hypoxia-induced changes in cell cycle or via genetic instability (13,14,15). During the course of hypoxia, tumor cells may adapt to low oxygen levels by changing their gene expression pattern. The Hypoxia Inducible Factor (HIF-1) has been identified as one of the gene regulators during hypoxia (16,17,18). Studies performed on the efficacy of cancer drugs are usually carried out at a normal oxygen concentration which might not be a true indicator of effects of cancer therapies. Therefore, while testing cancer drugs, it is important to test on hypoxic cells.
Microfluidic platforms are amenable to cell based studies. Microfabricated devices provide an increase in temporal and spatial resolution and the throughput of analysis and at the same time are more cost effective than traditional culture systems (19,20). In the past, several in vitro drug response studies and gradient based drug studies have been performed in microfluidic devices (21,22,23). The temporal resolution of cellular assay increases greatly in a microfluidic system when compared to tissue sections or in vivo studies performed on animals. Microfabricated devices offer parallelization and high throughput drug screening at a shorter time (24,25,26). Also, microdevices can be integrated with several functionalities such as oxygen sensing (27,28,29). In the past, our group has used low-shear microfluidic device with oxygen sensing capability to study cardiomyocyte response towards ischemia/reperfusion injury (29). In that work, we demonstrated that reperfusion of oxygen triggers apoptosis in hypoxic cardiomyocytes.
In this paper, we used a vacuum actuated culture device to study the cellular response towards an anti-cancer agent under both normoxic and hypoxic conditions. The device has been used previously in our group for long-term culture of multiple cell lines and to study apoptosis of 4 different cell lines at the same time under normoxia (30). Vacuum actuation has been developed as a straightforward approach to cell loading in low-shear devices (31). In this work, we were able to deplete oxygen from the chip in under 5 minutes, allowing us to control the period of hypoxia. Oxygen sensing was achieved using fluorescence quenching of ruthenium dye. Our device was able to create a precise and independent control of oxygen and nutrients. Prostate cancer cells were cultured in a low-shear environment at 21% oxygen and at <1% oxygen concentrations. Mitochondrial membrane potential was measured after treating the cells with various doses of staurosporine. Our approach offered real time imaging of cells with improved temporal dynamics, identifying apoptotic cells as early as 1 hour after drug treatment. Our findings show that there is a significant difference in the response of cancer cells towards the same dose of the drug at normoxic vs. hypoxic conditions; at 2 μM drug concentration, cells at normoxic conditions were 20 times more depolarized than the cells at hypoxic condition at the first hour of drug treatment. Moreover, we show that even a short period (1 hour) of hypoxia is sufficient to enhance drug resistance in cancer cells.
Materials and Methods
Chip fabrication
Devices were fabricated using standard multilayer soft lithography procedures. The detailed description of device fabrication and operation is described in our previous work (30). The dimensions of the channels are given in Table E1 (see Supplementary Information). To fabricate devices, a 5:1 ratio mixture of PDMS pre-polymer and curing agent (Dow sylgard 184) was weighed and degassed to make the top layer (control layer). The mixture was then molded against the wafer and baked at 95 °C for 1 h. A 25:1 ratio was used for the bottom fluidic layer. The mixture was then poured onto the silicon wafer and spin-coated at 2000 rpm for 30 s. After baking at 70 °C for 30 min, the control layer was placed on top of the fluidic layer. The assembly was then baked at 120 °C for 2 h to form a seal. The resulting PDMS slab was then sealed onto a glass slide using oxygen plasma after punching holes for inlet and outlet connections. The device consisted of 256 culture chambers. The volume of each culture chamber was 5.7 nL and number of cells loaded into in each chamber varied from 10–50 cells.
Cell culture and loading
Human prostate cancer cells (PC3, ATCC CRL1435) were maintained in a culture flask in an incubator at 37 °C and 5% CO2. On the day of the experiment, cells were removed from the flask by trypsinization and stained with MitoTracker DeepRed (Invitogen) solution (150 μM in PBS) for 30 minutes at 37° C to measure mitochondrial membrane potential loss. For experiments of phosphatidylserine externalization, Mito Tracker Deep Red was not used. After washing once with PBS, the cells were resuspended in culture medium (RPMI + 10% FBS + 20mL Antibiotic) and kept in the incubator until the device was ready for loading. The chips were injected with the cell solution and vacuum pump was connected to the vacuum line. The vacuum pump was turned on and the cells were seeded in the side channels using vacuum actuation (30). Once all the chambers were filled with medium, the vacuum was turned off. The medium was then flowed into the chip at the rate of 0.1mL/hr, which was optimized in our previous work (30). At the flow-rate of 0.1mL/hr, the device has been shown to produce apoptosis response in the time span comparable to the Petri dish studies
Oxygen control
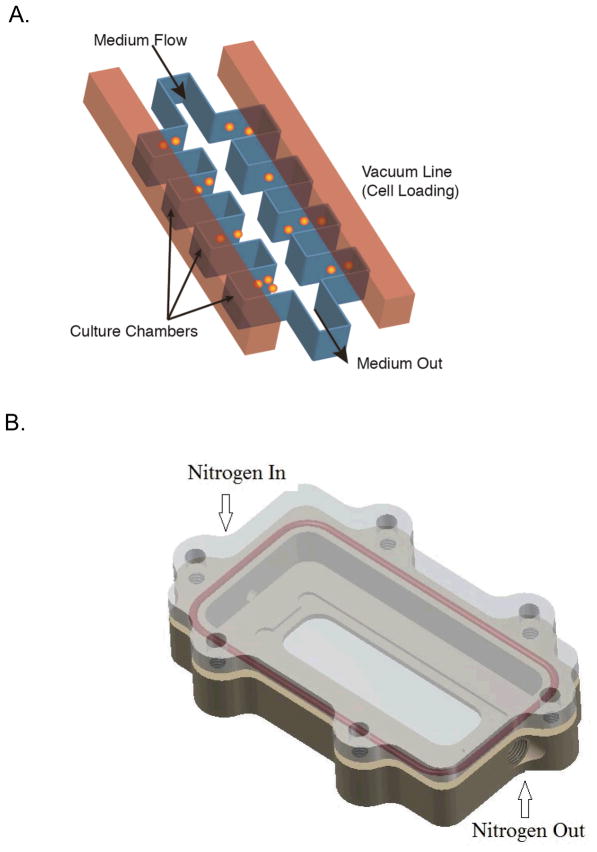
For chips where hypoxic conditions were produced, the chips were placed inside a small metal hypoxic chamber on the microscope stage. The bottom part of the chamber consisted of a rectangular opening and the top part was made of polycarbonate to facilitate cell imaging (Figure 1B). The chamber consisted of an inlet and outlet for nitrogen flow to displace oxygen and induce hypoxia. This setup allowed for rapid and precise control of the oxygen content on the chip. Fluorescence quenching of Tris(4,7-diphenyl-1,10-phenanthroline)- ruthenium(II) dichloride (250 μM) was used to monitor oxygen content in the chip at the inlet and the main channel. The calibration of the device is described in our previous work (29). A 3-point calibration was performed at 0%, 21% and 100% oxygen. The Stern-Volmer equation was used to convert fluorescence intensity to oxygen percentage. For the control experiment and the normoxic sample, the chip was placed on a heating stage maintained at 37 °C. For the hypoxic sample, the chip was placed in a hypoxic chamber which was then placed on the heating stage. Nitrogen was then flushed in the chamber to remove the oxygen. For the drug response studies, staurosporine in RPMI was flowed through the inlet in normoxic and hypoxic samples. Hypoxic samples were pre-conditioned without the drug under <1% oxygen for at least 1 hour before starting the flow of drug solution.
Figure 1.
Hypoxia Chip design (A). The multilayer device contains a bottom layer with identical, low-shear culture units. In this work, each unit has the same conditions. The upper layer contains vacuum channels to load cells into the culture units (ref. 30, 31). Cells were loaded by vacuum actuation into the culture units and constant medium flow maintained nutrients in the culture units. The chip is placed in a hypoxia chamber (B) to control oxygen concentrations in the chip. The chamber was placed on a heating stage and allowed for fluorescence and white light imaging. The medium flowing into the chip inlet was changed to introduce fluorescent probes when needed. For oxygen concentration measurements, the chip was filled with a solution of an oxygen-sensitive dye and fluorescence images were recorded.
Fluorescence microscopy and apoptosis study
MitoTracker Deep Red (MTDR) was used to assay membrane potential in PC3 cells and Ramos B cells. The loss of membrane potential as the mitochondria depolarized resulted in the release of MTDR from the mitochondria and a subsequent decrease in fluorescence. At each time frame, 3–9 culture chambers were analyzed (n = 30–150 cells. Cells were imaged on an inverted microscope (IX71, Olympus) with a 10X, 0.25 NA objective for white light and fluorescence images. A 200 W metal halide lamp (Prior Scientific) and filters appropriate for MTDR were used for fluorescence excitation and collection. Images were acquired with a 16-bit CCD camera (Orca, Hamamatsu) and processed in ImageJ software (National Institutes of Health). The exposure time was 50 ms. The intensities of cells induced with staurosporine at normoxic and hypoxic condition was measured as a function of time. Control experiments were performed without any drug. The mean intensities of control cells were used to set the threshold. Cells falling below (μ-3σ) were counted as depolarized cells, where μ is mean of the control fluorescence intensities and σ is the standard deviation. For the measurement of phosphatidylserine externalization, Annexin V-Alexa Fluor 647 (Invitrogen) was used in combination with the viability dye Sytox Green (Molecular Probes). For this experiment, cells were stained on chip after 8 hour long drug treatment by flowing the dye solution at 0.1ml/hr for 30 minutes. Cells stained positively with Annexin V-Alexa Fluor 647 and negatively with Sytox Green were counted as apoptotic and cells stained with both dyes positively were counted as dead.
Results and Discussion
Chip operation
The cell culture chip, shown in Figure 1A, was based on our previous vacuum actuated design (30). The bottom fluid layer and top control layer were separated by a thin PDMS layer. The gas permeability of PDMS led to facile cell loading and assisted in the removal of air bubbles. The air in each culture chamber was removed by the use of vacuum and resulted in cell loading at the same time. This kind of chip design has been previously shown to culture the cells up to 168 hours with >96% viability (29). For our experiment, we cultured prostate cancer cells (PC3) up to 16 hours in the chip. For the experiments involving hypoxia, the chip was placed in the hypoxic chamber (Figure 1B) to remove the oxygen and produce hypoxic condition for the cells. In the current study, we continuously created a hypoxic environment for the cells during the period of drug treatment. Hypoxic pre-conditioning was performed for multiple time frames, 1 hr, 4 hrs and 8 hrs.
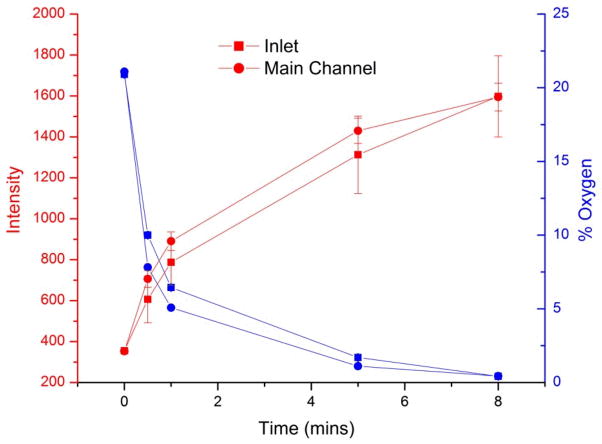
Solid tumors experience hypoxia as they grow. As the distance between the blood vessel and the core increases, the cells within the sections of the tumor start experiencing low oxygen environment. The oxygen concentration can reach lower than 1%. The design of the chip allowed it to be conveniently placed inside the hypoxia chamber and oxygen concentration was measured by using oxygen sensing dye, Tris(4,7-diphenyl-1,10-phenanthroline) ruthenium(II) dichloride, as described in our previous work (29). This method allowed for measurement of oxygen concentration without the use of electrodes which require physical access to the chip. The oxygen permeability of PDMS is very high which allowed for the attainment of 1% oxygen within 5 minutes (Fig 2). As shown in the figure, the increase in intensity of the oxygen-sensing dye corresponds to the decrease in oxygen concentration. To eliminate the possibility of oxygen introduction in chip through the constant flow of medium, we performed oxygen measurements at the inlet of the chip and the beginning of the culture chamber regions in the main channel. The difference between the oxygen concentration in the inlet and the main channel was less than 1% within the first 5 minutes. Moreover, within 8 minutes, both regions measured in the chip had oxygen concentrations that were close to 0%. Although the medium was oxygenated, the fluidic volume in the chip is much smaller than the volume of PDMS. As seen in Figure 2, within one minute the oxygen in the chip fluidic circuit decreased to approximately 6% at the inlet, indicating that the bulk PDMS was deoxygenated and allowed oxygen to permeate out of the medium. After five minutes the PDMS was deoxygenated enough to make the difference between the inlet of the chip and the culture chambers in the main channel nearly identical. Thus, induction of hypoxia was very rapid in the chip allowing for shorter period of pre-conditioning to have a significant difference in the drug response of prostate cancer cells. In addition, the continuous introduction of oxygenated medium did not affect hypoxic conditions in the chip.
Figure 2.
Oxygen concentrations in hypoxia chips with constant introduction of medium. The concentration of oxygen was measured at two points in the chip, the inlet and the main channel (located at the first culture unit). The increase in fluorescence intensity of the ruthenium dye corresponds to the decrease in oxygen concentration. After 5 minutes, the oxygen concentration at both points was 1%. Errors represent 1 standard deviation of the mean signal (oxygen concentration error bars are too small to be seen). The deoxygenated PDMS served as an oxygen sink, so that oxygen entering the chip (via infused medium) was removed before reaching the culture inlets.
Drug response under normoxic and hypoxic condition: early stage apoptosis markers
Hypoxia causes therapeutic resistance to chemotherapy (1–5). Cells can adapt to low oxygen levels by changing their gene expression patterns. This adaptation occurs via a transcriptional response pathway mediated by the Hypoxia Inducible Factor (HIF)-1. Cancer cells experience hypoxia when the distance between the blood vessel and the cells is large and mass transport is limited. In cells treated with staurosporine under normoxia, MitoTracker Deep Red fluorescence decreased at a greater rate as compared with the cells treated under hypoxic conditions (Figure 3A). At 1 hour of drug treatment alone, the percentage of apoptotic cells was 32% ± 10% at normoxic conditions, but only 1.5% ± 12% at hypoxic conditions. These fractions of apoptotic cells were statistically different from each other at the 95% confidence level. It is important to note that even one-hour preconditioning of hypoxia was enough to instill resistance to the drug. Over the entire course of study, the number of apoptotic cells continued to increase in the normoxic, drug treated cells. However, hypoxic, drug treated cells continued to remain healthy and were statistically identical to control cells. These results indicate that even short periods of hypoxia decrease susceptibility to staurosporine. Changes in cellular metabolism of the drug in lower oxygen microenvironment or hypoxia induced changes in genes might be the reason behind the chemotherapeutic resistance in hypoxic cells.
Figure 3.
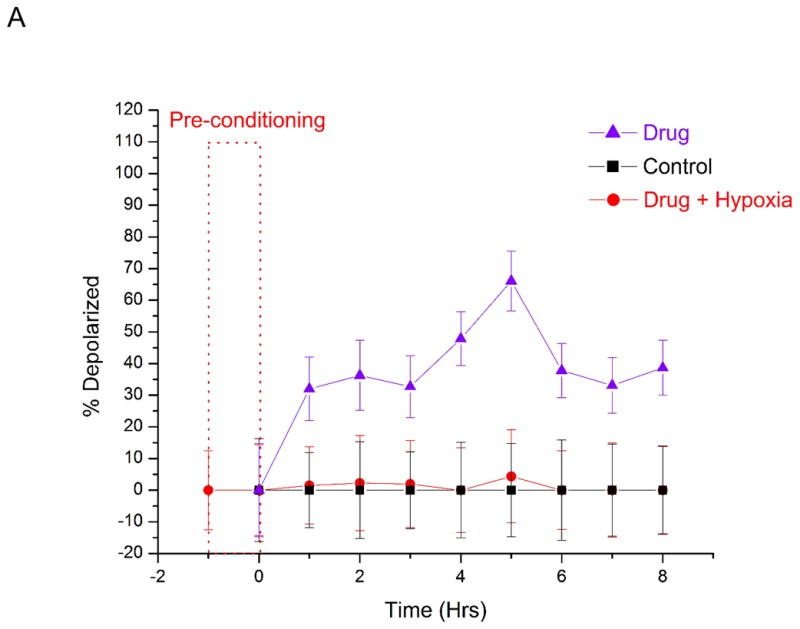
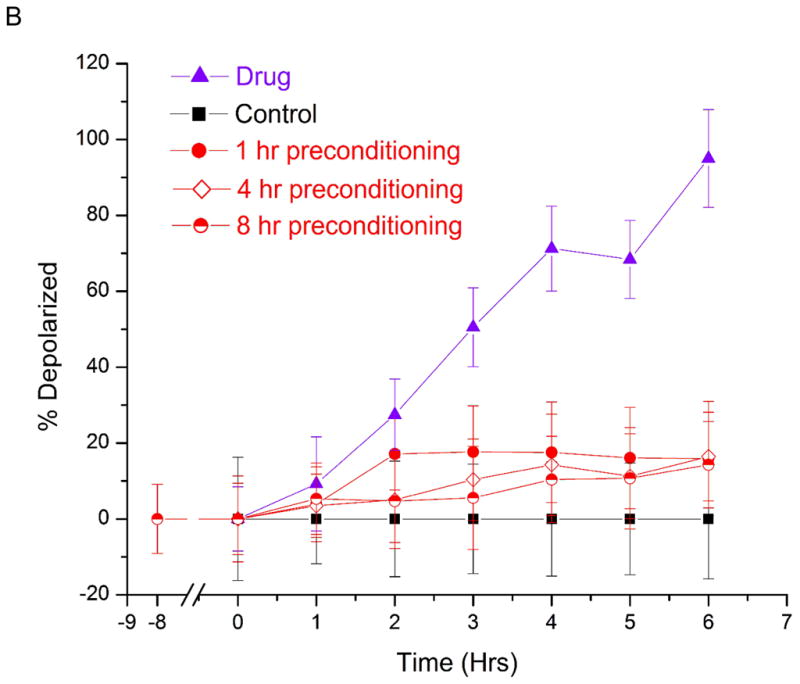
Dose response study of prostate cancer cells towards staurosporine under hypoxic and normoxic conditions. The number of cells with depolarized mitochondria (indicated early stage apoptosis) were measured as a function of time. Control measurements were performed (black squares) for 8 hours under normoxic conditions without staurosporine. Hypoxic studies (red circles) were conducted at <1% oxygen in the presence of staurosporine. Normoxic measurements (purple triangles) were conducted at 21% oxygen in the presence of staurosporine. The dashed rectangle represents a one-hour period of hypoxic preconditioning that preceded hypoxia studies in (A), but not normoxia and control measurements. At 2 μM staurosporine (A), there was a statistically significant difference in the number of drug-treated apoptotic cells under hypoxic and normoxic conditions. 32% ± 10% of cells were depolarized under normoxia, while less than 1.5% ± 12% of cells were apoptotic under hypoxia. At 10 μM staurosporine (B), the fraction of apoptotic cells after 6 hours of drug treatment was 95% ± 7% under normoxia and 15% ± 6% under hypoxia. . These fractions of apoptotic cells were statistically different from each other at the 95% confidence level. Lower concentrations (0.2 μM) of staurosporine did not elicit a response from cells for the 6 hour measurement period under hypoxic or normoxic conditions (data not shown). The short period of hypoxic preconditioning was sufficient to instill increased resistance to staurosporine, indicating that cell protective measures are rapidly activated and greatly affect drug efficacy measurements. PC3 cells were also pre-conditioned at <1% oxygen for 4 hours and 8 hours (B) before drug induction. Periods of 1 hour, 4 hour and 8 hour pre-conditioning did not yield statistically significant differences in drug response.
In order to look at the response of prostate cancer cells according to drug dose, we then treated cells with lower (0.2 μM) and higher (10 μM) doses of staurosporine. At lower concentrations, the control cells and drug treated cells did not show significant difference in the apoptosis percentage, regardless of oxygen concentrations (data not shown). The lack of apoptosis might be because the 0.2 μM concentration was insufficient to trigger apoptosis in the eight-hour experiment duration. At a concentration of 10 μM under normoxic conditions, the fraction of apoptotic cells reached 95% ± 7% after 6 hours. However, only 15% ± 6% of drug treated cells under hypoxic condition were apoptotic (Figure 3B). Interestingly, the fraction of apoptotic cells in the hypoxic case did not increase after this maximum value was reached, indicating that only a fraction of the cells were susceptible to apoptosis induction at higher drug concentrations.
In order to further investigate this possible subpopulation of cells that were more susceptible to higher doses staurosporine under hypoxic treatment, we studied the effect of hypoxic preconditioning on the drug responses. Cells were pre-conditioned for 4 hours and 8 hours before inducing with 10 μM staurosporine (Figure 3B). At longer pre-conditioning, the susceptibility to staurosporine was not statistically different than 1 hour pre-conditioning. Therefore, we concluded that 1 hour pre-conditioning was sufficient to study hypoxic modulation to drug susceptibility. It is important to note that in future studies hypoxia preconditioning duration must be evaluated for new cell lines. We have shown that drug efficacy testing can be performed in our device, and that short hypoxic periods result in significant resistance to drug-induced apoptosis. In recent work by Qiao and Ma (15), they showed that LNCap and HeLa cells were less susceptible to radiation damage and drug treatment under hypoxia. Interestingly, we observed a greater difference between hypoxic and normoxic drug treated cells, although our assay for membrane potential differed from their measurements of DNA damage.
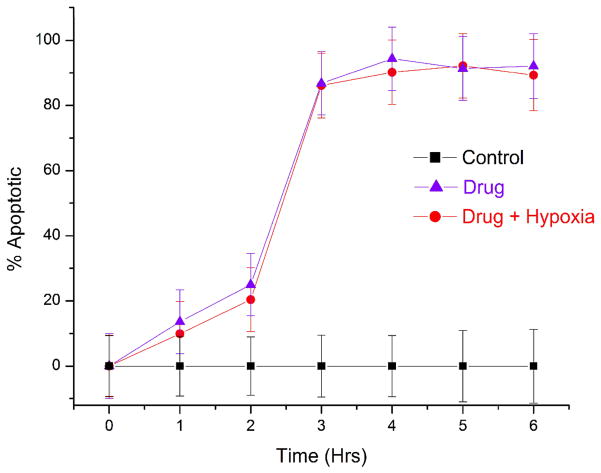
Hypoxia is a feature of solid tumors. Suspended cells such as lymphocytes on the other hand do not routinely undergo hypoxia. Thus, the ability to rapidly adapt to hypoxia might not be present in case of suspended cells. In past, we have used Ramos cells as a cell model for apoptotic studies (30). We treated Ramos B cells with 2 μM staurosporine under normoxic and hypoxic condition (Figure 4). At 3 hours, the fraction of apoptotic cells under normoxic and hypoxic conditions were not significantly different from each other. Our result indicates that the hypoxic mechanism plays a role in decreased drug susceptibility.
Figure 4.
Drug response of suspended B lymphocyte cancer cells. Ramos B cells were treated with 2 μM staurosporine at normoxic (purple triangles) and hypoxic (red circles) conditions. Control measurements were performed (black squares) for 6 hours under normoxic conditions without staurosporine. The number of cells with depolarized mitochondria were measured as a function of time. The response of B cells toward staurosporine was not significantly different under hypoxic and normoxic conditions. Suspended cells do not posses hypoxic regions. Therefore, hypoxia adaptive mechanism is not present in these kinds of cells rendering them susceptible to drugs even at hypoxic conditions.
Phosphatidylserine externalization
One key benefit of our approach is that we can use different approaches to determine cell response instead of only one assay. Staurosporine triggers apoptosis via the mitochondrial pathway, resulting in the loss of membrane potential and release of cytochrome c in the earliest steps. To support our result of mitochondrial membrane potential loss, we also measured phosphatidylserine externalization in drug treated cells under normoxic and hypoxic condition. Annexin V probes are commonly used to assay phosphadylserine externalization, and indicate mid-stage apoptosis. We first cultured prostate cells in the chip and induced apoptosis with 2 μM staurosporine for 8 hours and afterwards stained the cells for phosphatidylserine externalization and viability. For hypoxia measurements cells were preconditioned for 1 hour.
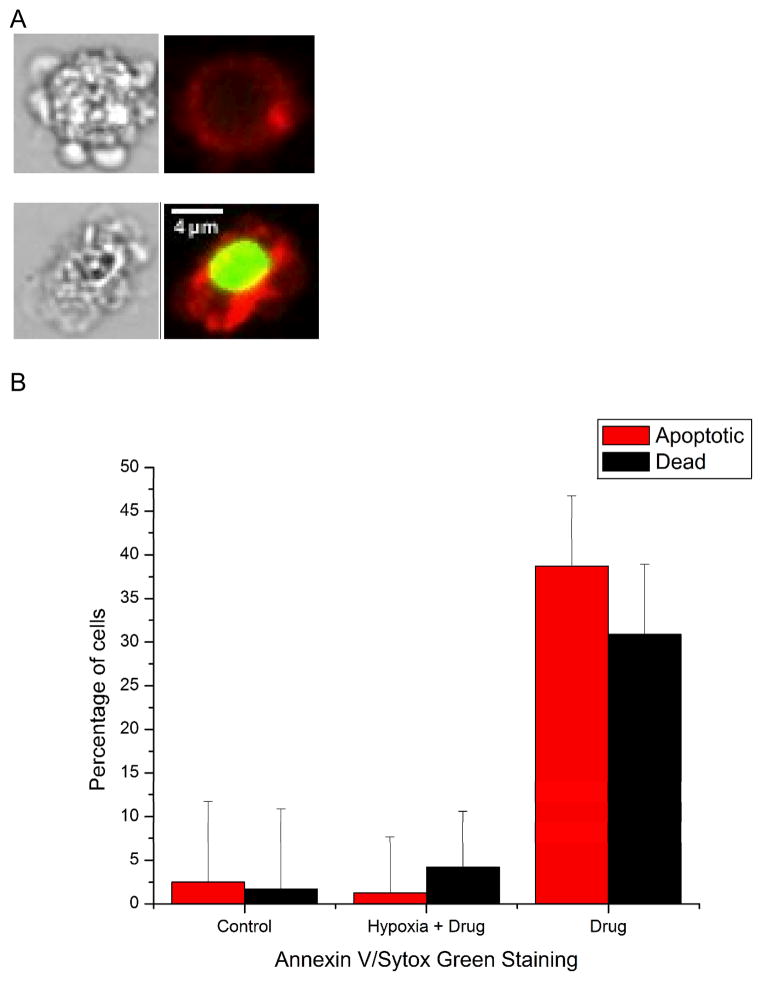
Cells positive for Annexin V-Alexa Fluor 647 and negative to Sytox Green were counted as apoptotic cells and cells positive for both dyes were counted as dead cells. The Total percentage of apoptotic and dead cells was approximately 5% in the hypoxic sample, compared to an apoptotic fraction of 38% in the normoxic sample (Figure 5). These fractions of apoptotic cells were statistically different from each other at the 95% confidence level. In this case viability was also assayed, and as expected a larger fraction of cells were already dead after the eight-hour drug exposure in the normoxic case. The fraction of apoptotic and dead cells was nearly identical to the control cells, indicating that necrosis is not an alternate death pathway for hypoxic cells. The phosphatidylserine externalization experiments show that apoptosis continues to its end point in our studies, and that hypoxia conditions cells toward drug resistance. In future work, we will explore other cellular parameters to determine mechanisms of drug resistance, and also expand the types of cells and drugs assayed in these chips.
Figure 5.
Late-stage apoptosis measurements under hypoxia and normoxia. Measurement of phosphatidyl serine exposure using Annexin V and Sytox Green showed that apoptotic cells continued through the cell death cascade when treated with the drug (2 μM staurosporine). (A) Representative white light and fluorescence images of apoptotic (Annexin V + and Sytox Green -) and dead (Annexin V + and Sytox Green +) cells. After 8 hours of drug incubation 1.2% ± 6% of cells were apoptotic and 4.2% ± 6% of cells were dead under hypoxic conditions, indicating hypoxia continued to safeguard cells against apoptosis. In normoxic chips, 39 ± 8% of cells were apoptotic and 31% ± 8% cells were dead after 8 hours of treatment with the drug. The fractions of apoptotic and dead cells were statistically different from each other and the control samples at the 95% confidence level.
Conclusion
Drug resistance in cancer cells continues to be a problem in cancer treatment and drug discovery. Hypoxia in solid tumor masses plays an important role in cellular adaptation and changes in gene expression that result in resistance towards chemotherapy and radiotherapy. Our approach was able to produce 1% oxygen within 5 minutes and was able to elucidate cell response to a therapeutic compound under hypoxic and normoxic conditions. Cells preconditioned under hypoxic conditions for 1 hour showed a significant difference in drug response as compared to the cells cultured under normoxic conditions, indicating that our methods can be used to rapidly assess the efficacy of anti-cancer compounds against hypoxic tumor cells. In the future, we will use this microfluidic device to culture multiple cancer cell lines at the same time and study the differences in cell response under normal and hypoxic conditions for a wide range of anti-cancer compounds.
Supplementary Material
Acknowledgments
This work was supported in part by the National Institutes of Health (Grant RR025782 and GM103550) and the Texas Tech University Vice President for Research Proposal Stimulus Program.
References
- 1.Brown JM, Giaccia AJ. Cancer Res. 1998;58:1408–1416. [PubMed] [Google Scholar]
- 2.Graeber TG, Osmanian C, Jacks T, Housman DE, Koch CJ, Lowe SW, Giaccia AJ. Nature. 1996;379:88–91. doi: 10.1038/379088a0. [DOI] [PubMed] [Google Scholar]
- 3.Weinmann M, Belka C, Plasswilm L. Onkologie. 2004;27:83–90. doi: 10.1159/000075611. [DOI] [PubMed] [Google Scholar]
- 4.Tredan O, Galmarini CM, Patel K, Tannock IF. J Natl Cancer Inst. 2007;99:1441–1451. doi: 10.1093/jnci/djm135. [DOI] [PubMed] [Google Scholar]
- 5.Vaupel P, Mayer A, Hockel M. Methods Enzymol. 2004;381:335–354. doi: 10.1016/S0076-6879(04)81023-1. [DOI] [PubMed] [Google Scholar]
- 6.Thews O, Wolloscheck T, Dillenburg W, Kraus S, Kelleher DK, Konerding MA, Vaupel P. British Journal of Cancer. 2004;91:1181–1189. doi: 10.1038/sj.bjc.6602066. [DOI] [PMC free article] [PubMed] [Google Scholar]
- 7.Yapp DTT, Woo J, Kartono A, Sy J, Oliver T, Skov KA, Koch CJ, Adomat H, Dragowska WH, Fadzli L, Ruth T, Adam MJ, Green D, Gleave M. BJU International. 2007;99:1154–1160. doi: 10.1111/j.1464-410X.2007.06761.x. [DOI] [PubMed] [Google Scholar]
- 8.Movsas B, Chapman JD, Hanlon AL, Horwitz EM, Greenberg RE, Stobbe C, Hanks GE, Pollack A. Urology. 2002;60:634–639. doi: 10.1016/s0090-4295(02)01858-7. [DOI] [PubMed] [Google Scholar]
- 9.Rasey JS, Koh WJ, Evans ML, Peterson LM, Lewellen TK, Graham MM, Krohn KA. Int J Radiat Oncol Biol Phys. 1996;36:417–428. doi: 10.1016/s0360-3016(96)00325-2. [DOI] [PubMed] [Google Scholar]
- 10.Wouter BG, Weppler SA, Koritzinsky M, Landuyt W, Nuyts S, Theys J, Chia RK, Lambin P. Europen Journal of Cancer. 2002;38:240–257. doi: 10.1016/s0959-8049(01)00361-6. [DOI] [PubMed] [Google Scholar]
- 11.Condonon CM, Toomey D. Cancer Treatment Reviews. 2003;29:297–307. doi: 10.1016/s0305-7372(03)00003-3. [DOI] [PubMed] [Google Scholar]
- 12.Jubb AM, Buffa FM, Harris AL. J Cell Mol Med. 2010;14:18–29. doi: 10.1111/j.1582-4934.2009.00944.x. [DOI] [PMC free article] [PubMed] [Google Scholar]
- 13.Brown JM. Methods in Enzymology. 2007;435:298–315. doi: 10.1016/S0076-6879(07)35015-5. [DOI] [PubMed] [Google Scholar]
- 14.Rohwer N, Zasada C, Kempa S, Cramer T. Oncogene. 2013;32:3569–3576. doi: 10.1038/onc.2012.510. [DOI] [PubMed] [Google Scholar]
- 15.Qiao Y, Ma L. Anal Chem. 2013;85:6953–6957. doi: 10.1021/ac401543t. [DOI] [PubMed] [Google Scholar]
- 16.Wenger RH. The FASEB Journal. 2002;16:1151–1162. doi: 10.1096/fj.01-0944rev. [DOI] [PubMed] [Google Scholar]
- 17.Semenza GL. Nature Rev Cancer. 2003;3:721–732. doi: 10.1038/nrc1187. [DOI] [PubMed] [Google Scholar]
- 18.Harris AL. Nature Rev Cancer. 2002;2:38–47. doi: 10.1038/nrc704. [DOI] [PubMed] [Google Scholar]
- 19.Wlodkowic D, Cooper JM. Current Opinion in Chemical Biology. 2010;14:556–567. doi: 10.1016/j.cbpa.2010.08.016. [DOI] [PubMed] [Google Scholar]
- 20.Wlodkowic D, Khoshmanesh K, Sharpe JC, Derzynkiewicz Z, Cooper JM. Anal Chem. 2011;83:6439–6446. doi: 10.1021/ac200588g. [DOI] [PMC free article] [PubMed] [Google Scholar]
- 21.Liu W, Sun P, Yang L, Wang J, Li L, Wang J. Microfluid Nanofluid. 2010;9:717–725. [Google Scholar]
- 22.Miller OJ, El Harrak A, Mangeat T, Baret JC, Frenz L, El Debs B, Mayot E, Samuels ML, Rooney EK, Dieu P, Galvan M, Link DR, Griffiths AD. PNAS. 2012;109:378–383. doi: 10.1073/pnas.1113324109. [DOI] [PMC free article] [PubMed] [Google Scholar]
- 23.Somaweera H, Ibragimov A, Pappas D. Analyst. 2013;138:5566–5571. doi: 10.1039/c3an00946g. [DOI] [PMC free article] [PubMed] [Google Scholar]
- 24.Sung J, Shuler ML. Lab Chip. 2009;9:1385–1394. doi: 10.1039/b901377f. [DOI] [PubMed] [Google Scholar]
- 25.Di Carlo D, Wu LY, Lee LP. Lab Chip. 2006;(6):1445–1449. doi: 10.1039/b605937f. [DOI] [PubMed] [Google Scholar]
- 26.Wlodkowic D, Faley S, Zagnoni M, Wikswo JP, Cooper JM. Anal Chem. 2009;81:5517–5523. doi: 10.1021/ac9008463. [DOI] [PMC free article] [PubMed] [Google Scholar]
- 27.Lo JF, Wang Y, Blake A, Yu G, Harvat TA, Jeon H, Oberholzer J, Eddington DT. Anal Chem. 2012;84:1987–1993. doi: 10.1021/ac2030909. [DOI] [PMC free article] [PubMed] [Google Scholar]
- 28.Thomas PC, Raghavan SR, Forry SP. Anal Chem. 2011;83:8821–8824. doi: 10.1021/ac202300g. [DOI] [PubMed] [Google Scholar]
- 29.Khanal G, Chung K, Solis-Wever X, Johnson B, Pappas D. Analyst. 2011;136:3519–3526. doi: 10.1039/c0an00845a. [DOI] [PMC free article] [PubMed] [Google Scholar]
- 30.Gao Y, Li P, Pappas D. Biomedical Microdevices. 2013;15:907–915. doi: 10.1007/s10544-013-9779-3. [DOI] [PMC free article] [PubMed] [Google Scholar]
- 31.Kolnik M, Tsimring LS, Hasty J. Lab Chip. 2012;12:4732–4737. doi: 10.1039/c2lc40569e. [DOI] [PMC free article] [PubMed] [Google Scholar]
Associated Data
This section collects any data citations, data availability statements, or supplementary materials included in this article.


