

Abstract
DNA packaging of phages phi29, T3 and T7 sometimes produces incompletely packaged DNA with quantized lengths, based on gel electrophoretic band formation. We discover here a packaging ATPase-free, in vitro model for packaged DNA length quantization. We use directed evolution to isolate a five-site T3 point mutant that hyper-produces tail-free capsids with mature DNA (heads). Three tail gene mutations, but no head gene mutations, are present. A variable-length DNA segment leaks from some mutant heads, based on DNase I-protection assay and electron microscopy. The protected DNA segment has quantized lengths, based on restriction endonuclease analysis: six sharp bands of DNA missing 3.7–12.3% of the last end packaged. Native gel electrophoresis confirms quantized DNA expulsion and, after removal of external DNA, provides evidence that capsid radius is the quantization-ruler. Capsid-based DNA length quantization possibly evolved via selection for stalling that provides time for feedback control during DNA packaging and injection.
Keywords: Agarose gel electrophoresis, native, Bacteriophage assembly, Capsid structure, DNA packaging, Mutant phenotype, Ultracentrifugation
Introduction
DNA packaging occurs, for all studied double-stranded DNA phages, when a pre-assembled procapsid binds and packages a pre-replicated DNA molecule. The DNA molecule is sometimes an end-to-end “concatemer” of mature genomes. These points are illustrated in Figure 1a for the related phages, T3 and T7, without showing the concatemeric aspect of the DNA molecule (reviewed in references Fujisawa and Morita, 1997; Catalano, 2000; Casjens, 2011; Rao and Black, 2010; Smith, 2011; Serwer and Jiang, 2012). Concatemer packaging is accompanied by concatemer cleavage to form the mature DNA molecule. DNA packaging occurs though a portal ring (connector) of twelve chemically identical subunits, into the cavity of a symmetrical shell. The connector subunits are encoded by gene 8 of T3/T7; the shell subunits are encoded by gene 10. T3 proteins will be labeled by gp, followed by the number of the encoding gene (Pajunen et al., 2002; see Figure 1a, b). The T3/T7 shell expands during packaging and loses a scaffolding protein, gp9. Packaging requires energy from the hydrolysis of ATP by a DNA packaging ATPase (gp19 for T3 and T7) that is bound to the external surface of the connector. The ATPase leaves the capsid after DNA is packaged (Fujisawa and Morita, 1997; Figure 1a–c). The cleavage of concatemers is a second function of the packaging ATPase, in the case of phages that package concatemers. For the latter phages, the DNA packaging ATPase is also called terminase.
Figure 1.

T3 phage, procapsid and heads. (a) The procapsid (capsid I) of phage T3 that has initiated DNA packaging. (b) Capsid with DNA in the early stages of packaging, after the conversion of capsid I to the more angular, larger capsid II. (c) A conventional T3 head that converts to the following: (d) A modified T3 head, as demonstrated here in vitro. (e) T3 phage, as found in vivo. The data obtained here show that the external DNA segment of (d) is from the left DNA end (last end packaged) and has a variably quantized length. Based on data for T7, the tail fibers are made of gp17; the main body of the tail is made of gp11 and gp12. Gp11 is connector-proximal; gp12 is connector-distal (Cuervo et al., 2013).
In past studies of some systems, analysis of the length of incompletely packaged DNA (ipDNA) revealed unexplained “quantization” of packaging. “Quantization” means that ipDNA formed sharp bands when expelled from capsids and analyzed by agarose gel electrophoresis. These systems include in vitro DNA packaging extracts of phage phi29 (Bjornsti et al, 1983) and host cells infected with phages T7 (Khan et al., 1995) and T3 (Fang et al, 2008). Furthermore, the kinetics of in vitro phage lambda DNA packaging suggested similar quantization of packaging for lambda (Yang et al., 2009).
In the case of T3, in vivo-produced capsids with ipDNA (ipDNA-capsids) varied in size, as judged by native gel electrophoresis and electron microscopy (Serwer et al., 2011; Serwer and Wright, 2012). Similar flexibility has been observed for mature RNA viruses (Harrison et al., 1987; Opalka et al., 2000; Witz and Brown, 2001; Tang et al., 2009; Bakker et al., 2012) and less directly for mature double-stranded DNA phages (Cerf et al., 1979; Shilnikov et al., 1986).
In the current study, we use directed evolution to produce a mutant T3 phage that produces DNA-filled, tail-free heads (Cerritelli et al., 1997) in increased amount, while also producing phage particles. These heads are found here to leak DNA in quantized lengths. The products (called modified heads) are the first purified, DNA-associated capsids (anywhere, to our knowledge) with most DNA stably packaged and a small DNA segment external. We then (1) develop and use procedures of native gel electrophoresis for rapidly detecting modified heads (and presumably other particles of this type, including DNA packaging intermediates), and (2) use native gel electrophoresis to find that some of the DNA-containing shells of these heads have contracted. We propose a DNA packaging- and DNA injection-based explanation for the evolution of the capacity for DNA quantization. We add capsid contraction to the proposed mechanisms for phage DNA injection
Results
Isolation of mutants
The [NaCl]-sensitivity of T3 DNA packaging in vivo (Serwer and Wright, 2012) suggested the isolation and determination of phenotype for elevated [NaCl]-resistant (SR) T3 mutants. We initially found that the rate of 30 °C-propagation of the T3 host (Escherichia coli BB/1) progressively decreased as [NaCl] increased to 1.1 M, based on turbidity of a host lawn in agar-contained medium.
The upper [NaCl] limit (1.1 M) for host propagation was over 2× above the upper limit for wild type T3 plaque formation. A plot of normalized plaque-forming units (PFU) per ml vs. [NaCl] is in Figure 2 for wild type T3 phage (plot labeled WT). Wild type T3 had less than 0.05% of its peak titer at [NaCl] of 0.60 M or greater.
Figure 2.

Dependence on [NaCl] of the propagation of phages T3 and T3SR3-1. Normalized plots of infective phage units per ml vs. the [NaCl] of the growth medium, for wild type T3 (WT) and T3SR3-1 (SR).
We then used a multi-step selection for T3SR mutants, as described in the Materials and Methods Section. Here, we characterize heads from one SR mutant, to be called T3SR3-1. The first number in the name indicates the number of selection steps and, presumably, the minimum number of mutations, assuming at least one mutation per selection step. The number after the dash indicates the order in which at least a partial phenotype was determined. T3SR3-1 was chosen because it made the largest plaques in medium with total [NaCl] = 0.9 M.
Although T3SR3-1 propagation was also sensitive to [NaCl], T3SR3-1 had a less steep plot of normalized PFU/ml vs. [NaCl] (plot labeled SR in Figure 2). In contrast to wild type T3, T3SR3-1 retained over 40% of its peak titer at 0.60 M NaCl. In addition, although the T3SR3-1 plaque diameter was 2–4× smaller than the wild type plaque diameter at 0.1 M NaCl, the T3SR3-1 plaque diameter (1) was approximately equal to the wild type plaque diameter at 0.3 M NaCl total and (2) was 2–4× larger than the wild type plaque diameter for [NaCl] between 0.4 M and 0.6 M.
Increased production of head-like particles by T3SR3-1
We determined the mature phage assembly phenotype of T3SR3-1by, first, obtaining infected cell lysates. We then partially pre-purified particles that were approximately phage-sized. We further purified the latter particles by buoyant density centrifugation in a cesium chloride density gradient (Materials and Methods Section). Particles from a wild type lysate (centrifuge tube labeled WT-0.1 in Figure 3a) formed a single major band, labeled ϕ. This band was formed by infective particles and was accompanied by two minor bands formed by heads, 3. By contrast, particles from T3SR3-1 lysates formed a major ϕ band and a major Head band, with Head band intensity decreasing and ϕ band intensity increasing as [NaCl] during propagation increased (centrifuge tubes labeled SR in Figure 3a; [NaCl] in growth medium is indicated after SR). The T3SR3-1 ϕ bands were lower than the wild type ϕ band because the starting cesium chloride solution was made slightly less dense in order to increase the density range of resolved particles.
Figure 3.

Fractionation of lysates. Lysates were both obtained and processed by the procedures of the Materials and Methods Section. (a) Light scattering profiles for buoyant density centrifugations in a cesium chloride density gradient. (b) Light scattering profiles for rate zonal centrifugation through a sucrose gradient of both wild type T3 phage (at the right) and dialyzed-stored T3SR3-1 heads (at the left).
In (a), SR, followed by the molar [NaCl] in the growth medium, is indicated below centrifuge tubes used for fractionation of T3SR3-1 lysates; WT, followed by the molar [NaCl] concentration in the growth medium, is below the centrifuge tube used for fractionation of a wild type lysate. Tail-free heads formed the band labeled Head; tail-free heads deficient in gp15 and gp16 formed the band labeled Head-. Protein compositions of the latter were determined by SDSPAGE after a second (additional) buoyant density centrifugation in a cesium chloride density gradient. Quantification of the extent of the gp15, 16 deficiency is not yet possible because of the small amount of these deficient heads and contamination from particles of the neighboring Head band. In (b), the heads originated in a lysate made in medium with 0.4 M NaCl; the sucrose gradient was run 14 days after removing cesium chloride by dialysis. The concentration of particles is at the over-loading limit, as found via band spreading as this concentration was increased. Symbols: B, centrifuge tube bottom; M, meniscus; ϕ, phage; CH, conventional head; MH, modified head; SR, salt resistant; WT, wild type. The arrow indicates the direction of sedimentation.
The particles of Head bands will be shown below to be tail-free. Thus, the [NaCl]-dependence of Figure 3a suggests that, in the mutant, either tail assembly or tail attachment (or both) has adapted to be more efficient at elevated [NaCl] than it is at normal [NaCl]. Alteration involving the tail is confirmed by the finding, below, of three mutations in T3SR3-1 genes for tail proteins.
Fractionation of Heads
To further characterize the particles of the Head bands, we first removed cesium chloride by dialysis. We then performed preparative rate zonal centrifugation in a sucrose gradient, after having stored the dialyzed particles at 4 °C for 14 days. The light scattering profile reproducibly (4 independent preparations) had two primary bands (centrifuge tube labeled Head-SR in Figure 3b). The band closer to the meniscus (labeled MH) sometimes split into as many as three overlapping bands, although this splitting did not in Figure 3b.
The second reproducible band (labeled CH) was more origin-distal and was always unsplit. This band had the approximate position of a band of phage particles, as shown by a wild type “phage” profile in the centrifuge tube labeled ϕ-WT in Figure 3b. Finally, some relatively minor bands were even more origin-distal than the CH band (indicated with a bracket in Figure 3b). These bands were usually not present. They were formed by aggregates, as shown by native gel electrophoresis and electron microscopy (not shown).
No MH band was detected when the fractionation shown in Figure 3b was performed immediately after dialysis; i.e., the storage for 14 days was omitted. Only the CH band was observed (not shown). This result is duplicated by native gel electrophoresis, below. Thus, the particles of the MH band were storage-induced conversion products of the particles of the CH band. This conversion did not occur for periods as long as a year, if the cesium chloride was not removed by dialysis. Nonetheless, after fractionation in a sucrose gradient, the particles of the MH band did not further change for at least a year, during storage at 4 °C. The criterion for stability was native gel electrophoresis.
Composition of particles from the sucrose gradient
Head DNA molecules were indistinguishable from mature phage DNA molecules during agarose gel electrophoresis. This result is shown in Figure 4a, for DNA completely expelled from the heads of the various fractions of the sucrose gradient of Figure 3b; fraction number is above a lane; CH and MH indicate fractions at the centers of the CH and MH bands (contrast inverted to match Figure 4b). The procedure used for Figure 4a (see McDonell et al., 1977; Serwer, 1980) had DNA length-resolution of ±4%, for DNA molecules with lengths between 0.5x and 1.2x the length of mature T3 DNA (38.2 Kb; Pajunen et al., 2002). The resolution is illustrated by the inclusion of the following standards: mature T3 DNA (lane labeled ϕ-T3 in Figure 4a), the 48.5 Kb (Sanger et al., 1982) mature phage lambda DNA (lane labeled ϕ-λ) and the 39.9 Kb (Dunn et al., 1983) mature phage T7 DNA (lane labeled ϕ-T7). Volumes of sample for the various lanes in Figure 4a (and Figure 4b) were varied so that sample concentrations were adequate to see bands without overloading.
Figure 4.

Composition of particles (primarily heads) fractionated by rate zonal centrifugation in a sucrose gradient. (a) Low-field, low concentration agarose gel electrophoresis, with GelStar staining, performed with DNA expelled from capsids. (b) SDSPAGE of the proteins, with Sypro Ruby staining. The growth medium had 0.1 M NaCl. The arrowheads indicate the origins of electrophoresis; the arrow indicates the direction of electrophoresis. Symbols above the lanes for (a): CH, conventional head peak; MH, modified head peak; ϕ-T3, DNA of wild type T3 phage; ϕ-λ and ϕ-T7, DNAs of wild type phages λ and T7; B, restriction endonuclease Bgl II digest of phage T7 mature DNA; H, restriction endonuclease Hind III digest of phage λ mature DNA; X, restriction endonuclease Xba I digest of phage T7 mature DNA. The numbers above lanes in (a) are fraction numbers from a sucrose gradient like the one in Figure 3b. Symbols above the lanes for (b), when not the same as in (a): ϕ-WT, proteins of wild type phage T3; ϕ-SR, proteins of T3SR3-1 phage; CI, proteins of wild type T3 capsid I. The numbers at the right provide the encoding gene (Pajunen et al., 2002) for the protein indicated.
The primary head protein was gp10 for all fractions, based on sodium dodecyl sulfate polyacrylamide gel electrophoresis (SDSPAGE) (Figure 4b). Gp10 has two forms, A and B; gp10B is generated from gp10A by a frame shift, read-through at the latter stage of translation (Pajunen et al., 2002; Dunn et al., 1983). We identified proteins by the known relative positions and intensities of the proteins of wild type phage particles (lanes labeled ϕ-WT in Figure 4b), from which T3SR3-1 phage particles were indistinguishable in protein composition (lanes labeled ϕ-SR in Figure 4b).
Tail proteins, gp12 and gp17 (Figure 1 and Legend), were missing from T3SR3-1 particles that sedimented more slowly than phage particles (Figure 4b, fractions 1-11, including the MH lane). A third, smaller tail protein, gp11, migrated out of the gel in Figure 4b, but was found to be missing from heads in these fractions during SDSPAGE with a shorter distance of migration (not shown). This observation confirms the “head” designation.
In the same sucrose gradient, the conventional heads (CH fraction) had a detectable, though sub-stoichiometric, component of gp12 and gp17 (lanes 12 – 17 in Figure 4b). The likely reason is the presence of contaminating phage particles from the ϕ band of the previous T3SR3-1 cesium chloride gradient (Figure 3a).
Finally, heads had gp9 scaffolding protein, as did both wild type and mutant phages. We identified the gp9 band by comparison of a profile to the profile of capsid I. Capsid I had more gp9 (lanes labeled CI). Apparently, T3 DNA packaging did not completely expel gp9.
In summary, tail-free heads are (1) the only detected particles of both the MH band-region and neighboring regions of the Head-SR sucrose gradient of Figure 3b and (2) the predominant particles in both the CH band-region of this sucrose gradient and the Head band-region of the T3SR3-1 cesium chloride gradients of Figure 3a. No significant difference in protein composition was observed among the various heads of Figure 3b. However, the heads of the MH band of Figure 3b (to be called modified heads) had a sedimentation rate that differentiated them from the more origin-distal heads of the CH band (conventional heads).
DNase I sensitivity of the DNA of T3 heads
Part of a modified head-associated DNA molecule was DNase sensitive. We discovered this fact when we digested modified heads with 75 μg/ml DNase I and then inactivated the DNase I, separated DNA from capsids and fractionated the DNA by agarose gel electrophoresis. We did this at several DNA concentrations. The result was a single band-forming DNA (75 μg/ml lanes in Figure 5) that migrated further than both an undigested control (0 μg/ml lanes in Figure 5) and wild type T3 phage DNA (ϕ-T3 lane in Figure 5), at the lower DNA concentrations. The digestion was at completion because the result did not change when the DNase I concentration was increased to 200 μg/ml (200 μg/ml lanes lane in Figure 5). That is to say, DNase I digested some (~9%, on average, based on migration distance in Figure 5), but not most, of a modified head-associated mature DNA molecule.
Figure 5.

DNase I digestion (trimming) of head-associated DNA. Modified heads (MH fraction of a sucrose gradient; 43.6 μg DNA/ml) were diluted by a factor of 0.36 and subjected to digestion with either 75 or 200 μg/ml DNase I, as indicated above bracketed lanes. Then, the DNase was inhibited, the DNA was expelled from heads and the DNA was subjected to gel electrophoresis (Materials and Methods) in the following amounts: 320, 192, 48 and 16 ng. The length standards are in lanes marked as they are in Figure 4.
The band of DNase I-protected, modified head DNA was about 2× broadened at the lowest DNA concentration, which suggests DNA length heterogeneity, as confirmed in the next section. The digested DNA segment was external and the protected segment was still packaged (illustrated in Figure 1d), as indicated by data presented below.
Identification of the DNase-sensitive end of the DNA of modified T3SR3-1 heads
We used restriction endonuclease analysis to identify the modified head-associated DNA that was DNase I-digested. Initially, we DNase I-digested (trimmed) modified heads to completion. Then, we isolated the packaged, DNase I-resistant DNA (Materials and Methods Section) and digested it with restriction endonuclease Bgl II, which cleaves mature T3 DNA at a single site 44.0 % of the genome length from the left end (Bailey et al., 1980). Finally, we identified the DNase I-trimmed region by determining which of the two Bgl II fragments was shortened by the previous DNase I-trimming. The negative control was wild type T3 phage, which has a completely DNase I-resistant genome (Figure 6a, lane labeled D-ϕ-WT). The left end fragment is indicated by LE; the right end fragment is indicated by RE. In future text, the position of a DNA cleavage will be indicated by the word position, followed by the percentage of the genome from the left end. For example, Bgl II cuts T3 DNA at position 44.0.
Figure 6.

Restriction endonuclease analysis. Particles in sequential fractions of a sucrose gradient were trimmed with 100 μg/ml DNase I; the sucrose gradient was similar to the one in Figure 3b. Also trimmed were both wild type and T3SR3-1 phages. The DNase I was inactivated and the DNase I-resistant DNA from each sample was purified (Materials and Methods Section). The purified DNA from each DNase I-digested sample was further digested with either (a) restriction endonuclease Bgl II or (b) restriction endonuclease Ava I and then fractionated by gel electrophoresis for (a) 36.0 hr and (b) 24.0 hr. Volumes of samples for the various lanes of Figure 6a (and 6b) were varied to make DNA visible, without overloading. The gels were stained with GelStar. The arrows indicate the direction of electrophoresis; the arrowheads indicate the origins of electrophoresis. The lanes with trimmed DNA from sucrose gradient fractions are labeled at the top with the number of the fraction. The lanes with DNase I-trimmed phages T3SR3-1 and T3 wild type are indicated by D-ϕ-SR and D-ϕ-WT, respectively. Other symbols above lanes: CH, conventional head peak; MH, modified head peak; ϕ-SR, undigested T3SR3-1 DNA; ϕ-WT, undigested wild type T3 DNA; ϕ-T7, undigested wild type T7 DNA; B, restriction endonuclease Bgl II digest of phage T7 mature DNA; H, restriction endonuclease Hind III digest of phage λ mature DNA; X, restriction endonuclease Xba I digest of phage T7 mature DNA. The lengths (Kb) of the band-forming (quantized) DNAs in the bracket-marked region of (a) are the following, based on distance migrated in relation to standards (% of genome missing is in parentheses): 15.4 (3.7), 14.4 (6.3), 13.7 (8.1), 12.3 (11.8), 12.0 (11.2), 11.8 (12.3).
DNase I-trimming revealed that only the left DNA end was externalized, for the modified heads in all of the fractions of a sucrose gradient. Trimming caused more rapid migration of over 95% of the original LE fragments (i.e., shorter LE fragment) for modified heads in fractions 4-7 of Figure 6a, including the MH peak (fraction 5). The migration speed varied, as seen via the presence of several bands in Figure 6a. However, for all fractions in Figure 6a, the migration speed of the RE fragment was not changed.
The DNA of conventional heads was not DNase I-sensitive, as judged by the following observation. As the CH peak was approached (fraction number > 7 in Figure 6a), the following decreased: (1) the amount of LE fragment altered in migration speed and (2) the extent of the change in speed for those fragments altered. At the CH peak, DNase I-trimming caused displacement of less than 5% of the original LE fragment.
The left end specificity of the DNase I trimming was confirmed when we repeated the experiment of Figure 6a after changing the restriction endonuclease to Ava I, which digests at position 0.89 only. Trimming caused the larger, LE fragment to migrate more rapidly, without altering the smaller RE fragment (Figure 6b), in confirmation of the observations of Figure 6a. The Ava I-generated LE DNA fragments from DNase I-trimmed, modified heads were large enough so that the resolution of the 0.7% gel used for Figure 6b was not high enough to reveal all of the bands seen in Figure 6a.
Quantization of the length of DNA expelled
Importantly, quantization of the length of external head DNA is implied by the sharp band-forming characteristic of the DNase I-trimming-shortened, left end Bgl II DNA fragments of Figure 6a (bracket). Between and including the MH and CH fractions, the primary bands in Figure 6a were five major bands and one relatively minor band. The relatively minor band was closest to the band of untrimmed LE fragment. The lengths of the DNase I-digested, external DNA segments varied from 1.4 Kb to 4.7 Kb (3.7–12.3% of the genome length), based on the positions of bands in Figure 6a. These lengths are presented in the Legend to Figure 6. The separations between nearest neighboring lengths varied from 0.2 Kb to 1.4 Kb and did not systematically either increase or decrease with external DNA segment length. A very weak seventh, smaller fragment (15.4% of genome removed by DNase I-trimming) was associated with fraction 4 in Figure 6a, closer to the meniscus than the MH peak fraction.
The analysis of Figure 6a revealed that a small amount (< 5%) of T3SR3-1 mature phage DNA was changed by digestion with DNase I (D-ϕ-SR lane in Figure 6a). Surprisingly, three weak, apparently displaced LE bands were observed, but were absent if DNase I digestion was omitted (ϕ-SR lane). Two of these bands (indicated by asterisks at the right in Figure 6a) were further from the origin than any of the bands observed for the modified heads. Apparently, the tails of some T3SR3-1 phages were defective in preventing externalization of a (relatively large) DNA segment (18.7 and 21.0% of the mature genome).
The decrease in external (DNase I-sensitive) DNA length with increasing sedimentation rate (increasing fraction number) in Figure 6a is in accord with basic physical principles (Discussion Section). The restriction analysis has detected modified heads throughout the region between MH and CH, even though the light scattering of Figure 3b did not detect them all.
Rapid recognition of modified heads: Native two-dimensional gel electrophoresis
We used a previously developed, native two-dimensional agarose gel electrophoresis (2d-AGE; Materials and Methods Section) to more rapidly analyze the T3SR3-1 Head fraction of a cesium chloride buoyant density centrifugation (see Figure 3a). Before removal of cesium chloride by dialysis, 2d-AGE revealed one major band (Figure 7a, panel i; GelStar staining). This band was close to the position of a band of conventional heads from a sucrose gradient. The marker for position was a band of T3 phage (labeled ϕ) in a separate quadrant of the same composite gel (Figure 7a, panel ii). The following fiducial white lines in panels i and ii (labeled phis;) intersect at the position of the ϕ band: a dashed diagonal line and a solid horizontal line. Effective radius (RE) decreases as the angle, θ. Figure 1a, panel ii, increases for the diagonal line (Materials and Methods Section). T3 (and T7) phage has RE of 30.1 nm (Stroud et al., 1981; Serwer et al., 1983).
Figure 7.

2d-AGE of untrimmed heads. (a) Analysis by 2d-AGE (Materials and Methods Section; 6.0 hr. first dimension; 16.0 hr. second dimension) was performed for particles from the Head fraction of a cesium chloride density gradient like the one in Figure 3b; the growth medium had 0.1 M NaCl. The analysis was performed immediately after dialysis of the cesium chloride (panel i). Phage T3 particles were also analyzed (panel ii). (b) Analysis by 2d-AGE (6.0 hr. first dimension; 16.0 hr. second dimension) was performed two weeks after dialysis and subsequent storage at 4 °C (panel i). Phage T3 particles were also analyzed (panel ii). (c) Analysis by 2d-AGE (4.5 hr. first dimension; 14.5 hr. second dimension) was performed for the following fractions of the sucrose gradient in Figure 3b (panel, followed by fraction number, the latter as indicated in Figure 4): i, 4; ii, 5; iii, 6. Phage T3 particles were also analyzed (panel iv). Black arrows indicate the directions of electrophoresis in the first (I) and second (II) dimensions; arrowheads indicate the leading edges of sample wells. The symbol, ϕ, indicates phage bands and also the dashed, diagonal lines derived from these bands, as described below. Other symbols: D, band of protein-free DNA; O, effective origin; θ, angle between the following two lines, both originating at the effective origin: line in the direction of the first electrophoresis and the diagonal line from the effective origin through the center of a band, in this case the ϕ band in panel iv (dashed line from panel iv, which was then translated to the other panels); white arrow, indication of the position of modified heads; bracket, indication of the position of presumed dimers of modified heads; number 2, position of presumed dimers of conventional heads. As discussed in the Methods Section, RE increases as θ decreases.
The T3SR3-1 heads of Figure 7a, panel i fall to the right of the dashed, diagonal line. Thus, these heads had an RE smaller(θ larger) than the phage RE. We presume that this smaller RE reflects, at least in part, the presence of the tail on phage particles, but not heads. The relatively minor band in Figure 7a, panel i (indicated by a line labeled 2) is in the position of a head dimer, as judged by electron microscopy and 2d-AGE of dimers generated by other capsids (data not shown).
Several new bands appeared after removal of cesium chloride by dialysis and subsequent storage for two weeks at 4 °C (Figure 7b, panel i). The major new bands are indicated with an arrow in Figure 7b, panel i. None of these new bands were seen pre-storage in Figure 7a, panel i. They were at positions all of which indicate a RE greater than the RE of the phage. Minor bands, of apparent multimers, were also present (bracket in Figure 7b, panel i). The change in 2d-AGE profile was complete at two weeks of T3SR3-1 head storage. After a month of storage, the 2d-AGE profile did not significantly change again.
As shown at the end of this section, modified heads formed the major bands marked by an arrow in Figure 7b, panel i. Thus, Figure 7 reveals that modified heads are storage-generated conversion products of conventional heads.
Production of the modified heads, as observed in of Figure 7b, panel i, was not observed for particles of the wild type Head band from a cesium chloride gradient, after the same procedure (not shown). However, by contrast, results indistinguishable from those in Figures 3b (above) and 8a (below) were obtained when tail-free heads were obtained by infecting (multiplicity = 3) a non-permissive host with T3 amber mutant in either gene 11 or gene 12. Genes 11 and 12 both encode tail proteins (Legend to Figure 1). That is to say, shortening (and presumably inactivating) a tail protein is sufficient to generate heads that will become modified heads during storage.
The arrow-indicated bands in Figure 7b, panel i were formed by particles that were, indeed, heads. This conclusion is based on staining of these particles with protein-specific Coomassie blue, after the photograph of Figure 7b, panel i was taken (not shown). The formation and sharpness of the arrow-indicated bands are explained by the quantized DNA externalization demonstrated above by restriction endonuclease analysis.
The arrow-indicated bands were at the positions of modified heads from the sucrose gradient of Figure 3b. The latter had an average RE that decreased as fraction number (of the sucrose gradient) increased from 4 (Figure 7c, panel i), to 5 (Figure 7c, panel ii) and 6 (Figure 7c, panel iii). The fiducial, diagonal line is for a band of T3 phage in panel iv. This dependence of band position on fraction number also existed for the rest of the same sucrose gradient between MH and CH fractions (not shown). Assuming that RE decreases as the external DNA segment becomes shorter (the packaged DNA segment has no detectable impact on 2d-AGE; Fang et al., 2008), these results imply that shortening the external DNA segment causes increase in sedimentation rate, as also concluded from the restriction endonuclease analysis of Figure 6a.
To complete the description of Figure 7, we note the following. Although most non-phage bands of Figure 7 were heads, one ultra-sharp, spot-like band (indicated by the letter, D) was not observed after Coomassie blue staining. Therefore, mature DNA formed the D band. This mature DNA had been completely expelled from heads.
The effective radius of DNase-trimmed heads
In confirmation of the externalization of the left DNA end only, RE decreased when modified heads were digested with a restriction endonuclease that cleaved from positions 1–14 (Mbo I; leftmost cleavage sites at positions 6.15, 20.4, 27.6; Bailey et al., 1980). But, RE did not decrease when the restriction endonuclease cleaved at position 20 or higher (Hind III, unique cleavage site at position 20.4; Bailey et al., 1980) (data not shown).
Modified heads (pre-digestion control: Figure 8a, panel iii) converted to yet smaller particles after digestion with either 200 μg/ml DNase I (Figure 8a, panel i) or 75 μg/ml DNase I (Figure 8a, panel ii). DNase I digestion produced a band that had a skewed shape that did not vary with DNase I concentration (Figure 8a, panels i and ii). The independence of DNase I concentration indicates a completion digest. In a completion digest, no more than ~4 nucleotides are expected to be external (Vanecko et al., 1961).
Figure 8.

2d-AGE of DNase I-trimmed heads. (a) Analysis by 2d-AGE (5.0 hr. first dimension; 15.0 hr. second dimension) was performed for modified heads from the MH fraction of a sucrose gradient (the growth medium had 0.4 NaCl) and this was done both before (panel iii) and after digestion with 75 μg/ml DNase I (panel ii) and 200 μg/ml DNase I (panel i). Phage T3 particles were also analyzed (panel iv). (b) 2d-AGE with a 2.4% second dimension gel (7.0 hr. first dimension; 31.0 hr. second dimension) was performed for 200 μg/ml DNase I-digested, modified heads from a sucrose gradient like the one in Figure 3b (the growth medium had 0.4 M NaCl); wild type phage T3 particles were added to the samples for panels i-iii. Arrows indicate the directions of electrophoresis in the first (I) and the second (II) dimensions; arrowheads indicate leading edges of sample wells; ϕ indicates a band of phage particles, used for the dashed line.
Insets in (a) are equally magnified images of the following, labeled at the lower left: (i and ii, outer insets), the skewed bands in Figure 8a, panels i and ii, respectively; (i and ii, inner insets), as in i and ii outer insets, with a visually drawn dashed line that follows a region of decreased density that generates a split-band appearance; (ϕ), un-skewed band of wild type T3 phage; (Am11), skewed band of modified heads from a non-permissive infection by a gene 11 amber mutant.
The skewed shape approached splitting to two bands. This point is illustrated by two insets labeled i, at the left above Figure 8a; both have a magnified image of the band-region of panel i. One panel i inset highlights the splitting with an eye-drawn white line. For the band of panel ii, two comparable insets are present (both labeled ii) and illustrate the same point. Evidence of skewing/splitting was not seen for (1) the phage band of Figure 8a, panel iv, even though the amount of phage in panel iv was over 5× the amount of heads in the other panels and (2) bands of more dilute T3 phage (equally magnified inset labeled ϕ in Figure 8a). But, a skewed band was observed for modified heads of a gene 11 (tail) mutant (equally magnified inset labeled Am11 in Figure 8a).
In Figure 8a, the component at the left of the white line of central insets, i and ii, was in a position indistinguishable from the position of heads before DNA expulsion. The other (skew-generating) component projected in the higher-θ, lower RE direction, reflecting the presence of heads (at least 40% of the total) with gp10 shells that were smaller. The mean difference in RE was 2.0 ± 0.4 nm by procedures of the Methods Section. The non-unimodal RE distribution for well fractionated, modified heads is possibly explained either by incomplete linkage of RE to expelled DNA length or by post-expulsion change in RE.
Finally, given the heterogeneity of DNA leakage, we investigated the dependence of RE (after DNase I trimming) on the sedimentation rate of the modified heads (before trimming). While so doing, we increased RE-resolution by changing the second dimension agarose gel concentration from 2.0% to 2.4%. Results are shown for modified heads from the following sucrose gradient fractions: the trailing side of the MH peak (Figure 8b, panel i), the MH peak (Figure 8b, panel ii) and the leading side of the MH peak (Figure 8b, panel iii); all samples had internal phage markers. Qualitatively, Figure 8b, panels i–iii all had profiles like those in Figure 8a, panels i and ii, except that the skew-generating, low-RE band segment spread further in the low-RE direction and was relatively diffuse.
By contrast, a band of DNase I-trimmed conventional heads, from the same sucrose gradient, did not have a detectable low-RE extension to the right (Figure 8b, panel iv). In addition, with the assistance of the increased resolution, one can see that the diagonal, dashed, ϕ band-derived line passes through the middle of the band of DNase I-trimmed conventional heads (Figure 8b, panel iv). But, this line passes slightly below the band of DNase I-trimmed modified heads (Figure 8b, panels i – iii). This implies a θ smaller (RE larger) for the conventional heads; the difference in RE is 0.1 ± 0.05 nm.
Electron microscopy
Electron microscopy of negatively stained, modified heads confirmed partial externalization of DNA. Initially, we observed heads from the Head fraction of a cesium chloride density gradient, such as the one in Figure 3a. The cesium chloride was removed during staining. The heads appeared filled with DNA, without either a tail or external DNA (Figure 9a).
Figure 9.
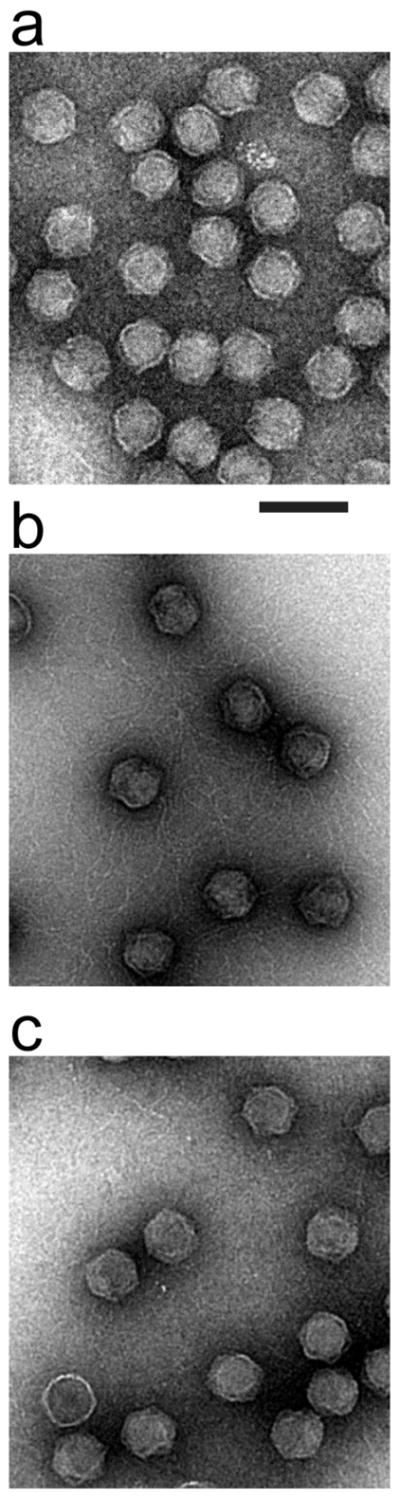
Electron microscopy. The following specimens, prepared by negative staining with uranyl acetate, were observed by electron microscopy. (a) Particles from the Head band fraction of a cesium chloride buoyant density centrifugation (see Figure 3a). (b) Particles from the MH band fraction of a sucrose gradient (see Figure 3b) after dialysis. (c) Particles from the CH band fraction of a sucrose gradient (see Figure 3b) after dialysis. The length of the magnification bar is 100 nm.
By contrast, external DNA was observed in the case of modified heads from the MH peak fraction of a sucrose gradient. DNA strands were omnipresent and tangled with each other (Figure 9b). Only an occasional DNA filament was observed in the case of conventional heads from the CH peak fraction of a sucrose gradient (Figure 9c). This occasional DNA filament was presumably from an occasional DNA molecule that had been completely expelled from heads, as seen by 2d-AGE in Figure 7 (D band).
Sites mutated
As expected based on the number of selection steps used to generate T3SR3-1, comparison of the sequence of T3SR3-1 to the sequence of our wild type T3 revealed multiple mutations. The number of mutations varied with [NaCl] in the post-isolation medium of propagation. T3SR3-1 had five mutations, when the medium had 0.9 M NaCl. Quantized DNA expulsion was found by 2d-AGE (as in Figure 7a, b) after infection with phage from this sequenced preparation.
Not surprisingly, the five mutations included three non-synonymous mutations in genes that encode a tail protein. These three mutations were in non-fiber tail proteins (see the legend to Figure 1), (1) gene 11, Y102H (TAT: CAT), and (2) gene 12, S5N (AGT: AAT); A62T (GCG: ACG). The fourth mutation was in gene 6 exonuclease, C127Y (TGC: TAC) and the fifth was in gene 1.05, which encodes a protein of unknown function, T61I (ACT: ATT). No head gene was mutated and neither the large nor the small terminase genes (19 and18) was mutated.
Discussion
DNA packaging and injection
We have shown here that the left end segment of a packaged, mature DNA molecule undergoes storage-induced, quantized expulsion from some T3SR3-1 heads (quantized DNA expulsion phenotype). The various quantized expulsion lengths might derive from (1) identical heads, each of which generates the various expulsion lengths progressively, (2) variable heads, each of which generates only one expulsion length, (3) a combination of (1) and (2). We make the (unproven) assumption of identical heads, because we did not find evidence of head variability before expulsion. Both the quantized DNA expulsion phenotype and the mutant selection are novel.
To our knowledge, the most comparable, previously isolated particle is the phage lambda docL, defective transducing particle. The lambda docL particle (1) was derived from excision of a prophage, (2) was not purified in stable form and (3) was not found to have quantized external DNA. Given the absence of a head gene mutation in T3SR3-1 and the data for gene 11 and gene 12 amber mutants, tail-dependence of either head assembly or head maturation is at least part of the cause for the formation of modified heads. The genetic, physical and biochemical complexity currently precludes analyzing details of how head assembly/maturation was modified. Nonetheless, the genotype and phenotype are informative, as described below.
The quantized DNA expulsion phenotype of T3SR3-1 appears related to the previously observed quantized DNA packaging (Introduction) because the separation in nearest neighboring quantized DNA lengths was 0.2–1.4 Kb for both. However, the quantized, packaged DNA lengths of modified heads are greater than those for the ipDNA-capsids of Serwer et al. (2010).
In further support of linkage between the above two DNA quantization phenomena, we conclude from the following that a modified head-associated DNA molecule, like a DNA molecule being packaged, traverses the axial channel of the connector. First, no other channel is known in an intact gp10 shell. The gp10 shell of modified heads is intact, based on DNase I protection for the packaged DNA segment. Second, the selectivity needed to quantize expulsion implies that the DNA molecule traverses an evolved, not an accidental, channel. The connector is at the external end of the only evolved channel known to be in the shell. Third, expulsion of only left end DNA segments supports this reasoning in that the left DNA end is the last DNA end packaged (Fujisawa and Morita, 1997; Son et al., 1993) and the first injected (Fujisawa and Morita, 1997; Pao and Speyer, 1973; Saigo, 1975), through the channel of the T3/T7 connector.
To improve and extend models of in vivo DNA packaging and injection, we first ask what is the DNA quantization ruler of T3 modified heads. The alternatives, which are not mutually exclusive, are (1) quantized changing of volume accessible to packaged DNA, (2) quantized movement of either connector or core stack proteins (see Figure 1), (3) quantized melting of multiple DNA phases and (4) one-at-a-time unraveling of multiple packaged DNA segments. The first consideration is that the ruler must have a means for quantizing DNA expulsion in the presence of length-randomizing thermal motion of either any single DNA segment or any single protein. The ruler must also be effective as a measuring tool at the length of the external DNA segment of modified heads, 480 – 1,600 nm (3.7–12.3% of the genome expelled).
The source of quantization is not one-at-a-time unraveling of DNA domains with dimensions suggested by ring-like layers previously observed in 3D reconstructions of T7 phage (Cerritelli et al., 1997; Fang et al., 2008), based on the following reasoning. Externalization of 1,600 nm of DNA changes the volume of packaged DNA (assumed 2.4 nm in diameter, hydrated) by an amount equal to 0.27x the volume in the outermost ring-like layer, 30 nm in radius and 2.4 nm thick. This outer layer is where all but the tip of the left end is expected (Fang et al., 2008). Thus, less than one layer of DNA segments is involved in each ruler-determined quantization event observed here.
Quantized melting of multiple packaged DNA phases is also not a source of the DNA quantization ruler, because multiple packaged DNA phases have not been discriminated when cryo-EM was performed of either phage T3 or T7 (Cerritelli et al., 1997; Fang et al., 2008). Nonetheless, multiple phases have been discriminated by cryo-EM for packaged phage T5 DNA, which is about 3x longer than T3/T7 DNA (Leforestier and Livolant, 2010). In addition, injection of T5 DNA occurs in steps (Mangenot et al., 2005; Chiaruttini et al., 2010) larger than steps of quantized T3 DNA expulsion.
Thus, multiple capsid proteins provide the ruler. The average DNA expulsion-associated contraction found here for some gp10 shells (Figures 8) is about 2 nm, which causes a 19% reduction in the internal cavity volume. This reduction encompasses roughly the range of volumes vacated by the DNase I-sensitive DNA segment. Thus, the working hypothesis is that the gp10 shell of modified heads undergoes quantized contraction and, therefore, quantized reduction in the volume of the shell’s cavity. As quantized contraction occurs, the DNA channel narrows so that the DNA molecule becomes clamped in a partially expelled state, thereby forming modified heads. A clamp must exist to counter the expulsion force (Nurmemmedov et al., 2012; Castelnovo and Evilevitch, 2007) on the packaged segment of the DNA molecule. The clamping component is probably the connector, which has two regions in position to contact DNA: the tunnel loop and the C-terminal disordered region, as shown for the phage SPP1 connector (Lebedev et al., 2007; Oliveira et al., 2010). The T7 (and presumably T3) connector was recently found by cryo-EM to be structurally homologous to the SPP1 connector (Guo et al., 2013).
Although the ~ 2 nm shell contraction observed here is a source of the working hypothesis, we did not observe (and could not have observed) 2d-AGE-generated bands comparable to the bands of Bgl II fragments of DNase I-protected modified head DNA. The reason is diffusion-dominated limitation of the resolution of 2d-AGE.
In contrast to the spontaneous DNA expulsion observed here, in vivo DNA injection occurs via a tail that blocks spontaneous expulsion and presumably helps to account for an injection time of minutes, rather than the longer time observed here. When the working hypothesis is translated to in vivo DNA injection, it makes the following prediction. Quantized shell contraction helps to drive DNA injection at the start of a T3 infection; the proposed source of energy is the gp10 shell, where energy had been stored. That is to say, we propose that the hypodermic needle analogy for DNA injection (Inamdar et al., 2006; Grayson and Molineux, 2007; Petrov et al., 2013) extends to the energetics. Thus, the hypothesis implies quantization of the in vivo DNA injection that starts an infection.
We suggest that the evolutionary basis for this quantization is selection for (programmed) periodic stalling of DNA injection. The reasoning is the following. (1) DNA injection, which involves several biochemical events that may occur in parallel (Inamdar et al., 2006; Grayson and Molineux, 2007; Petrov et al., 2013), occurs in an environment that has sufficient variability to make responding to the environment a selective advantage via either (1) activation of the injection pathway that is most likely to succeed, or (2) reversal of injection when the environment is not favorable enough. Programmed, periodic stalling of injection provides time for feedback control. In the case of DNA packaging, the proposal is that programmed stalling also occurs to provide time for feedback control (see Serwer, 2011).
Flexibility of capsid shells has previously been observed for other phages. Specifically, two quantized, smaller-than-phage RE values were observed by 2d-AGE for phage P22 capsids that had expelled all DNA (Casjens et al., 1992). In addition, phage HK97 shells have multiple radii. The HK97 shells were generated during artificial procapsid expansion, and spontaneous covalent cross-linking stabilized some of them (Huang et al., 2011). Finally, multiple radii were observed during expansion of the herpes simplex virus procapsids (Heymann et al., 2003). As discussed in the supplement of Serwer and Jiang (2012), RE-altered shell states are likely for phage lambda, given the packaging of a DNA molecule 14% longer than mature lambda DNA (Nurmemmedov et al., 2012).
Physical chemistry and intermediate fractionation/characterization
An 11.7% DNA expulsion caused a change in sedimentation rate that appears, at first, to be surprisingly large (MH band in Figure 3b). However, we know that the sedimentation coefficient (S) of T7 phage decreases by a factor of 11.3 (453S to 40S) when 100% of the packaged DNA molecule is externalized, but remains bound to the capsid (Serwer and Watson, 1981). DNA sedimentation rate in a sucrose gradient varies as the 0.38th power of the DNA length (Serwer et al., 1978), which means that the frictional coefficient varies as the 0.62th power of DNA length, roughly what was found by quantitative analysis of DNA diffusion, 0.59 (Robertson et al., 2006). Thus, for 11.7% DNA externalization, the frictional coefficient is less by a factor of 3.78 than that for 100% externalization (i.e., 100.62log(1/0.117)). Then, based on the external DNA segment alone, the sedimentation rate in Figure 3b should be reduced by a factor of 11.3/3.78 = 3.0 when 11.7% of the packaged genome has become externalized. This is close enough to what is observed in Figure 3b, i.e., 2.9, so that the external DNA segment has to be the dominant factor determining sedimentation rate.
A lesson is that one cannot see effects of variable shell RE via sedimentation rate of either modified heads or physically analogous particles. The variability in RE was also too small to be detected by electron microscopy of a negatively stained specimen. The reasons are specimen preparation-induced size change (Serwer, 1977) and variation in orientation of polyhedral capsids. In theory, cryo-EM can be used. But, for radius differences as small as those measured and implied here, reliability is not expected with current technology. The reasons are heterogeneity of modified heads and need for crosschecking radii via structures of subunits within gp10 shells. The use of 2d-AGE for RE determination bypasses the need for sample homogeneity. The rigor and accuracy of 2d-AGE are greater than those from one-dimensional gel-based procedure, for example, molecular weight measurement by SDSPAGE (Serwer, 1987).
A second lesson is that native gel electrophoresis is highly effective for detecting capsids with a variable-length segment of DNA protruding. Most well preserved DNA packaging intermediates will be of this type. Developing such native gel procedures was not possible until model particles like the modified heads were in hand.
Materials and Methods
Propagation of phage and fractionation of phage-infected cell lysates
Unless otherwise indicated, we propagated phage T3 and T3 mutants in 2xLB medium: 20 g Bacto tryptone, 10 g Bacto yeast extract per liter, 0.1 M NaCl. To the extent indicated in the text, we altered the [NaCl] by adding sterile NaCl in 5.0 M solution. We performed single-plaque propagation by conventional procedures with a 0.7% agar (Bacto) agar overlay. Plates were incubated at 30 °C. The host bacterium was E. coli BB/1, except for the propagation of amber mutants. The (permissive) host for propagation of amber mutants was E. coli 011’; the non-permissive host was E. coli BB/1. Wild type phage T3 was originally obtained from F.W. Studier (Studier, 1979). T3 amber mutant in gene 11 (NG14a; original source, H. Fujisawa) and gene 12 (A66a; original source, R. Hausman) was received from Ian Molineux.
Preparative propagation of T3SR3-1 in liquid culture began by addition of an entire plaque to 100 ml of aerated, log phase culture bacterial culture in 2xLB medium supplemented with 0.8 M NaCl. The concentration of bacteria was 2–4×10⁷ bacteria per ml, via observation in a Petroff-Hauser chamber. The culture was incubated to spontaneous lysis at 30 °C and cellular debris was removed by low speed centrifugation (seed stock).
To prepare a lysate for purification of T3SR3-1 phages and heads, a 30 °C, aerated, six liter, log phase culture of host cells was grown to 3.0 × 10⁸ per ml and then infected with 1.5×10⁵ phage per ml (final concentration) from a seed stock. The culture was incubated at 30 °C, with aeration for 120 min at which time lysis, which had begun, was completed by addition of 12 ml of chloroform. Incubation with aeration was continued for 15 min. As indicated, a NaCl supplement was sometimes added to the medium before host inoculation. To prepare a lysate for the purification of wild type phages and heads, the above procedure was used with a 30× higher phage inoculum and omission of the addition of chloroform, which was not needed for lysis.
SR mutants
We began our isolation of SR mutants by selecting a single plaque that formed in a Petri plate with upper and lower agarose layer supplemented with 0.4 M NaCl, i.e., 0.5 M NaCl total. Phages from these plaques were already SR (stage 1) when plating was compared in media with 0.1 M NaCl and 0.5 and 0.65 M NaCl, as in Figure 2 (not shown).
We continued with phages from a single plaque of one of these stage 1 mutants and isolated a stage 2 mutant by plating with upper and lower agarose layer having 0.7 M NaCl total. Finally, we repeated this sequence with upper and lower agarose layer having 0.9 M NaCl total. (stage 3). Phages in each stage 3 plaque were found to be even more SR.
To determine the amino acid changes in mutant-encoded proteins, the Illumina MiSeq process was used after ligating Illumina TruSeq adaptors on each end of sheared (to ~500bp) DNA fragments. The data were processed by breseq-0.22 software by use of the reference T3 sequence in NCBI GenBank. The genomic sequence of our wild type T3 was compared to the genomic sequence of T3SR3-1 to determine the amino acid changes. Our wild type T3 genome had 23 non-synonymous base changes in relation to the wild type T3 sequence in GenBank.
Ultracentrifugal fractionation of phage-like particles from lysates
Phage-like particles were concentrated and purified from 6-liter lysates. We first added NaCl to the lysate to a final concentration of 0.9 M. We removed debris by low-speed centrifugation at 4,000 rpm in a TYJS-4.2 rotor in a Beckman J-6 centrifuge. Then, we precipitated phages and related particles by addition of 9% (w/v) polyethylene glycol 8,000 and storage at 4 °C for 2 – 4 days. After low-speed pelleting of the precipitate, particles were resuspended in 0.5 M NaCl, 0.01 M Tris-Cl, 0.001 M MgCl2 (resuspension buffer), and were clarified by pelleting via low-speed centrifugation. After pelleting, the precipitate was twice washed with resuspension buffer and the supernatants were pooled. Particles in the pooled supernatants were again precipitated with 9 % polyethylene glycol 8,000, clarified and washed. DNase I was added to a concentration of 2.5 μg/ml and partial DNA digestion (to reduce viscosity) was conducted at 30 °C for 90 minutes.
The concentrated, clarified particles were further purified in two, tandem cesium chloride density gradients. The first gradient (step gradient) was pre-poured in the following steps in a 12.2 ml centrifuge tube for the Beckman SW41 rotor: 1.5 ml, 1.226 g/ml; 1.0 ml, 1.288 g/ml; 1.5 ml, 1.446 g/ml; 1.0 ml, 1.51 g/ml; 1.0 ml; 1.73 g/ml. A 6.2 ml portion of a processed lysate was then layered on a step gradient and centrifuged at 18 °C, 33,000 rpm for 3.0 hr. Fractions were collected by pipeting from the top with visual detection of bands. We identified particles by density (as determined from refractive index) and determined other characteristics in the Results Section.
Phage particles and heads co-banded in step gradients for both wild type T3 and T3SR3-1. These particles were further fractionated by buoyant density centrifugation in a cesium chloride density gradient. Pooled “phage” fractions from 2–3 step gradients were brought to a density of either 1.483 g/ml, in the case of T3SR3-1 and amber mutants, or 1.499 g/ml, in the case of wild type T3, and centrifuged at 40,000 rpm, 4 °C, for 16.0 hours. Photographs were taken of light scattering from particles in a density gradient. Fractions were collected by pipeting from the top.
Heads from the latter density gradients were dialyzed against 0.2 M NaCl, 0.01 M Tris-Cl, pH 7.4, 0.001 M MgCl2 (T/M buffer). After storage at 4 °C for the time indicated, the heads were further fractionated by rate zonal centrifugation in a 10.8 ml, linear, 10–35% sucrose gradient that had been pre-poured above a 0.8 ml, 62% sucrose layer, all in the following buffer: 0.2 M NaCl, 0.01 M Tris-Cl, pH 7.4, 0.01 M MgCl2. Sample in a volume of 0.5 ml was layered on top of the sucrose gradient in a centrifuge tube for the Beckman SW41 rotor. The sample was centrifuged at 14,500 rpm, 18 °C, for 2.0 hr in this rotor. Photographs were taken of light scattering from particles in the density gradient. Fractions were collected by pipeting from the top. The concentration of head- and phage-associated DNA was determined via optical density at 260 nm (39.7 g DNA/OD260 unit; Bancroft and Freifelder, 1970).
Gel electrophoresis and enzymatic digestion of DNA
The length of head-associated DNA molecules was determined by agarose gel electrophoresis, sometimes after DNase I-trimming of capsid-external DNA. To trim the external DNA, DNase I dissolved in T/M buffer was diluted to the concentration indicated, by a factor of at least 1:20. This mixture was incubated at 30 °C for 1.0 hr. To stop the digestion, a 1:10 dilution of 0.2 M sodium EDTA, pH 7.4 was added, followed by a 1:35 dilution of 35% Sarkosyl NL97. This mixture was incubated at 85°C for 10 minutes to separate DNA from capsid. To determine DNA length without trimming, heads were taken from a sucrose gradient and used without dialysis. The following was added to 35 μl of a sample, sometimes diluted by the buffer of the sucrose gradient: 3.5 μl of 0.2 M sodium EDTA, pH 7.4 and 1.0 μl 35 % Sarkosyl NL97. The temperature was then raised to 85 °C for 10 min.
Post-DNA expulsion, 33 μl of the above was added to 5.5 μl of the following mixture: 30% sucrose, 6.0% Sarkosyl NL97, 0.6 M NaCl, 0.06 M Tris-Cl, 0.06 M sodium EDTA, pH 7.4. A portion of the final mixture was layered in a sample well of a horizontal, submerged, 0.25% agarose slab gel cast in DNA electrophoresis buffer: 0.05 M sodium phosphate, pH 7.4, 0.001 M EDTA. Electrophoresis was performed at 0.34 V/cm, room temperature (22 ± 2 °C) for 26.0 hours.
When an expelled DNA molecule was to be restriction endonuclease digested, the above procedure of expulsion was followed by phenol extraction and 3x dialysis (minimum of 6 hours total) against DNA buffer: 0.1 M NaCl, 0.01 M Tris-Cl, pH 7.4, 0.001 M EDTA. Restriction endonuclease digestion was performed after adding 15 μl of phenol-extracted DNA to 15 μl of REB: 0.035 M MgCl2, 148 μg/ml bovine serum albumin, 1.1% β-mercaptoethanol. The indicated restriction endonuclease (Ava I, Hind III from New England Biolabs, Ipswich, MA; Bgl II from US Biochemicals, Cleveland, OH) was added and digestion continued at 37 °C for 2.0 hr. The digestion was stopped by adding 5 μl of 35% sucrose, 0.08 M sodium EDTA, 200 μg/ml bromophenol blue. This mixture was layered in a sample well of a horizontal, submerged, 0.7% agarose slab gel cast in DNA electrophoresis buffer. Electrophoresis was performed at 0.5 V/cm, 25 °C for the time indicated in a figure legend. DNA in agarose gels was stained by soaking a gel in a 1:10,000 dilution of GelStar (New England Biolabs) in 0.001 sodium EDTA, pH 7.4. A gel was stained for 2 hr at room temperature (25 ± 2 °C) and then de-stained in 0.001 sodium EDTA, pH 7.4 for at least 2 hr. Digital photographs were taken of the gel under illumination with ultraviolet light, as described below under 2d-AGE.
The following restriction endonuclease digests were used as DNA length standards (digest, followed by fragment lengths in Kb): Hind III digest of phage lambda DNA (the digest was obtained from New England Biolabs), 23.13, 9.42, 6.56, 4.36, 2.32, 2.03; Xba I digest of phage T7 DNA (Xba I was obtained from New England Biolabs), 12.83, 11.37, 10.10, 5.64; Bgl II digest of phage T7 DNA, 28.42 and 11.52 Kb. DNA length standards also included the intact DNA of phage λ (48.5 Kb), which was obtained by diluting phage λ by at least 1:10 into DNA buffer and raising the temperature to 75 °C for 15 min. The intact DNA of phage T7 (39.9 Kb) was obtained by phenol extraction/dialysis of purified phage T7, which had been prepared by use of the procedure described above for phage T3.
SDSPAGE
SDSPAGE was performed by use of a separating gel of 9% polyacrylamide. The procedures have been previously described (Fang et al., 2008). Staining was performed by use of Sypro Ruby protein stain (Biorad). Proteins were visualized by use of a Typhoon Scanner 9410 from Amersham Biosciences.
Native, two-dimensional agarose gel electrophoresis (2d-AGE)
We used the following sample preparation procedure for 2d-AGE when the particles in a sample were not to be trimmed by DNase digestion. A sample from a sucrose density gradient was added to a 0.091× volume of the following mixture: 56.4% sucrose, 189 μg/ml bromophenol blue, 240 μg/ml bovine serum albumin, 0.085 M Tris-Acetate, pH 8.4, 0.0094 M MgCl2. We used the following sample preparation procedure when the particles in a sample were either to be trimmed by DNase I digestion or to be used as an untrimmed control for trimming, before 2d-AGE. A sample from a sucrose density gradient was appropriately diluted in the buffer for the sucrose gradient and then added to an equal volume of REB. Then, digestion was conducted by adding a 0.040× amount of either enzyme or water (the latter for the control) and incubating at the temperature indicated for 2.0 hr. After digestion, the sample for 2d-AGE was made by adding the digest to a 0.10× volume of 40% sucrose, 133 μg/ml bromophenol blue, 0.06 M Tris-Acetate, pH 8.4, 0.00066 M MgCl2.
To perform 2d-AGE, a sample was layered and allowed to stay for 0.5 hr in one of four sample wells at the origins of four first dimension gels that had been embedded in a single slab of second dimension gel, all in capsid electrophoresis buffer: 0.09 M Tris-acetate, pH 8.4, 0.001 M MgCl2. Details for pouring this composite gel have been previously described (Serwer, 1985). When a sample came directly from a cesium chloride density gradient, the sample was dialyzed by leaving it in the sample well for 1.5 hr before starting electrophoresis. Electrophoresis through the first dimension gels was conducted at 2.0 V/cm for the time indicated. Then, the direction of electrophoresis was rotated by 90°, without handling the composite gel, and electrophoresis in the second dimension was performed at 1.8 V/cm for the time indicated. In the second dimension, the sample migrated out of the first dimension gel into the second dimension gel. The first dimension gel was made of 0.30 % Seakem LE agarose (Lonza). The second dimension gel was made of Seakem LE agarose at a concentration of 2.0%, unless otherwise indicated.
After 2d-AGE, a composite gel was stained first for nucleic acid with GelStar, as done above. Digital photographs were made of fluorescence excited by a Fotodyne, Model#3-3000 ultraviolet transilluminator at the top of the gel. Then, a composite gel was re-stained with Coomassie blue (Fang et al., 2008).
The profile after 2d-AGE was interpreted by use of the following concepts and procedure, as documented with standards and summarized in Serwer (1987). The mobility in the first dimension, dilute gel is a function primarily of the electrostatic force on the particle, which is determined by average electrical surface charge density (σ and magnitude of the electrical field. A small effect on mobility of dilute gel-induced, RE-dependent sieving also occurs in the first dimension. The effect of electrostatic force is the same in the second, concentrated-gel dimension as it is in the first, dilute-gel dimension. But, the opposing force of sieving is much higher in the second dimension. Sieving-generated force is not a function of σ, but increases with the dimensions of the particle, in our case, RE. An aggregate has the same σ as the monomer, but a larger RE. Thus, aggregates co-migrate with the monomer in the first dimension, although not perfectly because of a small effect of sieving. Aggregates migrate more slowly than the monomer in the second dimension primarily because of difference of RE. Quantification of RE values for roughly spherical particles was performed by use of (1) a T3 phage marker, 30.1 nm in radius, (2) a capsid I marker, 26.1 nm in radius, and (3) a capsid II marker, 28.1 nm in radius. Procedures have been previously described (Serwer and Wright, 2012). The capsid I and capsid II markers were in the sample that had the phage marker and were visualized by Coomassie staining.
Electron microscopy
A sample from a sucrose density gradient was dialyzed against 0.2 M NaCl, 0.01 M Tris-Cl, 0.001 M MgCl2. A sample from a cesium chloride density gradient was used undialyzed. An undialyzed sample was prepared for electron microscopy by initially placing a drop on a Formvar/Carbon Film coated grid (FCF400-Cu; Electron Microscopy Sciences, Hatfield, PA), incubating for 5 min and then washing with 3 drops of distilled, deionized water. The adsorbed, washed sample was stained with 1 drop of 2% uranyl acetate. The excess uranyl acetate was then removed by wicking with Whatman #1 filter paper and the specimen allowed to air dry. The dialyzed samples were prepared for electron microscopy by the same procedure, but without water washing. Grids were examined with a transmission electron microscope (Philips, CM200) at a magnification of 20,000.
[1] We implement directed evolution- and DNA sequencing-based phage assembly genetics.
[2] We purify stable, mutant phage heads with a partially leaked mature DNA molecule.
[3] Native gels and DNase-protection show leaked DNA segments to have quantized lengths.
[4] Native gels after DNase I-removal of leaked DNA reveal the capsids to vary in radius.
[5] Thus, we hypothesize leaked DNA quantization via variably quantized capsid radius.
Acknowledgments
We thank Dr. Consuelo Walss-Bass for making available the Typhoon imager. We thank Dr. James J. Bull, The University of Texas at Austin, and Dan New, IBEST Genomics Resources Core, University of Idaho (supported by NIH-NCRR-5P20RR016448-10 and NIH-NIGMS-8 P20 GM103397-10), for the sequencing of wild type and mutant T3 genomes. This work was supported by NIH (R01AI072035) and the Welch Foundation (AQ-764). Electron micrographs were taken in the Purdue Biological Electron Microscopy Facility.
Footnotes
Publisher's Disclaimer: This is a PDF file of an unedited manuscript that has been accepted for publication. As a service to our customers we are providing this early version of the manuscript. The manuscript will undergo copyediting, typesetting, and review of the resulting proof before it is published in its final citable form. Please note that during the production process errors may be discovered which could affect the content, and all legal disclaimers that apply to the journal pertain.
References
- Bailey JN, Dembinski DR, McAllister WT. Derivation of a restriction map of bacteriophage T3 DNA and comparison with the map of bacteriophage T7 DNA. J Virol. 1980;35:176–183. doi: 10.1128/jvi.35.1.176-183.1980. [DOI] [PMC free article] [PubMed] [Google Scholar]
- Bakker SE, Ford RJ, Barker AM, Robottom J, Saunders K, Pearson AR, Ranson NA, Stockley PG. Isolation of an asymmetric RNA uncoating intermediate for a single-stranded RNA plant virus. J Mol Biol. 2012;417:65–78. doi: 10.1016/j.jmb.2012.01.017. [DOI] [PMC free article] [PubMed] [Google Scholar]
- Bancroft FC, Freifelder D. Molecular weights of coliphages and coliphage DNA. I Measurement of the molecular weight of bacteriophage T7 by high-speed equilibrium centrifugation. J Mol Biol. 1970;54:537–546. doi: 10.1016/0022-2836(70)90124-5. [DOI] [PubMed] [Google Scholar]
- Bjornsti MA, Reilly BA, Anderson DL. Morphogenesis of bacteriophage phi29 of Bacillus subtilis: oriented and quantized in vitro packaging of DNA protein gp3. J Virol. 1983;45:383–396. doi: 10.1128/jvi.45.1.383-396.1983. [DOI] [PMC free article] [PubMed] [Google Scholar]
- Casjens SR. The DNA-packaging nanomotor of tailed bacteriophages. Nature Rev Microbiol. 2011;9:647–657. doi: 10.1038/nrmicro2632. [DOI] [PubMed] [Google Scholar]
- Casjens S, Wyckoff E, Hayden M, Sampson L, Eppler K, Randall S, Moreno ET, Serwer P. Bacteriophage P22 portal protein is part of the gauge that regulates packing density of intravirion DNA. J Mol Biol. 1992;224:1055–1074. doi: 10.1016/0022-2836(92)90469-z. [DOI] [PubMed] [Google Scholar]
- Castelnovo M, Evilevitch A. DNA ejection from bacteriophage: towards a general behavior for osmotic suppression experiments. Eur Phys J E. 2007;24:9–18. doi: 10.1140/epje/i2007-10205-5. [DOI] [PubMed] [Google Scholar]
- Catalano CE. The terminase enzyme from bacteriophage lambda: a DNA packaging machine. Cell Mol Life Sci. 2000;57:128–148. doi: 10.1007/s000180050503. [DOI] [PMC free article] [PubMed] [Google Scholar]
- Cerf R, Michels B, Schulz JA, Witz J, Pfeiffer P, Hirth L. Ultrasonic absorption evidence of structural fluctuations in viral capsids. Proc Natl Acad Sci USA. 1979;78:1780–1782. doi: 10.1073/pnas.76.4.1780. [DOI] [PMC free article] [PubMed] [Google Scholar]
- Cerritelli ME, Cheng N, Rosenberg AH, McPherson CE, Booy FP, Steven AC. Encapsidated conformation of bacteriophage T7 DNA. Cell. 1997;91:271–280. doi: 10.1016/s0092-8674(00)80409-2. [DOI] [PubMed] [Google Scholar]
- Chiaruttini N, de Frutos M, Augarde E, Boulanger P, Letellier L, Viasnoff V. Is the in vitro ejection of bacteriophage DNA quasistatic? A bulk to single virus study. Biophys J. 2010;99:447–455. doi: 10.1016/j.bpj.2010.04.048. [DOI] [PMC free article] [PubMed] [Google Scholar]
- Cuervo A, Pulido-Cid M, Chagoyen M, Arranz R, González-García VA, Garcia-Doval C, Castón JR, Valpuesta JM, van Raaij MJ, Martín-Benito J, Carrascosa JL. Structural characterization of the bacteriophage T7 tail machinery. J Biol Chem. 2013;288:26290–26299. doi: 10.1074/jbc.M113.491209. [DOI] [PMC free article] [PubMed] [Google Scholar]
- Dunn JJ, Studier FW, Gottesman M. J Mol Biol. 1983;66:477–535. doi: 10.1016/s0022-2836(83)80282-4. [DOI] [PubMed] [Google Scholar]
- Fang PA, Wright ET, Weintraub ST, Hakala K, Wu W, Serwer P, Jiang W. Visualization of bacteriophage T3 capsids with DNA incompletely packaged in vivo. J Mol Biol. 2008;384:1384–1399. doi: 10.1016/j.jmb.2008.10.012. [DOI] [PMC free article] [PubMed] [Google Scholar]
- Fujisawa H, Morita M. Phage DNA packaging. Genes to Cells. 1997;2:537–545. doi: 10.1046/j.1365-2443.1997.1450343.x. [DOI] [PubMed] [Google Scholar]
- Grayson P, Molineux IJ. Is phage DNA “injected” into cells - biologists and physicists can agree. Curr Opin Microbiol. 2007;10:401–409. doi: 10.1016/j.mib.2007.04.004. [DOI] [PMC free article] [PubMed] [Google Scholar]
- Guo F, Liu Z, Vago F, Ren Y, Wu W, Wright ET, Serwer P, Jiang W. Visualization of uncorrelated tandem symmetry mismatches in the internal genome packaging apparatus of phage T7. Proc Natl Acad Sci, USA. 2013;110:6811–6816. doi: 10.1073/pnas.1215563110. [DOI] [PMC free article] [PubMed] [Google Scholar]
- Harrison SC, Sorger PK, Stockley PG, Hogle JM, Altman R, Strong RK. Mechanism of RNA virus assembly and disassembly. In: Brinton MA, Rueckert R, editors. Positive Strand RNA Viruses. UCLA Symposium of Molecular and Cellular Biology. Alan R. Liss; NewYork: 1987. pp. 379–385. [Google Scholar]
- Heymann JB, Cheng N, Newcomb WW, Trus BL, Brown JC, Steven AC. Dynamics of herpes simplex virus capsid maturation visualized by time-lapse cryo- electron microscopy. Nat Struct Biol. 2003;10:334–341. doi: 10.1038/nsb922. [DOI] [PubMed] [Google Scholar]
- Huang RK, Khayat R, Lee KK, Gertsman I, Duda RL, Hendrix RW, Johnson JE. The prohead-I structure of bacteriophage HK97: implications for scaffold-mediated control of particle assembly and maturation. J Mol Biol. 2011;408:541–554. doi: 10.1016/j.jmb.2011.01.016. [DOI] [PMC free article] [PubMed] [Google Scholar]
- Inamdar MM, Gelbart WM, Phillips R. Dynamics of DNA ejection from bacteriophage. Biophys J. 2006;91:411–420. doi: 10.1529/biophysj.105.070532. [DOI] [PMC free article] [PubMed] [Google Scholar]
- Khan SA, Hayes SJ, Watson RH, Serwer P. Specific, nonproductive cleavage of packaged bacteriophage T7 DNA in vivo. Virology. 1995;210:409–420. doi: 10.1006/viro.1995.1357. [DOI] [PubMed] [Google Scholar]
- Lebedev AA, Krause MH, Isidro AL, Vagin AA, Orlova EV, Turner J, Dodson EJ, Tavares P, Antson AA. Structural framework for DNA translocation via the viral portal protein. EMBO J. 2007;26:1984–1994. doi: 10.1038/sj.emboj.7601643. [DOI] [PMC free article] [PubMed] [Google Scholar]
- Leforestier A, Livolant F. The bacteriophage genome undergoes a succession of intracapsid phase transitions upon DNA ejection. J Mol Biol. 2010;396:384–395. doi: 10.1016/j.jmb.2009.11.047. [DOI] [PubMed] [Google Scholar]
- Mangenot S, Hochrein M, Letellier L. Real-time imaging of DNA ejection from single phage particles. Curr Biol. 2005;15:430–435. doi: 10.1016/j.cub.2004.12.080. [DOI] [PubMed] [Google Scholar]
- McDonell MW, Simon MN, Studier FW. Analysis of restriction fragments of T7 DNA and determination of molecular weights by electrophoresis in neutral and alkaline gels. J Mol Biol. 1977;110:119–146. doi: 10.1016/s0022-2836(77)80102-2. [DOI] [PubMed] [Google Scholar]
- Nurmemmedov E, Castelnovo M, Medina E, Catalano CE, Evilevitch A. Challenging packaging limits and infectivity of phage 3. J Mol Biol. 2012;415:263–273. doi: 10.1016/j.jmb.2011.11.015. [DOI] [PubMed] [Google Scholar]
- Oliveira L, Cuervo A, Tavares P. Direct interaction of the bacteriophage SPP1 packaging ATPase with the portal protein. J Biol Chem. 2010;285:7366–7373. doi: 10.1074/jbc.M109.061010. [DOI] [PMC free article] [PubMed] [Google Scholar]
- Opalka N, Tihova M, Brugidou C, Kumar A, Beachy RN, Fauquet CM, Yeager M. Structure of native and expanded sobemoviruses by electron cryo-microscopy and image reconstruction. J Mol Biol. 2000;303:197–211. doi: 10.1006/jmbi.2000.4043. [DOI] [PubMed] [Google Scholar]
- Pajunen MI, Elizondo MR, Skurnik M, Kieleczawa J, Molineux IJ. Complete nucleotide sequence and likely recombinatorial origin of bacteriophage T3. J Mol Biol. 2002;319:1115–1132. doi: 10.1016/S0022-2836(02)00384-4. [DOI] [PubMed] [Google Scholar]
- Pao CC, Speyer JF. Order of injection of T7 bacteriophage DNA. J Virol. 1973;11:1024– 1026. doi: 10.1128/jvi.11.6.1024-1026.1973. [DOI] [PMC free article] [PubMed] [Google Scholar]
- Petrov AS, Douglas SS, Harvey SC. Effects of pulling forces, osmotic pressure, condensing agents and viscosity on the thermodynamics and kinetics of DNA ejection from bacteriophages to bacterial cells: a computational study. J Phys Condens Matter. 2013;25:115101. doi: 10.1088/0953-8984/25/11/115101. [DOI] [PMC free article] [PubMed] [Google Scholar]
- Rao VB, Black LW. Structure and assembly of bacteriophage T4 head. Virol J. 2010;7:356. doi: 10.1186/1743-422X-7-356. [DOI] [PMC free article] [PubMed] [Google Scholar]
- Robertson RM, Laib S, Smith DE. Diffusion of isolated DNA molecules: Dependence on length and topology. Proc Natl Acad Sci, USA. 2006;103:7310–7314. doi: 10.1073/pnas.0601903103. [DOI] [PMC free article] [PubMed] [Google Scholar]
- Saigo K. Polar injection in bacteriophage T7. Virology. 1975;65:120–127. doi: 10.1016/0042-6822(75)90012-4. [DOI] [PubMed] [Google Scholar]
- Sanger F, Coulson AR, Hong GF, Hill DF, Peterson GB. Nucleotide sequence of bacteriophage lambda DNA. J Mol Biol. 1982;162:729–773. doi: 10.1016/0022-2836(82)90546-0. [DOI] [PubMed] [Google Scholar]
- Serwer P. Flattening and shrinkage of bacteriophage T7 after preparation for electron microscopy by negative staining. J Ultrastruct Res. 1977;58:235–243. doi: 10.1016/s0022-5320(77)90015-6. [DOI] [PubMed] [Google Scholar]
- Serwer P. Electrophoresis of duplex deoxyribonucleic acid in multiple-concentration agarose gels: fractionation of molecules with molecular weights between 2 × 10⁶ and 110 × 106. Biochemistry. 1980;19:3001–3004. doi: 10.1021/bi00554a026. [DOI] [PubMed] [Google Scholar]
- Serwer P. Two-dimensional agarose gel electrophoresis without gel manipulation. Anal Biochem. 1985;144:172–178. doi: 10.1016/0003-2697(85)90100-9. [DOI] [PubMed] [Google Scholar]
- Serwer P. Agarose gel electrophoresis of bacteriophages and related particles. J Chromatogr. 1987;418:345–357. doi: 10.1016/0378-4347(87)80014-2. [DOI] [PubMed] [Google Scholar]
- Serwer P. Proposed ancestors of phage nucleic acid packaging motors (and cells) Viruses. 2011;3:1249–1280. doi: 10.3390/v3071249. [DOI] [PMC free article] [PubMed] [Google Scholar]
- Serwer P, Jiang W. Dualities in the analysis of phage DNA packaging motors. Bacteriophage. 2012;2:1–17. doi: 10.4161/bact.23829. [DOI] [PMC free article] [PubMed] [Google Scholar]
- Serwer P, Watson RH. Capsid-DNA complexes in the DNA packaging pathway of bacteriophage T7: characterization of the capsids bound to monomeric and concatemeric DNA. Virology. 1981;108:164–176. doi: 10.1016/0042-6822(81)90536-5. [DOI] [PubMed] [Google Scholar]
- Serwer P, Wright ET. Agarose gel electrophoresis reveals structural fluidity of a phage T3 DNA packaging intermediate. Electrophoresis. 2012;33:352–365. doi: 10.1002/elps.201100326. [DOI] [PMC free article] [PubMed] [Google Scholar]
- Serwer P, Graef PR, Garrison PN. Use of ethidium bromide fluorescence enhancement to detect duplex DNA and DNA bacteriophages during zone sedimentation in sucrose gradients: molecular weight of DNA as a function of sedimentation rate. Biochemistry. 1978;17:1166–1170. doi: 10.1021/bi00600a005. [DOI] [PubMed] [Google Scholar]
- Serwer P, Watson RH, Hayes SJ, Allen JL. Comparison of the physical properties and assembly pathways of the related bacteriophages T7, T3 and phiII. J Mol Biol. 1983;170:447–469. doi: 10.1016/s0022-2836(83)80157-0. [DOI] [PubMed] [Google Scholar]
- Serwer P, Wright ET, Hakala K, Weintraub S, Su M, Jiang W. DNA packaging- associated hyper-capsid expansion of bacteriophage T3. J Mol Biol. 2010;397:361–374. doi: 10.1016/j.jmb.2010.01.058. [DOI] [PMC free article] [PubMed] [Google Scholar]
- Shilnikov GV, Khusainov AA, Sarvazyan AP. The detection of temperature induced structural changes in T4b and T7 bacteriophages by means of high precision acoustic velocity measurements. Ultrasound Med Biol. 1986;12:511–517. doi: 10.1016/0301-5629(86)90222-x. [DOI] [PubMed] [Google Scholar]
- Smith DE. Single-molecule studies of viral DNA packaging. Curr Opin Virol. 2011;1:134–141. doi: 10.1016/j.coviro.2011.05.023. [DOI] [PMC free article] [PubMed] [Google Scholar]
- Son M, Watson RH, Serwer P. The direction and rate of bacteriophage T7 DNA packaging in vitro. Virology. 1993;196:282–289. doi: 10.1006/viro.1993.1476. [DOI] [PubMed] [Google Scholar]
- Sternberg N, Weisberg R. Packaging of prophage and host DNA by coliphage lambda. Nature. 1975;256:97–103. doi: 10.1038/256097a0. [DOI] [PubMed] [Google Scholar]
- Stroud RM, Serwer P, Ross MJ. Assembly of bacteriophage T7. Dimensions of the bacteriophage and its capsids. Biophys J. 1981;36:743–757. doi: 10.1016/S0006-3495(81)84763-7. [DOI] [PMC free article] [PubMed] [Google Scholar]
- Studier FW. Relationships among different strains of T7 and among T7-related bacteriophages. Virology. 1979;95:70–84. doi: 10.1016/0042-6822(79)90402-1. [DOI] [PubMed] [Google Scholar]
- Tang J, Lee KK, Bothner B, Baker TS, Yeager M, Johnson JE. Dynamics and stability in maturation of a T=4 virus. J Mol Biol. 2009;392:803–812. doi: 10.1016/j.jmb.2009.07.038. [DOI] [PMC free article] [PubMed] [Google Scholar]
- Vanecko S, Laskowski M., Sr Studies of the specificity of deoxyribonuclease I. III. Hydrolysis of chains carrying a monoesterified phosphate on carbon 5′. J Biol Chem. 1961;236:3312–3316. [PubMed] [Google Scholar]
- Yang Q, Catalano CE, Maluf NK. Kinetic analysis of the genome packaging reaction in bacteriophage 3. Biochemistry. 2009;48:10705–10715. doi: 10.1021/bi901016n. [DOI] [PubMed] [Google Scholar]
- Witz J, Brown F. Structural dynamics, an intrinsic property of viral capsids. Arch Virol. 2001;146:2263–2274. doi: 10.1007/s007050170001. [DOI] [PubMed] [Google Scholar]