

Alternative splicing is responsive to elevated temperature in nonvascular plants and can be rapidly modulated in specific genes for plants to cope with heat stress.
Abstract
Plant growth and development are constantly influenced by temperature fluctuations. To respond to temperature changes, different levels of gene regulation are modulated in the cell. Alternative splicing (AS) is a widespread mechanism increasing transcriptome complexity and proteome diversity. Although genome-wide studies have revealed complex AS patterns in plants, whether AS impacts the stress defense of plants is not known. We used heat shock (HS) treatments at nondamaging temperature and messenger RNA sequencing to obtain HS transcriptomes in the moss Physcomitrella patens. Data analysis identified a significant number of novel AS events in the moss protonema. Nearly 50% of genes are alternatively spliced. Intron retention (IR) is markedly repressed under elevated temperature but alternative donor/acceptor site and exon skipping are mainly induced, indicating differential regulation of AS in response to heat stress. Transcripts undergoing heat-sensitive IR are mostly involved in specific functions, which suggests that plants regulate AS with transcript specificity under elevated temperature. An exonic GAG-repeat motif in these IR regions may function as a regulatory cis-element in heat-mediated AS regulation. A conserved AS pattern for HS transcription factors in P. patens and Arabidopsis (Arabidopsis thaliana) reveals that heat regulation for AS evolved early during land colonization of green plants. Our results support that AS of specific genes, including key HS regulators, is fine-tuned under elevated temperature to modulate gene regulation and reorganize metabolic processes.
Global warming in recent decades has caused annual temperature extremes that are becoming harmful for all living organisms. Although all living cells show rapid responses to changes of ambient temperature, unlike animals, plants are sessile and cannot escape adverse temperature conditions. Challenged by temperature changes, plants have evolved rapid and complex systems to sense the temperature signal and translate it into cellular defenses for acquired tolerance, such as enhancing protein folding/unfolding activities and maintaining membrane fluidity (Sung et al., 2003). Understanding how plants adapt to temperature stresses has been an important topic in improving thermotolerance in crops.
The heat shock response (HSR) is conserved in eukaryotes in response to elevated temperature and induces the activity of heat shock transcription factors (HSFs) to promote the expression of HSR-related genes. Different mechanisms for temperature sensing and signal transduction have been proposed. The general model suggests that constitutively expressed chaperones in the cytoplasm form inactive complexes with HSFs. Upon heat shock (HS), cytosolic chaperones are recruited by misfolded proteins, thus allowing the release of HSFs for phosphorylation, oligomerization, and nuclear localization to regulate gene expression (Mosser et al., 1993; Shi et al., 1998; Kim and Schöffl, 2002; Yamada et al., 2007; for review, see Morimoto, 1998; Sung et al., 2003; Baniwal et al., 2004). Alternative models for temperature sensing and signaling involve the change of membrane fluidity, second messenger calcium (Ca2+), calmodulin, immunophilins, and kinases (Gong et al., 1998; Vigh et al., 1998; Liu et al., 2005; Aviezer-Hagai et al., 2007; Suri and Dhindsa, 2008; Saidi et al., 2009, 2010).
Besides transcriptional control by HSFs, other levels of gene regulation are also affected by HS in the cell. Animal studies have revealed that Heat Shock Protein90 (HSP90) plays a central role in orchestrating transcriptional regulation by binding to transcription regulators as well as specific regions on chromatin (for review, see Sawarkar and Paro, 2013). In plants and yeast, the histone variant H2A.Z is possibly a determinant in gene regulation associated with temperature responsiveness (Kumar and Wigge, 2010). In the green alga Chlamydomonas reinhardtii, HS-activated HSF1 is also involved in chromatin remodeling (Strenkert et al., 2011). Mechanisms of gene regulation affected by HS are more complicated by including the translational control. HS inhibits the activities of eukaryotic initiation factors to repress translation initiation (Duncan and Hershey, 1984; Vries et al., 1997). Recently, a genome-wide study of translation regulation indicated that removal of HSP70 from the translation machinery under HS conditions resulted in the pausing of translation elongation (Shalgi et al., 2013). Compared with these results, information on HS-mediated posttranscriptional regulation is relatively lacking.
Alternative splicing (AS) is a widespread mechanism in eukaryotes that generates two or more mRNAs from the same precursor mRNA (pre-mRNA) by using different splice sites. For constitutive splicing, splice-site recognition is mainly determined by 5′ and 3′ consensus cis-sequences and the assembled spliceosome on the intron region of the pre-mRNA (for review, see Black, 2003). However, splice-site selection is also influenced by regulatory cis-acting sequences and trans-acting factors. Regulatory sequences are classified as exonic splicing enhancers, exonic splicing silencers, intronic splicing enhancers, and intronic splicing silencers according to their locations and activities. These elements are recognized by regulatory splicing factors such as heterogenous nuclear ribonucleoproteins, Ser/Arg-rich (SR) proteins, and K homology domain proteins (for review, see Black, 2003; Reddy, 2007). Combinations of regulatory cis-elements and splicing factors and differential expression of splicing factors in different cell types, tissues, developmental stages, and environmental conditions diversify AS patterns and eventually increase transcriptome complexity and proteome diversity (for review, see Black, 2003; Syed et al., 2012). As demonstrated from recent next-generation sequencing analysis, about 95% of multiexon genes in human, 42% to 61% of intron-containing genes in Arabidopsis (Arabidopsis thaliana), and 33% to 48% of annotated genes in rice (Oryza sativa) are alternatively spliced (Pan et al., 2008; Wang et al., 2008; Filichkin et al., 2010; Zhang et al., 2010; Marquez et al., 2012).
Although genome-wide studies have revealed complex AS patterns among all kingdoms, reports on how elevated temperature affects pre-mRNA splicing are still limited. Constitutive pre-mRNA splicing of some transcripts is blocked in heat-shocked human and Drosophila spp. cells (Yost and Lindquist, 1986; Bond, 1988; Shukla et al., 1990). However, whether AS is responsive to heat remains unknown. Several reports of individual genes have suggested that AS of their transcripts is important for the HS response. For example, in mice and Drosophila spp., HSF1 and HSF2 produce alternatively spliced isoforms, respectively, and show tissue-specific and temperature-controlled expression patterns (Fiorenza et al., 1995; Goodson et al., 1995; Fujikake et al., 2005). In Arabidopsis, HSFA2 also undergoes HS-inducible AS, which may regulate the cytoplasmic protein response (Sugio et al., 2009). Besides affecting key components in HSR, elevated temperature affects the AS of other regulatory molecules. In Neurospora crassa, transcripts encoding the circadian clock protein FREQUENCY show thermosensitive splicing (Diernfellner et al., 2005). A recent study of Arabidopsis showed that HS-induced AS on an intron encoding the microRNA miR400 led to an accumulation of the primary transcript and a decrease in the level of mature miR400 (Yan et al., 2012). Although these results suggest that eukaryotic organisms potentially modulate mRNA splicing to respond to elevated temperature, a genome-wide analysis to reveal whether this step is regulated by heat is still not available.
In this study, we investigated the genome-wide regulation of pre-mRNA splicing in response to HS by mRNA sequencing (RNA-seq). We used an emerging model plant system, the moss Physcomitrella patens, for transcriptome profiling and identification of heat-sensitive AS (HS-AS) events. Our results show that although nearly 50% of moss genes are alternatively spliced, a portion of events is significantly sensitive to the mild, nondamaging HS. Intron retention (IR) is the most prevalent event in overall AS profiles as well as the heat-sensitive ones. A thermotolerance response was observed in heat-mediated AS regulation. A subset of genes undergoing heat-sensitive IR (HS-IR) is involved in photosynthesis, translation, RNA splicing, and protein folding, which suggests that plants may regulate AS with transcript specificity in response to elevated temperature. The majority of the HS-IR events, including those that occurred on transcripts encoding chloroplastic proteins, ribosomal proteins, and splicing factors, are rapidly repressed. However, IR of a specific subset of gene transcripts encoding protein folding- and degradation-related factors was induced. Such regulation may lead to differential production of functional proteins for fine-tuning gene regulation and cellular metabolism under elevated temperature. We further identified a regulatory cis-element enriched on exons near HS-IR regions. Moreover, three HSFs in P. patens are also alternatively spliced under elevated temperature. Two of the moss HSFs showed an AS pattern similar to the Arabidopsis HSFA2, which indicates that HS-AS evolved early in ancient plant systems.
RESULTS
HS Treatment, mRNA Sequencing, and Data Analysis
Previous reports have shown that nondamaging HS at 38°C for 1 h can induce transient HSR in P. patens. To restore the ability of HSR, at least 5 h at noninducing temperature is required (Saidi et al., 2005, 2009). For preparing RNA-seq samples, protonemal colonies were grown at 38°C for 1 h (1st HS), recovered at 25°C for 5.5 h, and then grown at 38°C again for 1 h (2nd HS; Fig. 1A). Cells remaining at 25°C were collected as the control. Induction of HSR was checked by measuring the expression of three characterized HSR marker genes after 1st HS, 5.5 h of recovery, and 2nd HS (Supplemental Fig. S1A; Charng et al., 2006; Shi and Theg, 2010). Similar to the previous report, data from photosynthetic activity measurements for protonema cells after 2nd HS confirmed no detectable damage to moss growth with HS (Supplemental Fig. S1; Saidi et al., 2005).
Figure 1.

Experimental design and data analysis. A, Design of the HS treatment for P. patens protonema. Arrows indicate the time of collecting samples for total RNA extraction. Two-week-old moss protonemal cells grown at 25°C were shifted to 38°C for 1 h (1st HS), recovered at 25°C for 5.5 h, and then shifted to 38°C for 1 h (2nd HS). Protonemal cells remaining at 25°C were collected as the control (C). B, Steps for preparing cDNA libraries and pipeline for RNA-seq data analysis. C, Distributions of RNA-seq reads from pooled (All) and control, 1st HS, and 2nd HS samples on the annotated P. patens genome.
For RNA-seq, we prepared two sets of separately HS-treated samples for RNA isolation. In each set, total RNA was pooled from five technical repeats for the control, 1st HS, and 2nd HS samples for complementary DNA (cDNA) library preparation (Fig. 1B). Sequence reads from two biological repeats were mixed for data analysis. After data trimming and filtering, nearly 117.9 million reads in total, 32.5, 42.7, and 42.7 million reads for the control, 1st HS, and 2nd HS samples, respectively, were generated (Supplemental Table S1). We mapped sequence reads to the P. patens genome (annotation V1.6) by use of the BLAT program (Kent, 2002; Zimmer et al., 2013). Among mapped reads pooled from three samples, approximately 67.8 million reads (57.5% of total reads) were perfectly aligned to the reference genome. For mapping of a gene region, all of annotated exons on gene models of the corresponding locus were combined to define the annotated exonic regions. There were 91% of aligned reads that matched annotated gene regions, of which 70%, 18%, and 3% were mapped to annotated exons, splice junctions (SJs), and introns, respectively (Fig. 1C). Aligned reads in individual samples also showed similar levels of mapping frequencies compared with the pooled data, indicating the consistency of our RNA-seq experiments.
In our data, nearly 0.7 and 1.5 million reads were located in the annotated intronic regions and exon-intron junctions, respectively (Supplemental Table S1). Most of these reads were potentially from alternatively spliced transcripts. Reads representing each type of AS event were counted by using the analysis tool RACKJ (Lan et al., 2013; Li et al., 2013; http://rackj.sourceforge.net/). To eliminate the false-positive events in AS prediction, we filtered AS events with the following three stringent criteria. In initially detected events of the three samples, the gene with fewer than five reads mapped to the exon region was first removed, the SJ aligned with five or more reads and at least two at different starting positions was retained, and the events with at least five reads supported were then included in the final list.
AS Occurs Frequently in P. patens and Responds to Heat
Although our RNA-seq analysis was designed for the identification of HS-AS events in HS samples, the results relatively reflected the abundance of AS events occurring in P. patens. By pooling sequence reads from all three samples, we identified 124,713 SJs in total, which occurred in 16,897 (48%) moss genes (Fig. 2, top; Supplemental Data Set S1). Compared with annotated genome data, 27,583 novel SJs were obtained (Sinha et al., 2010; Zimmer et al., 2013). HS decreased the number of total SJs but slightly increased the number of novel SJs. The changes may be due to differential transcription and AS events induced by heat. Using a threshold of at least five reads per AS event, three major types of AS events, IR, alternative donor and/or acceptor site (AltDA), and exon skipping (ES), were further analyzed (Fig. 2; Supplemental Data Sets S2–S4). IR is the most abundant event in P. patens. We detected 37,559 IR events from 15,126 genes, approximately 47% of moss genes. Interestingly, the number of IR events was significantly decreased after 1st HS and 2nd HS, which suggests that HS represses IR. AltDA events were less abundant, with transcripts of 10,963 moss genes showing AltDAs. Under HS conditions, AltDA events were slightly induced. A similar pattern was also found in ES, which occurred least frequently (3.8% of moss genes) in P. patens. In summary, our RNA-seq analysis indicates that IR is the preferred form of AS. We confirmed previously annotated data and identified additional AS events in P. patens (Zimmer et al., 2013). Our results suggest that nearly 50% of moss genes (32,272 genes in total) are alternatively spliced.
Figure 2.

SJs and AS events in P. patens. SJs, IR, AltDA, and ES events were computed from pooled reads (All) and data of individual samples (control [C], 1st HS, and 2nd HS) by using RACKJ. Numbers of total events and corresponding genes are listed under each pie chart. Numbers and percentages of annotated and novel events are listed in the pie charts.
We also compared the mapping efficiency of BLAT with another mapping tool, TopHat (Trapnell et al., 2009). Default parameters were set for both programs to generate mapping files. These files were then used to compute the read counts supporting SJs and AS events by the RACKJ package with identical parameters. We found that BLAT actually identified more SJs and AltDAs than TopHat (Supplemental Table S2). TopHat produced slightly larger numbers of IR and ES events than BLAT. The overall pattern upon HS treatments is similar for data from BLAT and TopHat. We conclude that BLAT is suitable for identifying AS events.
HS-AS Responds Differently after Initially Elevated Temperature
RNA-seq analysis reveals that the numbers of AS events are changed in response to elevated temperature. We further identified the events significantly sensitive to HS. For all AS features identified in the HS samples (paired comparison of 1st HS and 2nd HS with the control, using a threshold of at least five reads supporting each AS event), P values based on χ2 test were calculated from the number of reads supporting the event with the number of reads unique for exon regions of corresponding genes (for IR) or SJs (for AltDA and ES). P values of all identified AS events were further corrected with false discovery rate procedures. Events having false discovery rate-corrected P < 0.001 were defined as showing HS-AS (Supplemental Data Set S5).
As shown in Figure 3, HS-IR is the most abundant among HS-AS events, with 1,295 and 735 differentially retained introns after 1st HS and 2nd HS, respectively. Significant overlap of HS-IR events was observed between 1st HS and 2nd HS samples, indicating constitutive responsiveness to HS for these IR events. The number of HS-IR events was largely decreased in the 2nd HS sample. Heat-sensitive AltDA (HS-AltDA) and ES (HS-ES) events are fewer compared with HS-IR. Similar to HS-IR, a decrease of responsiveness to 2nd HS can also be observed for AltDA and ES (Fig. 3). These data suggest that many HS-AS events affected by 1st HS become less responsive to 2nd HS.
Figure 3.

Analysis of HS-AS events. Venn diagrams show HS-IR, HS-AltDA, and HS-ES events identified in 1st HS and 2nd HS samples. Numbers of HS-AS events are listed under each set. Specific and overlapped events of each diagram are indicated.
HS-Induced Transcription Has No Significant Effect on AS
The expression level of AS transcripts is possibly influenced by the transcriptional activity of corresponding genes. To determine whether HS-AS is affected by gene transcription, we compared the genes responsive to HS at the transcriptional level with HS-AS genes. Reads per kilobase of exon model per million mapped reads (RPKM), as described by Mortazavi et al. (2008), representing gene expression level in each sample, were first computed. Genes showing RPKM 2-fold or greater change following HS treatments were identified. Analysis of differentially expressed genes indicated 4,958 and 6,157 P. patens genes responsive to 1st HS and 2nd HS, respectively (Supplemental Data Set S6). However, only a small subset of HS-IR, HS-AltDA, and HS-ES genes overlap with differentially expressed genes (Supplemental Fig. S2). This result suggests that the transcriptional activity induced by HS has no significant effect on AS.
AS Are Differentially Regulated under Elevated Temperature
We further analyzed the patterns of HS-AS events from RNA-seq data. The IR level of 1,279 IR events significantly sensitive to 1st HS were first compared with their corresponding gene expression levels. To calculate the IR level, we computed the intron reads per kilobase of retained intron per million mapped reads (IPKM) for events in each sample (Supplemental Data Set S7). For comparison, the IPKM and RPKM of corresponding genes were normalized by mean across samples.
Intriguingly, the majority of 1,279 IR events were simultaneously repressed within 1 h of HS, while the expression level for the corresponding genes of these events were not significantly affected (Fig. 4A). This result again indicates that the change of IR level is not associated with the transcriptional activity. The repression was potent during 1st HS and slightly moderated in 2nd HS, which indicates that thermotolerance also occurs at the pre-mRNA splicing step. IR repression potentially leads to productive transcripts, because retained introns usually produce premature termination codons (PTCs), which may generate truncated proteins and unproductive or unstable transcripts (for review, see Chang et al., 2007). To further confirm that retained introns in the 1,279 IR events cause PTC formation, we computed the percentage of PTC-occurring IR transcripts. Nearly 98.26% of IR transcripts contain potential PTCs in the retained introns or in downstream regions of the transcripts (Supplemental Table S3). Therefore, repressing IR for these transcripts during HS could generate more productive transcripts.
Figure 4.

Heat regulation of AS in P. patens. A, Expression profiles of HS-IR isoforms and corresponding genes. IPKM and corresponding gene expression (RPKM) for the 1,279 IR events were normalized by mean across samples. Events were arranged according to the fold change in IR level comparing 1st HS with control (C) samples. Heat maps of these events in control, 1st HS, and 2nd HS samples are shown. B, Heat maps of the expression levels of HS-AltDA events and corresponding genes. C, Heat maps of the expression levels of HS-ES events and corresponding genes. The scale of expression is shown at the bottom of each map.
We also estimated AltDA and ES levels for those events significantly affected by 1st HS. We computed supporting reads of each AltDA or ES event per million mapped reads of each sample (Supplemental Data Set S6). For comparison, the AltDA or ES level and RPKM of the corresponding gene were normalized by mean across samples. Results from HS-AltDA and HS-ES analyses were distinct from that of HS-IR, with the pattern of heat induction for most events (Fig. 4, B and C). We conclude that plants may regulate AS through different mechanisms to reorganize transcriptome composition in response to temperature changes.
HS-IR Occurs in Gene Transcripts Involved in Specific Functions
Biological functions associated with these HS-AS events were further investigated. IR was predominant among statistically significant events (Fig. 3), suggesting that IR may play a more important role in HS-AS events. To further assess the biological functions of the HS-IR, genes showing induced and repressed IR after 1st HS and 2nd HS were subjected to functional enrichment analysis. We identified overrepresented Gene Ontology (GO) terms (biological process) among functionally annotated genes (Fig. 5; Zimmer et al., 2013). The overall pattern is similar between data from 1st HS and 2nd HS samples. However, overrepresented functions differed largely between genes showing HS-induced and HS-repressed IR. Genes involved in photosynthesis, translation, and mRNA splicing were the most represented in genes with HS-repressed IR. Some HS-IR genes involved in protein folding and ubiquitin-dependent protein catabolic processes, both important for HSR, were then enriched more in genes with HS-induced IR, especially after 1st HS. These results indicate that specific subsets of genes are differentially regulated at the pre-mRNA splicing step.
Figure 5.

Functional enrichment (biological process) of HS-IR genes after 1st HS and 2nd HS. HS-IR events significantly induced and repressed (2-fold change) after 1st HS and 2nd HS were identified for GO analysis. Totals of 229 1st HS-induced, 1,003 1st HS-repressed, 174 2nd HS-induced, and 523 2nd HS-repressed IR genes were submitted to the functional enrichment tool for 206, 881, 169, and 492 unique genes with annotations, respectively. GO terms were included in the list if P < 1E-04.
RNA splicing genes, especially those encoding splicing regulators, are known to be actively alternatively spliced under stress conditions (Palusa et al., 2007). RNA splicing genes in our data include K homology domain proteins, SR proteins, polypyrimidine tract-binding proteins, DEAD/DEAH box RNA helicases, core spliceosomal complex, and other splicing factors (Supplemental Data Set S8). These proteins cover most steps of pre-mRNA splicing, suggesting that the rapid HS response of IR for RNA splicing gene transcripts may be important for splicing regulation in HS defense.
Moreover, genes directly functioning in HSR (i.e. protein folding) were also enriched among HS-IR events. Many genes encoding DnaJ domain-containing chaperones, cyclophilins, and cyclophilin-like peptidyl-prolyl cis-trans-isomerases were alternatively spliced under HS conditions (Supplemental Data Set S8). Because products of these genes are directly involved in preventing protein misfolding or proofreading protein structures, heat-induced IR of these gene transcripts could have a direct impact on HSR.
The IR level of representative events in several GO terms was further validated by quantitative reverse transcription (qRT)-PCR. For qRT-PCR experiments, we designed primer pairs to detect the IR level and total transcripts of the corresponding gene. The IR level was normalized for total transcripts and then compared with data from the control. Indeed, IR levels for most of the events we tested were differentially regulated by HS treatments (Fig. 6). The greatest difference was observed in genes involved in protein folding. For example, IR occurring on the transcript encoding cyclophilin 38 (PpCYP38-2), a peptidyl-prolyl cis-trans-isomerase important for protein folding, was robustly induced nearly 30-fold by HS. However, IR of the transcript encoding another peptidyl-prolyl cis-trans-isomerase (PpPPIase) was rapidly repressed more than 12-fold. Such differential regulation potentially leads to the production of more functional PpPPIase and less abundant PpCYP38-2, which may be important for HSR. By comparing data from untreated controls collected at the same time as HS samples, we also confirmed that IR level has no significant difference at the time points of 1st HS and 2nd HS (Supplemental Fig. S3). The effect of circadian rhythm on the regulation of AS was not obvious for the genes we tested in our study due to the experimental design. Data from three biological replicates were also consistent with those of pooled samples (Supplemental Fig. S3).
Figure 6.

Validation of HS-IR events. Pooled RNA from control (C), 1st HS, and 2nd HS samples was analyzed in triplicate for qRT-PCR. Primer sets designed for IR isoforms, total transcripts of the corresponding genes, and PpACT2 were used. PpACT2 was first used as an internal control for normalizing each quantitative PCR. Levels of the IR isoforms were further normalized for overall expression level and then compared with data from the control to generate relative IR levels. Corresponding gene products of selected IR events and representative processes are shown above each graph. Annotations and gene identifiers are listed in Supplemental Data Set S9.
Although functional enrichment analyses for HS-AltDA and HS-ES events revealed no significant overrepresented functions, genes for protein folding were also found in our data (e.g. those encoding peptidyl-prolyl cis-trans-isomerases). The expression of some transcripts was validated by high-resolution reverse transcription (RT)-PCR (Supplemental Fig. S4; Simpson et al., 2008). Overall, data from HS-AltDA and HS-ES analyses indicated that the selection of alternative splice sites is also affected by heat. In summary, our results strongly suggest that transcripts involved in specific functions can be differentially alternatively spliced in responding to elevated temperature.
A Purine-Rich, Exonic-Splicing Element Is Involved in HS-IR
AS is mainly regulated by the combination of regulatory cis-elements and splicing factors. In our IR data, a substantial number of events were tightly modulated by HS, which indicates that specific components may also participate in the IR regulation. We next examined whether regulatory cis-elements exist in the HS-IR regions that may control local splicing activity. To generate the sample data set for the motif search, we first extracted 200 nucleotides of 5′ and 3′ flanking sequences from both donor and acceptor sites of the top 500 retained introns significantly affected by HS. For introns of less than 400 nucleotides, the whole intron was included. We searched for conserved motifs from 7- to 12-mers. To further confirm the identified motifs preferentially present in HS-IR regions, a control data set was generated from 500 randomly selected IR events that were not responsive to HS. Occurrence of the motif was compared in the sample and control data sets based on the enrichment level with a P value of 0.001 by Fisher’s exact test.
Motif search from HS-IR regions yielded a 12-nucleotide sequence, GAG[GA]AG[GA]AG[GA]AG, overrepresented with an E value of 1.5E-33 (Fig. 7A). Although several nucleotides on this element are less conserved, the element can be defined as a purine-rich motif with a potential GAG repeat sequence. The GAG repetitive motif we identified was enriched in HS-IR regions (Fig. 7B), which suggests that it is required for regulating pre-mRNA splicing during HS. We also examined the distribution of the GAG repetitive motif near the donor and acceptor sites of retained introns. Most of the motif hits reside in exonic regions (Fig. 7C), further supporting that this motif is an exonic splicing element that functions on the pre-mRNA for heat-mediated splicing regulation.
Figure 7.

Regulatory cis-elements in heat-regulated IR regions. A, The repetitive GAG motif enriched in heat-regulated IR regions, with the E value indicating the statistical significance of the motif. B, Enrichment of the repetitive GAG motif in heat-regulated IR regions. The first column of the table indicates the category of IR regions tested, followed by the number of input sequences hit, the number of input sequences not hit, and the number of total input sequences. Data were from the repetitive GAG motif present in the IR regions under a MAST P value threshold of 5.00E-05. These numbers were used for predicting the enrichment level with a P value of 7.67E-04 by Fisher’s exact test. C, Frequency distribution of the repetitive GAG motif in HS-regulated IR regions. Frequencies of the motif were plotted by counting the numbers of motif hits occurring in windows of 20 nucleotides (nt) near the donor and acceptor sites of HS-regulated IR regions. Only input sequences extracted from donor and acceptor sides of the retained introns (longer than 200 nucleotides) were used for motif counting. The blue bars represent the exon, and the red lines indicate the retained intron.
HS-ES of the HS Transcription Factor Is Conserved in Land Plants
Key regulators identified with HS-AS may play important roles in HSR. One distinct candidate is the moss HSF family. In P. patens, we found eight HSFs that may function in heat-regulated gene expression (Supplemental Data Set S9). Four are clustered as A-type HSFs and the rest are B-type HSFs based on sequence alignment (Supplemental Fig. S5). Among the eight HSF genes, three of them showed AS. IR can be found on the transcripts of an A-type HSF, PpHSFA1-3. IR of PpHSFA1-3 transcripts was repressed under elevated temperature (Supplemental Fig. S6), which suggests that HS potentially generates more functional PpHSFA1-3, the key regulator in HSR, for transcriptional control.
Although there is no specific function enriched from HS-ES events, we found that it occurs on transcripts of another A-type HSF gene, PpHSFA1-1, as well as its duplicated paralog, PpHSFA1-2. After checking each annotated HSF in the moss genome, we found that locus definition for both HSF genes was inconsistent with the mapping result based on our RNA-seq data. Therefore, we generated new gene models according to our mapping result and Sanger sequencing of RT-PCR products. The revised gene model produces four isoforms with splicing of a cryptic intron (I1) and ES occurring in the 5′ half of the gene transcripts (Fig. 8A; Supplemental Fig. S7). Isoform 1 possibly either produces a polypeptide with an incomplete DNA-binding domain (DBD) due to a PTC on exon 3 (E3) or becomes an unstable transcript. Skipping of E3 on isoform 2 can lead to a full-length HSF protein with an intact DBD, heptad repeat pattern of hydrophobic amino acid residues, nuclear localization signal, aromatic and large hydrophobic amino acid residues embedded in an acidic surround, and nuclear export signal. Splicing of the cryptic intron I1 on isoforms 3 and 4 then potentially generates unproductive transcripts due to the formation of an early stop codon (Fig. 8A). Although the efficiency could be low, a partial HSF protein with N-terminal truncation may be translated from a downstream start codon on isoforms 3 and 4.
Figure 8.

AS events in the PpHSFA1-1 locus. A, Revised gene model and sequencing read mapping of the PpHSFA1-1 locus. Expressed exonic regions (black) and isoforms (blue) are shown. Asterisks in black over each isoform indicate the primary start codons; asterisks in red on isoforms 3 and 4 indicate potential downstream start codons. Solid and empty triangles represent stop codons and premature stop codons, respectively. Red arrows show the positions of the primer set for high-resolution RT-PCR. Polypeptides potentially encoded by the alternatively spliced isoforms are shown at right: orange, DBD; green, heptad repeat pattern of hydrophobic amino acid residues (HR-A/B); blue, nuclear localization signal (NLS); yellow, aromatic and large hydrophobic amino acid residues embedded in an acidic surround (AHA); and purple, nuclear export signal (NES). Sizes of the polypeptides are shown at the C-terminal end. B, Electrophoresis profiles of PCR products from the primer set indicated in A. The scale on the x axis represents the size (bp); the scale on the y axis indicates the relative fluorescence of the PCR products, reflecting transcript abundance. Peaks representing each isoform are labeled. a.u., Arbitrary unit; C, control. C, Relative expression levels of PpHSFA1-1 isoforms. Integrated peak areas of RT-PCR products from each isoform were used as the relative expression levels. The percentage of each isoform was calculated by dividing by the sum of all transcripts. Data from five biological replicates were used to determine statistical significance by doing arcsine transformation and Student’s t test. Significance is indicated by asterisks: **P < 0.01.
To validate the expression of all isoforms for PpHSFA1-1, we performed high-resolution RT-PCR. A primer pair was designed to amplify the region between E1 and E4. The PCR products for four isoforms were detected (Fig. 8B). We quantified the peak area for each PCR product to calculate the percentage change in the four isoforms in the control, 1st HS, and 2nd HS samples (Fig. 8C). Isoform 1 was significantly decreased in level under HS. Isoforms 2, 3, and 4, generated from E3 skipping, I1 splicing, and both, respectively, were overall increased in level. In summary, the expression of isoform 1 at normal temperature may have specific roles in regulating HSR, such as functioning as a dominant-negative regulator to suppress PpHSFA1-1 activity. E3 skipping and I1 splicing of PpHSFA1-1 transcripts are activated under HS, which possibly leads to the production of more fully or partially functional proteins for HSR.
DISCUSSION
Plants require tightly controlled systems to regulate growth and development in responding to temperature changes. Plants cope with temperature fluctuations by reorganizing their gene expression and metabolism to prepare for the adverse condition and acquire a subsequent defense system. As different levels of gene expression are known to be responsive to heat stress, gene regulation at the posttranscriptional level is less understood. In this study, we report, to our knowledge for the first time, that the pre-mRNA splicing rapidly responds to HS globally. RNA-seq data showed that AS events are abundant in P. patens (Fig. 2). IR, AltDA, and ES are commonly found on transcripts and are differentially regulated by HS. Detailed analysis showed that IR is rapidly repressed in transcripts encoding chloroplasts, ribosomal proteins, and RNA splicing-related factors but is induced for those directly involved in protein folding and degradation (Fig. 5). Such change potentially leads to the differential regulation of protein abundance to overcome heat stress. In the HS-IR regions, we identified a purine-rich sequence motif on exons that likely function in heat-mediated AS regulation (Fig. 7). Furthermore, transcripts for the key regulator HSFs were also found to be alternatively spliced (Fig. 8; Supplemental Fig. S6). Therefore, we propose that AS is rapidly and differentially regulated under elevated temperature. Specific subsets of genes, including key regulators in pre-mRNA splicing and HSR, are fine-tuned to enhance cellular defense and reorganize metabolic processes.
The thermotolerance response is a cellular mechanism developed after an initial sublethal temperature for organisms to cope with excessively high temperature. At the molecular level, early studies have suggested that plants acquire thermotolerance through gene activation at the transcriptional level upon rising temperature to produce small HSPs, the central players in the thermotolerance response, to prevent cellular damage from the following high temperature (Vierling, 1991). Interestingly, we found that 2nd HS has a moderate effect on IR compared with 1st HS (Fig. 4). This is an indication that AS also shows temperature tolerance after initial rising temperature. Although the molecular mechanism underlying the regulation is not clear, we propose that splicing activity is modulated during 2nd HS by unknown factors differentially regulated after 1st HS. Such regulation may cause the decrease of enhancer activity or the increase of repressor activity for AS during 2nd HS to eventually allow the splicing regulation of specific gene transcripts becoming less active. Temperature tolerance at the pre-mRNA splicing step could serve as another mechanism for plants to adapt temperature fluctuations.
For a long time, AS has been recognized as a source to increase transcriptome complexity and proteomic diversity. However, whether AS can be differentially regulated remains unclear. By taking advantage of Next-Generation Sequencing technology and bioinformatics, we observed dynamic changes of AS patterns in response to HS. More importantly, HS-AS occurs in transcripts for specific functions. In the case of IR, massive repression induced by heat for specific transcripts potentially allows the cell to modulate cellular metabolism and gene regulation for stress resistance. We found that IR repression by heat occurs largely in transcripts of photosynthesis and ribosomal proteins (Fig. 5). Both are important for energy and protein production in plant cells. Photosynthesis activity needs to be tightly controlled under stress conditions. While gene transcription is not regulated under elevated, nondamaging temperature, repressing IR on photosynthesis gene transcripts may transiently increase the production of a subset of photosynthetic proteins for specific reactions. Activating intron splicing on transcripts encoding ribosomal proteins may also globally promote translation for HSR or even play a role in specific translational control, such as generating ribosome heterogeneity and functionally distinct ribosomes (Byrne, 2009). Inducing IR by heat for a specific subset of protein-folding gene transcripts then could differentially regulate HSR.
The crucial question our results raise is how AS is regulated by temperature changes. Splicing regulators are potential candidates involved in the differential regulation in response to HS. For transcripts with HS-IR, we identified a purine-rich, GAG repetitive motif in exonic regions. An AG-rich exonic cis-element has been shown to be capable of promoting downstream donor site recognition in plants (McCullough and Schuler, 1997). In Arabidopsis, a GAA repetitive sequence has also been proposed as an exonic splicing enhancer with experimental support (Pertea et al., 2007; Arabidopsis 2010 project, http://www.life.umd.edu/labs/mount/2010-splicing/ESEs.html). In mammalian systems, such a purine-rich sequence serves as the binding site of a subset of SR proteins for enhancing splicing activity (Ramchatesingh et al., 1995; Yeakley et al., 1996). A recent study has also shown that purine-rich GAAG repeats in the intronic region function as the binding site for SC35-LIKE SPLICING FACTOR33 (SCL33) protein in Arabidopsis (Thomas et al., 2012). Unknown SR proteins in plants may recognize the purine-rich sequence in HS-IR regions to enhance intron splicing (repress IR, as we observed under HS). On the other hand, HS-AltDA and HS-ES may be regulated by other splicing silencers, such as heterogenous nuclear ribonucleoproteins, under HS conditions to repress the recognition of constitutive splice sites and eventually increase the usage of alternative splice sites or skip exons. The activities of these splicing regulators for AS may be modulated by subcellular localization and posttranslational modification (for review, see Manley and Tacke, 1996; Graveley, 2000; Reddy et al., 2012). Identification of the trans-factors as well as the activity of the purine-rich motif for heat-induced splicing regulation will be needed to support these hypotheses.
Another question is whether AS possesses transcript specificity. One possibility is the cotranscriptional control mediated by chromatin modification. Accumulating data suggest that AS regulation could be from the cotranscriptional splicing mediated by epigenetic control (Schwartz and Ast, 2010; Luco et al., 2011). Histone modification can affect AS by influencing the recruitment of splicing regulators to chromatin (Luco et al., 2010; Moehle et al., 2012; Pradeepa et al., 2012). Several reports have suggested that gene expression is controlled under high temperature through regulation at the chromatin level (Kumar and Wigge, 2010; Strenkert et al., 2011; for review, see Sawarkar and Paro, 2013). It is possible that HS-induced factors not only play a role in transcriptional regulation but also help to determine transcript specificity in AS regulation through epigenetic control under elevated temperatures.
ES has been found in the Arabidopsis HSFA2 gene (Sugio et al., 2009). HSFA2 is known to be the dominant, HS-inducible activator for HSP transcription, especially small HSPs, in the thermotolerance response (Nishizawa et al., 2006; Schramm et al., 2006; Charng et al., 2007; for review, see von Koskull-Döring et al., 2007). A recent report further suggested that truncated isoforms of Arabidopsis HSFA2 caused by AS retain the ability to bind HSEs (Liu et al., 2013). Surprisingly, the ES pattern of P. patens HSFA1-1 is similar to that of Arabidopsis HSFA2. Skipping of a miniexon in the intron of the DBD-encoding region leads to the production of functional HSFs (Sugio et al., 2009). Inclusion of their miniexons causes early translational termination that produces polypeptides with an incomplete DBD (isoform 1 for PpHSFA1-1). These phenomena strongly suggest that ES regulation for HSF genes, at least among members of A-type HSFs, can be tracked back to the ancient plant system.
Mosses are ancient organisms that diverged early in land plant evolution and, therefore, are important for studying the evolutionary development of higher plants. Although P. patens is a nonvascular plant with different morphologic features and a dominant haploid stage in the life cycle, many of its physiological and developmental traits are similar to those of higher plants. Its evolutionary position in the intermediate group of the green lineage benefits the study of the conserved mechanism of the plant stress response. Indeed, we observed that the occurrence of AS in the moss is also comparable to that of higher plants. Although we do not know whether the transcript specificity of HS-AS is also conserved, results from ES of HSF transcripts in P. patens and Arabidopsis support that this mechanism is retained during the evolution of flowering plants. Our finding also suggests that AS was diversified already during land colonization of aquatic photosynthetic organisms.
In this study, we did not try to assemble transcripts for scoring AS events, for several reasons. First, regulation for an AS event occurring on multiple transcripts of the same gene should be similar. Therefore, scoring the AS event to detect a heat-sensitive pattern is enough for us to investigate the potential mechanism of splicing regulation. Second, genome mapping from short sequencing reads still has limitations. For example, calculation of isoform concentration based on short-read mapping remains a computational challenge. Even if computation can provide predicted numbers according to the ratio of reads supporting different AS events, transcripts with combinations of multiple AS events complicate the process. This situation can eventually be solved by generating a large data set of long sequencing reads with enough transcriptome coverage.
In summary, we provide data to suggest that plants rapidly respond to elevated temperature at the mRNA splicing step to fine-tune the abundance of alternatively spliced transcripts. Our analysis reveals that AS can be differentially regulated in response to heat stress. These findings will be valuable in addressing the biological functions of AS, especially for the stress response. Our study also gives rise to interesting questions such as how temperature signaling regulates splicing activity and how the splicing machinery distinguishes transcript species. Further investigation of these questions may contribute to the urgent issues of global warming, energy, and food production.
MATERIALS AND METHODS
Plant Materials and Growth Conditions
Protonemata of Physcomitrella patens subsp. patens were grown on solid Knop’s medium or solid BCDAT medium. Spores were germinated on solid Knop’s medium supplemented with 10 mm CaCl2 and overlaid with cellophane for 14 to 16 d. Plants were cultured at 25°C under continuous white light (80–100 μmol m−2 s−1).
Heat Treatment and Chlorophyll a Fluorescence Measurement
P. patens protonema were germinated from spores and then transferred to a petri dish (100 × 20 mm) with solid BCDAT medium for 1 d under the growth conditions described above. Heat treatment was done as described previously (Charng et al., 2006; Shi and Theg, 2010). In brief, the experiment was begun at a fixed time of day. Plates containing 2-week-old protonemal tissues were sealed with plastic electric tape and submerged in a water bath at the indicated temperature and duration (38°C and 1 h) inside a normal temperature-controlled chamber (25°C). During the recovery time between two heat treatments, the plates were kept at the normal growth condition. Following two heat treatments, chlorophyll a fluorescence of the protonemal tissues was measured immediately after predarkening at room temperature for about 40 min. The intrinsic efficiency of PSII photochemistry (the ratio of variable and maximum fluorescence of PSII in the dark-adapted state) was calculated by the use of Pulse Amplitude Modulation (PAM) fluorometry (Dual-PAM-100; Heinz Walz).
RNA Isolation and mRNA Sequencing
Total RNA was isolated from protonema tissues by use of the Plant Total RNA Miniprep Purification Kit (GeneMark) and quantified with the Nanodrop system (Thermo Fisher Scientific). DNase digestion was performed during total RNA isolation to remove genomic DNA. We prepared two batches of independently HS-treated samples. Equal amounts of total RNA from five technical replicates of each sample were pooled for library preparation as described previously (Chen et al., 2012b). Multiplex Identifier-mRNA sequencing was performed on the Illumina Hiseq 2000 system at Yourgene Bioscience. Sequence reads from the first batch of samples were obtained by the single-end method in 75-, 76-, and 94-nucleotide lengths. Sequence reads from the second batch of samples were obtained by the paired-end method in 101-nucleotide length. After sequence trimming and filtering, reads from both batches were pooled for each sample (control, 1st HS, or 2nd HS) and subjected to genome mapping.
Read Mapping to the Reference Genome
Sequence reads were mapped to the P. patens genome V1.6 (http://cosmoss.org/; data can also be found in the Joint Genome Institute [http://www.phytozome.net/physcomitrella.php]) using the BLAT program with default parameters (Kent, 2002; Zimmer et al., 2013). For TopHat (http://tophat.cbcb.umd.edu/index.shtml) mapping, default settings were also used (Trapnell et al., 2009). A 95% identity was used as the threshold of sequence alignment for all lengths of reads to ensure consistent mapping efficiency. RPKM computation was undertaken using RACKJ (http://rackj.sourceforge.net/) with a similar algorithm to one described previously (Mortazavi et al., 2008). Data were analyzed in Excel (Microsoft).
Prediction of SJs and AS
With mapping results from BLAT, we used RACKJ to compute the read counts in following tables genome wide: (1) for every exon; (2) for every intron; (3) for every exon pair mapped by splice reads; and (4) for every exon pair plus junction shifts supported by spliced reads. AS events were then computed accordingly. The second and third tables record potential IR and ES events, respectively. SJs can be obtained from the fourth table, which also records AltDA events. To remove the events potentially predicted by mapping error, we performed a filtering process for SJs, with a minimum of eight-nucleotide identical alignment blocks to the genome and supported by at least five reads with at least two of them starting at different positions.
With the aforementioned tables, perl scripts of RACKJ were developed for detecting HS-AS (IR, AltDA, and ES) events with preference for some of the samples (http://rackj.sourceforge.net/Scripts/index.html#comparison). Generally speaking, χ2 values for goodness of fit were computed by comparing read counts supporting an AS event (i.e. intronic read counts, exon-skipped read counts, and alternative donor/acceptor read counts) and read counts not supporting the AS event (e.g. read counts of corresponding gene exons, read counts of neighboring exons, and read counts of the same exon pair but not of the same AltDA events). For instance, to detect the preference of IR, the χ2 value for goodness of fit was computed using the following formula:
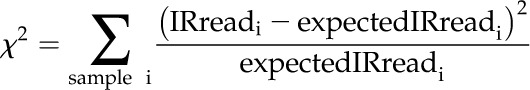 |
where expectedIRreadi is proportional to the read count of corresponding gene exons of sample i and ΣexpectedFrequencyi = ΣIRreadi. In so doing, the test was carried out under the null hypothesis that assuming a common chance of an IR event for all samples and a significant P value should mean the IR event with preference for some of the samples. We then computed corresponding P values with χ2 distribution using Microsoft Excel. P values were further corrected with false discovery rate procedures. To calculate the differential expression levels of IR events, the numbers of the following four read species were used: intronic reads of the event in the control sample (Ic), unique exon reads of the corresponding gene in the control sample (Uc), intronic reads of the event in the HS sample (IHS), and unique exon reads of the corresponding gene in the HS sample (UHS). The fold change in IR level responsive to HS was calculated as follows: (IHS/UHS)/(Ic/Uc).
PTC Prediction
To detect PTC for IR transcripts, a perl script was developed to count for stop codons in the retained intron or downstream sequence when IR occurs. Details of usage can be found at http://rackj.sourceforge.net/SpecialScripts/index.html#PTCdetection.
GO Analysis
The GO Browsing Utility with the MultiView plugin (http://gobu.openfoundry.org/) was used for functional enrichment analysis (Lin et al., 2006). To first obtain GO annotations for all P. patens transcripts, gene sequences were subjected to the Bio301 system (Chen et al., 2012a), which predicts functions by blasting against UniProt and RefSeq databases and by InterProt domain prediction to generate the reference GO annotation set. The published GO annotation for P. patens genes (http://cosmoss.org/) was also included for the prediction of gene function (Zimmer et al., 2013). P values for overrepresented GO terms were computed by comparing the differentially regulated gene set with the reference GO annotation set using the “elim” method (Li et al., 2013). The elim method is a Java implementation of the TopGO elim algorithm (Alexa et al., 2006). For generating heat maps, relative IR, AltDA, and ES levels as well as RPKM of corresponding genes were plotted in Java Treeview software (Saldanha, 2004).
Analysis of cis-Regulatory Elements
Motif search involved use of the MEME suite (Bailey et al., 2009). We performed an extra run of MAST, a member program of MEME, with the option -hit_list for searching motif sites on promoter or AS regions. Every predicted motif site in the MAST output is associated with a P value for similarity. To compute the preference of a given motif, under a certain MAST P value threshold, Fisher’s exact test was performed with the following four numbers: (1) heat-regulated AS regions hit (i.e. input sequences with at least one motif occurrence); (2) randomly selected AS regions hit; (3) heat-regulated AS regions not hit; and (4) randomly selected AS regions not hit. In so doing, a motif that is preferentially present in HS-AS regions would show a significant P value.
qRT-PCR Analysis
cDNA synthesis was performed by using 4.5 μg of total RNA, an oligo(dT), and the SuperScript III RT kit (Invitrogen). qRT-PCR analysis involved the use of the 7500 Real Time PCR System (Applied Biosystems) with the Power SYBR Green PCR Master Mix (Applied Biosystems). Primers designed by Primer Express Software version 3.0 (Applied Biosystems) are listed in Supplemental Table S4. qRT-PCR was performed in triplicate. PpACT2 (for actin; Pp1s198_157V6) was used as an internal control for normalization.
High-Resolution RT-PCR
High-resolution RT-PCR was performed as described previously with minor modifications (Simpson et al., 2008). PCR was performed with AS-specific primers (Supplemental Table S4). One strand of the primer pair was labeled with the fluorescent dye 5-carboxyfluorescein. The labeled RT-PCR product (1 μL) was diluted into a 10-μL mixture of Hi-Di formamide and GeneScan 600 LIZ internal size standard (Applied Biosystems). The proportion of Hi-Di formamide and GeneScan 600 LIZ was 90:1. DNA fragments were separated on an ABI3730 DNA Analyzer (Applied Biosystems) with three technical repeats and then analyzed by the use of Peak Scanner version 1.0. RT-PCR products from corresponding AS isoforms were identified with the expected sizes. The percentage of each AS isoform was calculated by the fluorescent peak areas of AS transcripts divided by the sum of all transcripts. In comparing results from the control, 1st HS, and 2nd HS by ANOVA or Student’s t test, P values were generated. Significant AS events were considered at P < 0.01.
All RNA-seq data from this study have been submitted to the National Center for Biotechnology Information Sequence Read Archive database (http://www.ncbi.nlm.nih.gov/sra) and assigned the accession number SRA068782. Sequence reads for the control (run nos. SRR790623, SRR790648, SRR790660, and SRR790254), 1st HS (run nos. SRR790624, SRR790649, SRR790662, and SRR790259), and 2nd HS (run nos. SRR790625, SRR790650, SRR790663, and SRR790261) samples were combined for data analysis in this study.
Supplemental Data
The following materials are available in the online version of this article.
Supplemental Figure S1. Confirmation of the HS response in P. patens.
Supplemental Figure S2. Comparison of genes differentially expressed and alternatively spliced in response to 1st HS and 2nd HS.
Supplemental Figure S3. Validation of HS-IR events.
Supplemental Figure S4. Validation of heat-regulated alternative donor and acceptor sites.
Supplemental Figure S5. Multiple sequence alignment of Arabidopsis and P. patens HSFs.
Supplemental Figure S6. Validation of heat-regulated IR on PpHSFA1-3 transcripts.
Supplemental Figure S7. Mapping results from control, 1st HS, and 2nd HS samples.
Supplemental Table S1. Mapping statistics of RNA-seq.
Supplemental Table S2. SJs and AS events identified from the BLAT and TopHat mapping tools.
Supplemental Table S3. PTC prediction of HS-IR events.
Supplemental Table S4. Primers used in this study.
Supplemental Data Set S1. SJs identified from genome alignment of all, control, 1st HS, and 2nd HS sequencing reads.
Supplemental Data Set S2. IR events identified from genome alignment of all, control, 1st HS, and 2nd HS sequencing reads.
Supplemental Data Set S3. AltDA events identified from genome alignment of all, control, 1st HS, and 2nd HS sequencing reads.
Supplemental Data Set S4. ES events identified from genome alignment of all, control, 1st HS, and 2nd HS sequencing reads.
Supplemental Data Set S5. HS-AS events identified in 1st HS and 2nd HS samples.
Supplemental Data Set S6. Differentially expressed genes identified in 1st HS and 2nd HS samples.
Supplemental Data Set S7. Levels of HS-AS events identified in the 1st HS sample.
Supplemental Data Set S8. Annotation of splicing-related and protein-folding genes with HS-IR.
Supplemental Data Set S9. Annotation of genes described in this study.
Supplementary Material
Acknowledgments
We thank Yee-yung Charng and Laura Smales for critically reading the article, Mei-Jane Fang for technical assistance, and the National Center for Genome Medicine (NCGM) at Academia Sinica for genotyping/technical support. The NCGM was supported by grants from the National Core Facility Program for Biotechnology of National Science Council, Taiwan.
Glossary
- HSR
heat shock response
- HSF
heat shock transcription factors
- HS
heat shock
- AS
alternative splicing
- premRNA
precursor mRNA
- SR
Ser/Arg-rich
- RNA-seq
mRNA sequencing
- IR
intron retention
- 1st HS
first heat shock at 38°C for 1 h
- 2nd HS
second heat shock at 38°C for 1 h
- SJ
splice junction
- AltDA
alternative donor and/or acceptor site
- ES
exon skipping
- HS-AS
heat-sensitive alternative splicing
- HS-IR
heat-sensitive intron retention
- HS-AltDA
heat-sensitive alternative donor and/or acceptor site
- HS-ES
heat-sensitive exon skipping
- RPKM
reads per kilobase of exon model per million mapped reads
- IPKM
intron reads per kilobase of retained intron per million mapped reads
- PTC
premature termination codon
- GO
Gene Ontology
- qRT
quantitative reverse transcription
- RT
reverse transcription
- DBD
DNA-binding domain
- cDNA
complementary DNA
Footnotes
This work was supported by a Career Development Award from Academia Sinica (to S.-L.T.) and by the Developmental Program of Industrialization of Agriculture Biotechnology, National Science Council, Taiwan (grant no. 099S0050116–AA to S.-L.T.).
The online version of this article contains Web-only data.
Articles can be viewed online without a subscription.
References
- Alexa A, Rahnenführer J, Lengauer T. (2006) Improved scoring of functional groups from gene expression data by decorrelating GO graph structure. Bioinformatics 22: 1600–1607 [DOI] [PubMed] [Google Scholar]
- Aviezer-Hagai K, Skovorodnikova J, Galigniana M, Farchi-Pisanty O, Maayan E, Bocovza S, Efrat Y, von Koskull-Döring P, Ohad N, Breiman A. (2007) Arabidopsis immunophilins ROF1 (AtFKBP62) and ROF2 (AtFKBP65) exhibit tissue specificity, are heat-stress induced, and bind HSP90. Plant Mol Biol 63: 237–255 [DOI] [PubMed] [Google Scholar]
- Bailey TL, Boden M, Buske FA, Frith M, Grant CE, Clementi L, Ren J, Li WW, Noble WS. (2009) MEME SUITE: tools for motif discovery and searching. Nucleic Acids Res 37: W202–W208 [DOI] [PMC free article] [PubMed] [Google Scholar]
- Baniwal SK, Bharti K, Chan KY, Fauth M, Ganguli A, Kotak S, Mishra SK, Nover L, Port M, Scharf KD, et al. (2004) Heat stress response in plants: a complex game with chaperones and more than twenty heat stress transcription factors. J Biosci 29: 471–487 [DOI] [PubMed] [Google Scholar]
- Black DL. (2003) Mechanisms of alternative pre-messenger RNA splicing. Annu Rev Biochem 72: 291–336 [DOI] [PubMed] [Google Scholar]
- Bond U. (1988) Heat shock but not other stress inducers leads to the disruption of a sub-set of snRNPs and inhibition of in vitro splicing in HeLa cells. EMBO J 7: 3509–3518 [DOI] [PMC free article] [PubMed] [Google Scholar]
- Byrne ME. (2009) A role for the ribosome in development. Trends Plant Sci 14: 512–519 [DOI] [PubMed] [Google Scholar]
- Chang YF, Imam JS, Wilkinson MF. (2007) The nonsense-mediated decay RNA surveillance pathway. Annu Rev Biochem 76: 51–74 [DOI] [PubMed] [Google Scholar]
- Charng YY, Liu HC, Liu NY, Chi WT, Wang CN, Chang SH, Wang TT. (2007) A heat-inducible transcription factor, HsfA2, is required for extension of acquired thermotolerance in Arabidopsis. Plant Physiol 143: 251–262 [DOI] [PMC free article] [PubMed] [Google Scholar]
- Charng YY, Liu HC, Liu NY, Hsu FC, Ko SS. (2006) Arabidopsis Hsa32, a novel heat shock protein, is essential for acquired thermotolerance during long recovery after acclimation. Plant Physiol 140: 1297–1305 [DOI] [PMC free article] [PubMed] [Google Scholar]
- Chen Y, Chen Y, Lin W, Hsiao C, Chiu H, Ho J (2012a) Bio301: a Web-based EST annotation pipeline that facilitates functional comparison studies. ISRN Bioinformatics 2012: Article 139842 [DOI] [PMC free article] [PubMed] [Google Scholar]
- Chen YR, Su YS, Tu SL. (2012b) Distinct phytochrome actions in nonvascular plants revealed by targeted inactivation of phytobilin biosynthesis. Proc Natl Acad Sci USA 109: 8310–8315 [DOI] [PMC free article] [PubMed] [Google Scholar]
- Diernfellner ACR, Schafmeier T, Merrow MW, Brunner M. (2005) Molecular mechanism of temperature sensing by the circadian clock of Neurospora crassa. Genes Dev 19: 1968–1973 [DOI] [PMC free article] [PubMed] [Google Scholar]
- Duncan R, Hershey JW. (1984) Heat shock-induced translational alterations in HeLa cells: initiation factor modifications and the inhibition of translation. J Biol Chem 259: 11882–11889 [PubMed] [Google Scholar]
- Filichkin SA, Priest HD, Givan SA, Shen R, Bryant DW, Fox SE, Wong WK, Mockler TC. (2010) Genome-wide mapping of alternative splicing in Arabidopsis thaliana. Genome Res 20: 45–58 [DOI] [PMC free article] [PubMed] [Google Scholar]
- Fiorenza MT, Farkas T, Dissing M, Kolding D, Zimarino V. (1995) Complex expression of murine heat shock transcription factors. Nucleic Acids Res 23: 467–474 [DOI] [PMC free article] [PubMed] [Google Scholar]
- Fujikake N, Nagai Y, Popiel HA, Kano H, Yamaguchi M, Toda T. (2005) Alternative splicing regulates the transcriptional activity of Drosophila heat shock transcription factor in response to heat/cold stress. FEBS Lett 579: 3842–3848 [DOI] [PubMed] [Google Scholar]
- Gong M, van der Luit AH, Knight MR, Trewavas AJ. (1998) Heat-shock-induced changes in intracellular Ca2+ level in tobacco seedlings in relation to thermotolerance. Plant Physiol 116: 429–437 [Google Scholar]
- Goodson ML, Park-Sarge OK, Sarge KD. (1995) Tissue-dependent expression of heat shock factor 2 isoforms with distinct transcriptional activities. Mol Cell Biol 15: 5288–5293 [DOI] [PMC free article] [PubMed] [Google Scholar]
- Graveley BR. (2000) Sorting out the complexity of SR protein functions. RNA 6: 1197–1211 [DOI] [PMC free article] [PubMed] [Google Scholar]
- Kent WJ. (2002) BLAT: the BLAST-like alignment tool. Genome Res 12: 656–664 [DOI] [PMC free article] [PubMed] [Google Scholar]
- Kim BH, Schöffl F. (2002) Interaction between Arabidopsis heat shock transcription factor 1 and 70 kDa heat shock proteins. J Exp Bot 53: 371–375 [DOI] [PubMed] [Google Scholar]
- Kumar SV, Wigge PA. (2010) H2A.Z-containing nucleosomes mediate the thermosensory response in Arabidopsis. Cell 140: 136–147 [DOI] [PubMed] [Google Scholar]
- Lan P, Li W, Lin WD, Santi S, Schmidt W. (2013) Mapping gene activity of Arabidopsis root hairs. Genome Biol 14: R67. [DOI] [PMC free article] [PubMed] [Google Scholar]
- Li W, Lin WD, Ray P, Lan P, Schmidt W. (2013) Genome-wide detection of condition-sensitive alternative splicing in Arabidopsis roots. Plant Physiol 162: 1750–1763 [DOI] [PMC free article] [PubMed] [Google Scholar]
- Lin WD, Chen YC, Ho JM, Hsiao CD. (2006) GOBU: toward an integration interface for biological objects. J Inf Sci Eng 22: 19–29 [Google Scholar]
- Liu HT, Sun DY, Zhou RG. (2005) Ca2+ and AtCaM3 are involved in the expression of heat shock protein gene in Arabidopsis. Plant Cell Environ 28: 1276–1284 [Google Scholar]
- Liu J, Sun N, Liu M, Liu J, Du B, Wang X, Qi X. (2013) An autoregulatory loop controlling Arabidopsis HsfA2 expression: role of heat shock-induced alternative splicing. Plant Physiol 162: 512–521 [DOI] [PMC free article] [PubMed] [Google Scholar]
- Luco RF, Allo M, Schor IE, Kornblihtt AR, Misteli T. (2011) Epigenetics in alternative pre-mRNA splicing. Cell 144: 16–26 [DOI] [PMC free article] [PubMed] [Google Scholar]
- Luco RF, Pan Q, Tominaga K, Blencowe BJ, Pereira-Smith OM, Misteli T. (2010) Regulation of alternative splicing by histone modifications. Science 327: 996–1000 [DOI] [PMC free article] [PubMed] [Google Scholar]
- Manley JL, Tacke R. (1996) SR proteins and splicing control. Genes Dev 10: 1569–1579 [DOI] [PubMed] [Google Scholar]
- Marquez Y, Brown JWS, Simpson C, Barta A, Kalyna M. (2012) Transcriptome survey reveals increased complexity of the alternative splicing landscape in Arabidopsis. Genome Res 22: 1184–1195 [DOI] [PMC free article] [PubMed] [Google Scholar]
- McCullough AJ, Schuler MA. (1997) Intronic and exonic sequences modulate 5′ splice site selection in plant nuclei. Nucleic Acids Res 25: 1071–1077 [DOI] [PMC free article] [PubMed] [Google Scholar]
- Moehle EA, Ryan CJ, Krogan NJ, Kress TL, Guthrie C. (2012) The yeast SR-like protein Npl3 links chromatin modification to mRNA processing. PLoS Genet 8: e1003101. [DOI] [PMC free article] [PubMed] [Google Scholar]
- Morimoto RI. (1998) Regulation of the heat shock transcriptional response: cross talk between a family of heat shock factors, molecular chaperones, and negative regulators. Genes Dev 12: 3788–3796 [DOI] [PubMed] [Google Scholar]
- Mortazavi A, Williams BA, McCue K, Schaeffer L, Wold B. (2008) Mapping and quantifying mammalian transcriptomes by RNA-Seq. Nat Methods 5: 621–628 [DOI] [PubMed] [Google Scholar]
- Mosser DD, Duchaine J, Massie B. (1993) The DNA-binding activity of the human heat shock transcription factor is regulated in vivo by hsp70. Mol Cell Biol 13: 5427–5438 [DOI] [PMC free article] [PubMed] [Google Scholar]
- Nishizawa A, Yabuta Y, Yoshida E, Maruta T, Yoshimura K, Shigeoka S. (2006) Arabidopsis heat shock transcription factor A2 as a key regulator in response to several types of environmental stress. Plant J 48: 535–547 [DOI] [PubMed] [Google Scholar]
- Palusa SG, Ali GS, Reddy ASN. (2007) Alternative splicing of pre-mRNAs of Arabidopsis serine/arginine-rich proteins: regulation by hormones and stresses. Plant J 49: 1091–1107 [DOI] [PubMed] [Google Scholar]
- Pan Q, Shai O, Lee LJ, Frey BJ, Blencowe BJ. (2008) Deep surveying of alternative splicing complexity in the human transcriptome by high-throughput sequencing. Nat Genet 40: 1413–1415 [DOI] [PubMed] [Google Scholar]
- Pertea M, Mount SM, Salzberg SL. (2007) A computational survey of candidate exonic splicing enhancer motifs in the model plant Arabidopsis thaliana. BMC Bioinformatics 8: 159. [DOI] [PMC free article] [PubMed] [Google Scholar]
- Pradeepa MM, Sutherland HG, Ule J, Grimes GR, Bickmore WA. (2012) Psip1/Ledgf p52 binds methylated histone H3K36 and splicing factors and contributes to the regulation of alternative splicing. PLoS Genet 8: e1002717. [DOI] [PMC free article] [PubMed] [Google Scholar]
- Ramchatesingh J, Zahler AM, Neugebauer KM, Roth MB, Cooper TA. (1995) A subset of SR proteins activates splicing of the cardiac troponin T alternative exon by direct interactions with an exonic enhancer. Mol Cell Biol 15: 4898–4907 [DOI] [PMC free article] [PubMed] [Google Scholar]
- Reddy AS. (2007) Alternative splicing of pre-messenger RNAs in plants in the genomic era. Annu Rev Plant Biol 58: 267–294 [DOI] [PubMed] [Google Scholar]
- Reddy AS, Day IS, Göhring J, Barta A. (2012) Localization and dynamics of nuclear speckles in plants. Plant Physiol 158: 67–77 [DOI] [PMC free article] [PubMed] [Google Scholar]
- Saidi Y, Finka A, Chakhporanian M, Zrÿd JP, Schaefer DG, Goloubinoff P. (2005) Controlled expression of recombinant proteins in Physcomitrella patens by a conditional heat-shock promoter: a tool for plant research and biotechnology. Plant Mol Biol 59: 697–711 [DOI] [PubMed] [Google Scholar]
- Saidi Y, Finka A, Muriset M, Bromberg Z, Weiss YG, Maathuis FJM, Goloubinoff P. (2009) The heat shock response in moss plants is regulated by specific calcium-permeable channels in the plasma membrane. Plant Cell 21: 2829–2843 [DOI] [PMC free article] [PubMed] [Google Scholar]
- Saidi Y, Peter M, Finka A, Cicekli C, Vigh L, Goloubinoff P. (2010) Membrane lipid composition affects plant heat sensing and modulates Ca2+-dependent heat shock response. Plant Sig Behav 5: 1530–1533 [DOI] [PMC free article] [PubMed] [Google Scholar]
- Saldanha AJ. (2004) Java Treeview: extensible visualization of microarray data. Bioinformatics 20: 3246–3248 [DOI] [PubMed] [Google Scholar]
- Sawarkar R, Paro R. (2013) Hsp90@chromatin.nucleus: an emerging hub of a networker. Trends Cell Biol 23: 193–201 [DOI] [PubMed] [Google Scholar]
- Schramm F, Ganguli A, Kiehlmann E, Englich G, Walch D, von Koskull-Döring P. (2006) The heat stress transcription factor HsfA2 serves as a regulatory amplifier of a subset of genes in the heat stress response in Arabidopsis. Plant Mol Biol 60: 759–772 [DOI] [PubMed] [Google Scholar]
- Schwartz S, Ast G. (2010) Chromatin density and splicing destiny: on the cross-talk between chromatin structure and splicing. EMBO J 29: 1629–1636 [DOI] [PMC free article] [PubMed] [Google Scholar]
- Shalgi R, Hurt JA, Krykbaeva I, Taipale M, Lindquist S, Burge CB. (2013) Widespread regulation of translation by elongation pausing in heat shock. Mol Cell 49: 439–452 [DOI] [PMC free article] [PubMed] [Google Scholar]
- Shi LX, Theg SM. (2010) A stromal heat shock protein 70 system functions in protein import into chloroplasts in the moss Physcomitrella patens. Plant Cell 22: 205–220 [DOI] [PMC free article] [PubMed] [Google Scholar]
- Shi Y, Mosser DD, Morimoto RI. (1998) Molecular chaperones as HSF1-specific transcriptional repressors. Genes Dev 12: 654–666 [DOI] [PMC free article] [PubMed] [Google Scholar]
- Shukla RR, Dominski Z, Zwierzynski T, Kole R. (1990) Inactivation of splicing factors in HeLa cells subjected to heat shock. J Biol Chem 265: 20377–20383 [PubMed] [Google Scholar]
- Simpson CG, Fuller J, Maronova M, Kalyna M, Davidson D, McNicol J, Barta A, Brown JW. (2008) Monitoring changes in alternative precursor messenger RNA splicing in multiple gene transcripts. Plant J 53: 1035–1048 [DOI] [PubMed] [Google Scholar]
- Sinha R, Zimmer AD, Bolte K, Lang D, Reski R, Platzer M, Rensing SA, Backofen R. (2010) Identification and characterization of NAGNAG alternative splicing in the moss Physcomitrella patens. BMC Plant Biol 10: 76. [DOI] [PMC free article] [PubMed] [Google Scholar]
- Strenkert D, Schmollinger S, Sommer F, Schulz-Raffelt M, Schroda M. (2011) Transcription factor-dependent chromatin remodeling at heat shock and copper-responsive promoters in Chlamydomonas reinhardtii. Plant Cell 23: 2285–2301 [DOI] [PMC free article] [PubMed] [Google Scholar]
- Sugio A, Dreos R, Aparicio F, Maule AJ. (2009) The cytosolic protein response as a subcomponent of the wider heat shock response in Arabidopsis. Plant Cell 21: 642–654 [DOI] [PMC free article] [PubMed] [Google Scholar]
- Sung DY, Kaplan F, Lee KJ, Guy CL. (2003) Acquired tolerance to temperature extremes. Trends Plant Sci 8: 179–187 [DOI] [PubMed] [Google Scholar]
- Suri SS, Dhindsa RS. (2008) A heat-activated MAP kinase (HAMK) as a mediator of heat shock response in tobacco cells. Plant Cell Environ 31: 218–226 [DOI] [PubMed] [Google Scholar]
- Syed NH, Kalyna M, Marquez Y, Barta A, Brown JWS. (2012) Alternative splicing in plants: coming of age. Trends Plant Sci 17: 616–623 [DOI] [PMC free article] [PubMed] [Google Scholar]
- Thomas J, Palusa SG, Prasad KV, Ali GS, Surabhi GK, Ben-Hur A, Abdel-Ghany SE, Reddy AS. (2012) Identification of an intronic splicing regulatory element involved in auto-regulation of alternative splicing of SCL33 pre-mRNA. Plant J 72: 935–946 [DOI] [PubMed] [Google Scholar]
- Trapnell C, Pachter L, Salzberg SL. (2009) TopHat: discovering splice junctions with RNA-Seq. Bioinformatics 25: 1105–1111 [DOI] [PMC free article] [PubMed] [Google Scholar]
- Vierling E. (1991) The roles of heat shock proteins in plants. Annu Rev Plant Physiol Plant Mol Biol 42: 579–620 [Google Scholar]
- Vigh L, Maresca B, Harwood JL. (1998) Does the membrane’s physical state control the expression of heat shock and other genes? Trends Biochem Sci 23: 369–374 [DOI] [PubMed] [Google Scholar]
- von Koskull-Döring P, Scharf KD, Nover L. (2007) The diversity of plant heat stress transcription factors. Trends Plant Sci 12: 452–457 [DOI] [PubMed] [Google Scholar]
- Vries RG, Flynn A, Patel JC, Wang X, Denton RM, Proud CG. (1997) Heat shock increases the association of binding protein-1 with initiation factor 4E. J Biol Chem 272: 32779–32784 [DOI] [PubMed] [Google Scholar]
- Wang ET, Sandberg R, Luo S, Khrebtukova I, Zhang L, Mayr C, Kingsmore SF, Schroth GP, Burge CB. (2008) Alternative isoform regulation in human tissue transcriptomes. Nature 456: 470–476 [DOI] [PMC free article] [PubMed] [Google Scholar]
- Yamada K, Fukao Y, Hayashi M, Fukazawa M, Suzuki I, Nishimura M. (2007) Cytosolic HSP90 regulates the heat shock response that is responsible for heat acclimation in Arabidopsis thaliana. J Biol Chem 282: 37794–37804 [DOI] [PubMed] [Google Scholar]
- Yan K, Liu P, Wu CA, Yang GD, Xu R, Guo QH, Huang JG, Zheng CC. (2012) Stress-induced alternative splicing provides a mechanism for the regulation of microRNA processing in Arabidopsis thaliana. Mol Cell 48: 521–531 [DOI] [PubMed] [Google Scholar]
- Yeakley JM, Morfin JP, Rosenfeld MG, Fu XD. (1996) A complex of nuclear proteins mediates SR protein binding to a purine-rich splicing enhancer. Proc Natl Acad Sci USA 93: 7582–7587 [DOI] [PMC free article] [PubMed] [Google Scholar]
- Yost HJ, Lindquist S. (1986) RNA splicing is interrupted by heat shock and is rescued by heat shock protein synthesis. Cell 45: 185–193 [DOI] [PubMed] [Google Scholar]
- Zhang G, Guo G, Hu X, Zhang Y, Li Q, Li R, Zhuang R, Lu Z, He Z, Fang X, et al. (2010) Deep RNA sequencing at single base-pair resolution reveals high complexity of the rice transcriptome. Genome Res 20: 646–654 [DOI] [PMC free article] [PubMed] [Google Scholar]
- Zimmer AD, Lang D, Buchta K, Rombauts S, Nishiyama T, Hasebe M, Van de Peer Y, Rensing SA, Reski R. (2013) Reannotation and extended community resources for the genome of the non-seed plant Physcomitrella patens provide insights into the evolution of plant gene structures and functions. BMC Genomics 14: 498. [DOI] [PMC free article] [PubMed] [Google Scholar]
Associated Data
This section collects any data citations, data availability statements, or supplementary materials included in this article.