

Highlights
-
•
SNP rs1143684 results in either a Phe or Leu at position 47 in human NQO2.
-
•
NQO2-L47 has a slightly lower kcat/Km; it also has a lower Ki,app with resveratrol.
-
•
NQO2-L47 is more unstable to proteolysis and thermal denaturation.
-
•
NQO2-F47 (but not NQO2-L47) shows negative cooperativity towards resveratrol.
-
•
NQO2-L47 exists as multiple conformers in solution.
Keywords: rs1143684, Resveratrol, Cooperativity, Dihydronicotinamide riboside
Abstract
There are two common forms of NRH-quinone oxidoreductase 2 (NQO2) in the human population resulting from SNP rs1143684. One has phenylalanine at position 47 (NQO2-F47) and the other leucine (NQO2-L47). Using recombinant proteins, we show that these variants have similar steady state kinetic parameters, although NQO2-L47 has a slightly lower specificity constant. NQO2-L47 is less stable towards proteolytic digestion and thermal denaturation than NQO2-F47. Both forms are inhibited by resveratrol, but NQO2-F47 shows negative cooperativity with this inhibitor. Thus these data demonstrate, for the first time, clear biochemical differences between the variants which help explain previous biomedical and epidemiological findings.
1. Introduction
There are two members of the quinone oxidoreductase family in humans. Of these, NAD(P)H quinone oxidoreductase 1 (NQO1, DT-diaphorase, EC 1.6.5.2) is the better characterised of the two [1,2]. This enzyme is believed to be involved in vitamin K metabolism and in reducing the cellular quinone concentration, thus preventing build-up of reactive oxygen species [3–5]. It also binds to, and stabilises, the apoptosis regulator p53 [6–11]. Its up-regulation in some cancer cells and its role in the conversion of some pro-drugs (e.g. mitomycin c) to their pharmacologically active forms has resulted in considerable interest in targeting this enzyme for the development of novel cancer chemotherapies [5,12–16]. Much less is known about NRH quinone oxidoreductase 2 (NQO2, EC 1.10.99.2). Like NQO1, it has a tightly bound FAD cofactor which is reduced as part of the enzyme’s catalytic cycle [17]. However, the reductant differs between the two enzymes. While NQO1 can utilise both NADH and NADPH with almost equal efficiency [18], NQO2 has only low levels of activity with these compounds [19,20]. In vitro experiments have demonstrated that the non-physiological compound dihydronicotinamide riboside (NRH) acts as a good substrate [19]. In addition, N-methyldihydronicotinamide and dihydrobenzylnicotamide, have been reported to be able to act as reductants in vitro and 1-carbamoylmethyl-1,4-dihydronicotinamide (caricotamide, EP 0152R) is a cell-permeable NRH analogue which enables the reductive activation of the pro-drug CB1954 (5-(aziridin-1-yl)-2,4-dinitrobenzamide) by NQO2 [21–26].
Both NQO1 and NQO2 have substituted enzyme (ping-pong) mechanisms in which, following initial reduction of the FAD molecule by NAD(P)H or NRH, the first product leaves the active site and is replaced by the second substrate which then undergoes a two electron reduction, regenerating FAD [17,27]. The active sites can accommodate and reduce a wide variety of molecules including quinones, nitro-compounds and iron (III) ions [28–32]. NQO1 is inhibited by the anticoagulant dicoumarol and many structurally related compounds [33]. In contrast, NQO2 is only weakly inhibited by dicoumarol, but is more strongly competitively inhibited by resveratrol [34]. Ingestion of this compound, which is present in red wine, peanuts, mulberry fruits and dark chocolate, has recently been linked to increased longevity in some species including Saccharomyces cerevisiae and Drosophila melanogaster although the effect in humans remains controversial [35–41].
Interestingly, there are two common forms of the NQO2 gene in the human population. These differ at codon 47 (SNP rs1143684), which can either be CTT (encoding leucine) or TTT (phenylalanine). Thus, there are two corresponding forms of the enzyme, one with phenylalanine at position 47 (NQO2-F47) and the other with leucine (NQO2-L47). Residue 47 is not part of the enzyme’s active site but is close to the dimer interface [42]. Of these NQO2-F47 is the more common in the human population. Estimates of the allele frequency for CTT (Leu) vary from 2% in African populations to 33% in East Asians; the estimated frequency in Europeans is 20% (http://e72.ensembl.org/Homo_sapiens/Variation/Population?align=548;db=core;r=6:3009890-3010890;v=rs1143684;vdb=variation;vf=907401) [43]. NQO2-L47 has been associated with more rapid decline in memory recall and with better prognosis in breast cancer [44–46]. However, not all studies have demonstrated statistically significant associations between this polymorphism and cancer prognosis [47]. NQO2-L47 has been reported to have lower activity than NQO2-F47 in cell extracts [48] but, to date, little other biochemical data has been collected on the two variants. Here, we compared the biochemical properties of the two forms of NQO2 and provide a molecular explanation for the reduced cellular activity of NQO2-L47.
2. Materials and methods
2.1. Expression and purification of human NQO2
The coding sequence for human NQO2 was amplified by PCR from a plasmid kindly supplied by Dr. David Jamieson (University of Newcastle-upon-Tyne, UK) using primers which enabled the insertion of the amplicon into pET46-Ek-LIC (Merck, Nottingham, UK) according to the manufacturer’s instructions. This sequence encodes a phenylalanine at codon 47 and site directed mutagenesis using the QuickChange protocol [49] was used to change codon 47 to one that encodes leucine. In both cases the entire coding sequence was verified by DNA sequencing (GATC, London, UK). The vector inserts sequence coding for the residues MAHHHHHHVDDDDK at the 5′-end of the gene and so enables purification of the recombinant proteins by nickel affinity chromatography (His-Select, Sigma, Poole, UK) using the same method as employed for other proteins in our laboratory, e.g. [50]. Protein concentrations were estimated by the method of Bradford using BSA as a standard [51].
2.2. NQO2 activity assays
NQO2 activity was measured at 37 °C in 50 mM HEPES, pH 7.3 using NRH as the electron donor and DCPIP as the electron acceptor. NRH was synthesised from NADH [52]. NADH (0.50 g, 0.69 mmol) was dissolved in 20.0 ml of 0.4 M sodium carbonate/bicarbonate buffer, pH 10.0, and incubated at 37 °C for 16 h with 0.1 unit of phosphodiesterase 1 type IV and 500 units of alkaline phosphatase type VII-S. After complete digestion of NADH, the mixture was freeze dried. The dried powder was extracted with methanol (five times 6 ml), and this methanol extract was dried by rotary evaporation and dissolved in 5.0 ml of water. The NRH was then purified in 1 ml batches by preparative HPLC on a microsorb C18 column (21.2 by 250 mm), eluted with 10% methanol in water over 15 min at a flow rate of 15.0 ml min−1. The NRH peak was detected absorption at 350 nm. This peak from each injection was collected, freeze-dried and stored at 4 °C.
All NQO2 activity assays were carried out in triplicate (same enzyme preparation, same enzyme dilution) in the same 96-well plate with readings taken every 5 s and initial, linear rates of change in absorbance at 600 nm measured. Over the NRH concentration range studied, the linear portion of the progress curve lasted at least 50 s. To ensure that initial rates were measured, reactions were done in batches of four wells at a time. Each reaction rate was corrected by subtraction of the background rate of DCPIP reduction by NRH estimated experimentally in a parallel reaction containing the same components except enzyme. This background rate never exceeded 10% of the total rate and the estimated pseudo-first order rate constant for the non-enzymatic reduction under these conditions was (6.7 ± 0.4) × 10−5 s−1. The enzyme-catalyzed rate was divided by the dimeric enzyme concentration (2.5 nM for both variants). The apparent Michaelis constant (Km,app) and apparent turnover number (kcat,app) values were determined by plotting enzyme-catalyzed rate (v) divided by enzyme concentration ([E]) against the corresponding NRH concentration. The data were fitted to Eq. (1) using non-linear curve fitting in GraphPad Prism 6 (GraphPad Software Inc., CA, USA).
| (1) |
Linearized Hill plots were constructed to determine the Hill coefficient (h) according to Eq. (2).
| (2) |
2.3. Inhibition by resveratrol
The effect of resveratrol (0–640 nM; initially dissolved in 100% DMSO and diluted such that the final volume of DMSO in the assay was 0.5% v/v) on the enzyme-catalysed rate was measured at two concentrations of NRH (50 and 100 μM) with a constant DCPIP concentration (70 μM). Dixon plots were constructed to obtain the apparent inhibition constant, Ki,app. The degree of cooperativity towards resveratrol was determined by fitting the data obtained using 50 μM NRH and 70 μM DCPIP to Eq. (3), which follows from obtaining the algebraic ratio of the steady state rate equations in the absence of (v0), and the presence of (v), the competitive inhibitor resveratrol and collecting the constant terms – i.e. Km, [NRH], [DCPIP], Kic (the competitive inhibition constant) – into a single term, Z.
| (3) |
For both variants, the fit to this equation and a similar one lacking the Hill coefficient (h) were compared using an F-test (implemented in GraphPad Prism) and results from the equation judged to be a better fit reported. Linearized Hill plots were also constructed using Eq. (4) using the same data for display purposes.
| (4) |
2.4. Limited proteolysis, crosslinking and determination of flavin content
Limited proteolysis with trypsin, chymotrypsin and subtilisin was carried out as previously described and analysed using tris-tricine SDS–PAGE [53,54]. Crosslinking with bissulfosuccinimidylsuberate (BS3) and N-(3-Dimethylaminopropyl)-N′-ethylcarbodiimide hydrochloride (EDC) was performed as previously described and analysed by tris-glycine SDS–PAGE [53].
The flavin content of the recombinant NQO2 variants was determined by first obtaining an absorption spectrum of the proteins from 250 to 550 nm (Cary 100 Scan). From the absorption at 375 nm and 450 nm, the contribution of the flavin to absorption at 280 nm was calculated. The remaining absorbance at this wavelength was assumed to be due to protein and used to calculate the protein concentration using ε280nm = 44,920 l mol−1 cm−1 (estimated using ProtParam in Expasy [55]). An aliquot (500 μl) of protein was then heated at 95 °C for 4 min to release the FAD followed by centrifugation at 14 000×g for 1 min to remove the precipitated protein [56]. The supernatant was removed and the volume was restored to 500 μl to correct for losses resulting from heating. The absorbance at 375 and 450 nm was determined and used to estimate the concentration of flavin. The occupancy per monomer was calculated as (flavin concentration/NQO2 active site concentration) × 100%.
2.5. Thermal scanning fluorimetry (TSF)
Each variant (0.5 μM in 50 mM HEPES-OH, pH 7.5) was subjected to an increase in temperature from 25 to 95 °C (increments of 1 K and remaining at each temperature for 5 s) in a Rotor-Gene Q cycler (Qiagen) (high resolution melt protocol, no gain optimisation; excitation at 460 nm and emission at 510 nm) exploiting the fluorescence of the cofactor, FAD, which increases when it is released from the enzyme into solution [57]. The melting temperature (Tm) was determined from the first derivative of the melting curve, using the inbuilt analysis software. Stock solutions of resveratrol (in 100% DMSO) and dicumarol (in 0.13 M NaOH) were prepared such that, when diluted into the assay solution, the final concentration of solvent was 0.5% (v/v). Nicotinamide was dissolved in 50 mM HEPES-OH, pH 7.5. The change in melting temperature (ΔTm) at each concentration of ligand was determined and data fitted to Eq. (5).
| (5) |
where ΔTm,max is the maximum, limiting change in Tm and KD,app is the apparent dissociation constant.
3. Results and discussion
3.1. Expression and characterisation of recombinant NQO2-F47 and NQO2-L47
Both variants of NQO2 could be expressed in, and purified from, Escherichia coli (Supplementary Fig. S1). The flavin cofactor of the recombinant NQO2 variants was released by thermal denaturation of the proteins. The absorption spectrum maxima were consistent with those expected for a mixture of FAD and FMN (well defined peaks at 266 and 375 nm and a broad peak 446–450 nm) [58]. This is in contrast to some previous reports where only FMN or only FAD has been detected as the flavin cofactor present in recombinant NQO2 [19,56]. It is not expected to affect the enzyme activity greatly since the standard redox potentials of both compounds are the same (E°′ = −0.219 V at pH = 7 and 30 °C in aqueous buffer) [59]. The estimated flavin occupancy for NQO2-F47 was 35% and for NQO2-L47 86%.
As expected, both variants were able to dimerise as shown by crosslinking with BS3 (Supplementary Fig. S2a). The addition of substrates and inhibitors had little effect on the crosslinking suggesting that they have limited effect on the overall conformation of the dimer (Supplementary Fig. S2b).
3.2. NQO2-F47 and NQO2-L47 have similar enzymatic activities in vitro
Steady state kinetic analysis showed that the two variants have similar activities. The Km,app values are similar; NQO-F47 has a specificity constant (kcat/Km) slightly higher than NQO-L47 (Fig. 1a; Table 1). This is consistent with reports that this variant has higher activity in cell extracts [48]. However, this small difference is unlikely to explain the majority of the observed variation. No cooperativity was observed with NRH as a substrate in either variant (Fig. 1b; Table 1). Both variants are inhibited by resveratrol, with similar apparent inhibition constants (Supplementary Fig. S3a; Table 1). Non-Michaelis-Menten kinetics have been observed with rat NQO1; this enzyme exhibits negative cooperativity towards the inhibitor dicumarol [60]. Interestingly, NQO2-F47 exhibits negative cooperativity towards resveratrol, but NQO2-L47 does not (Fig. 1c; Supplementary Fig. S3b; Table 1).
Fig. 1.

Steady-state enzyme kinetics of NQO2 variants. (a) The dependence of rate on NRH concentration was measured for both NQO2 variants (2.5 nM dimer) in the presence of 70 μM DCPIP. (b) Linear Hill plots were constructed from the data shown in (a) and used to estimate the Hill coefficient (h). (c) Linear Hill plots were constructed from inhibition data for both NQO2 variants (2.5 nM dimer) in the presence of 50 μM NRH, 70 μM DCPIP and varying amounts of resveratrol. In (a–c) each point represents the mean of three separate determinations and the error bar shows the standard error of these means.
Table 1.
Steady state enzyme kinetic parameters of NQO2 variants (2.5 nM) measured at 37 °C with NRH as the electron donor and DCPIP as the acceptor.
| Parameter | NQO2-F47 | NQO2-L47 |
|---|---|---|
| Km,app(NRH)/μMa | 36.1 ± 3.6 | 37.8 ± 3.4 |
| kcat,app/s−1a | 141 ± 4 | 125 ± 3 |
| kcat/Km(NRH)/μM−1 sa,b | 3.91 ± 0.61 | 3.31 ± 0.38 |
| h (NRH as substrate)a | 1.04 ± 0.07 | 1.09 ± 0.10 |
| Ki,app (Resveratrol)/nMc | 31.0 ± 4.3 | 16.7 ± 3.8 |
| h (Resveratrol inhibition)d | 0.85 ± 0.06 | Not cooperative |
Measured with a constant DCPIP concentration of 70 μM and variable NRH concentrations.
Note that, for a substituted enzyme mechanism, the specificity constant (kcat/Km) does not depend on the concentration of substrates.
Measured with a constant DCPIP concentration of 70 μM, two different NRH concentrations and variable resveratrol concentrations; Ki,app values were estimated from a Dixon plot.
Measured with a constant DCPIP concentration of 70 μM, constant NRH concentration of 50 μM and variable resveratrol concentrations. For NQO2-F47, the data fitted better to Eq. (3) compared to an equation lacking terms to account for cooperativity (F = 6.063, P < 0.01; see Section 2.3). For NQO2-L47, the data fitted better to a non-cooperative equation (F = 1.711; P > 0.2).
3.3. NQO2-F47 and NQO2-L47 have different stabilities towards proteolysis and thermal denaturation
NQO2-L47 was more susceptible to limited proteolysis by chymotrypsin than NQO2-F47 (Fig. 2). Similar results were also seen with trypsin and subtilisin (Supplementary Fig. S4). In TSF experiments, NQO2-L47 showed triphasic melting behaviour with transitions at 47.7 ± 0.3 °C, 57.8 ± 0.1 °C (major peak in the dF/dT plot) and 63.9 ± 0.3 °C. In contrast, NQO2-F47 displayed essentially monophasic behaviour with a single Tm of 63.1 ± 0.1 °C (Fig. 3a). This showed that NQO2-L47 exists in at least three different, metastable conformations in solution and that NQO2-F47 has slightly greater overall stability. (Note, the different peaks cannot arise from protein molecules with and without FAD bound since the assay measures the release of FAD from the protein; therefore, any NQO2 molecules lacking FAD are “invisible” to this assay.)
Fig. 2.
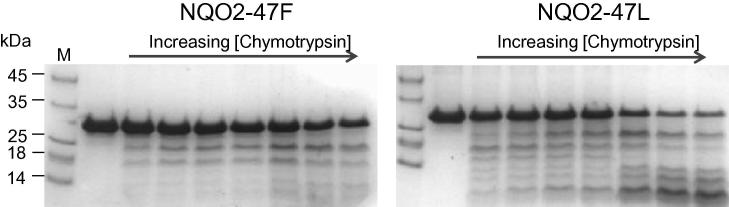
Limited proteolysis of the two common human NQO2 variants (35 μM) with chymotrypsin (0, 10, 35, 60, 90, 360, 630, 900 nM; 30 min at 37 °C) showed a greater effect on NQO2-L47 than NQO2-F47. The sizes of molecular mass markers (lane M) are shown to the left of the gel in kDa.
Fig. 3.

Thermal scanning fluorimetry of human NQO2 variants. (a) First derivative TSF scans for the thermal denaturation of both variants (0.5 μM). (b) Resveratrol, dicoumarol and nicotinamide have concentration-dependent effects on the melting temperature of both variants (0.5 μM).
The significance of the multiple conformers observed in NQO2-L47 is unclear. Nevertheless, it is likely that the three conformers have slightly different properties, for example binding affinity for other proteins. This may be important when considering NQO2’s role as a signalling molecule since this requires interaction with proteins such as p53 [7]. There are precedents for this sort of behaviour. For example, mutations in the calcium sensor, calmodulin, result in altered interactions with the ion which alters the distribution of the protein’s conformational states and thus alters its affinities for protein binding partners [61].
Both variants are stabilised towards thermal denaturation by the addition of resveratrol, nicotinamide and dicoumarol in a concentration dependent manner (Fig. 3b). NQO2-F47 binds less tightly to these three ligands; the KD,app values for resveratrol, nicotinamide and dicoumarol were 1.8 ± 0.1 μM, 14.4 ± 1.1 mM and 33.7 ± 2.6 μM, respectively. For NQO2-L47, these decrease to 0.7 ± 0.1 μM, 3.9 ± 0.2 mM and 15.7 ± 1.5 μM. The value obtained for resveratrol is higher than that obtained in previous studies (31 nM for NQO2-F47 by fluorescence quenching [34]). The concentration dependence of Tm in TSF assays is an indirect measure of the ligand’s affinity and so some variation might be expected. Nevertheless, studies on other proteins have established that the affinity rankings produced by TSF are consistent with those determined by isothermal titration calorimetry, for example [62,63]. As far as we can determine, no values for the affinity of NQO2-L47 for these ligands has been reported previously.
From these data, it is clear the lower activity of NQO2-L47 in cell extracts arises from several causes. A lower kcat/Km makes a minor contribution. However, lower stability which, presumably, leads to reduced cellular concentrations of active enzyme is likely to be a more significant cause. Potentially, the higher affinity of NQO2-L47 for inhibitors could also contribute to its lower cellular activity since resveratrol is a component of the human diet. It is reasonable to assume that the different clinical outcomes associated with these NQO2 variants result from their different cellular activities. If so, then these ultimately result from the biochemical differences (especially protein stability) described here.
Increasing the concentration of ligand also altered the ratio of the fluorescence intensities at the three Tm values observed for NQO2-L47. The ratio of the intensities in the absence of added ligand (in order of increasing Tm) was 0.1:1.0:1.2. In the presence of the highest concentration of resveratrol tested (5.12 μM) this changed to 0.1:1.0:0.4. That this ratio changes in response to ligand provides additional evidence for our hypothesis that there are at least three, interconverting, forms of NQO2-L47. At the same concentration of resveratrol, the thermal denaturation profile of NQO2-F47 remained essentially as one single transition (Supplementary Fig. S5).
Negative cooperativity widens the concentration range over which an enzyme responds to a substrate or inhibitor and requires communication between the active sites [64]. Residues 47’s location close to the dimer interface may be important in the transmission of information between the subunits in NQO2-F47. This communication between active sites requires protein flexibility [65]. Overall, NQO2-L47 is more flexible (based on proteolytic susceptibility and thermal denaturation), yet it is NQO2-F47 which exhibits negative cooperativity towards inhibitors. This suggests that the global flexibility observed in NQO2-L47 is not able to mediate cooperativity and that there must be some local flexibility in NQO2-F47. The lower flavin cofactor occupancy in NQO2-F47 may also contribute to the observed negative cooperativity. The physiological significance of this negative cooperativity is not currently known; similarly, the in vivo consequences of the lack of cooperativity in NQO2-L47 are not yet clear.
3.4. Conclusions
In inherited metabolic diseases, lower enzyme activity resulting from polymorphic forms of the protein is generally associated with the pathological state. Given the association between lower NQO2 activity and reduced cancer risk, the opposite may be true here. In which case, it is likely that resveratrol-mediated inhibition of NQO2 may be partly responsible for the health benefits claimed for this compound. However, the effects are likely to be complex since they will be affected by the multiple conformers of NQO2-L47 and the cooperativity of NQO2-F47.
Acknowledgements
C.F.M. and M.C.C. received PhD studentships from the Department of Employment and Learning Northern Ireland, and the Medical Research Council, respectively. J.R.E.G. received a Summer Vacation Studentship from the Biochemical Society (UK). I.J.S. and K.A.N. were supported via Grants from the MRC (G0500366) and AICR (08-0152).
Appendix A. Supplementary data
Expression and purification of human NQO2 varaints. Both NQO2-F47 and NQO2-L47 were expressed in, and purified from, E. coli as described in the Materials and Methods. The progress of the expression and purification was monitored by 10% SDS–PAGE. M, molecular mass markers (sizes shown to the left of the gel in kDa); Uninduced cells, cell extracts just prior to induction by IPTG; Induced cells, cell extracts 3 h after induction; Cell extract, material extracted from cells by sonication and clarified by centrifugation; Ni2+-flow, material which passed through the column; Ni2+-wash, material removed from the column by washing with wash buffer (50 mM HEPES-OH, pH 7.5, 500 mM sodium chloride, 10% glycerol); Elution, material removed from the column by washing with three 2 ml lots of elution buffer (wash buffer plus 250 mM imidazole). Proteins were then dialysed overnight (against dialysis buffer: 50 mM HEPES-OH, pH 7.5, 150 mM sodium chloride, 1 mM DTT, 10% glycerol) and stored frozen in 50–100 μl aliquots at −80 °C.
Dimerisation of human NQO2 varaints. (a) Both NQO-F47 and NQOL47 (35 μM) can be crosslinked with BS3 (0, 50, 100, 200, 400, 800 μM; 30 min at 37 °C). BS3 was initially dissolved in 5 mM sodium citrate and the assays were performed in dialysis buffer (see Fig. S1). (b) The additions of potential NQO2 ligands did not greatly affect the pattern of crosslinking with BS3 (800 μM). Ligands were initially dissolved in 100% DMSO (resveratrol, curcumin), 0.13 M NaOH (dicoumarol) or 50 mM HEPES-OH, pH 7.5 (nicotinamide). NQO2 (35 μM) was tested alone and then in the presence of the final concentration of solvents used in the assay, i.e. 1% (v/v) DMSO (1.0%) and 1.3 mM NaOH (1.0% v/v of 0.13 M NaOH). Ligands were tested at the following final concentrations: Resveratrol (0.5 μM), Dicoumarol (200 μM), Curcumin (40 μM) and Nicotinamide (160 mM). Similar results were observed with the crosslinker EDC (64 mM; stock solutions dissolved in water) under similar conditions (data not shown).
Inhibition of NQO2 variants by resveratrol. (a) Dixon plots showing the inhibition of NQO2-F47 and NQO2-L47 (2.5 nM) by resveratrol with DCPIP (70 μM) and two different concentrations of NRH (50 and 100 μM). These plots were used to estimate Ki,app. (b) Non-linear fits to Eq. (3) which were used to determine whether, or not, the inhibition was cooperative and, if so, the value of the Hill coefficient (h) – see Section 2.3. The rates of DCPIP (70 μM) reduction by NRH (50 μM) in the presence of a range of concentrations of resveratrol was measured with both variants (2.5 nM). In both (a) and (b), each point represents the mean of three determinations (same enzyme preparation, same diluted stock) and the error bars the standard errors of these means.
Limited proteolysis of human NQO2 variants. (a) Limited proteolysis of the two NQO2 variants (35 μM) with trypsin (0, 10, 35, 60, 90, 360, 630, 900 nM; 30 min at 37 °C) showed a greater effect on NQO2-L47 than NQO2-F47. (b) Limited proteolysis of the two NQO2 variants (35 μM) with subtilisin (0, 10, 35, 60, 90, 360, 630, 900 nM; 30 min at 37 °C) showed a greater effect on NQO2-L47 than NQO2-F47. In both (a) and (b), the sizes of molecular mass markers (lane M) are shown to the left of the gel in kDa.
Thermal scanning fluorimetry of human NQO2 variants in the presence of resveratrol. First derivative TSF scans for the thermal denaturation of both variants (0.5 μM) in the presence of resveratrol (5.12 μM).
References
- 1.Dinkova-Kostova A.T., Talalay P. NAD(P)H:quinone acceptor oxidoreductase 1 (NQO1), a multifunctional antioxidant enzyme and exceptionally versatile cytoprotector. Arch. Biochem. Biophys. 2010;501:116–123. doi: 10.1016/j.abb.2010.03.019. [DOI] [PMC free article] [PubMed] [Google Scholar]
- 2.Vasiliou V., Ross D., Nebert D.W. Update of the NAD(P)H:quinone oxidoreductase (NQO) gene family. Hum. Genomics. 2006;2:329–335. doi: 10.1186/1479-7364-2-5-329. [DOI] [PMC free article] [PubMed] [Google Scholar]
- 3.Gong X., Gutala R., Jaiswal A.K. Quinone oxidoreductases and vitamin K metabolism. Vitam. Horm. 2008;78:85–101. doi: 10.1016/S0083-6729(07)00005-2. [DOI] [PubMed] [Google Scholar]
- 4.Tie J.K., Jin D.Y., Straight D.L., Stafford D.W. Functional study of the vitamin K cycle in mammalian cells. Blood. 2011;117:2967–2974. doi: 10.1182/blood-2010-08-304303. [DOI] [PMC free article] [PubMed] [Google Scholar]
- 5.Traver R.D., Horikoshi T., Danenberg K.D., Stadlbauer T.H., Danenberg P.V., Ross D., Gibson N.W. NAD(P)H:quinone oxidoreductase gene expression in human colon carcinoma cells: characterization of a mutation which modulates DT-diaphorase activity and mitomycin sensitivity. Cancer Res. 1992;52:797–802. [PubMed] [Google Scholar]
- 6.Garate M., Wong R.P., Campos E.I., Wang Y., Li G. NAD(P)H quinone oxidoreductase 1 inhibits the proteasomal degradation of the tumour suppressor p33(ING1b) EMBO Rep. 2008;9:576–581. doi: 10.1038/embor.2008.48. [DOI] [PMC free article] [PubMed] [Google Scholar]
- 7.Gong X., Kole L., Iskander K., Jaiswal A.K. NRH:quinone oxidoreductase 2 and NAD(P)H:quinone oxidoreductase 1 protect tumor suppressor p53 against 20s proteasomal degradation leading to stabilization and activation of p53. Cancer Res. 2007;67:5380–5388. doi: 10.1158/0008-5472.CAN-07-0323. [DOI] [PubMed] [Google Scholar]
- 8.Tsvetkov P., Asher G., Reiss V., Shaul Y., Sachs L., Lotem J. Inhibition of NAD(P)H:quinone oxidoreductase 1 activity and induction of p53 degradation by the natural phenolic compound curcumin. Proc. Natl. Acad. Sci. USA. 2005;102:5535–5540. doi: 10.1073/pnas.0501828102. [DOI] [PMC free article] [PubMed] [Google Scholar]
- 9.Anwar A., Dehn D., Siegel D., Kepa J.K., Tang L.J., Pietenpol J.A., Ross D. Interaction of human NAD(P)H:quinone oxidoreductase 1 (NQO1) with the tumor suppressor protein p53 in cells and cell-free systems. J. Biol. Chem. 2003;278:10368–10373. doi: 10.1074/jbc.M211981200. [DOI] [PubMed] [Google Scholar]
- 10.Asher G., Lotem J., Kama R., Sachs L., Shaul Y. NQO1 stabilizes p53 through a distinct pathway. Proc. Natl. Acad. Sci. USA. 2002;99:3099–3104. doi: 10.1073/pnas.052706799. [DOI] [PMC free article] [PubMed] [Google Scholar]
- 11.Asher G., Lotem J., Cohen B., Sachs L., Shaul Y. Regulation of p53 stability and p53-dependent apoptosis by NADH quinone oxidoreductase 1. Proc. Natl. Acad. Sci. USA. 2001;98:1188–1193. doi: 10.1073/pnas.021558898. [DOI] [PMC free article] [PubMed] [Google Scholar]
- 12.Gustafson D.L., Siegel D., Rastatter J.C., Merz A.L., Parpal J.C., Kepa J.K., Ross D., Long M.E. Kinetics of NAD(P)H:quinone oxidoreductase I (NQO1) inhibition by mitomycin C in vitro and in vivo. J. Pharmacol. Exp. Ther. 2003;305:1079–1086. doi: 10.1124/jpet.103.050070. [DOI] [PubMed] [Google Scholar]
- 13.Mikami K., Naito M., Tomida A., Yamada M., Sirakusa T., Tsuruo T. DT-diaphorase as a critical determinant of sensitivity to mitomycin C in human colon and gastric carcinoma cell lines. Cancer Res. 1996;56:2823–2826. [PubMed] [Google Scholar]
- 14.Nolan K.A., Scott K.A., Barnes J., Doncaster J., Whitehead R.C., Stratford I.J. Pharmacological inhibitors of NAD(P)H quinone oxidoreductase, NQO1: structure/activity relationships and functional activity in tumour cells. Biochem. Pharmacol. 2010;80:977–981. doi: 10.1016/j.bcp.2010.06.024. [DOI] [PubMed] [Google Scholar]
- 15.Reinicke K.E., Bey E.A., Bentle M.S., Pink J.J., Ingalls S.T., Hoppel C.L., Misico R.I., Arzac G.M., Burton G., Bornmann W.G., Sutton D., Gao J., Boothman D.A. Development of β-lapachone prodrugs for therapy against human cancer cells with elevated NAD(P)H:quinone oxidoreductase 1 levels. Clin. Cancer Res. 2005;11:3055–3064. doi: 10.1158/1078-0432.CCR-04-2185. [DOI] [PubMed] [Google Scholar]
- 16.Siegel D., Yan C., Ross D. NAD(P)H:quinone oxidoreductase 1 (NQO1) in the sensitivity and resistance to antitumor quinones. Biochem. Pharmacol. 2012;83:1033–1040. doi: 10.1016/j.bcp.2011.12.017. [DOI] [PMC free article] [PubMed] [Google Scholar]
- 17.Hosoda S., Nakamura W., Hayashi K. Properties and reaction mechanism of DT diaphorase from rat liver. J. Biol. Chem. 1974;249:6416–6423. [PubMed] [Google Scholar]
- 18.Lind C., Cadenas E., Hochstein P., Ernster L. DT-diaphorase: purification, properties, and function. Methods Enzymol. 1990;186:287–301. doi: 10.1016/0076-6879(90)86122-c. [DOI] [PubMed] [Google Scholar]
- 19.Wu K., Knox R., Sun X.Z., Joseph P., Jaiswal A.K., Zhang D., Deng P.S., Chen S. Catalytic properties of NAD(P)H:quinone oxidoreductase-2 (NQO2), a dihydronicotinamide riboside dependent oxidoreductase. Arch. Biochem. Biophys. 1997;347:221–228. doi: 10.1006/abbi.1997.0344. [DOI] [PubMed] [Google Scholar]
- 20.Long D.J., 2nd, Jaiswal A.K. NRH:quinone oxidoreductase2 (NQO2) Chem. Biol. Interact. 2000;129:99–112. doi: 10.1016/s0009-2797(00)00200-3. [DOI] [PubMed] [Google Scholar]
- 21.Knox R.J., Jenkins T.C., Hobbs S.M., Chen S., Melton R.G., Burke P.J. Bioactivation of 5-(aziridin-1-yl)-2,4-dinitrobenzamide (CB 1954) by human NAD(P)H quinone oxidoreductase 2: a novel co-substrate-mediated antitumor prodrug therapy. Cancer Res. 2000;60:4179–4186. [PubMed] [Google Scholar]
- 22.Calamini B., Santarsiero B.D., Boutin J.A., Mesecar A.D. Kinetic, thermodynamic and X-ray structural insights into the interaction of melatonin and analogues with quinone reductase 2. Biochem. J. 2008;413:81–91. doi: 10.1042/BJ20071373. [DOI] [PMC free article] [PubMed] [Google Scholar]
- 23.Mailliet F., Ferry G., Vella F., Berger S., Coge F., Chomarat P., Mallet C., Guenin S.P., Guillaumet G., Viaud-Massuard M.C., Yous S., Delagrange P., Boutin J.A. Characterization of the melatoninergic MT3 binding site on the NRH:quinone oxidoreductase 2 enzyme. Biochem. Pharmacol. 2005;71:74–88. doi: 10.1016/j.bcp.2005.09.030. [DOI] [PubMed] [Google Scholar]
- 24.Fu Y., Buryanovskyy L., Zhang Z. Quinone reductase 2 is a catechol quinone reductase. J. Biol. Chem. 2008;283:23829–23835. doi: 10.1074/jbc.M801371200. [DOI] [PMC free article] [PubMed] [Google Scholar]
- 25.Winger J.A., Hantschel O., Superti-Furga G., Kuriyan J. The structure of the leukemia drug imatinib bound to human quinone reductase 2 (NQO2) BMC Struct. Biol. 2009;9 doi: 10.1186/1472-6807-9-7. 7-6807-9-7. [DOI] [PMC free article] [PubMed] [Google Scholar]
- 26.Middleton M.R., Knox R., Cattell E., Oppermann U., Midgley R., Ali R., Auton T., Agarwal R., Anderson D., Sarker D., Judson I., Osawa T., Spanswick V.J., Davies S., Hartley J.A., Kerr D.J. Quinone oxidoreductase-2-mediated prodrug cancer therapy. Sci. Transl. Med. 2010;2:40ra50. doi: 10.1126/scitranslmed.3000615. [DOI] [PubMed] [Google Scholar]
- 27.Kwiek J.J., Haystead T.A., Rudolph J. Kinetic mechanism of quinone oxidoreductase 2 and its inhibition by the antimalarial quinolines. Biochemistry. 2004;43:4538–4547. doi: 10.1021/bi035923w. [DOI] [PubMed] [Google Scholar]
- 28.Newsome J.J., Colucci M.A., Hassani M., Beall H.D., Moody C.J. Benzimidazole- and benzothiazole-quinones: excellent substrates for NAD(P)H:quinone oxidoreductase 1. Org. Biomol. Chem. 2007;5:3665–3673. doi: 10.1039/b713044a. [DOI] [PubMed] [Google Scholar]
- 29.Miseviciene L., Anusevicius Z., Sarlauskas J., Cenas N. Reduction of nitroaromatic compounds by NAD(P)H:quinone oxidoreductase (NQO1): the role of electron-accepting potency and structural parameters in the substrate specificity. Acta Biochim. Pol. 2006;53:569–576. [PubMed] [Google Scholar]
- 30.Anusevicius Z., Sarlauskas J., Cenas N. Two-electron reduction of quinones by rat liver NAD(P)H:quinone oxidoreductase: quantitative structure-activity relationships. Arch. Biochem. Biophys. 2002;404:254–262. doi: 10.1016/s0003-9861(02)00273-4. [DOI] [PubMed] [Google Scholar]
- 31.Sarlauskas J., Dickancaite E., Nemeikaite A., Anusevicius Z., Nivinskas H., Segura-Aguilar J., Cenas N. Nitrobenzimidazoles as substrates for DT-diaphorase and redox cycling compounds: their enzymatic reactions and cytotoxicity. Arch. Biochem. Biophys. 1997;346:219–229. doi: 10.1006/abbi.1997.0285. [DOI] [PubMed] [Google Scholar]
- 32.Onyenwoke R.U., Wiegel J. Iron (III) reduction: a novel activity of the human NAD(P)H:oxidoreductase. Biochem. Biophys. Res. Commun. 2007;353:389–393. doi: 10.1016/j.bbrc.2006.12.022. [DOI] [PubMed] [Google Scholar]
- 33.Ernster L., Danielson L., Ljunggren M. DT diaphorase. I. Purification from the soluble fraction of rat-liver cytoplasm, and properties. Biochim. Biophys. Acta. 1962;58:171–188. doi: 10.1016/0006-3002(62)90997-6. [DOI] [PubMed] [Google Scholar]
- 34.Buryanovskyy L., Fu Y., Boyd M., Ma Y., Hsieh T.C., Wu J.M., Zhang Z. Crystal structure of quinone reductase 2 in complex with resveratrol. Biochemistry. 2004;43:11417–11426. doi: 10.1021/bi049162o. [DOI] [PMC free article] [PubMed] [Google Scholar]
- 35.Song W., Wang H.J., Bucheli P., Zhang P.F., Wei D.Z., Lu Y.H. Phytochemical profiles of different mulberry (Morus sp.) species from China. J. Agric. Food Chem. 2009;57:9133–9140. doi: 10.1021/jf9022228. [DOI] [PubMed] [Google Scholar]
- 36.Hurst W.J., Glinski J.A., Miller K.B., Apgar J., Davey M.H., Stuart D.A. Survey of the trans-resveratrol and trans-piceid content of cocoa-containing and chocolate products. J. Agric. Food Chem. 2008;56:8374–8378. doi: 10.1021/jf801297w. [DOI] [PubMed] [Google Scholar]
- 37.Wang K.H., Lai Y.H., Chang J.C., Ko T.F., Shyu S.L., Chiou R.Y. Germination of peanut kernels to enhance resveratrol biosynthesis and prepare sprouts as a functional vegetable. J. Agric. Food Chem. 2005;53:242–246. doi: 10.1021/jf048804b. [DOI] [PubMed] [Google Scholar]
- 38.Gu X., Creasy L., Kester A., Zeece M. Capillary electrophoretic determination of resveratrol in wines. J. Agric. Food Chem. 1999;47:3223–3227. doi: 10.1021/jf981211e. [DOI] [PubMed] [Google Scholar]
- 39.Hector K.L., Lagisz M., Nakagawa S. The effect of resveratrol on longevity across species: a meta-analysis. Biol. Lett. 2012;8:790–793. doi: 10.1098/rsbl.2012.0316. [DOI] [PMC free article] [PubMed] [Google Scholar]
- 40.Timmers S., Auwerx J., Schrauwen P. The journey of resveratrol from yeast to human. Aging (Albany NY) 2012;4:146–158. doi: 10.18632/aging.100445. [DOI] [PMC free article] [PubMed] [Google Scholar]
- 41.Fernandez A.F., Fraga M.F. The effects of the dietary polyphenol resveratrol on human healthy aging and lifespan. Epigenetics. 2011;6:870–874. doi: 10.4161/epi.6.7.16499. [DOI] [PubMed] [Google Scholar]
- 42.Foster C.E., Bianchet M.A., Talalay P., Zhao Q., Amzel L.M. Crystal structure of human quinone reductase type 2, a metalloflavoprotein. Biochemistry. 1999;38:9881–9886. doi: 10.1021/bi990799v. [DOI] [PubMed] [Google Scholar]
- 43.Flicek P., Ahmed I., Amode M.R., Barrell D., Beal K., Brent S., Carvalho-Silva D., Clapham P., Coates G., Fairley S., Fitzgerald S., Gil L., Garcia-Giron C., Gordon L., Hourlier T., Hunt S., Juettemann T., Kahari A.K., Keenan S., Komorowska M., Kulesha E., Longden I., Maurel T., McLaren W.M., Muffato M., Nag R., Overduin B., Pignatelli M., Pritchard B., Pritchard E., Riat H.S., Ritchie G.R., Ruffier M., Schuster M., Sheppard D., Sobral D., Taylor K., Thormann A., Trevanion S., White S., Wilder S.P., Aken B.L., Birney E., Cunningham F., Dunham I., Harrow J., Herrero J., Hubbard T.J., Johnson N., Kinsella R., Parker A., Spudich G., Yates A., Zadissa A., Searle S.M. Ensembl 2013. Nucleic Acids Res. 2013;41:D48–D55. doi: 10.1093/nar/gks1236. [DOI] [PMC free article] [PubMed] [Google Scholar]
- 44.Payton A., Miyajima F., Ollier W., Rabbitt P., Pickles A., Weiss V., Pendleton N., Horan M. Investigation of a functional quinine oxidoreductase (NQO2) polymorphism and cognitive decline. Neurobiol. Aging. 2010;31:351–352. doi: 10.1016/j.neurobiolaging.2008.04.014. [DOI] [PubMed] [Google Scholar]
- 45.Hubackova M., Vaclavikova R., Ehrlichova M., Mrhalova M., Kodet R., Kubackova K., Vrana D., Gut I., Soucek P. Association of superoxide dismutases and NAD(P)H quinone oxidoreductases with prognosis of patients with breast carcinomas. Int. J. Cancer. 2012;130:338–348. doi: 10.1002/ijc.26006. [DOI] [PubMed] [Google Scholar]
- 46.Jamieson D., Cresti N., Bray J., Sludden J., Griffin M.J., Hawsawi N.M., Famie E., Mould E.V., Verrill M.W., May F.E., Boddy A.V. Two minor NQO1 and NQO2 alleles predict poor response of breast cancer patients to adjuvant doxorubicin and cyclophosphamide therapy. Pharmacogenet. Genomics. 2011;21:808–819. doi: 10.1097/FPC.0b013e32834b6918. [DOI] [PubMed] [Google Scholar]
- 47.Mohelnikova-Duchonova B., Marsakova L., Vrana D., Holcatova I., Ryska M., Smerhovsky Z., Slamova A., Schejbalova M., Soucek P. Superoxide dismutase and nicotinamide adenine dinucleotide phosphate: quinone oxidoreductase polymorphisms and pancreatic cancer risk. Pancreas. 2011;40:72–78. doi: 10.1097/MPA.0b013e3181f74ad7. [DOI] [PubMed] [Google Scholar]
- 48.Jamieson D., Wilson K., Pridgeon S., Margetts J.P., Edmondson R.J., Leung H.Y., Knox R., Boddy A.V. NAD(P)H:quinone oxidoreductase 1 and NRH:quinone oxidoreductase 2 activity and expression in bladder and ovarian cancer and lower NRH:quinone oxidoreductase 2 activity associated with an NQO2 exon 3 single-nucleotide polymorphism. Clin. Cancer Res. 2007;13:1584–1590. doi: 10.1158/1078-0432.CCR-06-1416. [DOI] [PubMed] [Google Scholar]
- 49.Wang W., Malcolm B.A. Two-stage PCR protocol allowing introduction of multiple mutations, deletions and insertions using QuikChange Site-Directed Mutagenesis. BioTechniques. 1999;26:680–682. doi: 10.2144/99264st03. [DOI] [PubMed] [Google Scholar]
- 50.Megarity C.F., Huang M., Warnock C., Timson D.J. The role of the active site residues in human galactokinase: implications for the mechanisms of GHMP kinases. Bioorg. Chem. 2011;39:120–126. doi: 10.1016/j.bioorg.2011.03.001. [DOI] [PubMed] [Google Scholar]
- 51.Bradford M.M. A rapid and sensitive method for the quantitation of microgram quantities of protein utilizing the principle of protein-dye binding. Anal. Biochem. 1976;72:248–254. doi: 10.1016/0003-2697(76)90527-3. [DOI] [PubMed] [Google Scholar]
- 52.Long D.J., 2nd, Iskander K., Gaikwad A., Arin M., Roop D.R., Knox R., Barrios R., Jaiswal A.K. Disruption of dihydronicotinamide riboside:quinone oxidoreductase 2 (NQO2) leads to myeloid hyperplasia of bone marrow and decreased sensitivity to menadione toxicity. J. Biol. Chem. 2002;277:46131–46139. doi: 10.1074/jbc.M208675200. [DOI] [PubMed] [Google Scholar]
- 53.McCorvie T.J., Gleason T.J., Fridovich-Keil J.L., Timson D.J. Misfolding of galactose 1-phosphate uridylyltransferase can result in type I galactosemia. Biochim. Biophys. Acta. 2013;1832:1279–1293. doi: 10.1016/j.bbadis.2013.04.004. [DOI] [PMC free article] [PubMed] [Google Scholar]
- 54.Schagger H. Tricine-SDS–PAGE. Nat. Protoc. 2006;1:16–22. doi: 10.1038/nprot.2006.4. [DOI] [PubMed] [Google Scholar]
- 55.Gasteiger E., Hoogland C., Gattiker A., Duvaud S., Wilkins M.R., Appel R.D., Bairoch A. Protein identification and analysis tools on the ExPASy server. In: Walker J.M., editor. The Proteomics Protocols Handbook. Humana Press; New York, USA: 2005. pp. 571–607. [Google Scholar]
- 56.Leung K.K., Litchfield D.W., Shilton B.H. Flavin adenine dinucleotide content of quinone reductase 2: analysis and optimization for structure-function studies. Anal. Biochem. 2012;420:84–89. doi: 10.1016/j.ab.2011.09.011. [DOI] [PubMed] [Google Scholar]
- 57.Forneris F., Orru R., Bonivento D., Chiarelli L.R., Mattevi A. ThermoFAD, a Thermofluor-adapted flavin ad hoc detection system for protein folding and ligand binding. FEBS J. 2009;276:2833–2840. doi: 10.1111/j.1742-4658.2009.07006.x. [DOI] [PubMed] [Google Scholar]
- 58.Aliverti A., Curti B., Vanoni M.A. Identifying and quantitating FAD and FMN in simple and in iron–sulfur-containing flavoproteins. Methods Mol. Biol. 1999;131:9–23. doi: 10.1385/1-59259-266-X:9. [DOI] [PubMed] [Google Scholar]
- 59.Dawson R.M.C., Elliott D.C., Elliott W.H., Jones K.M. Oxford University Press; Oxford, UK: 1969. Data for Biochemical Research. [Google Scholar]
- 60.Rase B., Bartfai T., Ernster L. Purification of DT-diaphorase by affinity chromatography. Occurrence of two subunits and nonlinear Dixon and Scatchard plots of the inhibition by anticoagulants. Arch. Biochem. Biophys. 1976;172:380–386. doi: 10.1016/0003-9861(76)90089-8. [DOI] [PubMed] [Google Scholar]
- 61.Nyegaard M., Overgaard M.T., Sondergaard M.T., Vranas M., Behr E.R., Hildebrandt L.L., Lund J., Hedley P.L., Camm A.J., Wettrell G., Fosdal I., Christiansen M., Borglum A.D. Mutations in calmodulin cause ventricular tachycardia and sudden cardiac death. Am. J. Hum. Genet. 2012;91:703–712. doi: 10.1016/j.ajhg.2012.08.015. [DOI] [PMC free article] [PubMed] [Google Scholar]
- 62.Matulis D., Kranz J.K., Salemme F.R., Todd M.J. Thermodynamic stability of carbonic anhydrase: measurements of binding affinity and stoichiometry using ThermoFluor. Biochemistry. 2005;44:5258–5266. doi: 10.1021/bi048135v. [DOI] [PubMed] [Google Scholar]
- 63.Lo M.C., Aulabaugh A., Jin G., Cowling R., Bard J., Malamas M., Ellestad G. Evaluation of fluorescence-based thermal shift assays for hit identification in drug discovery. Anal. Biochem. 2004;332:153–159. doi: 10.1016/j.ab.2004.04.031. [DOI] [PubMed] [Google Scholar]
- 64.Ferrell J.E., Jr. Q&A: Cooperativity. J. Biol. 2009;8:53. doi: 10.1186/jbiol157. [DOI] [PMC free article] [PubMed] [Google Scholar]
- 65.Goodey N.M., Benkovic S.J. Allosteric regulation and catalysis emerge via a common route. Nat. Chem. Biol. 2008;4:474–482. doi: 10.1038/nchembio.98. [DOI] [PubMed] [Google Scholar]
Associated Data
This section collects any data citations, data availability statements, or supplementary materials included in this article.
Supplementary Materials
Expression and purification of human NQO2 varaints. Both NQO2-F47 and NQO2-L47 were expressed in, and purified from, E. coli as described in the Materials and Methods. The progress of the expression and purification was monitored by 10% SDS–PAGE. M, molecular mass markers (sizes shown to the left of the gel in kDa); Uninduced cells, cell extracts just prior to induction by IPTG; Induced cells, cell extracts 3 h after induction; Cell extract, material extracted from cells by sonication and clarified by centrifugation; Ni2+-flow, material which passed through the column; Ni2+-wash, material removed from the column by washing with wash buffer (50 mM HEPES-OH, pH 7.5, 500 mM sodium chloride, 10% glycerol); Elution, material removed from the column by washing with three 2 ml lots of elution buffer (wash buffer plus 250 mM imidazole). Proteins were then dialysed overnight (against dialysis buffer: 50 mM HEPES-OH, pH 7.5, 150 mM sodium chloride, 1 mM DTT, 10% glycerol) and stored frozen in 50–100 μl aliquots at −80 °C.
Dimerisation of human NQO2 varaints. (a) Both NQO-F47 and NQOL47 (35 μM) can be crosslinked with BS3 (0, 50, 100, 200, 400, 800 μM; 30 min at 37 °C). BS3 was initially dissolved in 5 mM sodium citrate and the assays were performed in dialysis buffer (see Fig. S1). (b) The additions of potential NQO2 ligands did not greatly affect the pattern of crosslinking with BS3 (800 μM). Ligands were initially dissolved in 100% DMSO (resveratrol, curcumin), 0.13 M NaOH (dicoumarol) or 50 mM HEPES-OH, pH 7.5 (nicotinamide). NQO2 (35 μM) was tested alone and then in the presence of the final concentration of solvents used in the assay, i.e. 1% (v/v) DMSO (1.0%) and 1.3 mM NaOH (1.0% v/v of 0.13 M NaOH). Ligands were tested at the following final concentrations: Resveratrol (0.5 μM), Dicoumarol (200 μM), Curcumin (40 μM) and Nicotinamide (160 mM). Similar results were observed with the crosslinker EDC (64 mM; stock solutions dissolved in water) under similar conditions (data not shown).
Inhibition of NQO2 variants by resveratrol. (a) Dixon plots showing the inhibition of NQO2-F47 and NQO2-L47 (2.5 nM) by resveratrol with DCPIP (70 μM) and two different concentrations of NRH (50 and 100 μM). These plots were used to estimate Ki,app. (b) Non-linear fits to Eq. (3) which were used to determine whether, or not, the inhibition was cooperative and, if so, the value of the Hill coefficient (h) – see Section 2.3. The rates of DCPIP (70 μM) reduction by NRH (50 μM) in the presence of a range of concentrations of resveratrol was measured with both variants (2.5 nM). In both (a) and (b), each point represents the mean of three determinations (same enzyme preparation, same diluted stock) and the error bars the standard errors of these means.
Limited proteolysis of human NQO2 variants. (a) Limited proteolysis of the two NQO2 variants (35 μM) with trypsin (0, 10, 35, 60, 90, 360, 630, 900 nM; 30 min at 37 °C) showed a greater effect on NQO2-L47 than NQO2-F47. (b) Limited proteolysis of the two NQO2 variants (35 μM) with subtilisin (0, 10, 35, 60, 90, 360, 630, 900 nM; 30 min at 37 °C) showed a greater effect on NQO2-L47 than NQO2-F47. In both (a) and (b), the sizes of molecular mass markers (lane M) are shown to the left of the gel in kDa.
Thermal scanning fluorimetry of human NQO2 variants in the presence of resveratrol. First derivative TSF scans for the thermal denaturation of both variants (0.5 μM) in the presence of resveratrol (5.12 μM).