

Background: RUNX2 is indispensable for mature osteoblast differentiation and function.
Results: During osteogenic differentiation, RUNX2 along with C/EBPβ bind throughout the genome near genes that are essential for the phenotype.
Conclusion: Differentiation leads to a restricted RUNX2 cistrome that correlates with changes in gene expression.
Significance: Broad genomic localization of RUNX2 during osteoblastogenesis highlights its role as a dynamic lineage-determining factor.
Keywords: CCAAT-enhancer-binding Protein (C/EBP), Cell Differentiation, Chromatin Histone Modification, Chromatin Immunoprecipitation (ChiP), Osteoblast, ChIP-seq, Cistrome, RUNX2
Abstract
RUNX2 is a transcription factor that is first expressed in early osteoblast-lineage cells and represents a primary determinant of osteoblastogenesis. While numerous target genes are regulated by RUNX2, little is known of sites on the genome occupied by RUNX2 or of the gene networks that are controlled by these sites. To explore this, we conducted a genome-wide analysis of the RUNX2 cistrome in both pre-osteoblastic MC3T3-E1 cells (POB) and their mature osteoblast progeny (OB), characterized the two cistromes and assessed their relationship to changes in gene expression. We found that although RUNX2 was widely bound to the genome in POB cells, this binding profile was reduced upon differentiation to OBs. Numerous sites were lost upon differentiation, new sites were also gained; many sites remained common to both cell states. Additional features were identified as well including location relative to potential target genes, abundance with respect to single genes, the frequent presence of a consensus TGTGGT RUNX2 binding motif, co-occupancy by C/EBPβ and the presence of a typical epigenetic histone enhancer signature. This signature was changed quantitatively following differentiation. While RUNX2 binding sites were associated extensively with adjacent genes, the distal nature of the majority of these sites prevented assessment of whether they represented direct targets of RUNX2 action. Changes in gene expression, however, revealed an abundance of genes that contained RUNX2 binding sites and were regulated in concert. These studies establish a basis for further analysis of the role of RUNX2 activity and its function during osteoblast lineage maturation.
Introduction
Mature osteoblasts are derived from mesenchymal progenitors via a set of distinct cellular intermediates that include the pre-osteoblast; their primary function in the vertebrate skeleton is to form bone (1, 2). Importantly, a subset of these differentiated cells undergoes a further developmental transition to become osteocytes, abundant, highly specialized skeletal cells that are embedded in mineralized bone and essential for both adult bone remodeling and skeletal endocrine function (3). As with most programs of differentiation, this complex cellular progression from the mesenchymal stem cell (MSC)2 is driven by unique spatial and temporal changes in gene expression. This process is dynamically programmed at the level of the genome via both genetic and epigenetic determinants, and initiated via activation of distinct signaling pathways (2, 4–7). Transduction via these pathways triggers the regulation of unique sets of transcription factors that act within the nucleus to orchestrate individual bone cell phenotypes (2, 4, 8, 9). In the case of osteoblast-lineage cells, these factors include the sequentially expressed lineage determining regulators SOX9, RUNX2, and OSTERIX (OSX/SP7).
SOX9 is expressed early in MSC-derived osteochondroprogenitors where its continued expression plays a distinctive role in chondrocyte differentiation (2, 10, 11). RUNX2, on the other hand, is up-regulated by SOX9 in these bi-potential progenitor cells to become the master regulator of osteoblastogenesis (12–14). Interestingly, while RUNX2 is silenced early in committed chondrocyte precursors, its re-expression together with the induction of RUNX3 in late chondrocytes is necessary for final hypertrophic chondrocyte differentiation (5). OSX, a key terminal osteoblast differentiation factor, is induced in turn by RUNX2 in more fully committed osteoprogenitors, drives final differentiation of these cells into mature osteoblasts (15, 16) and may also play a role in osteocyte maturation and function. RUNX2 is involved in a number of diverse cellular processes, including control of osteoblast progenitor cell growth and differentiation (17–19). Indeed, as noted in genetically deleted RUNX2-null mice, loss of expression of this lineage regulator results in a major deficit in osteoblast lineage cells, reduced numbers of hypertrophic chondrocytes, and an inability to form bone (20–22). Interestingly, loss of a single RUNX2 allele in mice results in hypoplastic clavicles and delayed closure of the fontanelles, and in cleidocranial dysplasia in humans (14, 23). It is also apparent that in addition to SOX9, RUNX2, and OSX, osteoblast differentiation and function are also regulated by the temporal and overlapping expression of a myriad of additional transcription factors that include MSX2, TWIST1, SATB2, NFATc1, ATF4, STAT1, C/EBP isoforms, and multiple nuclear receptors as well (2). Many of these factors interact directly with RUNX2 and/or OSX either to facilitate or suppress transcription factor events that are important to osteoblast differentiation and/or function. Nevertheless, while many of the players are known, the overall temporal activities of each and their interactions with each other are not well understood.
RUNX2 represents one of three members of the RUNT domain family of transcription factors (RUNX-1, -2, and -3) that play central roles in cell fate determination, directing hematopoiesis, skeletogenesis and neurogenesis among others (17). Interestingly, RUNX1 also plays a role in osteoclast formation (24). Aberrant expression of these proteins can also lead to a variety of cancers (25, 26). RUNX2 is targeted to the nucleus via a C-terminal domain (27, 28). RUNX family members are also DNA-binding proteins that interact directly via a common CBFβ heterodimer partner (17). The heterodimer's activities at target gene loci are controlled, however, via diverse mechanisms that modulate both RUNX2 abundance and its ability to bind to DNA and that mediate extensive post-translational modifications that include phosphorylation, acetylation, and ubiquitinylation (29, 30). These modifications influence RUNX2 turnover, coregulator recruitment and relative transcriptional competence. This complexity in regulation highlights the relevance of the direct interactions that occur between RUNX2 and the many additional classes of factors that include cellular kinases, DNA-binding (C/EBPβ, SMADS, β-catenin) and non DNA-binding (HDACs) transcription factors, and regulatory factors that control chromatin structure and function as well. Temporal control of RUNX2 activity ensures the timely expression of gene networks that orchestrate bone cell development and function.
A number of genes are known to be directly regulated by RUNX2 (2). These targets include osteocalcin (Bglap2), osteopontin (Spp1), Fgf18, Rankl, Vdr, and Runx2 itself. The typical DNA response sequence located at these gene loci that acts in cis is comprised of 5′-T/A/C G T/A/C GG T/G-3′ (31) and in a gene-specific context functions both to induce or suppress the expression of genes. A clear understanding of the network of genes that are directly regulated by RUNX2 has not been delineated however, due primarily to this factor's diverse biological role in osteoblast lineage cells as well as its complex regulation. A recent ChIP-chip analysis which coupled the binding of RUNX2 at a genome-wide collection of promoter regions in osteosarcoma cells to gene expression has defined a number of potential genetic sites of action of RUNX2 (32). In addition, an unbiased genome-wide ChIP-seq analysis using RUNX2-negative prostate cells engineered to express RUNX2 in a doxycycline-conditional manner suggests a limited RUNX2 cistrome that is enriched for the cognate RUNX2 binding site motif (33). Despite these studies, an in-depth analysis of the RUNX2 cistrome in osteoblast lineage cells has not been described.
In the current study, we used the mouse pre-osteoblastic cell line MC3T3-E1 (POB) and it's in vitro differentiated osteoblast progeny (OB) to investigate the properties of the RUNX2 cistrome in osteoblast lineage cells and to explore the relationship between RUNX2 binding and gene expression. We show through ChIP-seq analysis that while the RUNX2 cistrome is extensive in POBs, it undergoes significant restriction upon differentiation to OBs. Many of the sites identified confirm those found in previous studies through single site analyses. Interestingly, C/EBPβ was found to be a frequent genome-wide co-occupant at many sites of RUNX2 binding. Sites occupied by either RUNX2 or C/EBPβ or both exhibited enriched levels of methylated histone H3K4 (H3K4me1) and acetylated histones H3 and H4, known epigenetic signatures that highlight authentic enhancers. Finally, we show that components of the RUNX2 cistromes correlate directly with both genes whose expression levels are unchanged as well as genes whose expression were altered during in vitro differentiation. Changes in RUNX2 binding are noted at genes whose activities are both increased and decreased during the process of differentiation.
EXPERIMENTAL PROCEDURES
Reagents
ChIP antibodies to C/EBPβ (C-19, sc-150, lot F3011) and RUNX2 (M-70, sc-10758, lot D1411) were purchased from Santa Cruz Biotechnology, Inc. (Santa Cruz, CA). Antibodies to H4K5Ac (07-327, lot DAM1794310) and H3K9Ac (06-942, lot 31636) were purchased from Millipore (Billerica, MA). Antibodies for H3K4me1 (ab8895, lot GR43807-1), H3K4me3 (ab1012, lot GR10853-1) and H3K36me3 (ab9050, lot GR52625-1) were purchased from Abcam (Cambridge, MA). All quantitative real-time PCR (qPCR) reagents (Fast Start SYBR Green Master Mix (w/rox)) were obtained from Roche (Indianapolis, IN) and Taqman gene expression assays were obtained from Invitrogen (Applied Biosystems (ABI) Foster City, CA). All qPCR was conducted on a StepOnePlus instrument from ABI. Primers were obtained from IDT (Coralville, IA). All Primers and Taqman Expression Assays are listed in supplemental Table S1.
Cell Culture and Differentiation
Mouse MC3T3-E1 cells (early passage line from Sudo, H. et al. (34)) were cultured in minimum Eagle's medium alpha modification supplemented with 10% heat-inactivated fetal bovine serum from Hyclone (Logan, UT) and 1% penicillin-streptomycin from Invitrogen to obtain POBs. Cells were grown to confluency and then changed into differentiation media (10 mm β-glycerophosphate and 50 μg/ml ascorbic acid) and cultured for an additional 15 days, replenishing the media every 2–3 days, to prepare OBs. At the conclusion of differentiation, cells were stained with Alizarin Red and Von Kossa for mineral deposition and bone nodule formation as well as alkaline phosphatase (ALP) and an ALP enzymatic activity assay. For Alizarin Red staining, the cells were washed in PBS, fixed with 10% formaldehyde solution for 20 min at room temp, stained with Alizarin Red solution for 20 min (Alizarin Red S (Sigma-Aldrich) in ddH2O, pH 4.2), rinsed with tap water and dried. For Von Kossa staining, cells were washed with PBS, 5% silver nitrate solution was added for 30 min at room temp, rinsed with ddH2O, exposed to carbonate-formaldehyde solution for 5 min, rinsed with tap water and dried. For ALP staining, cells were washed in PBS, then stained with Alkaline Phosphatase kit (Sigma, 86R-1KT) according to manufacturer's protocol. For ALP enzymatic activity assay, cells were washed in PBS twice, lysed for 30 min shaking at room temperature in Lysis Buffer (20 mm Tris, 0.5 mm MgCl2, 0.1 mm ZnCl2, 0.1% Triton X-100), scraped from plates and transferred to microfuge tubes for assay or storage at −80 °C. The activity assay was performed according to the Alkaline Phosphatase Kit (Sigma 104-100). Samples were compared against a standard curve of diluted p-nitrophenol solution (Sigma N7660) in 0.02 N NaOH. Activity is expressed as International Units (IU) per liter (L), normalized to total lysate protein as assayed by Bradford. A Student's t test was completed for statistical significance compared with D0 (POB).
Gene Expression Analysis
POBs or OBs were first prepared from MC3T3-E1 cells as described above. RNA was isolated using the TRI-Reagent protocol (MRC, Cincinnati, OH) and amplification methods according Roche NimbleGen protocols. Briefly, 10 μg of total RNA was DNase treated and reverse transcribed with the Superscript double stranded cDNA synthesis system (Invitrogen, Carlsbad, CA). Double stranded cDNA (dscDNA) was verified for integrity by an Agilent 2100 Bioanalyzer and qPCR analysis. dscDNA was then labeled with Cy3 as described by Roche NimbleGen. Labeled samples were hybridized to mouse (mm8) 385k microarrays (Roche NimbleGen) in triplicate. Extracted data were processed with the Arraystar 5 package from DNASTAR (Madison, WI) using a moderated t test and multiple testing correction, FDR (Benjimini-Hochberg). All data passing 95% confidence limits greater than 2-fold were included in up- or down-regulated data analysis. Data are displayed as log2 values (log2) as well as fold change values in supplemental Table S1. For all other qRT-PCR and validation, cells were differentiated for 15 or 30 days, 1 μg of isolated total RNA was DNase treated, reverse transcribed using the High Capacity cDNA Kit (ABI, Foster City, CA), and then diluted to 100 μl with RNase/DNase free water. qPCR was performed using primers specific to a select set of differentially expressed genes by Taqman analyses available in supplemental Table S1.
Western Blot
Cells were differentiated in 10 cm plates for 0 (POB) or 15 (OB) days as described above. Cells were collected in PBS, centrifuged for 4 min at 4k rpm (4 °C). Pellet is dissolved in buffer A (10 mm Hepes-KOH pH 7.8, 10 mm KCl, 0.1 mm EDTA, 5 mm MgCl2, 0.1% Nonidet P-40, 1 mm DTT, and 0.5 mm PMSF) and incubated on ice for 10 min. The differentiated samples contained substantial mineralized matrix and were subjected to 3 × 15s pulses with a Polytron Homogenizer (Power Gen 125, Fisher Scientific). The resulting homogenate was centrifuged (200 × g) through a 10% sucrose buffer at a 1:1 ratio (10 mm Tris-HCl, 15 mm NaCl, 60 mm KCl, 1 mm EDTA, 10% sucrose). The pelleted nuclei were resuspended in 100 μl of 1× Laemmli buffer (Bio-Rad) and sonicated with a microtip sonic dismembrantor (Fisher) 3 × 10 s pulses. 15 μl of sample was heated to 95 °C for 5 min and loaded for POB and OB samples on TRIS-glycine 4–20% gels (Invitrogen). Blots were transferred to PVDF membrane and blocked with 5% milk in PBS with 1% Tween-20 (PBST) overnight at 4 °C. Primary antibodies for RUNX2 (D130-3, MBL International, 1:1,000) or LaminB1 (ab16048, Abcam, 1:1,000) were applied in 1% milk PBST at room temperature for 1 h. Blots were washed 3 × 15 min with PBST. Secondary antibodies were goat α-mouse IgG2b-HRP (Santa Cruz, 1:10,000) and goat α–rabbit IgG-HRP (Santa Cruz, 1:5,000) in 1% milk PBST at room temperature for 1 h. PVDF membrane was stripped 3× (50 mm glycine pH 2.5, 1% SDS) at room temperature and washed 3× with PBST prior to LaminB1 Western analysis. Detection was completed with SuperSignal West Dura Extended Duration Substrate (Thermo Scientific) on an ImageQuant LAS-4000 (GE Healthcare). Densitometry was completed with ImageJ software.
Chromatin Immunoprecipitation (ChIP) followed by Sequencing (ChIP-seq)
Chromatin immunoprecipitation was performed as described previously (35). Antibodies are listed in Reagents above. Briefly, samples were subjected to immunoprecipitation using either a control IgG antibody or the indicated experimental antibody (VDR, RXR, C/EBPβ, RUNX2, H3K5Ac, H3K9Ac, H3K4me1, H3K4me3, or H3K36me3). For differentiated cells, there was substantial mineralized matrix. To remove the matrix from the assay, the cell/matrix mix was subjected to 3 × 15s pulses with a Polytron Homogenizer (Power Gen 125, Fisher Scientific) while in NCP 1 buffer (10 mm Hepes, pH 6.5, 10 mm EDTA, 0.5 mm EGTA, 0.25% Triton X-100). The resulting homogenate was centrifuged (200 × g) through a 10% sucrose buffer at a 1:1 ratio (10 mm Tris-HCl, 15 mm NaCl, 60 mm KCl, 1 mm EDTA, 10% sucrose). The resulting cell pellet was re-suspended in NCP 2 buffer (10 mm Hepes, pH 6.5, 1 mm EDTA, 0.5 mm EGTA, 200 mm NaCl) and the remainder of the protocol was followed (35). The isolated DNA (or Input DNA acquired prior to precipitation) was then validated by quantitative real time PCR (qPCR) and further prepared for ChIP-seq analysis. ChIP-seq libraries were prepared using the NEBNext DNA sample prep kit (NEB, E6000L) with the Bioo NEXTflex ChIP-seq Barcodes (Bioo Scientific, Austin, TX, 514122) according to manufacturer's protocols. During the NEBNext prep, the Illumina adapters were replaced with the Bioo Scientific Barcoded adapters according to Bioo protocols. ChIP-DNA ligated libraries were purified with Agencourt AMPureXP Magnetic Beads (Beckman-Coulter, A63881). A pre-size selection PCR procedure was performed using Phusion polymerase, NEXTflex Primer Mix, and purified ligation product for 4 PCR cycles according to the Bioo Protocol. Libraries were size-selected using Invitrogen E-gels to 400–500 bp. Samples were then amplified by PCR for 14 cycles using Phusion polymerase, NEXTflex Primer mix and the size-selected DNA as per the Bioo protocol, followed by an Agencourt bead clean up. Libraries were validated for integrity using the Agilent Bioanalyzer 2100 (Agilent Technologies, Santa Clara, CA). Clusters were formed and sequenced on the Illumina HiSeq2000 sequencers by the University of Wisconsin, Madison DNA Sequencing Facility in the University of Wisconsin, Madison Biotechnology Center. DNA clusters were generated using a cBot Single Read Cluster Generation kit (ver. 3) on an Illumina cBot (Illumina) according to the manufacturer's instructions to obtain an average of 1.5 × 10⁸ clusters for each flowcell lane. All 50mer sequencing runs were performed on an Illumina HiSeq2000 using the Illumina Sequencing kit (ver. 3). Fluorescent images were analyzed using the CASAVA 1.8.2 (Illumina) to obtain FASTQ formatted sequence data. ChIP-seq samples were analyzed and prepared according to the ENCODE consortia best practices guidelines (36). Twelve barcoded libraries were run simultaneously per lane over 4 lanes. The raw FASTQ for each sample was concatenated from the 4 lanes prior to mapping to create a single sample. Each ChIP sample was repeated in biological replicate (Pearson Correlation Coefficient, PCC > 0.85) in the same manner (minimum of 2 replicates). Sequences were mapped to the mouse genome (mm9) using BOWTIE (best -m 1) to yield unique alignments (37). All sequencing tag statistics (total and mapped reads) are listed in supplemental Table S1.
Bioinformatic and Statistical Analyses
Samples were further processed by QuEST and HOMER. Peaks were accepted if they passed criteria for both methods. QuEST 2.4 was run using the recommend settings for transcription factor (TF) like binding with the following exceptions: kde_bandwith = 30, region_size = 600, ChIP threshold = 35, enrichment fold = 3, rescue fold = 3 (38). HOMER analysis was applied using the default settings for peak finding (39). A False Discovery Rate (FDR) cut off of 0.001 (0.1%) was used for all peaks. The tag density for each factor was normalized to 107 tags and displayed using the UCSC genome browser. Positive peak regions were interrogated further using Homer as well as the Genomatix Software Suite (40). Motif analysis (de novo and known) was performed using the HOMER software and Genomatix. Peak overlaps were processed with HOMER and Galaxy (41). Peak comparisons between replicates and between differentiation time points were processed with the EdgeR and DESeq statistical packages in R where p values were drawn from the tag densities under each peak (42–44). Samples were further sorted by p value and FDR. All data are deposited in the Gene Expression Omnibus (GSE41955).
RESULTS
RUNX2 Cistrome Analysis in POBs and in Vitro Differentiated OBs
The MC3T3-E1 cells (POBs) used in this study were initially validated for osteoblast differentiation following a 15 day treatment with ascorbic acid and β-glycerophosphate (OBs) using Von Kossa and Alizarin Red staining procedures that verify appropriate differentiation, matrix secretion, nodule formation, and calcification indicative of mature osteoblasts. Cells were also examined for the presence of alkaline phosphatase and alkaline phosphatase enzymatic activity as well. As can be seen in Fig. 1, each of these assays confirms that this cell line undergoes osteoblast differentiation in response to these typical osteogenic-inducing agents. To explore the RUNX2 cistrome in these osteoblast-lineage cells, we then conducted a quantitative genome-wide comparison of RUNX2 binding sites in POBs and day 15 OBs. Accordingly, confluent POBs or differentiated OBs were subjected to replicate ChIP-seq analysis as described under “Experimental Procedures” using an antibody for RUNX2. The normalized list of genomic binding sites (derived by multiple methods, FDR < 0.001) for RUNX2 in both POB and OB cells were then used for all downstream bioinformatic analysis. As seen in Fig. 2A, 12,674 high confidence RUNX2 binding sites were observed throughout the POB genome. A more restricted 6,272 sites were observed in OBs, suggesting a striking reduction in the RUNX2 cistrome following differentiation. As 4,601 of these sites were found to overlap the RUNX2 cistrome in undifferentiated POBs, 8,058 and 1,641 sites appear to be unique to POBs and OBs, respectively. Interestingly, while Fig. 2a documents the loss of a large number of unique RUNX2 sites in POBs (8,058) and the appearance of a smaller number in OBs (1,641), absolute levels of RUNX2 binding based exclusively upon tag density changes (p < 0.05) at many of the observed sites were also variable as well (Fig. 2B). This latter assay does not take into account a statistical cut off alone, but rather the read densities as well. Thus, although the level of RUNX2 binding remained statistically unchanged at 7,875 sites, relative levels of RUNX2 were statistically higher (2-fold or greater, p < 0.05) at 5,380 sites in POBs than OBs and 1,045 sites in OBs than POBs. Thus, both absolute as well as relative changes in RUNX2 binding were observed by ChIP-seq analysis. The reduction in the RUNX2 cistrome is likely due to differentiation, as Western blot analyses, as documented in Fig. 2C suggest that the overall levels of RUNX2 protein expression following differentiation are maintained if not slightly elevated (changes not significant).
FIGURE 1.
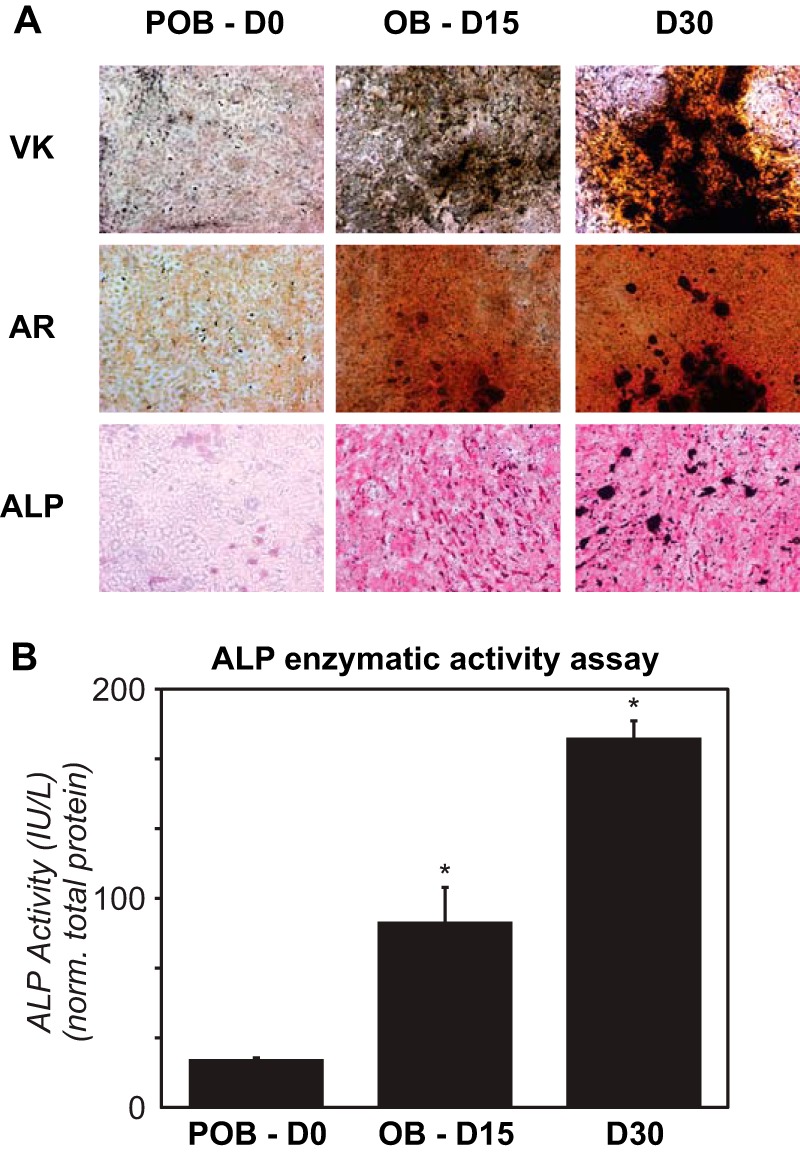
MC3T3-E1 cells (POB) undergo differentiation to matrix secreting osteoblast cells (OB). A, cells were differentiated to day 15 (OB) and further to day 30. Von Kossa (VK), Alizarin Red (AR), and alkaline phosphatase (ALP) staining were performed. B, an enzymatic assay was also performed to assess the activity of the alkaline phosphatase during differentiation. ALP activity is displayed as international units (IU) per liter (L), which has been normalized to total lysate protein. Experiment was completed in triplicate ± S.E. and is representative of two experiments. *, p < 0.05 D15 (OB) or D30 compared with D0 (POB).
FIGURE 2.

Analysis of the RUNX2 cistromes in osteoblast-lineage cells. A, Venn diagram depiction of replicate normalized RUNX2 binding sites assessed using HOMER in undifferentiated (POB) and in vitro differentiated (OB) MC3T3-E1 cells. Arrows link the RUNX2 binding site subsets (POB specific, OB specific, and POB/OB overlap) to annotated neighboring genes using GREAT. B, statistical enrichment of RUNX2 ChIP-seq tag density. Peaks were divided into POB >2-fold (POB >, yellow), equivalent (not statistically different, Equal/ns) and OB >2-fold (OB >, blue) then correlated to genes using GREAT nearest neighbor analysis. Overlapping regions appear as green. C, Western blot of RUNX2 levels from nuclear extracts of POB and OB cells in triplicate. Densitometry displays band intensities normalized to LaminB levels ± S.E. POB versus OB is not significant. D, GREAT analysis of RUNX2 sites as a function of distance from TSS in kilobases (kb) for both POB and OB. E, de novo sequence over-representation analysis of RUNX2 peaks by HOMER in POBs and OBs. Abundance shown as percentage (black) compared with 50,000 GC content matched sequences (red). F, top 4 scoring Gene Ontology (GO) terms are presented for Molecular Function (MF), Biologic Process (BP), or Cellular Component (CC) for each peak category for the RUNX2 peaks listed at the top of the table. G, ChIP-seq tag density tracks for example genes identified in Gene Ontology enrichment for RUNX2 ChIP-seq binding (POB, yellow; OB, blue; overlap, green). Genomic location and scale are indicated, maximum height of tag sequence density for the data track is indicated on Y-axis (normalized to input and 107 tags). Gene transcriptional direction is indicated by an arrow and exons by boxes. H, ChIP-seq peak validation by ChIP qPCR. ChIP values are shown normalized to Input (Quantity/Input). RUNX2 (black bars) are compared with nonspecific IgG (gray bars). *, p < 0.05 RUNX2 compared with IgG. POB are also compared with OB within each primer set. #, p < 0.05 RUNX2 POB compared with RUNX2 OB. Primers were used for peaks surrounding the Spp1 and Fgf18 genomic locus. Distance is relative to the TSS for each gene. Each experiment was repeated in triplicate ± S.E. and is representative of three experiments.
The RUNX2 cistromes in these two differentiation states also exhibited a number of common features as well. As seen in Fig. 2D, an analysis of their location across the genome, as correlated by GREAT (Genomic Regions Enrichment of Annotations Tool) association of genomic regions to nearby genes (45), revealed that while RUNX2 binding sites were indeed located near annotated gene promoters (∼18% within 5kb of TSS), they were preferentially found distal to gene promoters within both introns and intergenic regions. To further characterize sites of genomic RUNX2 binding in the two cell types, we next performed a de novo motif finding analysis for over represented binding sites present in these data sets. As can be seen in Fig. 2E, a classic RUNX2/AML/RUNX1 binding motif was found in these regions 61% of the time (compared with 10% in 50,000 GC matched background regions). Importantly, many of these RUNX2-bound sites contained multiple motifs for RUNX2, suggesting the possibility that the overall level of RUNX2 mass at many sites was influenced by the absolute number of RUNX2 binding motifs within the peak. Interestingly, potential motifs for other transcription factors including TEAD, IRF4, C/EBP isoforms, and AP1 were also observed (subset shown in Fig. 2E). Finally, Nearest Neighbor Analysis (NNA) (using GREAT) revealed a distance-dependent relationship between each site and the nearest annotated gene(s), which suggests that the average number of RUNX2 binding sites per associated gene is greater than one (data not shown). Critically, however, this metric is not definitive for the existence of a specific regulatory relationship between sites of RUNX2 binding and the genes located nearby.
As seen in Fig. 2F, GO term analysis of genes expressed in POBs, OBs or both and associated with RUNX2 binding sites suggests that all sets of genes are associated with signal transduction components essential to osteoblast differentiation and transcription (including Sp7, Vdr, and Sox9 known to be involved in skeletal development) and gene networks involved in osteoblast function such as matrix organization, cell adhesion, and skeletal development/ossification. They include fibroblast growth factor 18 (Fgf18), alkaline phosphatase (Alpl), osteopontin (Spp1), collagen 1a1 (Col1a1) and the Runx2 gene itself, all of which are previously known targets of RUNX2 (46–51). The ChIP-seq data tracks for several of these as well as novel genes are illustrated in Fig. 2G, where we document changes in relative RUNX2 binding using overlaid data track analysis as a function of the osteoblast differentiation state. Spp1, for example, represents a classic RUNX2 target and indeed, as previously characterized, RUNX2 was found near its promoter (52–54). Several additional RUNX2 binding sites were also present at the Spp1 locus, however, highlighting the concept that RUNX2 target genes are potentially regulated via multiple sites that are frequently located distal to target gene promoters. Importantly, the overlaid ChIP-seq profiles revealed a significant decrease in the level of RUNX2 as a function of differentiation at several sites. As documented in the data tracks in Fig. 2G, both Fgf18 and Col1a1 represent additional examples. In both cases, while the ChIP-seq analyses confirmed previous data suggesting functional RUNX2 binding sites near the promoters for Fgf18 (between −0.3 and −0.8 kb) (47) and Col1a1 (−1.376 kb) (48–50), they also revealed the presence of a number of additional upstream sites as well. As with Spp1, several of these sites also showed a striking change in RUNX2 binding as a function of differentiation. ChIP-qPCR is shown for validation of ChIP-seq in Fig. 2H for Spp1 and Fgf18 regions. Finally, RUNX2 also has been observed to regulate many additional genes including Alpl (51) and Sp7 (55) that are known to be relevant to osteoblast structure and function.
Co-occupancy of C/EBPβ at the RUNX2 Cistrome
RUNX2 activity is known to be regulated at various levels by a multitude of transcription factors (2). Among these is C/EBPβ, a DNA-binding protein that is highly active in osteoblast-lineage cells during differentiation (56). Indeed, motif finding analysis seen in Fig. 2E suggests that C/EBPβ may play a role in RUNX2 activity. To explore this further, we conducted a similar ChIP-seq analysis of the C/EBPβ cistrome in both POBs and OBs and assessed the level of overlap between the two proteins on a genome-wide scale. The analysis in Fig. 3A revealed that like RUNX2, C/EBPβ also bound broadly to the POB genome (15,622 sites) and that its cistrome was restricted following differentiation to OBs (10,847 sites). The C/EBPβ protein levels were unchanged in differentiation states by Western blot analysis (data not shown). In addition, while an extensive number of sites were found common to both differentiation states, as also seen with RUNX2, each cell type retained a unique subset of C/EBPβ binding sites as well. Similarly, GREAT analysis revealed that these sites were located 1) both promoter-proximal as well as promoter-distal (Fig. 3B, data for both POB and OB overlap in distances from TSS), 2) in a distant-dependent fashion near annotated genes (Fig. 3A) and 3) that the average number of binding sites per associated gene was also greater than one (data not shown). De novo motif finding analysis, as documented in Fig. 3C, also confirmed that the most over represented sequence found at 56–67% of these sites reflected a classic C/EBPβ binding motif; the abundance of RUNX2 and other transcription factor binding motifs was very high as well. Perhaps most importantly, as seen in Fig. 3D, a comparison of the location of both RUNX2 and C/EBPβ binding sites in each of the two osteoblast-lineage states revealed that while many sites of C/EBPβ occupancy were independent of RUNX2, the two proteins co-occupied sites 31% of the time in POBs and 25% of the time in OBs. This relationship can also be seen via RUNX2 and C/EBPβ ChIP-seq tag density at these regions; as seen in Fig. 3E, there was a very close association between the two proteins. Although none of these findings prove a direct relationship between C/EBPβ/RUNX2 co-occupied binding sites and the genes that are located most proximally, GO term analysis of both potential target gene sets, as listed in Fig. 3F, revealed genes associated with terms such as adhesion, growth factor binding, matrix organization, motility, transcription factors and phosphatase activity. These findings support the idea that RUNX2 binding sites reside within regulatory regions that are potentially modular in nature and that these regions may serve as enhancers for the genes to which they are linked. Fig. 3G documents the presence of C/EBPβ at sites within several gene loci, including Spp1, Sp7, and Tln several of which also contain RUNX2.
FIGURE 3.

Association of C/EBPβ with RUNX2. A, Venn diagram depiction of replicate normalized C/EBPβ binding sites assessed using HOMER in POB and OBs. Arrows link the C/EBPβ binding site subsets (POB specific, OB specific, and POB/OB overlap) to annotated neighboring genes using GREAT. B, GREAT analysis of C/EBPβ sites as a function of distance from TSS in kilobases (kb) for both POB and OB. C, de novo sequence over-representation analysis of C/EBPβ peaks by HOMER in POBs and OBs. Abundance shown as percentage (black) compared with 50,000 GC content matched sequences (red). D, Venn diagram overlap of RUNX2 and C/EBPβ peaks for both POB and OBs. E, ChIP-seq tag density (ChIP-Fragment Depth per bp per peak) for all RUNX2 peaks (left) and all C/EBPβ peaks (right). RUNX2 peaks for POB (yellow) and OB (dark yellow), C/EBPβ peaks for POB (green) and OB (dark green). F, the top 4 scoring Gene Ontology (GO) terms are presented for Molecular Function (MF), Biologic Process (BP), or Cellular Component (CC) for the regions in which RUNX2 and C/EBPβ overlap. G, ChIP-seq tag density tracks for RUNX2 and C/EBPβ (POB, yellow; OB, blue; overlap, green). Further details as in Fig. 2.
RUNX2 and C/EBPβ Cistromes Are Marked by Mono- and Tri-methylated H3K4 and Acetylated H3K9 and H4K5 Indicative of Enhancers
A wide variety of selective modifications at both DNA and histones defines a complex epigenetic layer that provides both structural/architectural and functional elements to the genome (57, 58). Importantly, while many of these modifications highlight essential features of genes on a genome-wide scale, a subset are now known to define the regulatory or enhancer regions of genes. Given RUNX2's role as a primary determinant of osteoblastogenesis, we anticipated that sites of both RUNX2 and C/EBPβ binding would also be enriched for enhancer histone marks and that these and additional marks might well define the regulatory epigenome of osteoblast-lineage cells. Thus, we used ChIP-seq analysis to map sites of enrichment of histone methylation reflecting transcription units (H3K36me3), gene promoters (H3K4me3) and enhancers (H3K4me1 and H3K4me3) and histone acetylation enrichment indicative of gene activity (H3K9ac and H4K5ac) in both POB and OB cells, and contrasted the relative levels of these marks during differentiation (58). CEAS (Cis-regulatory Element Annotation System (59)) analysis depicted in Fig. 4A, which assesses ChIP-seq tag density collectively across a normalized gene body, confirmed appropriate enrichment of these individual histone marks as has been previously described (58). As anticipated, while transcription factor binding was characterized by well-defined peaks, histone marks reflecting either overall gene activity or the presence of an enhancer were comprised of rather extended peaks that frequently spanned binding sites for multiple transcription factors (see data tracks). Fig. 4B documents the read densities for each histone modification centered at overlapping genomic RUNX2 and C/EBPβ sites independent of the state of differentiation. Interestingly, while enhancer marks were broadly elevated across enhancers, the level of these marks were frequently depressed or absent specifically at sites of RUNX2 and/or C/EBPβ occupancy (footprints) (60, 61), indicating that RUNX2 binding (or a complex) reduces the level of histone modification, perhaps due to nucleosome displacement. Despite this, it is clear from these epigenetic data as documented in Fig. 4C that sites of binding for these two transcription factors are indeed located within the regulatory regions of genes. Importantly, distinct enhancer histone marks could also be observed at sites that did not contain RUNX2 and/or C/EBPβ, suggesting the presence of additional regulatory enhancers at these genes that were not defined by the presence of RUNX2 or C/EBPβ and likely mediate gene regulation through additional transcription factors. Finally, we examined whether the level of these epigenetic marks was changed at the genes that were nominally associated with differential RUNX2 binding in POBs and OBs. No correlation was observed between the levels of histone enhancer (H3K4me1) or activity (H3K9ac and H4K5) marks and individual gene subsets defined via the RUNX2 binding sites that were either common to both POBs and OBs or unique to either cell differentiation state (data not shown). As DNA bound RUNX2 can exert both stimulatory and suppressive activities, this result is probably not surprising.
FIGURE 4.

The chromatin landscape is predicted by histone modifications near RUNX2 sites. A, average ChIP-seq tag profiles (y axis is tag density) are shown for H4K5Ac, H3K9Ac, H3K4me1, H3K4me3, and H3K36me3 relative to averaged genes (all UCSC Known Genes) from the mm9 genome via CEAS analysis. Profiles are displayed −1kb upstream of the TSS and +1kb downstream of gene TTS (Transcriptional Termination Site). B, ChIP-seq tag density focused on overlapping RUNX2 and C/EBPβ peaks for the POB and interaction with histone markers. C, ChIP-seq tag density profiles for RUNX2, C/EBPβ, H4K5Ac, H3K9Ac, H3K4me1, H3K4me3, and H3K36me3 (POB, yellow; OB, blue; overlap, green) at the Igfbp5 and Tln1 gene loci. Further details as in Fig. 2.
The Relationships between the RUNX2 Cistrome and Gene Expression
Studies suggest that RUNX2 is an early determinant of osteoblast lineage development and function and that the ability of RUNX2 to bind to DNA and to regulate gene expression directs these biological activities (2, 4). We therefore explored the possibility that RUNX2 binding activity might change at subsets of genes whose expression levels changed as a result of differentiation, and that changes in histone modifications might be detectable as well. To accomplish this, we first conducted a DNA microarray analysis of RNA isolated from POBs and OBs and processed the data as described under “Experimental Procedures.” All data passing a 95% confidence limit greater than 2-fold (up or down) were included in the analysis and are summarized as log2 values in supplemental Table S1. As documented in the heat map shown in Fig. 5A, although the expression levels of the vast majority of the genes evaluated by microarray were unchanged (<2-fold), 721 genes displayed either an increase (417) or decrease (304) (>2-fold) in expression between the two differentiation states. Many of these changes were analyzed via direct RT-qPCR and are documented in Fig. 6. Recognizable osteogenic genes that are modulated include Ank, Dmp1, and Spp1. Interestingly, despite the steady increase in Alp staining and enzymatic activity documented during differentiation (Fig. 1), changes in the expression of the Alpl gene at the RNA level was not observed (Fig. 6) despite repeated analyses. The Bglap2 gene was similarly not up-regulated. The reason for the absence of Alpl and Bglap2 as well as Runx2 induction following differentiation is not clear, although it is possible that changes in the expression of these genes occurs prior to day 15. Despite this, however, the changes in gene expression that are observed together with the cellular analyses documented in Fig. 1 are supportive of the differentiation and maturation of these MC3T3-E1 cells from earlier precursors to matrix-secreting and mineralizing cultures over the time frame of these genomic analyses. We then contrasted the relative distribution of all RUNX2 peak-associated genes (obtained by GREAT analysis) identified individually in POBs, OBs, or both with genes whose expression levels were changed during differentiation. As can be seen in Fig. 5B, this relative distribution across the three categories was similar. In fact, 60 of the 108 genes that were up-regulated and 32 of the 47 genes that were down-regulated in OBs were also found within the other two categories. Indeed, as documented in Fig. 5C, only when a comparison was made between GREAT-associated genes whose overall basal level of expression was in the lowest 20% (genes that are generally “off”) versus the highest 20% (genes that are “on” and highly expressed) was this distribution of genes significantly elevated toward the highly expressed cohort. Given these results, it was not surprising as seen in Fig. 5D that the GO terms for the differentially expressed genes enriched in each category were similar. This observation suggests that regardless of whether the expression levels of the genes are changed during differentiation or not, both categories represent potential targets of RUNX2 action.
FIGURE 5.

RUNX2 association with gene expression profiles in POB and OBs. A, heatmap displays genes that are up- (417) or down- (304) regulated greater than 2-fold (95% confidence, moderated t test). Data are displayed as log2 intensities; scale is indicated at bottom where red represents high and blue low expression. B, RUNX2 GREAT associated genes (6,856, 4,367, and 2,063) are cross referenced to up- and down-regulated genes (60 up-regulated and 32 down-regulated genes are in common with all three peak states). C, GREAT-associated genes are compared with the top 20% (4,487 genes) and bottom 20% (3,483 genes) quintiles for gene expression (overlapping accession numbers were removed) in POB and OBs. D, gene ontology of each category from B shows similar enrichment for these categories. E, CEAS comparison of average gene profiles for H4K5Ac in POB (solid lines) and OBs (dashed lines). Up-regulated genes are shown in red; down-regulated genes are shown in blue; all genes are shown in black. F, ChIP-seq tag density profiles for RUNX2, C/EBPβ, H4K5Ac, H3K9Ac, H3K4me1, H3K4me3, and H3K36me3 (POB, yellow; OB, blue; overlap, green). Further details as in Fig. 2.
FIGURE 6.

Gene Expression microarray validation by RT-qPCR Taqman. RT-qPCR was performed on cells that were differentiated for 0, 15, or 30 days. Data were completed in triplicate analysis ± S.E. and are representative of three experiments. Data are displayed as Relative Quantitation (RQ) normalized to β-actin (ΔΔCT), and the CT values for the D0 sample are displayed on each graph. *, p < 0.05 D15 or D30 compared with D0.
As discussed earlier, gross histone modifications were not observed on a genome-wide scale when attempting to correlate RUNX2 binding. If these gene groups were further subdivided into those that are up and down-regulated >2-fold, however, measurable correlative changes can be observed as assessed by CEAS analysis in Fig. 5E. Accordingly, the level of H4K5ac is decreased at genes that are down-regulated and increased at genes that are up-regulated during differentiation; similar correlations were also evident with other histone marks. Although these changes were modest across this cohort of regulated genes, a number of target genes that are highly regulated show a striking increase or decrease in the overall level of H3K4me1, H3K9ac and/or H4K5ac upon differentiation when correlated with RUNX2 binding (Fig. 4C and Fig. 5F); genes whose expression remains unchanged did not show such epigenetic changes.
DISCUSSION
RUNX2 is a lineage determination factor that is expressed early in transitioning MSCs and essential for commitment to the osteoblast lineage (2, 4, 5, 12, 14, 62). Its role is clearly multifactorial in that while RUNX2 orchestrates the initial formation of osteoblast precursors, it is silenced during chondrogenesis and then re-expressed together with RUNX3 to drive hypertrophic chondrocyte differentiation (4). Other members of the RUNX family are similarly involved in cell fate decisions through the regulation of cellular growth and differentiation, and the aberrant or miss-expression of each of the members is associated with unique cancer phenotypes (25, 63–65). Interestingly, the role of RUNX2 is primarily early in the osteoblast lineage. Accordingly, while genetic removal of RUNX2 results in a total absence of osteoblasts in mice in vivo, selective deletion of RUNX2 in mature osteoblasts does not appear to be deleterious for either continued differentiation of the lineage or for maintenance of the bone mineralization program (66). Clearly, other proteins are involved in these processes as well including OSX, which is both induced by RUNX2 and is capable of directing downstream maturation and function of the osteoblast lineage even in the absence of RUNX2 (21). Additional participating factors include cell autonomous regulatory agents involved genetically in the osteoblast program, those that interact to control RUNX2 activity directly and those whose expression levels or activities are regulated by external, ligand-regulated signal transduction pathways (29). Regardless of these details, however, RUNX2 functions as a lineage-determining factor together with synergistic partners to modulate the expression of both broad as well as cell-specific gene networks by contributing to the formation, maintenance and activity of the enhancers that regulate the expression of the individual gene components of these networks. The importance of RUNX2 is highlighted by the additional fact that this protein also plays a significant epigenetic role in osteoblastogenesis by maintaining its presence at key genes throughout mitosis (26). Many of these features are consistent with that of other lineage determining factors, each of which acts in concert with additional lineage-specific factors to orchestrate individual programs of differentiation.
Central to understanding RUNX2 actions further is a quantitative and qualitative genome-wide assessment of the cis-regulatory sites to which RUNX2 binds both in early osteoblast precursors as well as more mature osteoblasts and identification of the properties of these binding sites that are essential to the regulation of the genes associated with the osteoblast phenotype. As determined by ChIP-seq analysis, we showed that the RUNX2 cistrome was comprised of 12,674 high confidence binding sites that were widely dispersed across the POB genome; this cistrome contracted to 6,272 sites upon differentiation to the more mature cell phenotype. This decrease is likely consistent with the idea that RUNX2 represents an early phenotype regulator whose influence becomes increasingly restricted as differentiation proceeds. As total RUNX2 protein levels were largely unchanged following differentiation, this reduction seems likely to result from either a change in RUNX2 activity or a change in the differentiated cell's genome. Despite the reduction in the RUNX2 cistrome following differentiation, the features of the two were similar: cis-regulatory sites are located both promoter-proximal as well as promoter-distal, frequently positioned many kilobases from potential target genes and contain one or more consensus RUNX2 response elements (RREs) that are known to represent sites of direct interaction between RUNX2 and DNA. In addition, both the genome-wide analyses and visual inspection of numerous data tracks at known target genes indicated that more than one RUNX2 regulatory region was often present at potential target gene loci. The fact that multiple RUNX2 enhancers frequently regulate specific target genes leads to additional complexity in defining the role for RUNX2 at these particular genes. Importantly, the RUNX2 cistromes also overlapped extensively with those of C/EBPβ, an osteoblast lineage-active factor that is known to interact directly with RUNX2 to influence RUNX2 activity (56, 67, 68). C/EBPβ plays distinct roles in the differentiation of osteoblasts, chondrocytes and adipocytes and, like RUNX2, its cistrome also undergoes restriction upon osteoblast differentiation. Thus, C/EBPβ represents a prototype co-regulatory DNA binding factor for RUNX2. Given the abundance of proteins that interact with RUNX2 coupled with the frequent presence through our de novo analysis of additional DNA motifs found near sites of RUNX2 binding, it is likely that numerous other proteins form complexes at these sites as well. Finally, sites to which either RUNX2, C/EBPβ, or both bind were also marked by post translational histone modifications that represent either bone fide signatures of enhancers (H3K4me1 and 3) or indicators of gene activity (H4K5ac and H3K9ac) (58). Importantly, the levels of these marks frequently changed at many loci upon differentiation indicating possible changes in gene activity. These data provide significant insight into the sites of action of RUNX2, the significance of C/EBPβ as a co-regulatory DNA binding factor for RUNX2 activity, and of the identity of target genes they potentially regulate.
Our study of the RUNX2 cistrome in osteoblasts appears unique as similar analyses have not yet been reported. Two recent studies of RUNX2 binding activity have been conducted, however, the first reported a ChIP-seq analysis of the RUNX2 cistrome in a RUNX2-null prostate cell line engineered to express RUNX2 in a doxycycline-sensitive manner (33) and the second reported a ChIP-chip analysis of RUNX2 binding at a genome-wide collection of gene promoter regions in the osteosarcoma cell line MG63 (32). The latter identified a collection of 2,265 RUNX2 binding sites that were correlated with adjacent genes, several of which were investigated further as contributing to cancer cell migration and adhesion. As RUNX2 sites located distal to gene promoters represent the norm rather than the exception, as illuminated unequivocally in the present study, the general lack of correlation between RUNX2 binding and target gene regulation evident in this earlier study is likely due to the lack of detection of distal RUNX2 sites. Interestingly, siRNA mediated down-regulation of RUNX2 was not entirely effective in depleting RUNX2 binding at many target genes (32), suggesting that this approach could be problematic. Approximately 1,603 RUNX2 binding sites were noted across the prostate cell line genome upon induction of RUNX2 (33). A parental prostate cell line control expressing endogenous levels of RUNX2 was not examined, however. Thus, it is unclear whether the number of sites measured for RUNX2 represented an appropriate quantitation of the RUNX2 cistrome in this cell line or simply a low estimation due to the technical nature of the model. As the role of RUNX2 in gene expression is complex, it is possible that while the controlled induction of RUNX2 appears to represent a novel approach for defining bone fide target genes in prostate cells, the acute appearance of RUNX2 in this system may underestimate this protein's role at many target genes. In view of the number of sites identified in the present study, the latter seems the more likely possibility. In both studies, however, direct linkage was made with several genes that were indeed regulated by RUNX2, including several involved in motility, migration, adhesion and metastasis.
While quantitation and characterization of the RUNX2 cistrome in POBs and OBs is informative, perhaps of greater importance is an assessment of how these sites and the changes that are observed during differentiation correlate with changes in gene expression patterns. An analysis of gene expression in POBs and OBs revealed a large overlap between the two transcriptomes and that expression levels of most of the genes were changed <2-fold as a consequence of differentiation. However, 721 changes in gene expression >2-fold (up or down) were noted. Regardless of regulation, many of the genes in both of these categories were identified as contributing to the osteoblast lineage phenotype and therefore represent potential targets of RUNX2 action. Demonstrating this fact directly, however, is more difficult. Accordingly, while GREAT analysis points to some 11,232 genes associated with the RUNX2 cistrome in POBs and 6,430 genes associated in OBs (and 4,601 RUNX2 sites and 4,367 associated genes there were found to be in common in both), the overall net distribution of RUNX2 sites at these gene subsets was not different from that seen for the RUNX2 sites associated with the 721 regulated genes. In fact, only when a comparison was made between genes with the lowest (20%) and highest (20%) levels of overall expression was an increase noted in the abundance of RUNX2 binding sites at genes that were expressed most highly. Are these RUNX2 binding sites involved in gene regulation in general? We conclude that many are indeed linked to the regulation of adjacent neighboring genes based upon the fact that the majority of the sites located within regions are heavily marked by epigenetic enhancer signatures and that levels of these histone marks are increased at genes that are up-regulated during differentiation. This conclusion requires qualifications, however. First, the identity of the target gene for an individual enhancer cannot be confirmed through proximity alone. Thus, as noted in this RUNX2 study as well as those for other transcriptional regulators, enhancers are frequently located many kilobases from target genes (69–72) and in several cases have been found to regulate genes on other chromosomes (73, 74). A second qualification is that while DNA binding is likely a pre-requisite for RUNX2 activity, it alone does not indicate the state of transcription activity for RUNX2 (2, 29). Indeed, RUNX2 activity is regulated by its abundance, through post-translational modifications that include both phosphorylation and acetylation and affect both concentration and activity, and through its ability either to interact synergistically with adjacent DNA binding factors or to recruit co-regulatory factors. A final qualification is a temporal one; while many sites of RUNX2 binding may be fully operational, it is possible that other sites reflect historical interactions (memory) or interactions that predict future activity. All of these qualifications point to the importance of these data sets as a future resource for further mechanistic studies aimed at individual genes and gene networks.
Regardless of the complexities associated with linking RUNX2 binding sites to genes on a genome-wide scale, we note the presence of RUNX2 near many genes that are either known or likely targets of RUNX2 action by virtue of their contribution to the osteoblast phenotype. With respect to known targets of RUNX2 action, which include Spp1 (52–54), Vdr (72), Rankl (75, 76), and Runx2 itself (46), it is interesting that although our ChIP-seq analyses generally confirmed sites known from these previous studies to bind RUNX2, they frequently revealed additional sites as well providing novel insight into the mechanism through which RUNX2 regulates these target genes. This increase in complexity contributes in no small way to the difficulty of assessing the nature of RUNX2 regulation. For example, while RUNX2 binding activity may change in concert with gene expression at some regulated genes, RUNX2 binding at other regulated genes may be selectively altered at only one of several adjacent sites. In addition, sites may be differentially occupied as well depending upon the state of maturity. Detailed dissection of RUNX2 action at these gene loci will be required to sort out the potentially unique role(s) of each regulatory region in RUNX2 action. Importantly, in addition to confirmation of known gene targets, genome-wide analysis of the transcriptome herein has also revealed the presence of RUNX2 at a plethora of new gene targets as well. Clues as to their role in osteoblast biology can be found in the GO term categories that emerge for the gene expression analyses. Thus, as stated earlier, the greatest value of these data sets may be as a resource for continued investigation of individual genes.
In summary, we have defined the RUNX2 cistromes in both early and late osteoblasts in vitro, and characterized important features of these cistromes relevant to the activity of the lineage-determining factor RUNX2. We have also correlated these cistromes to gene expression patterns identified in early and late osteoblasts and in particular to those genes whose expression levels undergo change during the differentiation process. Our results add to an understanding of the mechanism through which RUNX2 plays its regulatory role in the development and maintenance of the osteoblast phenotype.
Supplementary Material
Acknowledgments
We thank members of the Pike Laboratory for their helpful discussions and contributions to this manuscript. We also acknowledge the University of Wisconsin DNA Sequencing Facility supported by Marie Adams, John Alliet, and Josh Hyman.
Addendum
While this manuscript was in revision, a report by Wu and colleagues (77) was published that described the results of a similar analysis of the RUNX2 cistrome in MC3T3-E1 clone 4, a more rapidly differentiating version of the MC3T3-E1 cell line used in our studies. The results presented in this new report provide evidence for a much more extensive RUNX2 cistrome than that described herein, although the overall genomic properties of these sites are similar to those we have identified. It is difficult to determine why the RUNX2 cistrome in this report by Wu et al. is considerably larger than that we have observed, although it is not due to differences in the bioinformatic analyses that were performed in the two laboratories. Nevertheless, we note that our data were generated from nearly identical ChIP-seq replicates of the RUNX2 cistrome across the MC3T3-E1 genome at each state of differentiation. The replicate nature of the data sets generated by Wu et al. is unclear as only one set appears to be available through GEO. More importantly, however, our analyses also include the observation that a high percentage of the RUNX2 sites that we identified also contain co-localized C/EBPβ and epigenetic histone signature marks of active enhancers (H3K4me1, H4K5ac, and H3K9ac). These features of the RUNX2 cistrome we have identified are generally absent at many of the additional RUNX2 sites identified in the report by Wu et al. and all are available at GEO. While future studies will be necessary to resolve the minor differences highlighted in these two reports, the general identification and characterization of the RUNX2 cistrome in differentiating MC3T3-E1 cells provides new insight into the DNA binding properties of this key osteoblast-lineage determining factor, and will likely enable more detailed studies on its function.
This work was supported, in whole or in part, by National Institutes of Health Grant DK-072281 (to J. W. P.).

This article contains supplemental Table S1.
- MSC
- mesenchymal stem cell
- CEAS
- cis-regulatory element annotation system
- GREAT
- genomic regions enrichment of annotations tool
- GO
- gene ontology
- TSS
- transcriptional start site
- C/EBP
- CCAAT-enhancer-binding proteins
- RUNX2
- runt-related transcription factor 2
- ALP
- alkaline phosphatase.
REFERENCES
- 1. Bianco P., Cao X., Frenette P. S., Mao J. J., Robey P. G., Simmons P. J., Wang C. Y. (2013) The meaning, the sense and the significance: translating the science of mesenchymal stem cells into medicine. Nat. Med. 19, 35–42 [DOI] [PMC free article] [PubMed] [Google Scholar]
- 2. Long F. (2012) Building strong bones: molecular regulation of the osteoblast lineage. Nat. Rev. Mol. Cell Biol. 13, 27–38 [DOI] [PubMed] [Google Scholar]
- 3. Dallas S. L., Prideaux M., Bonewald L. F. (2013) The osteocyte: an endocrine cell and more. Endocr. Rev. 34, 658–690 [DOI] [PMC free article] [PubMed] [Google Scholar]
- 4. Karsenty G. (2008) Transcriptional control of skeletogenesis. Annu. Rev. Genomics Hum. Genet. 9, 183–196 [DOI] [PubMed] [Google Scholar]
- 5. Karsenty G., Kronenberg H. M., Settembre C. (2009) Genetic control of bone formation. Annu. Rev. Cell Dev. Biol. 25, 629–648 [DOI] [PubMed] [Google Scholar]
- 6. Gordon J. A., Hassan M. Q., Koss M., Montecino M., Selleri L., van Wijnen A. J., Stein J. L., Stein G. S., Lian J. B. (2011) Epigenetic regulation of early osteogenesis and mineralized tissue formation by a HOXA10-PBX1-associated complex. Cells Tissues Organs 194, 146–150 [DOI] [PMC free article] [PubMed] [Google Scholar]
- 7. Dudakovic A., Evans J. M., Li Y., Middha S., McGee-Lawrence M. E., van Wijnen A. J., Westendorf J. J. (2013) Histone deacetylase inhibition promotes osteoblast maturation by altering the histone H4 epigenome and reduces Akt phosphorylation. J. Biol. Chem. 288, 28783–28791 [DOI] [PMC free article] [PubMed] [Google Scholar]
- 8. Komori T. (2011) Signaling networks in RUNX2-dependent bone development. J. Cell Biochem. 112, 750–755 [DOI] [PubMed] [Google Scholar]
- 9. Lian J. B., Stein G. S., Javed A., van Wijnen A. J., Stein J. L., Montecino M., Hassan M. Q., Gaur T., Lengner C. J., Young D. W. (2006) Networks and hubs for the transcriptional control of osteoblastogenesis. Rev. Endocr. Metab. Disord 7, 1–16 [DOI] [PubMed] [Google Scholar]
- 10. Akiyama H., Chaboissier M. C., Martin J. F., Schedl A., de Crombrugghe B. (2002) The transcription factor Sox9 has essential roles in successive steps of the chondrocyte differentiation pathway and is required for expression of Sox5 and Sox6. Genes Dev. 16, 2813–2828 [DOI] [PMC free article] [PubMed] [Google Scholar]
- 11. Wuelling M., Vortkamp A. (2011) Chondrocyte proliferation and differentiation. Endocr. Dev. 21, 1–11 [DOI] [PubMed] [Google Scholar]
- 12. Ducy P., Zhang R., Geoffroy V., Ridall A., Karsenty G. (1997) Osf2/Cbfa1: a transcriptional activator of osteoblast differentiation. Cell 89, 747–754 [DOI] [PubMed] [Google Scholar]
- 13. Hassan M. Q., Saini S., Gordon J. A., van Wijnen A. J., Montecino M., Stein J. L., Stein G. S., Lian J. B. (2009) Molecular switches involving homeodomain proteins, HOXA10 and RUNX2 regulate osteoblastogenesis. Cells Tissues Organs 189, 122–125 [DOI] [PMC free article] [PubMed] [Google Scholar]
- 14. Otto F., Thornell A. P., Crompton T., Denzel A., Gilmour K. C., Rosewell I. R., Stamp G. W., Beddington R. S., Mundlos S., Olsen B. R., Selby P. B., Owen M. J. (1997) Cbfa1, a candidate gene for cleidocranial dysplasia syndrome, is essential for osteoblast differentiation and bone development. Cell 89, 765–771 [DOI] [PubMed] [Google Scholar]
- 15. Nakashima K., Zhou X., Kunkel G., Zhang Z., Deng J. M., Behringer R. R., de Crombrugghe B. (2002) The novel zinc finger-containing transcription factor osterix is required for osteoblast differentiation and bone formation. Cell 108, 17–29 [DOI] [PubMed] [Google Scholar]
- 16. Koga T., Matsui Y., Asagiri M., Kodama T., de Crombrugghe B., Nakashima K., Takayanagi H. (2005) NFAT and Osterix cooperatively regulate bone formation. Nat. Med. 11, 880–885 [DOI] [PubMed] [Google Scholar]
- 17. Cohen M. M. (2009) Perspectives on RUNX genes: an update. Am. J. Med. Genet. 149A, 2629–2646 [DOI] [PubMed] [Google Scholar]
- 18. Ali S. A., Zaidi S. K., Dacwag C. S., Salma N., Young D. W., Shakoori A. R., Montecino M. A., Lian J. B., van Wijnen A. J., Imbalzano A. N., Stein G. S., Stein J. L. (2008) Phenotypic transcription factors epigenetically mediate cell growth control. Proc. Natl. Acad. Sci. U.S.A. 105, 6632–6637 [DOI] [PMC free article] [PubMed] [Google Scholar]
- 19. Stein G. S., Zaidi S. K., Stein J. L., Lian J. B., van Wijnen A. J., Montecino M., Young D. W., Javed A., Pratap J., Choi J. Y., Ali S. A., Pande S., Hassan M. Q. (2009) Transcription-factor-mediated epigenetic control of cell fate and lineage commitment. Biochem. Cell Biol. 87, 1–6 [DOI] [PMC free article] [PubMed] [Google Scholar]
- 20. Komori T., Yagi H., Nomura S., Yamaguchi A., Sasaki K., Deguchi K., Shimizu Y., Bronson R., Gao Y., Inada M., Sato M., Okamoto R., Kitamura Y., Yoshiki S., Kishimoto T. (1997) Targeted disruption of Cbfa1 results in a complete lack of bone formation owing to maturational arrest of osteoblasts. Cell 89, 755–764 [DOI] [PubMed] [Google Scholar]
- 21. Lian J. B., Gordon J. A., Stein G. S. (2013) Redefining the activity of a bone-specific transcription factor: novel insights for understanding bone formation. J. Bone Miner Res. 28, 2060–2063 [DOI] [PubMed] [Google Scholar]
- 22. Inada M., Yasui T., Nomura S., Miyake S., Deguchi K., Himeno M., Sato M., Yamagiwa H., Kimura T., Yasui N., Ochi T., Endo N., Kitamura Y., Kishimoto T., Komori T. (1999) Maturational disturbance of chondrocytes in Cbfa1-deficient mice. Dev. Dyn. 214, 279–290 [DOI] [PubMed] [Google Scholar]
- 23. Mundlos S., Otto F., Mundlos C., Mulliken J. B., Aylsworth A. S., Albright S., Lindhout D., Cole W. G., Henn W., Knoll J. H., Owen M. J., Mertelsmann R., Zabel B. U., Olsen B. R. (1997) Mutations involving the transcription factor CBFA1 cause cleidocranial dysplasia. Cell 89, 773–779 [DOI] [PubMed] [Google Scholar]
- 24. Saltman L. H., Javed A., Ribadeneyra J., Hussain S., Young D. W., Osdoby P., Amcheslavsky A., van Wijnen A. J., Stein J. L., Stein G. S., Lian J. B., Bar-Shavit Z. (2005) Organization of transcriptional regulatory machinery in osteoclast nuclei: compartmentalization of Runx1. J. Cell Physiol. 204, 871–880 [DOI] [PubMed] [Google Scholar]
- 25. Stein G. S., Stein J. L., Van Wijnen A. J., Lian J. B., Montecino M., Croce C. M., Choi J. Y., Ali S. A., Pande S., Hassan M. Q., Zaidi S. K., Young D. W. (2010) Transcription factor-mediated epigenetic regulation of cell growth and phenotype for biological control and cancer. Adv. Enzyme Regul. 50, 160–167 [DOI] [PMC free article] [PubMed] [Google Scholar]
- 26. Zaidi S. K., Young D. W., Montecino M. A., Lian J. B., van Wijnen A. J., Stein J. L., Stein G. S. (2010) Mitotic bookmarking of genes: a novel dimension to epigenetic control. Nat. Rev. Genet. 11, 583–589 [DOI] [PMC free article] [PubMed] [Google Scholar]
- 27. Choi J. Y., Pratap J., Javed A., Zaidi S. K., Xing L., Balint E., Dalamangas S., Boyce B., van Wijnen A. J., Lian J. B., Stein J. L., Jones S. N., Stein G. S. (2001) Subnuclear targeting of Runx/Cbfa/AML factors is essential for tissue-specific differentiation during embryonic development. Proc. Natl. Acad. Sci. U.S.A. 98, 8650–8655 [DOI] [PMC free article] [PubMed] [Google Scholar]
- 28. Zaidi S. K., Javed A., Pratap J., Schroeder T. M., J Westendorf J., Lian J. B., van Wijnen A. J., Stein G. S., Stein J. L. (2006) Alterations in intranuclear localization of Runx2 affect biological activity. J. Cell Physiol. 209, 935–942 [DOI] [PubMed] [Google Scholar]
- 29. Jonason J. H., Xiao G., Zhang M., Xing L., Chen D. (2009) Post-translational Regulation of Runx2 in Bone and Cartilage. J. Dent Res. 88, 693–703 [DOI] [PMC free article] [PubMed] [Google Scholar]
- 30. Delgado-Calle J., Garmilla P., Riancho J. A. (2012) Do epigenetic marks govern bone mass and homeostasis? Curr. Genomics 13, 252–263 [DOI] [PMC free article] [PubMed] [Google Scholar]
- 31. Meyers S., Downing J. R., Hiebert S. W. (1993) Identification of AML-1 and the (8;21) translocation protein (AML-1/ETO) as sequence-specific DNA-binding proteins: the runt homology domain is required for DNA binding and protein-protein interactions. Mol. Cell Biol. 13, 6336–6345 [DOI] [PMC free article] [PubMed] [Google Scholar]
- 32. van der Deen M., Akech J., Lapointe D., Gupta S., Young D. W., Montecino M. A., Galindo M., Lian J. B., Stein J. L., Stein G. S., van Wijnen A. J. (2012) Genomic promoter occupancy of runt-related transcription factor RUNX2 in Osteosarcoma cells identifies genes involved in cell adhesion and motility. J. Biol. Chem. 287, 4503–4517 [DOI] [PMC free article] [PubMed] [Google Scholar]
- 33. Little G. H., Noushmehr H., Baniwal S. K., Berman B. P., Coetzee G. A., Frenkel B. (2012) Genome-wide Runx2 occupancy in prostate cancer cells suggests a role in regulating secretion. Nucleic Acids Res. 40, 3538–3547 [DOI] [PMC free article] [PubMed] [Google Scholar]
- 34. Sudo H., Kodama H. A., Amagai Y., Yamamoto S., Kasai S. (1983) In vitro differentiation and calcification in a new clonal osteogenic cell line derived from newborn mouse calvaria. J. Cell Biol. 96, 191–198 [DOI] [PMC free article] [PubMed] [Google Scholar]
- 35. Meyer M. B., Goetsch P. D., Pike J. W. (2012) VDR/RXR and TCF4/β-catenin cistromes in colonic cells of colorectal tumor origin: impact on c-FOS and c-MYC gene expression. Mol. Endocrinol. 26, 37–51 [DOI] [PMC free article] [PubMed] [Google Scholar]
- 36. Landt S. G., Marinov G. K., Kundaje A., Kheradpour P., Pauli F., Batzoglou S., Bernstein B. E., Bickel P., Brown J. B., Cayting P., Chen Y., DeSalvo G., Epstein C., Fisher-Aylor K. I., Euskirchen G., Gerstein M., Gertz J., Hartemink A. J., Hoffman M. M., Iyer V. R., Jung Y. L., Karmakar S., Kellis M., Kharchenko P. V., Li Q., Liu T., Liu X. S., Ma L., Milosavljevic A., Myers R. M., Park P. J., Pazin M. J., Perry M. D., Raha D., Reddy T. E., Rozowsky J., Shoresh N., Sidow A., Slattery M., Stamatoyannopoulos J. A., Tolstorukov M. Y., White K. P., Xi S., Farnham P. J., Lieb J. D., Wold B. J., Snyder M. (2012) ChIP-seq guidelines and practices of the ENCODE and modENCODE consortia. Genome Res. 22, 1813–1831 [DOI] [PMC free article] [PubMed] [Google Scholar]
- 37. Langmead B., Trapnell C., Pop M., Salzberg S. (2009) Ultrafast and memory-efficient alignment of short DNA sequences to the human genome. Genome Biol. 10, R25. [DOI] [PMC free article] [PubMed] [Google Scholar]
- 38. Valouev A., Johnson D., Sundquist A., Medina C., Anton E., Batzoglou S., Myers R., Sidow A. (2008) Genome-wide analysis of transcription factor binding sites based on ChIP-Seq data. Nat. Methods 5, 829–834 [DOI] [PMC free article] [PubMed] [Google Scholar]
- 39. Heinz S., Benner C., Spann N., Bertolino E., Lin Y., Laslo P., Cheng J., Murre C., Singh H., Glass C. (2010) Simple combinations of lineage-determining transcription factors prime cis-regulatory elements required for macrophage and B cell identities. Mol. Cell 38, 576–589 [DOI] [PMC free article] [PubMed] [Google Scholar]
- 40. Cartharius K., Frech K., Grote K., Klocke B., Haltmeier M., Klingenhoff A., Frisch M., Bayerlein M., Werner T. (2005) MatInspector and beyond: promoter analysis based on transcription factor binding sites. Bioinformatics 21, 2933–2942 [DOI] [PubMed] [Google Scholar]
- 41. Giardine B., Riemer C., Hardison R. C., Burhans R., Elnitski L., Shah P., Zhang Y., Blankenberg D., Albert I., Taylor J., Miller W., Kent W. J., Nekrutenko A. (2005) Galaxy: a platform for interactive large-scale genome analysis. Genome Res. 15, 1451–1455 [DOI] [PMC free article] [PubMed] [Google Scholar]
- 42. Robinson M. D., Smyth G. K. (2007) Moderated statistical tests for assessing differences in tag abundance. Bioinformatics 23, 2881–2887 [DOI] [PubMed] [Google Scholar]
- 43. Robinson M. D., Smyth G. K. (2008) Small-sample estimation of negative binomial dispersion, with applications to SAGE data. Biostatistics 9, 321–332 [DOI] [PubMed] [Google Scholar]
- 44. Robinson M. D., McCarthy D. J., Smyth G. K. (2010) edgeR: a Bioconductor package for differential expression analysis of digital gene expression data. Bioinformatics 26, 139–140 [DOI] [PMC free article] [PubMed] [Google Scholar]
- 45. McLean C. Y., Bristor D., Hiller M., Clarke S. L., Schaar B. T., Lowe C. B., Wenger A. M., Bejerano G. (2010) GREAT improves functional interpretation of cis-regulatory regions. Nat. Biotechnol. 28, 495–501 [DOI] [PMC free article] [PubMed] [Google Scholar]
- 46. Drissi H., Pouliot A., Stein J. L., van Wijnen A. J., Stein G. S., Lian J. B. (2002) Identification of novel protein/DNA interactions within the promoter of the bone-related transcription factor Runx2/Cbfa1. J. Cell Biochem. 86, 403–412 [DOI] [PubMed] [Google Scholar]
- 47. Reinhold M. I., Naski M. C. (2007) Direct interactions of Runx2 and canonical Wnt signaling induce FGF18. J. Biol. Chem. 282, 3653–3663 [DOI] [PubMed] [Google Scholar]
- 48. Kern B., Shen J., Starbuck M., Karsenty G. (2001) Cbfa1 contributes to the osteoblast-specific expression of type I collagen genes. J. Biol. Chem. 276, 7101–7107 [DOI] [PubMed] [Google Scholar]
- 49. Ivkosić A., Kronenberg M. S., Lichtler A. C., Kream B. E. (2006) Analysis of internal deletions of a rat Col1a1 promoter fragment in transfected ROS17/2.8 cells. Coll Antropol 30, 401–404 [PubMed] [Google Scholar]
- 50. Komori T. (2010) Regulation of osteoblast differentiation by Runx2. Adv. Exp. Med. Biol. 658, 43–49 [DOI] [PubMed] [Google Scholar]
- 51. Byers B. A., Pavlath G. K., Murphy T. J., Karsenty G., García A. J. (2002) Cell-type-dependent up-regulation of in vitro mineralization after overexpression of the osteoblast-specific transcription factor Runx2/Cbfal. J. Bone Miner Res. 17, 1931–1944 [DOI] [PubMed] [Google Scholar]
- 52. Sato M., Morii E., Komori T., Kawahata H., Sugimoto M., Terai K., Shimizu H., Yasui T., Ogihara H., Yasui N., Ochi T., Kitamura Y., Ito Y., Nomura S. (1998) Transcriptional regulation of osteopontin gene in vivo by PEBP2αA/CBFA1 and ETS1 in the skeletal tissues. Oncogene 17, 1517–1525 [DOI] [PubMed] [Google Scholar]
- 53. Shen Q., Christakos S. (2005) The vitamin D receptor, Runx2, and the Notch signaling pathway cooperate in the transcriptional regulation of osteopontin. J. Biol. Chem. 280, 40589–40598 [DOI] [PubMed] [Google Scholar]
- 54. Wai P. Y., Mi Z., Gao C., Guo H., Marroquin C., Kuo P. C. (2006) Ets-1 and runx2 regulate transcription of a metastatic gene, osteopontin, in murine colorectal cancer cells. J. Biol. Chem. 281, 18973–18982 [DOI] [PubMed] [Google Scholar]
- 55. Nishio Y., Dong Y., Paris M., O'Keefe R. J., Schwarz E. M., Drissi H. (2006) Runx2-mediated regulation of the zinc finger Osterix/Sp7 gene. Gene 372, 62–70 [DOI] [PubMed] [Google Scholar]
- 56. Hirata M., Kugimiya F., Fukai A., Saito T., Yano F., Ikeda T., Mabuchi A., Sapkota B. R., Akune T., Nishida N., Yoshimura N., Nakagawa T., Tokunaga K., Nakamura K., Chung U. I., Kawaguchi H. (2012) C/EBPβ and RUNX2 cooperate to degrade cartilage with MMP-13 as the target and HIF-2α as the inducer in chondrocytes. Hum. Mol. Genet. 21, 1111–1123 [DOI] [PubMed] [Google Scholar]
- 57. Dunham I., Kundaje A., Aldred S. F., Collins P. J., Davis C. A., Doyle F., Epstein C. B., Frietze S., Harrow J., Kaul R., Khatun J., Lajoie B. R., Landt S. G., Lee B. K., Pauli F., Rosenbloom K. R., Sabo P., Safi A., Sanyal A., Shoresh N., Simon J. M., Song L., Trinklein N. D., Altshuler R. C., Birney E., Brown J. B., Cheng C., Djebali S., Dong X., Ernst J., Furey T. S., Gerstein M., Giardine B., Greven M., Hardison R. C., Harris R. S., Herrero J., Hoffman M. M., Iyer S., Kelllis M., Kheradpour P., Lassman T., Li Q., Lin X., Marinov G. K., Merkel A., Mortazavi A., Parker S. C., Reddy T. E., Rozowsky J., Schlesinger F., Thurman R. E., Wang J., Ward L. D., Whitfield T. W., Wilder S. P., Wu W., Xi H. S., Yip K. Y., Zhuang J., Bernstein B. E., Green E. D., Gunter C., Snyder M., Pazin M. J., Lowdon R. F., Dillon L. A., Adams L. B., Kelly C. J., Zhang J., Wexler J. R., Good P. J., Feingold E. A., Crawford G. E., Dekker J., Elinitski L., Farnham P. J., Giddings M. C., Gingeras T. R., Guigó R., Hubbard T. J., Kellis M., Kent W. J., Lieb J. D., Margulies E. H., Myers R. M., Starnatoyannopoulos J. A., Tennebaum S. A., Weng Z., White K. P., Wold B., Yu Y., Wrobel J., Risk B. A., Gunawardena H. P., Kuiper H. C., Maier C. W., Xie L., Chen X., Mikkelsen T. S., Gillespie S., Goren A., Ram O., Zhang X., Wang L., Issner R., Coyne M. J., Durham T., Ku M., Truong T., Eaton M. L., Dobin A., Lassmann T., Tanzer A., Lagarde J., Lin W., Xue C., Williams B. A., Zaleski C., Röder M., Kokocinski F., Abdelhamid R. F., Alioto T., Antoshechkin I., Baer M. T., Batut P., Bell I., Bell K., Chakrabortty S., Chrast J., Curado J., Derrien T., Drenkow J., Dumais E., Dumais J., Duttagupta R., Fastuca M., Fejes-Toth K., Ferreira P., Foissac S., Fullwood M. J., Gao H., Gonzalez D., Gordon A., Howald C., Jha S., Johnson R., Kapranov P., King B., Kingswood C., Li G., Luo O. J., Park E., Preall J. B., Presaud K., Ribeca P., Robyr D., Ruan X., Sammeth M., Sandu K. S., Schaeffer L., See L. H., Shahab A., Skancke J., Suzuki A. M., Takahashi H., Tilgner H., Trout D., Walters N., Wang H., Hayashizaki Y., Reymond A., Antonarakis S. E., Hannon G. J., Ruan Y., Carninci P., Sloan C. A., Learned K., Malladi V. S., Wong M. C., Barber G. P., Cline M. S., Dreszer T. R., Heitner S. G., Karolchik D., Kirkup V. M., Meyer L. R., Long J. C., Maddren M., Raney B. J., Grasfeder L. L., Giresi P. G., Battenhouse A., Sheffield N. C., Showers K. A., London D., Bhinge A. A., Shestak C., Schaner M. R., Kim S. K., Zhang Z. Z., Mieczkowski P. A., Mieczkowska J. O., Liu Z., McDaniell R. M., Ni Y., Rashid N. U., Kim M. J., Adar S., Zhang Z., Wang T., Winter D., Keefe D., Iyer V. R., Sandhu K. S., Zheng M., Wang P., Gertz J., Vielmetter J., Partridge E. C., Varley K. E., Gasper C., Bansal A., Pepke S., Jain P., Amrhein H., Bowling K. M., Anaya M., Cross M. K., Muratet M. A., Newberry K. M., McCue K., Nesmith A. S., Fisher-Aylor K. I., Pusey B., DeSalvo G., Parker S. L., Balasubramanian S., Davis N. S., Meadows S. K., Eggleston T., Newberry J. S., Levy S. E., Absher D. M., Wong W. H., Blow M. J., Visel A., Pennachio L. A., Elnitski L., Petrykowska H. M., Abyzov A., Aken B., Barrell D., Barson G., Berry A., Bignell A., Boychenko V., Bussotti G., Davidson C., Despacio-Reyes G., Diekhans M., Ezkurdia I., Frankish A., Gilbert J., Gonzalez J. M., Griffiths E., Harte R., Hendrix D. A., Hunt T., Jungreis I., Kay M., Khurana E., Leng J., Lin M. F., Loveland J., Lu Z., Manthravadi D., Mariotti M., Mudge J., Mukherjee G., Notredame C., Pei B., Rodriguez J. M., Saunders G., Sboner A., Searle S., Sisu C., Snow C., Steward C., Tapanari E., Tress M. L., van Baren M. J., Washieti S., Wilming L., Zadissa A., Zhengdong Z., Brent M., Haussler D., Valencia A., Raymond A., Addleman N., Alexander R. P., Auerbach R. K., Bettinger K., Bhardwaj N., Boyle A. P., Cao A. R., Cayting P., Charos A., Cheng Y., Eastman C., Euskirchen G., Fleming J. D., Grubert F., Habegger L., Hariharan M., Harmanci A., Iyenger S., Jin V. X., Karczewski K. J., Kasowski M., Lacroute P., Lam H., Larnarre-Vincent N., Lian J., Lindahl-Allen M., Min R., Miotto B., Monahan H., Moqtaderi Z., Mu X. J., O'Geen H., Ouyang Z., Patacsil D., Raha D., Ramirez L., Reed B., Shi M., Slifer T., Witt H., Wu L., Xu X., Yan K. K., Yang X., Struhl K., Weissman S. M., Tenebaum S. A., Penalva L. O., Karmakar S., Bhanvadia R. R., Choudhury A., Domanus M., Ma L., Moran J., Victorsen A., Auer T., Centarin L., Eichenlaub M., Gruhl F., Heerman S., Hoeckendorf B., Inoue D., Kellner T., Kirchmaier S., Mueller C., Reinhardt R., Schertel L., Schneider S., Sinn R., Wittbrodt B., Wittbrodt J., Jain G., Balasundaram G., Bates D. L., Byron R., Canfield T. K., Diegel M. J., Dunn D., Ebersol A. K., Frum T., Garg K., Gist E., Hansen R. S., Boatman L., Haugen E., Humbert R., Johnson A. K., Johnson E. M., Kutyavin T. M., Lee K., Lotakis D., Maurano M. T., Neph S. J., Neri F. V., Nguyen E. D., Qu H., Reynolds A. P., Roach V., Rynes E., Sanchez M. E., Sandstrom R. S., Shafer A. O., Stergachis A. B., Thomas S., Vernot B., Vierstra J., Vong S., Weaver M. A., Yan Y., Zhang M., Akey J. A., Bender M., Dorschner M. O., Groudine M., MacCoss M. J., Navas P., Stamatoyannopoulos G., Stamatoyannopoulos J. A., Beal K., Brazma A., Flicek P., Johnson N., Lukk M., Luscombe N. M., Sobral D., Vaquerizas J. M., Batzoglou S., Sidow A., Hussami N., Kyriazopoulou-Panagiotopoulou S., Libbrecht M. W., Schaub M. A., Miller W., Bickel P. J., Banfai B., Boley N. P., Huang H., Li J. J., Noble W. S., Bilmes J. A., Buske O. J., Sahu A. O., Kharchenko P. V., Park P. J., Baker D., Taylor J., Lochovsky L., Consortium E. P. (2012) An integrated encyclopedia of DNA elements in the human genome. Nature 489, 57–74 [DOI] [PMC free article] [PubMed] [Google Scholar]
- 58. Ernst J., Kheradpour P., Mikkelsen T. S., Shoresh N., Ward L. D., Epstein C. B., Zhang X., Wang L., Issner R., Coyne M., Ku M., Durham T., Kellis M., Bernstein B. E. (2011) Mapping and analysis of chromatin state dynamics in nine human cell types. Nature 473, 43–49 [DOI] [PMC free article] [PubMed] [Google Scholar]
- 59. Ji X., Li W., Song J., Wei L., Liu X. (2006) CEAS: cis-regulatory element annotation system. Nucleic Acids Res. 34, W551–554 [DOI] [PMC free article] [PubMed] [Google Scholar]
- 60. Boyle A. P., Song L., Lee B. K., London D., Keefe D., Birney E., Iyer V. R., Crawford G. E., Furey T. S. (2011) High-resolution genome-wide in vivo footprinting of diverse transcription factors in human cells. Genome Res 21, 456–464 [DOI] [PMC free article] [PubMed] [Google Scholar]
- 61. Vierstra J., Wang H., John S., Sandstrom R., Stamatoyannopoulos J. A. (2014) Coupling transcription factor occupancy to nucleosome architecture with DNase-FLASH. Nat. Methods 11, 66–72 [DOI] [PubMed] [Google Scholar]
- 62. Hassan M. Q., Tare R. S., Lee S. H., Mandeville M., Morasso M. I., Javed A., van Wijnen A. J., Stein J. L., Stein G. S., Lian J. B. (2006) BMP2 commitment to the osteogenic lineage involves activation of Runx2 by DLX3 and a homeodomain transcriptional network. J. Biol. Chem. 281, 40515–40526 [DOI] [PubMed] [Google Scholar]
- 63. Cameron E. R., Blyth K., Hanlon L., Kilbey A., Mackay N., Stewart M., Terry A., Vaillant F., Wotton S., Neil J. C. (2003) The Runx genes as dominant oncogenes. Blood Cells Mol. Dis. 30, 194–200 [DOI] [PubMed] [Google Scholar]
- 64. Kilbey A., Terry A., Cameron E. R., Neil J. C. (2008) Oncogene-induced senescence: an essential role for Runx. Cell Cycle 7, 2333–2340 [DOI] [PMC free article] [PubMed] [Google Scholar]
- 65. Blyth K., Vaillant F., Jenkins A., McDonald L., Pringle M. A., Huser C., Stein T., Neil J., Cameron E. R. (2010) Runx2 in normal tissues and cancer cells: A developing story. Blood Cells Mol. Dis. 45, 117–123 [DOI] [PubMed] [Google Scholar]
- 66. Takarada T., Hinoi E., Nakazato R., Ochi H., Xu C., Tsuchikane A., Takeda S., Karsenty G., Abe T., Kiyonari H., Yoneda Y. (2013) An analysis of skeletal development in osteoblast-specific and chondrocyte-specific runt-related transcription factor-2 (Runx2) knockout mice. J. Bone Miner Res. 28, 2064–2069 [DOI] [PubMed] [Google Scholar]
- 67. Zanotti S., Stadmeyer L., Smerdel-Ramoya A., Durant D., Canalis E. (2009) Misexpression of CCAAT/enhancer binding protein β causes osteopenia. J. Endocrinol. 201, 263–274 [DOI] [PMC free article] [PubMed] [Google Scholar]
- 68. Tominaga H., Maeda S., Hayashi M., Takeda S., Akira S., Komiya S., Nakamura T., Akiyama H., Imamura T. (2008) CCAAT/enhancer-binding protein β promotes osteoblast differentiation by enhancing Runx2 activity with ATF4. Mol. Biol. Cell 19, 5373–5386 [DOI] [PMC free article] [PubMed] [Google Scholar]
- 69. Taher L., Smith R. P., Kim M. J., Ahituv N., Ovcharenko I. (2013) Sequence signatures extracted from proximal promoters can be used to predict distal enhancers. Genome Biol. 14, R117. [DOI] [PMC free article] [PubMed] [Google Scholar]
- 70. Wamstad J. A., Wang X., Demuren O. O., Boyer L. A. (2014) Distal enhancers: new insights into heart development and disease. Trends Cell Biol. 24, 294–302 [DOI] [PubMed] [Google Scholar]
- 71. Kim S., Yamazaki M., Zella L., Shevde N., Pike J. (2006) Activation of receptor activator of NF-κB ligand gene expression by 1,25-dihydroxyvitamin D3 is mediated through multiple long-range enhancers. Mol. Cell Biol. 26, 6469–6486 [DOI] [PMC free article] [PubMed] [Google Scholar]
- 72. Zella L. A., Meyer M. B., Nerenz R. D., Lee S. M., Martowicz M. L., Pike J. W. (2010) Multifunctional enhancers regulate mouse and human vitamin D receptor gene transcription. Mol. Endocrinol. 24, 128–147 [DOI] [PMC free article] [PubMed] [Google Scholar]
- 73. Zhang Y., Wong C. H., Birnbaum R. Y., Li G., Favaro R., Ngan C. Y., Lim J., Tai E., Poh H. M., Wong E., Mulawadi F. H., Sung W. K., Nicolis S., Ahituv N., Ruan Y., Wei C. L. (2013) Chromatin connectivity maps reveal dynamic promoter-enhancer long-range associations. Nature 504, 306–310 [DOI] [PMC free article] [PubMed] [Google Scholar]
- 74. Kieffer-Kwon K. R., Tang Z., Mathe E., Qian J., Sung M. H., Li G., Resch W., Baek S., Pruett N., Grøntved L., Vian L., Nelson S., Zare H., Hakim O., Reyon D., Yamane A., Nakahashi H., Kovalchuk A. L., Zou J., Joung J. K., Sartorelli V., Wei C. L., Ruan X., Hager G. L., Ruan Y., Casellas R. (2013) Interactome maps of mouse gene regulatory domains reveal basic principles of transcriptional regulation. Cell 155, 1507–1520 [DOI] [PMC free article] [PubMed] [Google Scholar]
- 75. Fu Q., Manolagas S. C., O'Brien C. A. (2006) Parathyroid hormone controls receptor activator of NF-κB ligand gene expression via a distant transcriptional enhancer. Mol. Cell Biol. 26, 6453–6468 [DOI] [PMC free article] [PubMed] [Google Scholar]
- 76. Martowicz M. L., Meyer M. B., Pike J. W. (2011) The mouse RANKL gene locus is defined by a broad pattern of histone H4 acetylation and regulated through distinct distal enhancers. J. Cell Biochem. 112, 2030–2045 [DOI] [PMC free article] [PubMed] [Google Scholar]
- 77. Wu H., Whitfield T. W., Gordon J. A., Dobson J. R., Tai P. W., van Wijnen A. J., Stein J. L., Stein G. S., Lian J. B. (2014) Genomic occupancy of Runx2 with global expression profiling identifies a novel dimension to control of osteoblastogenesis. Genome Biol. 15, R52. [DOI] [PMC free article] [PubMed] [Google Scholar]
Associated Data
This section collects any data citations, data availability statements, or supplementary materials included in this article.