

Background: Circadian clockworks gate macrophage inflammatory responses.
Results: Myeloid cell-specific disruption of Period1 and Period2 exacerbates diet-induced adipose and liver inflammation and systemic insulin resistance.
Conclusion: Macrophage circadian dysregulation contributes to diet-induced inflammation and metabolic phenotypes in adipose and liver tissues.
Significance: Interactions between circadian clocks and pathways mediating adipose tissue inflammation are critical in the development and possibly treatment of obesity-associated metabolic disorders.
Keywords: Adipose Tissue, Circadian Clock, Inflammation, Insulin Resistance, Macrophage
Abstract
The circadian clockworks gate macrophage inflammatory responses. Given the association between clock dysregulation and metabolic disorders, we conducted experiments to determine the extent to which over-nutrition modulates macrophage clock function and whether macrophage circadian dysregulation is a key factor linking over-nutrition to macrophage proinflammatory activation, adipose tissue inflammation, and systemic insulin resistance. Our results demonstrate that 1) macrophages from high fat diet-fed mice are marked by dysregulation of the molecular clockworks in conjunction with increased proinflammatory activation, 2) global disruption of the clock genes Period1 (Per1) and Per2 recapitulates this amplified macrophage proinflammatory activation, 3) adoptive transfer of Per1/2-disrupted bone marrow cells into wild-type mice potentiates high fat diet-induced adipose and liver tissue inflammation and systemic insulin resistance, and 4) Per1/2-disrupted macrophages similarly exacerbate inflammatory responses and decrease insulin sensitivity in co-cultured adipocytes in vitro. Furthermore, PPARγ levels are decreased in Per1/2-disrupted macrophages and PPARγ2 overexpression ameliorates Per1/2 disruption-associated macrophage proinflammatory activation, suggesting that this transcription factor may link the molecular clockworks to signaling pathways regulating macrophage polarization. Thus, macrophage circadian clock dysregulation is a key process in the physiological cascade by which diet-induced obesity triggers macrophage proinflammatory activation, adipose tissue inflammation, and insulin resistance.
Introduction
Obesity is highly associated with systemic insulin resistance and the consequential development of a wide variety of metabolic diseases including type 2 diabetes (1), fatty liver disease (2), and cardiovascular disease (3). Over the past decade, adipose tissue inflammation has been increasingly regarded as a causal factor of obesity-associated insulin resistance (4–8). As demonstrated in mice fed a high fat diet (HFD),4 adipose tissue develops low grade inflammation that is characterized by increased infiltration of immune cells and production of proinflammatory cytokines (4, 5). The diet-induced proinflammatory signaling coupled with increased production of pro-hyperglycemic factors (e.g. free fatty acids and resistin) and decreased production of anti-hyperglycemic factors (e.g. adiponectin) that reflect inflammation-associated adipose tissue dysfunction (9–12) collectively impair insulin signaling in insulin-sensitive tissues including the liver and skeletal muscle, leading to systemic insulin resistance (13–18). In contrast, treatment with thiazolidinediones or supplementation with fish oils ameliorates adipose tissue inflammation, which in turn contributes to the reversal of diet-induced adipose tissue dysfunction and systemic insulin resistance (19–21). As such, obesity-associated inflammation is key to the regulation of systemic insulin sensitivity.
In relation to the link between inflammation and metabolic dysregulation in obesity, there is increasing evidence that dysregulated macrophage functional plasticity and versatility (polarization) is a key component of the mechanism by which inflammation in adipose and liver tissues mediates the development of obesity-associated insulin resistance and metabolic diseases. For example, in diet-induced obesity, adipose tissue macrophage infiltration is increased, and polarization is shifted toward the proinflammatory M1 activation, resulting in increased production of proinflammatory cytokines and potentiation of adipose tissue inflammation that contribute to impaired systemic insulin sensitivity (22). Within macrophages, peroxisome proliferator-activated receptor γ and δ (PPARγ/δ) are key transcription factors that stimulate macrophage alternative M2 (anti-inflammatory) activation (23–25). Importantly, myeloid cell-specific disruption of PPARγ and/or PPARδ increases proinflammatory activation of adipose tissue macrophages and exacerbates obesity-associated insulin resistance (6, 23). In contrast, the effect of PPARγ activation on reversing HFD-induced insulin resistance is mediated at least in part by stimulation of alternative activation of macrophages in adipose tissue (20). Macrophage polarization is also regulated by Toll-like receptor 4 (TLR4) and/or c-Jun N-terminal kinase (JNK) such that their myeloid cell-specific disruption protects mice from diet-induced adipose tissue inflammation and systemic insulin resistance (26–28). As such, these findings demonstrate how the inflammatory status of macrophages governs the outcome of adipose tissue inflammation and systemic insulin sensitivity.
Circadian clocks in peripheral tissues and cells drive daily rhythms and coordinate many physiological processes including inflammation and metabolism. Recent observations suggest that circadian clock dysregulation plays a key role in the development of metabolic diseases including obesity and diabetes. Studies using mice with genetic mutation or deletion of core clock genes correspondingly indicate that global and adipocyte-specific disruption of circadian clock function produces obesity or significant alterations in metabolism (29–31). However, the specific mechanism underlying the link between circadian clock- and metabolic-dysregulated phenotypes is unknown. As key components of inflammation in obesity, macrophages contain cell-autonomous circadian clocks that have been shown to gate macrophage inflammatory responses including rhythms in lipopolysaccharide (LPS)-induced cytokine secretion (32, 33). Because HFD induces adipose tissue circadian clock dysregulation in conjunction with adipose tissue macrophage proinflammatory activation (34) and environment-mediated circadian disruption amplifies macrophage proinflammatory responses (35), our hypothesis is that over-nutrition causes circadian clock dysregulation, which in turn induces macrophage proinflammatory activation in adipose tissue so as to exacerbate inflammation and fat deposition, thus leading to systemic insulin resistance. To test this hypothesis, we conducted a series of experiments to determine whether 1) HFD induces circadian clock dysregulation along with proinflammatory activation in indigenous and adipose tissue macrophages, 2) genetic disruption of the clock mechanism using mice with targeted mutations of the clock genes Period1 (Per1) and Per2 (Per1ldc/Per2ldc) alters macrophage proinflammatory status, 3) PPARγ plays a role in the proinflammatory activation of Per1/2-disrupted macrophages, and 4) adoptive transfer or co-culture of Per1/2-disrupted macrophages potentiates inflammatory responses and pathophysiology of adipose tissue in diet-induced obesity or adipocytes in vitro.
EXPERIMENTAL PROCEDURES
Animal Experiments
Animals used in this study were derived from wild-type (WT) C57BL/6J mice and 129J mice obtained from The Jackson Laboratory (Bar Harbor, ME) and from breeding pairs of homozygous mPer2Luc knockin mice (C57BL/6J background; generously provided by Dr. Joseph Takahashi, UT Southwestern Medical School, Dallas, TX) and homozygous mutant mice with targeted disruption of the clock genes, Per1 and Per2 (Per1ldc/Per2ldc; generously provided by Dr. David Weaver, University of Massachusetts Medical School, Worcester, MA). In homozygous mPer2Luc mice, a luciferase (Luc) gene was fused in-frame to the C terminus of the endogenous mPER2 coding sequence so as to enable continuous recording of Per2 oscillations via luciferase bioluminescence (36). Establishment, genotyping, and phenotype of Per1ldc/Per2ldc mutant mice (129J background) have been described previously (37). Per1ldc/Per2ldc mice are distinguished by a loss of circadian rhythmicity as well as altered expression and circadian regulation of other clock genes (37). In different peripheral tissues, Per1ldc/Per2ldc mutant mice consistently showed increased BMAL1 (∼600%) and increased CLOCK (∼65%) protein levels relative to WT controls.5 All mice were maintained on a 12:12-h light-dark cycle (lights on at 06:00). At 5–6 weeks of age, male wild-type C57BL/6J mice were fed an HFD (60% fat calories, 20% protein calories, and 20% carbohydrate calories) or a low fat diet (LFD, 10% fat calories, 20% protein calories, and 70% carbohydrate calories) for 12 weeks as previously described (7, 8). After the feeding regimen, mice were fasted for 4 h before sacrifice for collection of blood and tissue samples (38, 39). Epididymal, mesenteric, and perinephric fat depots were dissected and weighed as abdominal fat mass (39). After weighing, adipose tissue and liver samples were either fixed and embedded for histological and immunohistochemical analyses or frozen in liquid nitrogen and stored at −80 °C for further analyses. Some mice were fasted similarly and used for insulin and glucose tolerance tests and/or and insulin signaling analyses as described below. To examine the dietary effect on in vivo circadian clock rhythmic in relation to obesity-associated metabolic phenotypes, mPer2Luc mice were subjected to HFD feeding. Briefly, female homozygous mPer2Luc mice at 5–6 weeks of age were fed an HFD for 12 weeks. Age- and gender-matched mPer2Luc mice were fed an LFD and used as controls. After the feeding regimen mPer2Luc mice were subjected to the same assays used for C57BL/6J mice. Additionally, both HFD-fed and LFD-fed mPer2Luc mice were subjected to examination of wheel-running locomotor activity rhythms as previously described (40). Some age-matched female mPer2Luc mice were fed ad libitum and used for isolation of bone marrow cells.
To address a role for circadian clock rhythmic dysregulation in altering macrophage activation in relation to metabolic homeostasis, Per1ldc/Per2ldc mice were used for the present study. Accordingly, Per1ldc/Per2ldc mice (129J background) and wild-type 129J mice were maintained on a 12:12-h light-dark cycle (lights on at 06:00) and fed ad libitum. At 5–6 weeks of age, male Per1ldc/Per2ldc mice and wild-type 129J mice were anesthetized by ketamine (100 mg/kg)/xylazine (10 mg/kg of body weight). Immediately after euthanasia, Per1ldc/Per2ldc mice and wild-type 129J mice were subjected to isolation of bone marrow cells as previously described (24, 27). The isolated bone marrow cells were used for in vitro analyses and served as donor cells for bone marrow transplantation (BMT). Briefly, male wild-type C57BL/6J recipient mice at 5–6 weeks of age were lethally irradiated and subjected to BMT to generate chimeric mice using the established method (24, 26). Wild-type C57BL/6J mice that were transplanted with donor cells from Per1ldc/Per2ldc mice were referred to as BMT-Per1ldc/Per2ldc mice. Wild-type C57BL/6J mice that were transplanted with donor cells from wild-type 129J mice were referred to as BMT-WT mice. After recovery for 4 weeks, all chimeric mice were subjected for HFD feeding for 12 weeks followed by metabolic assays. All study protocols were reviewed and approved by the Institutional Animal Care and Use Committee of Texas A&M University.
Macrophage Differentiation and Characterization
Bone marrow cells were isolated from the tibias and femurs of LFD- and/or HFD-fed mPer2Luc mice as previously described (23). After differentiation with Iscove's modified Dulbecco's medium containing 10% fetal bovine serum and 15% L929 culture supernatant for 8 days, bone marrow-derived macrophages (BMDMs) were subjected to inflammatory assays and circadian rhythm analyses using a lumicycle. Similarly, bone marrow cells were isolated from chow diet-fed Per1ldc/Per2ldc mice and 129J WT control mice and differentiated into BMDM for FACS analyses using flow cytometry with fluorescence-conjugated antibodies against F4/80 and CD11b as well as CD11c and CD206. For PPARγ rescue experiment, Per1ldc/Per2ldc BMDM were treated with a PPARγ2-expressing lentiviral vector or a control vector for 24 h according to procedures provided with commercial kits (GenTarget Inc, San Diego, CA). WT BMDM (129J background) were treated similarly with a control vector and served as the control (Ctrl). Untreated WT BMDM were also included as controls. After incubation for an additional 24 h, the treated BMDM were subjected to inflammatory analyses. To examine macrophage proinflammatory activation, BMDM were treated with LPS (100 ng/ml) or PBS for 30 min before cell harvest to examine the inflammatory signaling using Western blot analyses. Some cells were treated with or without LPS at the same dose for 6 h before harvest of RNA samples. Some cells were subjected to FACS analyses as described below.
Confirmation of Per1/2 Disruption
Genomic DNA was prepared from the tails of Per1ldc/Per2ldc mice and 129J wild-type mice as well as bone marrow cells, bone marrow-derived macrophages, and adipose tissue and liver samples of chimeric mice and subjected to PCR genotyping using previously described methods (41).
Insulin and Glucose Tolerance Tests
Mice were fasted for 4 h and intraperitoneally injected with insulin (1 unit/kg of body weight) or d-glucose (2 g/kg of body weight). For insulin tolerance tests, blood samples (5 μl) were collected from the tail vein before and at 15, 30, 45, and 60 min after the bolus insulin injection. Similarly, for glucose tolerance tests blood samples were collected from the tail vein before and at 30, 60, 90, and 120 min after the glucose bolus injection (7, 8).
Measurement of Metabolic Parameters
The levels of plasma glucose, triglycerides, and free fatty acids were measured using metabolic assay kits (Sigma and BioVision, Mountain View, CA). The levels of plasma insulin were measured using ELISA kits (Crystal Chem Inc., Downers Grove, IL).
Isolation of Stromal Vascular Cells from Adipose Tissue
Adipose tissue stromal vascular cells (SVCs) were isolated using the collagenase digestion method as previously described (7, 20). After digestion and centrifugation, the pelleted cells were collected as SVC. Adipose tissue SVC from mPer2Luc mice were subjected to bioluminescence analysis as previously described (41). SVC from HFD-fed BMT-Per1ldc/Per2ldc and BMT-WT mice were subjected to FACS analyses and other assays.
Circadian Properties of mPer2Luc SVC and BMDM Cells
SVC and BMDM prepared from LFD- and/or HFD-fed mPer2Luc mice were suspended in supplemented Dulbecco's modified Eagle's medium (DMEM) (for SVC) or Iscove's modified Dulbecco's medium (for BMDM) and then plated on 35-mm culture dishes (Corning). For both cell types, the medium was changed ∼24 h after plating so as to reduce the FBS concentration to 5%, and about 12 h later cultures were exposed to medium containing 50% adult horse serum for 2 h. Thereafter, serum-shocked SVC and BMDM were maintained in serum-free recording medium containing 0.1 mm beetle luciferin (Promega), 25 units/ml penicillin, and 25 μg/ml streptomycin for bioluminescence analysis as described previously (40). Individual cultures were sealed airtight with sterile glass coverslips (VWR) and sterile silicon grease (Dow Corning). The temporal patterns of mPER2::LUC bioluminescence were analyzed using an automated 32-channel luminometer (LumiCycle; Actimetrics, Wilmette, IL) that was maintained within a standard cell culture incubator at 35 °C. Bioluminescence from individual cultures was continuously recorded with a photomultiplier tube (PMT) for ∼70 s at intervals of 10 min. Because of the transient induction of bioluminescence after the medium change at the initiation of this analysis, the first cycle was excluded from data analysis. Bioluminescence data were analyzed using the Lumicycle Analysis program (Actimetrics). For each raw data set, base-line drift was removed by fitting a polynomial curve with an order equal to one less than the number of recorded cycles. Rhythm parameters were determined from base-line-subtracted data using Levenberg-Marquardt algorithm (damped Sine) fit.
Flow Cytometry Analysis
Tibias/femurs were obtained from LFD- or HFD-fed mPer2Luc (n = 3) and from chow diet-fed Per1ldc/Per2ldc mice and 129J wild-type mice (n = 3) and pooled to obtain sufficient BMDM. Epididymal fat pads were obtained from HFD-fed BMT-Per1ldc/Per2ldc mice and BMT-WT mice to prepare SVC samples (n = 4–6). BMDM and adipose tissue SVC were stained with fluorescence-tagged antibodies (anti-F4/80 and anti-CD11b for macrophages and anti-CD11c and anti-CD206 for macrophage activation as previously described (42)) and subjected to FACS analyses using BD FACSAria II flow cytometer (BD Biosciences) that is operated by Texas A&M Health Science Center College of Medicine Cell Analysis Facility. Briefly, the harvested cells were analyzed based on FSC-A and SSC-A. Live cells were then examined for F4/80 (FITC) and CD11b allophycocyanin (APC) expression. Mature macrophages (F4/80+ CD11b+ cells) were then gated for CD11c (phycoerythrin (PE)/Cy7) and CD206 (PE) expression (macrophage polarization). Mature macrophages that were positive for CD11c but negative for CD206 were considered as M1 macrophages (F4/80+ CD11b+ CD11c+ CD206− cells).
Co-culture of Macrophages and Adipocytes
BMDM were prepared from Per1ldc/Per2ldc and 129J wild-type control mice. Adipocytes were differentiated from 3T3-L1 cells in DMEM supplemented with 10 μg/ml insulin, 1 μm dexamethasone, and 0.5 mm 3-isobutyl-1-methyl-xanthine for 48 h followed by incubation for an additional 6–8 days in growth medium supplemented with 10 μg/ml insulin (7, 43). After differentiation, adipocytes were co-cultured with BMDM at a ratio of 10:1 based on the published method (24). To examine changes in inflammatory signaling, the cells were treated with or without LPS (10 ng/ml) for 30 min before cell harvest. Some cells were treated with or without insulin (100 nm) for 30 min before harvest for determination of changes in insulin signaling. Cell lysates were prepared and used to examine inflammatory and insulin signaling using Western blot analyses. Additionally, some co-culture cells were treated with or without LPS (10 ng/ml) for 6 h and subjected to preparation of RNA samples to quantify gene expression using real-time reverse transcription PCR.
Western Blots
Lysates were prepared from frozen tissue samples and cultured cells using the lysis buffer containing 50 mm HEPES (pH 7.4), 1% Triton X-100, 50 mm sodium pyrophosphate, 0.1 m sodium fluoride, 10 mm EDTA, 10 mm sodium orthovanadate, 10 μg/ml aprotinin, 10 μg/ml leupeptin, 2 mm benzamidine, and 2 mm phenylmethylsulfonyl fluoride. The levels of JNK1/2, phospho-JNK1/2, nuclear factor κB (NF-κB) p65, phospho-p65 (Ser-536), Akt1/2, phospho-Akt (Ser-473), and PPARγ in cell lysates (15 or 50 μg/lane) were analyzed using 8% Tris-glycine gels and rabbit anti-serum as a primary antibody at a 1:1000 dilution. The blot was followed by a 1:10,000 dilution of goat anti-rabbit horseradish peroxidase-conjugated secondary antibody kit (ImmobilonTM Western; EMD Millipore, Billerica, MA) as previously described (39). GAPDH or β-actin was used as a loading control. The maximum intensity of each band was quantified using ImageJ software. Ratios of PJNK1/JNK1 and phospho-p65/p65 as well as phospho-Akt/Akt were normalized to GAPDH or β-actin and adjusted relative to the average of control (PBS)-treated LFD, wild type, Per1ldc/Per2ldc, BMT-WT, or Adi/wild type, which was arbitrarily set as 1 (arbitrary units).
RNA Isolation, Reverse Transcription, and Real-time PCR
The total RNA was isolated from frozen tissue samples and cultured/isolated cells. Reverse transcription was performed using the GoScriptTM Reverse Transcription System (Promega), and real-time PCR analysis was performed using SYBR Green (ABI Prism 7200 Sequence Detection System; Applied Biosystems) (44, 45). The mRNA levels were analyzed for interleukin-1β (IL-1β), IL-6, tumor necrosis factor α (TNFα), IL-10, arginase1, monocyte chemoattractant protein 1 (MCP1), TLR4, adiponectin, hormone-sensitive lipase, resistin, sterol regulatory element-binding protein 1c (SREBP1c), acetyl-CoA carboxylase 1, fatty acid synthase (FAS), glucokinase, and glucose-6-phosphatase in tissue and/or cell samples. A total of 0.1 μg of RNA was used for the determination. Results were normalized to 18 S ribosomal RNA or β-actin mRNA and plotted as relative expression to the average of control (PBS)-treated LFD, wild type, Per1ldc/Per2ldc, BMT-WT, or Adi/wild-type, which was arbitrarily set as 1.
Statistical Methods
Numeric data are presented as the means ± S.E. Statistical significance was assessed by unpaired, two-tailed analysis of variance or Student's t tests. Differences were considered significant at the two-tailed p < 0.05.
RESULTS
HFD Feeding Induces Adiposity, Adipose Tissue Inflammation, Systemic Insulin Resistance, and Circadian Clock Dysregulation
Consistent with established observations (4, 5, 7), HFD-fed C57BL/6J mice displayed increased adiposity, adipose tissue inflammation, and systemic insulin resistance (data not shown). To address a possible link between metabolic phenotype and alterations in circadian clock function, homozygous mPer2Luc knockin mice (C57BL/6J background) were subjected to an identical feeding regimen. After HFD feeding for 12 weeks, mPer2Luc mice exhibited a marked increase in body weight and abdominal fat mass compared with LFD-fed mice (Fig. 1, A and B). Additionally, HFD-fed mPer2Luc mice exhibited a significant increase in the severity of insulin resistance and glucose intolerance (Fig. 1, C and D) as well as an increase in the period of the circadian rhythm of wheel-running behavior (Fig. 1E).
FIGURE 1.

Over-nutrition induces obesity-associated circadian clock dysregulation. At 5–6 weeks of age, mPer2Luc mice were fed an HFD or a LFD for 12 weeks (n = 5–10). A, body weight was recorded weekly during the feeding regimen. B, adipose mass. Abdominal fat mass was calculated from the sum of gonadal and perinephric fat content. C, insulin tolerance tests. D, glucose tolerance tests. E, representative circadian rhythms of wheel-running activity in LFD- and/or HFD-fed mice during exposure to constant darkness. The bar graph depicts differences in the free-running period of the activity rhythm between treatment groups. For A–E, data are the means ± S.E. in line and bar graphs. *, p < 0.05; **, p < 0.01; ***, p < 0.001, HFD versus LFD (E, right panel) for the same time point (A, C, and D) or the same fat pad (B). For B–D, mice were fasted for 4 h starting at the same time of the day before tissue collection or physiological assays. For C and D, mice were given a peritoneal injection of insulin (1 unit/kg) (C) or glucose (2 g/kg) (D).
HFD Feeding Lengthens the Period of Clock Gene Oscillations in Adipose Tissue Stromal Vascular Cells and Bone Marrow-derived Macrophages and Increases Macrophage Proinflammatory Activation
Given the role of macrophages in inflammation (5, 7), we analyzed circadian oscillations of the clock gene Per2 in adipose tissue SVC, the immune cell-containing fraction of collagenase-digested visceral fat that has been widely used to examine the inflammatory status of adipose tissue macrophages (5, 23), and BMDM derived from mPer2Luc mice. SVC cultures from LFD-fed mice exhibited robust mPER2::LUC rhythms with a circadian period of 25.06 ± 0.4 h (Fig. 2A). However, SVC cultures from HFD-fed mice were characterized by mPER2::LUC rhythms in which the period was significantly increased by ∼9 h (Fig. 2A). Similarly, the period of BMDM rhythms in mPER2::LUC bioluminescence was significantly increased in cultures from HFD-fed mPer2Luc mice relative to those from LFD-fed mice (Fig. 2B). BMDM cultures from HFD-fed mPer2Luc mice were also distinguished by robust decreases in the amplitude of the mPER2::LUC rhythm. When the inflammatory status was analyzed under basal conditions (PBS-treated), the phosphorylation of JNK1 (p46, the key JNK isoform that mediates proinflammatory signaling) and NF-κB p65 in BMDM from HFD-fed mPer2Luc mice did not significantly differ from that in BMDM from LFD-fed mice. However, upon LPS treatment, the phosphorylation of JNK1 and NF-κB p65 (Ser-536) in BMDM from HFD-fed mPer2Luc mice was significantly increased by 2.1- and 1.6-fold, respectively, compared with that in BMDM from LFD-fed mice (Fig. 2C). Moreover, under both basal and LPS-treated conditions, IL-1β, IL-6, and TNFα mRNA levels in BMDM from HFD-fed mPer2Luc mice were increased significantly relative to their respective levels in BMDM from LFD-fed mice (Fig. 2D). Thus, over-nutrition increases macrophage proinflammatory activation in concert with its effects on altering the timekeeping function of the macrophage circadian clockworks.
FIGURE 2.

Over-nutrition lengthens the period of clock gene oscillations in adipose tissue SVC and in macrophages and enhances macrophage proinflammatory activation. At 5–6 weeks of age, mPer2Luc mice were fed an HFD or LFD for 12 weeks (n = 5–6). A and B, representative recordings of ensemble PER2::LUC bioluminescence (expressed as detrended base-line-subtracted counts per second) from cultured adipose tissue SVC (A) or BMDM (B). Bar graphs depict group differences in PER2::LUC rhythm period between treatment groups. C, macrophage inflammatory signaling. Before harvest, BMDM were treated with LPS (100 ng/ml) or PBS for 30 min. The levels of JNK1 (p46), phospho-JNK1, NF-κB p65, and phospho-p65 (Ser-536) were examined using Western blot analyses and quantified using densitometry. D, macrophage IL-1β, IL-6, and TNF-α mRNA expression. Before harvest, BMDM were treated with LPS (100 ng/ml) or PBS for 6 h. IL-1β and TNF-α mRNA levels were quantified using real-time PCR and plotted as relative expression. For bar graphs (A–D), data are the means ± S.E. *, p < 0.05; **, p < 0.01 HFD versus LFD (A and B) under the same conditions (PBS or LPS) (C and D).
Circadian Clock Disruption Increases Macrophage Proinflammatory Activation
To address a direct role for circadian clock disruption in altering macrophage inflammatory status, BMDM obtained from mutant mice with targeted disruption of the clock genes Per1 and Per2 (Per1ldc/Per2ldc, 129J background) characterized by a loss of circadian rhythmicity (37) and from WT 129J mice were subjected to FACS analyses. Among the analyzed cells, >95% of a total of 20,000–30, 000 cells were mature macrophages (F4/80+ CD11b+ cells) (Fig. 3A, quantitative data not included). Mature macrophages were then examined for activation status based on CD11c and CD206 expression (Fig. 3B). Compared with controls, BMDM from Per1ldc/Per2ldc mutant mice displayed a significantly higher percentage of proinflammatory (M1) macrophages (F4/80+ CD11b+ CD11c+ CD206− cells) and no difference in percentage of anti-inflammatory (M2) macrophages (F4/80+ CD11b+ CD11c− CD206+ cells) (Fig. 3C). When inflammatory signaling was examined under basal conditions (PBS-treated), BMDM levels of JNK1 phosphorylation remained low with no genotype-based differences (Fig. 3D). However, in response to LPS, the phosphorylation of JNK1 in BMDM from Per1ldc/Per2ldc mice was significantly increased compared with that in BMDM from WT mice. Additionally, under both basal and LPS-treated conditions, NF-κB p65 phosphorylation (Ser-536) in BMDM from Per1ldc/Per2ldc mice was significantly higher than that in BMDM from WT mice. Among proinflammatory cytokines that were examined, IL-1β and TNFα mRNA expression in BMDM under both basal and LPS-treated conditions differed in accord with genotype (Fig. 3E). Compared with controls, BMDM from Per1ldc/Per2ldc mice exhibited significant increases in both basal and LPS-induced expression of IL-1β and TNFα mRNA. The levels of IL-6 mRNA did not differ between genotypes. Thus, circadian clock malfunction associated with targeted disruption of Per 1 and Per 2 recapitulates macrophage proinflammatory activation induced by over-nutrition (Fig. 2).
FIGURE 3.

Per1/2 disruption increases macrophage proinflammatory activation. BMDM were prepared from chow diet-fed wild-type mice and Per1ldc/Per2ldc mice with targeted disruption of the clock genes Per1 and Per2 (n = 4–6). A, representative plots of macrophage purity and gating. BMDM were included without (left panel) or with (right panel) FITC-labeled anti-F4/80 and allophycocyanin (APC)-labeled anti-CD11b antibodies and examined for FITC and APC intensities. B and C, BMDM were examined for F4/80 and CD11b expression. Mature macrophages (F4/80+ CD11b+ cells) were then gated for CD11c and CD206 expression. Panels in B, representative plots of proinflammatory (M1) macrophages (F4/80+ CD11b+ CD11c+ CD206− cells) and anti-inflammatory (M2) macrophages (F4/80+ CD11b+ CD11c− CD206+ cells); bar graph in C, top panel for the percentages of M1 macrophages (upper left quadrant of panels in B) in mature macrophages and bottom panel for M2 macrophages (bottom right quadrant of panels in B). D, macrophage inflammatory signaling. Before harvest BMDM were treated with LPS (100 ng/ml) or PBS for 30 min. The levels of total and phosphorylated JNK1 (p46) and NF-κB p65 were examined using Western blot analyses and quantified using densitometry. E, macrophage mRNA levels of proinflammatory cytokines. Before harvest, BMDM were treated with LPS (100 ng/ml) or PBS for 6 h. The mRNA levels of IL-1β, IL-6, and TNFα were quantified using real-time PCR and plotted as relative expression. For bar graphs (C–E), data are the means ± S.E. *, p < 0.05; **, p < 0.01 Per1ldc/Per2ldc versus wild-type (C) under the same conditions (PBS or LPS) (D and E).
PPARγ2 Overexpression Ameliorates Per1/2 Disruption-associated Macrophage Proinflammatory Activation
In subsequent mechanistic analyses, we next examined the expression of PPARγ because activation of this transcription factor stimulates macrophage alternative (anti-inflammatory) activation (20, 23), and its promoter region contains multiple E-boxes that bind the basic helix-loop-helix protein complexes formed by the core elements of the molecular clock brain muscle ARNT-like protein 1 (BMAL1) and circadian locomotor output cycles kaput (CLOCK) (46). PPARγ protein levels in BMDM from Per1ldc/Per2ldc mice were significantly decreased by 40–60% relative to that observed in untreated and control vector-treated WT BMDM (Fig. 4A). To address the potential involvement of PPARγ in Per1/2 regulation of macrophage activation, we next determined whether overexpression of PPARγ2, one of the two PPARγ isoforms that effectively mediates PPARγ actions (47), ameliorates the inflammatory status of BMDM from Per1ldc/Per2ldc mice. In comparison with cultures infected with a control vector, PPARγ2 overexpression in Per1ldc/Per2ldc-derived BMDM significantly increased PPARγ content by 2.5-fold (Fig. 4A) and significantly reduced the phosphorylation of JNK1 and NF-κB p65 (Ser-536) in response to LPS treatment (Fig. 4B). IL-1β and TNFα mRNA levels were similar under basal conditions in Per1ldc/Per2ldc controls and PPARγ2-overexpressing Per1ldc/Per2ldc BMDM. However, the LPS-mediated induction of IL-1β and TNFα, but not IL-6, mRNA levels in PPARγ2-overexpressing Per1ldc/Per2ldc BMDM was significantly decreased relative to that found in control-treated Per1ldc/Per2ldc BMDM (Fig. 4C). Consistent with these observations, FACS analysis revealed that among analyzed mature macrophages, Per1ldc/Per2ldc controls showed a higher percentage of M1 macrophages compared with WT control cells. Importantly, PPARγ2 overexpression in Per1ldc/Per2ldc BMDM induced a significant decrease in the percentage of M1 macrophages relative to that observed in control-treated cells (Fig. 4D). Among three groups of BMDM (control-treated WT, control-treated Per1ldc/Per2ldc, PPARγ2-overexpressing Per1ldc/Per2ldc), the percentages of M2 macrophages did not differ significantly. Thus, PPARγ may play a role in the mechanism by which Per1/2 disruption up-regulates macrophage proinflammatory activation.
FIGURE 4.

PPARγ2 overexpression ameliorates Per1/2 disruption-associated macrophage proinflammatory activation. BMDM were prepared from chow diet-fed wild-type mice and Per1ldc/Per2ldc mice with targeted disruption of the clock genes Per1 and Per2 (n = 4–8). A, lysates of untreated macrophages as well as PPARγ2-expressing-lentivirus- and/or control-lentivirus-treated macrophages were examined for PPARγ content. For the bar graph, PPARγ content was examined using Western blot analyses and quantified using densitometry. B, macrophage inflammatory signaling. Before harvest, BMDM were treated with LPS (100 ng/ml) or PBS for 30 min. The levels of total and phosphorylated JNK1 (p46) and NF-κB p65 were examined using Western blot analyses and quantified using densitometry. C, macrophage levels of IL-1β, IL-6, and TNFα mRNA. Before harvest, BMDM were treated with LPS (100 ng/ml) or PBS for 6 h. The mRNA levels of cytokines were quantified using real-time PCR and plotted as relative expression. D, the percentages of M1/M2 macrophages were examined using FACS analysis. For A–D, Per1ldc/Per2ldc-BMDM were infected with a lentivirus containing the cDNA of human PPARγ2 or a control lentivirus at 6 days after differentiation for 24 h. Control vector-treated WT BMDM were included for comparison. The infected cells were incubated for an additional 48 h and subjected to the pertinent assays. For bar graphs (A–D), data are the means ± S.E. *, p < 0.05; **, p < 0.01 Per1ldc/Per2ldc versus wild-type for infected cells (A and D) under the same conditions (C); †, p < 0.05 and †† p < 0.01 Per1ldc/Per2ldc+PPARγ2 versus Per1ldc/Per2ldc (A and D) under LPS-treated condition (B and C). AU, arbitrary units.
Myeloid Cell-specific Per1/2 Disruption Exacerbates Adipose Tissue Inflammation in Obesity
The inflammatory status of macrophages governs the outcome of adipose tissue inflammation and thereby systemic insulin sensitivity (22, 23). To address the impact of macrophage-specific circadian clock on HFD-induced adipose tissue inflammation, bone marrow cells were isolated from Per1ldc/Per2ldc mutant and WT mice and then transplanted into lethally irradiated WT recipient (C57BL/6J) mice (BMT). After HFD feeding for 12 weeks and subsequent and metabolic characterization, bone marrow cells, BMDM, and adipose-derived SVC as well as adipose and liver tissues from chimeric mice were genotyped to identify WT and targeted alleles (Per1, Per2) and confirm bone cell repopulation. In BMT-WT mice (recipients, WT C57BL/6J mice; donors, WT 129J mice), genotyping of all genomic DNA samples revealed PCR products for only WT alleles (Fig. 5, A–E). In contrast, genomic DNA from all of these tissues/cells except BMDM in BMT-Per1ldc/Per2ldc mice (recipients, WT C57BL/6J mice; donors, Per1ldc/Per2ldc mice) showed PCR products for WT and mutant alleles. Genotyping of BMDM genomic DNA from BMT-Per1ldc/Per2ldc mice only yielded PCR products for mutant alleles (Fig. 5B). These results demonstrate the success of adoptive transfer of Per1/2-disrupted myeloid cells to WT recipient mice.
FIGURE 5.
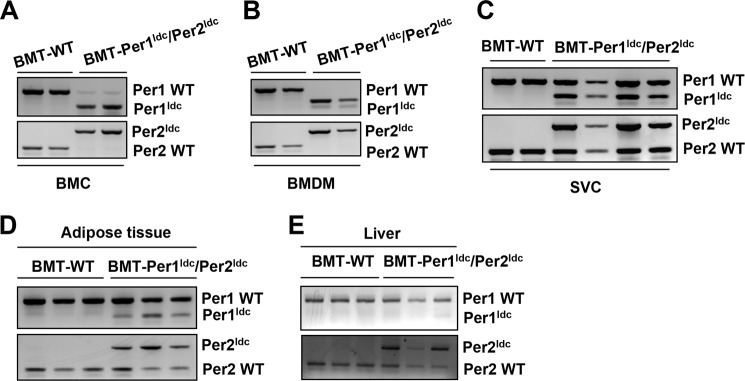
Confirmation of bone marrow cell repopulation. Bone marrow cells from WT 129J mice and Per1ldc/Per2ldc (129J background) mice were transplanted into lethally irradiated male WT C57BL/6J mice (at 5–6 weeks of age). After recovery for 4 weeks, chimeric mice (BMT-WT and BMT-Per1ldc/Per2ldc) were fed an HFD for 12 weeks. After the feeding regimen, genomic DNA was isolated from both isolated cells, and tissue samples were obtained from all chimeric mice and then subjected to PCR genotyping analyses to identify WT and targeted alleles (Per1, Per2) and confirm bone cell repopulation. The amplified band of smaller size (∼235 bp, top panel) signifies the Per1 targeted alleles, whereas the PCR product of larger size (∼403 bp, bottom panel) denotes the Per2 targeted alleles in bone marrow cells (A), BMDM (B), adipose tissue SVC (C), adipose tissue (D), and liver (E).
When adipose tissue inflammatory status was examined, the phosphorylation of JNK1 and NF-κB p65 (Ser-536) in HFD-fed BMT-Per1ldc/Per2ldc mice was significantly increased (Fig. 6A) compared with that in HFD-fed BMT-WT. Additionally, adipose tissue IL-1β, IL-6, and TNFα mRNA levels in HFD-fed BMT-Per1ldc/Per2ldc mice were significantly higher than their respective levels in HFD-fed BMT-WT mice (Fig. 6B), whereas BMT genotype had no significant effect on the mRNA levels of arginase 1 and IL-10, which are indicative of macrophage alternative activation. Next, adipose-derived SVC were subjected to FACS analyses. After HFD feeding, SVC of BMT-Per1ldc/Per2ldc mice displayed a 1.8-fold increase in mature macrophages (F4/80+ CD11b+ cells) compared with those of BMT-WT mice (Fig. 6C). Upon analyzing the inflammatory status of the mature macrophages, adipose tissue SVC isolated from BMT-Per1ldc/Per2ldc mice showed a 2-fold increase in the overall percentage of proinflammatory macrophages (F4/80+ CD11b+ CD11c+ CD206− cells) relative to that observed in BMT-WT mice (Fig. 6D). In contrast, the percentage of M2 macrophages in adipose tissue SVC did not differ between the WT and mutant groups. Thus, myeloid cell-specific Per1/2 disruption increases adipose tissue infiltration of proinflammatory macrophages, thereby exacerbating HFD-induced adipose tissue inflammatory responses.
FIGURE 6.

Myeloid cell-specific Per1/2 disruption exacerbates HFD-induced adipose tissue inflammation. Chimeric mice (BMT-WT and BMT-Per1ldc/Per2ldc) were fed an HFD for 12 weeks (n = 6–10). Before tissue collection, mice were fasted for 4 h starting at the same time of the day. A, adipose tissue inflammatory signaling. The levels of total and phosphorylated JNK1 (p46) and NF-κB p65 were examined using Western blot analyses and quantified using densitometry. B, adipose tissue expression of genes related to macrophage polarization. The mRNA levels of cytokines and arginase1 were quantified using real-time PCR and plotted as relative expression. C, FACS analyses of macrophage infiltration in epididymal fat pads of HFD-fed chimeric mice. Left two panels, representative plots of adipose tissue SVC that were quantified for F4/80 and CD11b expression; right panel, percentages of mature macrophages (F4/80+ CD11b+ cells). D, quantification of proinflammatory (M1) macrophages (F4/80+ CD11b+ CD11c+ CD206− cells), and anti-inflammatory (M2) macrophages (F4/80+ CD11b+ CD11c− CD206+ cells) in SVC isolated from adipose tissue of HFD-fed chimeric mice. For bar graphs (A–D), data are the means ± S.E. *, p < 0.05; **, p < 0.01 BMT-Per1ldc/Per2ldc versus BMT-WT (A, C, and D) for the same gene (B). AU, arbitrary units.
Myeloid Cell-specific Per1/2 Disruption Exacerbates Adiposity and Adipose Tissue Dysfunction
Next, we examined the effects of myeloid cell-specific circadian clock disruption on adipose tissue metabolic responses in WT recipients. In response to HFD feeding, BMT-Per1ldc/Per2ldc mice gained much more abdominal fat mass and displayed a greater increase in adiposity than BMT-WT mice (Fig. 7, A and B). Consistent with these changes, the size of most adipocytes in adipose tissue was larger in BMT-Per1ldc/Per2ldc mice than in BMT-WT mice (Fig. 7C). Locally, adipose tissue of HFD-fed BMT-Per1ldc/Per2ldc mice showed a significant decrease in insulin-induced Akt phosphorylation (Ser-473) relative to that observed in HFD-fed BMT-WT mice (Fig. 7D), and this decrease was accompanied by decreased adipose tissue expression of mRNAs encoding adiponectin, an adipokine that improves systemic insulin sensitivity, and hormone-sensitive lipase (Fig. 7E), a rate-determining enzyme that controls adipose tissue fat deposition by hydrolyzing triglycerides stored in adipose tissue lipid droplets. Compared with HFD-fed BMT-WT mice, HFD-fed BMT-Per1ldc/Per2ldc mice also showed a significant increase in adipose tissue mRNA levels of resistin, an adipokine that promotes systemic insulin resistance (Fig. 7E); although adipose tissue mRNA levels of MCP1, whose increase in adipocytes attracts macrophage infiltration, and TLR4, an inflammatory receptor, did not differ between HFD-fed BMT-Per1ldc/Per2ldc mice and BMT-WT mice. Together, these results indicate that myeloid cell-specific Per1/2 disruption potentiates HFD-induced adipose tissue dysfunction.
FIGURE 7.

Myeloid cell-specific Per1/2 disruption exacerbates HFD-induced adiposity and adipose tissue insulin resistance. Chimeric mice (BMT-WT and BMT-Per1ldc/Per2ldc) were fed an HFD for 12 weeks (n = 6–10). Before tissue collection or insulin injection, mice were fasted for 4 h starting at the same time of the day. A, adipose mass. Abdominal fat mass was calculated as the sum of epididymal, mesenteric, and perinephric fat content. B, adiposity was calculated by normalizing abdominal fat content to body weight. C, H&E staining of adipose tissue. D, adipose tissue insulin signaling. After fasting, HFD-fed chimeric mice were given a bolus injection of insulin (1 unit/kg of body weight) or PBS into the portal vein. The levels of total and phosphorylated Akt1/2 were examined using Western blot analyses and quantified using densitometry. E, adipose tissue gene expression. The adipose mRNA levels of genes involved in adipose tissue inflammatory and metabolic responses were quantified using real-time PCR and plotted as relative expression. For bar graphs (A, B, D, and E), data are the means ± S.E. *, p < 0.05; **, p < 0.01 BMT-Per1ldc/Per2ldc versus BMT-WT (B) for the same fat pad (A) or under the same condition (insulin in D) or for the same gene (E). AU, arbitrary units.
Per1/2-disrupted Macrophages Increase Adipocyte Inflammatory Responses and Impair Adipocyte Functions
Given the critical role of macrophages in initiating or exacerbating adipose tissue inflammation, we co-cultured macrophages and adipocytes at a 1:10 ratio to address the direct effects of circadian clock disruption on macrophages and/or macrophage factors that regulate adipocyte function. Compared with co-cultures containing adipocytes and WT BMDM (Adi/WT BMDM), adipocytes cultured with Per1ldc/Per2ldc BMDM (Adi/Per1ldc/Per2ldc BMDM) showed a much greater increase in NF-κB p65 (Ser-536) phosphorylation in response to LPS treatment (Fig. 8A). Adipocytes cultured with Per1ldc/Per2ldc BMDM also exhibited a significant increase in IL-1β, IL-6, TNF-α, and resistin mRNA levels and a decrease in adiponectin mRNA levels compared with their respective levels in Adi/WT BMDM co-cultures (Fig. 8B), indicating increased production of pro-insulin resistant and pro-hyperglycemic factors. When insulin signaling was analyzed, adipocytes cultured with Per1ldc/Per2ldc BMDM showed a significant decrease in insulin-induced Akt phosphorylation (Ser-473) compared with Adi/WT BMDM co-cultures (Fig. 8C). Taken together, these results suggest that Per1/2-disrupted macrophages directly increase adipocyte proinflammatory responses and decrease adipocyte insulin sensitivity.
FIGURE 8.

Per1/2-disrupted macrophages increase adipocyte inflammatory responses and impair adipocyte insulin signaling in co-cultures. Adipocytes were co-cultured with macrophages differentiated from bone marrow cells of wild-type (Adi/Wild-type) or Per1ldc/Per2ldc mice (Adi/Per1ldc/Per2ldc) at a 10:1 ratio (adipocytes:macrophages) for 48 h (n = 4–6). A, NF-κB signaling of co-cultured adipocytes. Before harvest, adipocyte-macrophage co-cultures were treated with LPS (100 ng/ml) or PBS for 30 min. The levels of total and phosphorylated NF-κB p65 were examined using Western blot analyses and quantified using densitometry. B, cytokine and adipokine mRNA levels in co-cultured adipocytes were quantified using real-time PCR and plotted as relative expression. C, insulin signaling of co-cultured adipocytes. Before harvest, the co-cultures were treated with insulin (100 nm) or PBS for 30 min. The levels of total and phosphorylated Akt1/2 were examined using Western blot analyses and quantified using densitometry. For bar graphs, data are the means ± S.E. *, p < 0.05; **, p < 0.01 Adi/Per1ldc/Per2ldc versus Adi/Wild-type under the same conditions (LPS in A; insulin in C) for the same gene (B). AU, arbitrary units.
Myeloid Cell-specific Per1/2 Disruption Exacerbates Diet-induced Insulin Resistance and Glucose Intolerance
Macrophage-driven adipose tissue inflammation contributes to the development of systemic insulin resistance (27, 28). We examined systemic pathophysiology. Before HFD feeding, the body weight of BMT-Per1ldc/Per2ldc mice did not differ from BMT-WT mice. After HFD feeding, BMT-Per1ldc/Per2ldc mice gained more body weight and consumed more food than BMT-WT mice (Fig. 9, A and B). However, feeding efficiency did not differ between two groups of chimeric mice (Fig. 9B). Compared with HFD-fed BMT-WT mice, HFD-fed BMT-Per1ldc/Per2ldc mice exhibited a significant increase in plasma insulin and glucose levels (Fig. 9, C and D); however, plasma triglyceride and free fatty acid levels remained unchanged (data not shown). In addition, HFD-fed BMT-Per1ldc/Per2ldc mice displayed a significant increase in the severity of insulin resistance and glucose intolerance indicated by insulin and glucose tolerance testes, respectively (Fig. 9, E and F). Thus, disruption of myeloid cell-specific circadian clock mechanism is sufficient to exacerbate HFD-induced insulin resistance and metabolic dysregulation.
FIGURE 9.

Myeloid cell-specific Per1/2 disruption exacerbates diet-induced insulin resistance and glucose intolerance. Chimeric mice (BMT-WT and BMT-Per1ldc/Per2ldc) were fed an HFD for 12 weeks (n = 6–10). A, body weight was monitored before and after HFD feeding. B, food intake was recorded during the feeding period and calculated as food consumption (g) per day per mouse. Right panel, feeding efficiency was calculated as the ratio of food intake to body weight. C, plasma levels of insulin. D, plasma levels of glucose. E, insulin tolerance tests. F, glucose tolerance tests. For A–F, data are the means ± S.E. *, p < 0.05; **, p < 0.01 BMT-Per1ldc/Per2ldc versus BMT-WT (B–D) under the same conditions (A) or time points (E and F). For C–F, HFD-fed chimeric mice were fasted for 4 h starting at the same time of the day before tissue collection or physiological assays. For E and F, mice were given a peritoneal injection of insulin (1 unit/kg) (E) or glucose (2 g/kg) (F).
Myeloid Cell-specific Per1/2 Disruption Exacerbates Liver Inflammatory Responses, Insulin Resistance, and Metabolic Dysregulation
During obesity, adipose tissue inflammation and dysfunction can produce distal effects on liver inflammatory and metabolic responses (43, 48), which in turn also contribute to the control of systemic insulin sensitivity and glucose homeostasis. Thus, we used the same BMT-WT and BMT-Per1ldc/Per2ldc mice to concurrently analyze the effect of myeloid cell-specific circadian clock disruption on liver responses. Compared with HFD-fed BMT-WT mice, HFD-fed BMT-Per1ldc/Per2ldc mice exhibited a significant increase in liver inflammatory responses, indicated by the increases in the phosphorylation of JNK1 (1.7-fold) and NF-κB p65 (2-fold) (Fig. 10A) and in the mRNA levels of IL-1β, IL-6, and TNFα (Fig. 10B). Meanwhile, HFD-fed BMT-Per1ldc/Per2ldc mice displayed a significant increase in liver weight (Fig. 10C) and a corresponding increase in the severity of hepatic steatosis (Fig. 10D). When insulin signaling was analyzed, liver tissue from HFD-fed BMT-Per1ldc/Per2ldc mice showed significant decreases in insulin-induced Akt phosphorylation (Ser-473) (Fig. 10E). Consistent with increased severity of hepatic steatosis, HFD-fed BMT-Per1ldc/Per2ldc mice were distinguished from controls by a significant increase in liver mRNA levels of SREBP1c and FAS, which are, respectively, a critical transcription factor and a lipogenic enzyme that promotes lipogenesis and hepatic steatosis (Fig. 10F) relative to that found in control mice. These results indicate that similar to adipose tissue, HFD-induced liver metabolic dysregulation is amplified by myeloid cell-specific Per1/2 disruption.
FIGURE 10.

Myeloid cell-specific Per1/2 disruption exacerbates HFD-induced liver inflammatory responses and insulin resistance. Chimeric mice (BMT-WT and BMT-Per1ldc/Per2ldc) were fed an HFD for 12 weeks (n = 6–10). A, liver inflammatory signaling. The levels of total and phosphorylated JNK1 (p46) and NF-κB p65 were examined using Western blot analyses and quantified using densitometry. B, liver levels of proinflammatory cytokine mRNAs. C, liver weight. D, liver histology (H&E staining). E, liver insulin signaling. F, liver mRNA levels of key metabolic genes. For A–F, HFD-fed chimeric mice were fasted for 4 h starting at the same time of the day before tissue collection (A–D and F) or insulin injection (E). For B and F, liver mRNA levels of metabolic genes were quantified using real-time PCR and plotted as relative expression. For E, chimeric mice were given a bolus injection of insulin (1 unit/kg of body weight) or PBS into the portal vein. For bar graphs (A–C, E, and F), data are the means ± S.E. *, p < 0.05; **, p < 0.01 BMT-Per1ldc/Per2ldc versus BMT-WT (A–C) under same condition (insulin in E) for the same gene (F). AU, arbitrary units. GK, glucokinase; ACC1, acetyl-CoA carboxylase 1; G6Pase, glucose-6-phosphatase.
DISCUSSION
During obesity, macrophage proinflammatory activation initiates or aggravates inflammation in key metabolic organs including adipose and liver tissues, thereby leading to systemic insulin resistance. However, it remains to be elucidated exactly how over-nutrition induces proinflammatory activation of macrophages, particularly in those found in adipose tissue where increased inflammation plays a causal role in the pathogenesis of insulin resistance (4–8). In parallel with this inductive effect on macrophage proinflammatory activation (5), HFD feeding has been shown to decrease the amplitude of adipose tissue clock gene rhythms in Bmal1, Clock, and Per 2 expression (34) and to lengthen the period of the Per2 rhythm in cultured adipose tissue (49). Taken together, these observations suggest that dysregulation of peripheral circadian clocks may link diet-associated obesity to adipose tissue inflammation. In support of this putative association, the present study demonstrates that in HFD-fed mice where minor increases in period of the activity of rhythm were similar to those observed previously (34), over-nutrition caused dysregulation of peripheral circadian clocks (i.e. substantial increases in the period of Per 2 oscillations) specifically within key mediators of adipose tissue inflammation, macrophages in stromal vascular cells, and BMDM. Furthermore, the diet-related clock dysregulation in BMDM was accompanied by increased proinflammatory activation. It is noteworthy that our findings provide evidence for the direct link between circadian clock dysregulation and macrophage proinflammatory activation in diet-induced obesity. Specifically, clock-disrupted (Per1ldc/Per2ldc) macrophages are distinguished by enhanced proinflammatory activation, and myeloid cell-specific clock disruption (Per1ldc/Per2ldc) exacerbates diet-induced inflammation and insulin resistance in chimeric mice repopulated with only mutant bone marrow cells. As such, the current study indicates for the first time that dysregulation of the macrophage circadian clock (e.g. Per1/2 disruption) is a critical factor in the mechanism through which over-nutrition induces macrophage proinflammatory activation, thereby leading to adipose tissue inflammation in the context of systemic insulin resistance and hyperglycemia.
Per1 and Per2 are vital components of the circadian clock mechanism and function as negative regulators in feedback loops involving interactions between Bmal1, Clock, and the cryptochrome (Cry1 and Cry2) genes (50). Previously, genetic or environmental disruption of circadian clock function has been shown to alter macrophage proinflammatory responses. In macrophages, conditional targeting of Bmal1 abolishes the rhythmic gating of innate immune responses such that cytokine responsiveness to LPS stimulation remains constantly elevated (33). Environmental disruption of circadian rhythms after weekly 6-h shifts in the light-dark cycle similarly exacerbates inflammatory responses of peritoneal macrophages to LPS challenge in the absence of sleep loss or stress effects (35). In the present analysis of Per1ldc/Per2ldc mice that are characterized by a globally arrhythmic phenotype (37), circadian clock dysfunction did not influence macrophage differentiation, as the percentage of mature macrophages (F4/80+ CD11b+ cells) differentiated from bone marrow cells of Per1ldc/Per2ldc mice was identical to that found in wild-type mice. However, among mature macrophages, Per1/2-disrupted cells showed a much higher percentage of CD11c+ CD206− cells, indicating increased macrophage proinflammatory activation. The macrophage inflammatory status was corroborated by the finding that Per1/2 disruption increased JNK1 and NF-κB p65 phosphorylation and IL-1β and TNFα expression in mature macrophages under LPS-stimulated conditions. Thus, Per1/2 disruption-associated circadian dysfunction increases macrophage proinflammatory activation.
How the Per1 and Per2 genes regulate macrophage activation remains to be determined. It is possible that Per1 and Per2 modify inflammatory gene expression through their feedback regulation of CLOCK/BMAL1 transcriptional activity. Indeed, CLOCK has been shown to function as a positive regulator of the transcription factor NF-κB, which is a critical determinant of inflammatory responses (51). Consequently, the relative increases in CLOCK levels observed in peripheral tissues from mutant mice (data not shown) suggest that the loss of negative feedback regulation resulting from Per1/2 disruption may further enhance the activation of NF-κB and ultimately the induction of NF-κB-responsive genes such as IL-1β, TNFα, and other cytokines. Alternatively, Per1 and Per2 may alter macrophage inflammatory signaling through interactions with other components of the core or auxiliary feedback loops comprising the molecular clockworks because REV-ERBα has been shown to modulate macrophage TLR signaling (52) and function as an inhibitor of proinflammatory IL-6 release (33). Given that active PPARγ promotes macrophage anti-inflammatory activation (20, 23, 53) and this transcription factor is a molecular target of insulin-sensitizing and anti-diabetic drugs (54), PPARγ may play a role in Per1/2 regulation of macrophage activation. In fact, our data support this hypothesis because PPARγ levels were decreased in Per1/2-disrupted macrophages in conjunction with their enhanced proinflammatory activation and PPARγ2 overexpression reversed, at least in part, this Per1/2 disruption-associated shift in inflammatory status. Collectively, these observations suggest a novel mechanism for macrophage polarization in which the circadian clock normally acts through PPARγ to inhibit macrophage proinflammatory activation. Because the PPARγ promoter contains multiple E-boxes (46), it will be important to determine whether negative feedback by Per1 and/or Per2 modulates CLOCK/BMAL1 regulation of E-box mediated transcription of PPARγ.
The significance of circadian clock function in macrophage activation was further manifested by the finding that adoptive transfer of Per1/2-disrupted myeloid cells to wild-type mice exacerbated HFD-induced inflammation and insulin resistance. Notably, BMT-Per1ldc/Per2ldc mice displayed marked increases in adipose tissue inflammatory responses as indicated by enrichment of mature proinflammatory macrophages in adipose tissue and increased inflammatory signaling and proinflammatory cytokine expression. Consequently, inflammation-associated adipose tissue dysfunction (i.e. decreased insulin signaling and adipose tissue metabolic dysregulation) was markedly increased in BMT-Per1ldc/Per2ldc mice. Given the origin of the myeloid cells/macrophages, the increased severity of adipose tissue inflammatory responses and dysfunction in BMT-Per1ldc/Per2ldc mice solely reflects proinflammatory activation in clock-disrupted macrophages. This relation was substantiated by the finding that co-culture of adipocytes with Per1/2-disrupted macrophages increased adipocyte inflammatory response and decreased adipocyte insulin sensitivity. In similar fashion, Per1/2-disrupted macrophages appeared to mediate the increased severity of liver inflammatory responses and metabolic dysregulation. Altogether, these observations provide convincing evidence that macrophage circadian clock dysregulation is sufficient to potentiate over-nutrition-induced inflammation in adipose tissue and the liver, thereby increasing systemic insulin resistance.
In summary, the present data unveil a novel mechanism for obesity-associated insulin resistance in which circadian clock dysregulation is a key factor that links over-nutrition and macrophage proinflammatory activation to adipose tissue inflammation. At the cellular level, HFD-associated over-nutrition modulates circadian clock function in macrophages, which in turn induces the proinflammatory activation of macrophages, especially those in adipose tissue. When activated, clock-disrupted macrophages are sufficient to exacerbate diet-induced adipose tissue inflammation and systemic insulin resistance. Because adipose tissue inflammatory responses and corresponding insulin sensitivity in over-nutrition-related obesity are differentially engaged by specific types of fatty acids found in HFDs, future studies are warranted to compare the effects of saturated and polyunsaturated fatty acids on macrophage and adipocyte circadian clocks. Thus, it will be important to determine whether saturated fatty acids that activate proinflammatory signaling pathways and lead to impaired insulin sensitivity (e.g. palmitate) also modulate the circadian timekeeping function of macrophage and adipocyte clocks and whether this circadian clock dysregulation is blocked or abated by polyunsaturated fatty acids that repress adipose tissue inflammatory responses and have a beneficial impact on insulin sensitivity.
Acknowledgments
We thank P. Hardin and J. Friedman for reviewing the manuscript.
This work was supported, in whole or in part, by National Institutes of Health Grants 1R01DK095828 and 1R01DK095862) (NIDDK; to C. W.). This work was also supported, in whole or in part, by American Diabetes Association Grants 1-10-JF-54 and 1-13-BS-214-BR, American Heart Association Grant 12BGIA9050003 (to C. W.).
S.-M. Kim, N. Neuendorff, and, D. J. Earnest, unpublished observations.
- HFD
- high-fat diet
- PPAR
- peroxisome proliferator-activated receptor
- TLR4
- Toll-like receptor 4
- Per
- Period
- Luc
- luciferase
- LFD
- low-fat diet
- BMT
- bone marrow transplantation
- BMDM
- bone marrow-derived macrophage(s)
- SVC
- stromal vascular cell(s)
- NF-κB
- nuclear factor κB
- MCP1
- monocyte chemoattractant protein 1
- SREBP1c
- sterol regulatory element-binding protein 1c
- FAS
- fatty acid synthase
- BMAL1
- brain muscle ARNT-like protein 1
- CLOCK
- circadian locomotor output cycles kaput.
REFERENCES
- 1. Hossain P., Kawar B., El Nahas M. (2007) Obesity and diabetes in the developing world: a growing challenge. N. Engl. J. Med. 356, 213–215 [DOI] [PubMed] [Google Scholar]
- 2. Angulo P. (2002) Nonalcoholic fatty liver disease. N. Engl. J. Med. 346, 1221–1231 [DOI] [PubMed] [Google Scholar]
- 3. Jensen M. K., Chiuve S. E., Rimm E. B., Dethlefsen C., Tjønneland A., Joensen A. M., Overvad K. (2008) Obesity, behavioral lifestyle factors, and risk of acute coronary events. Circulation 117, 3062–3069 [DOI] [PubMed] [Google Scholar]
- 4. Weisberg S. P., McCann D., Desai M., Rosenbaum M., Leibel R. L., Ferrante A. W., Jr. (2003) Obesity is associated with macrophage accumulation in adipose tissue. J. Clin. Invest. 112, 1796–1808 [DOI] [PMC free article] [PubMed] [Google Scholar]
- 5. Lumeng C. N., Deyoung S. M., Bodzin J. L., Saltiel A. R. (2007) Increased inflammatory properties of adipose tissue macrophages recruited during diet-induced obesity. Diabetes 56, 16–23 [DOI] [PubMed] [Google Scholar]
- 6. Kang K., Reilly S. M., Karabacak V., Gangl M. R., Fitzgerald K., Hatano B., Lee C.-H. (2008) Adipocyte-derived Th2 cytokines and myeloid PPARδ regulate macrophage polarization and insulin sensitivity. Cell Metab. 7, 485–495 [DOI] [PMC free article] [PubMed] [Google Scholar]
- 7. Huo Y., Guo X., Li H., Wang H., Zhang W., Wang Y., Zhou H., Gao Z., Telang S., Chesney J., Chen Y. E., Ye J., Chapkin R. S., Wu C. (2010) Disruption of inducible 6-phosphofructo-2-kinase ameliorates diet-induced adiposity but exacerbates systemic insulin resistance and adipose tissue inflammatory response. J. Biol. Chem. 285, 3713–3721 [DOI] [PMC free article] [PubMed] [Google Scholar]
- 8. Guo X., Xu K., Zhang J., Li H., Zhang W., Wang H., Lange A. J., Chen Y. E., Huo Y., Wu C. (2010) Involvement of inducible 6-phosphofructo-2-kinase in the anti-diabetic effect of PPARγ activation in mice. J. Biol. Chem. 285, 23711–23720 [DOI] [PMC free article] [PubMed] [Google Scholar]
- 9. Qatanani M., Lazar M. A. (2007) Mechanisms of obesity-associated insulin resistance: many choices on the menu. Genes Dev. 21, 1443–1455 [DOI] [PubMed] [Google Scholar]
- 10. Kahn B. B., Flier J. S. (2000) Obesity and insulin resistance. J. Clin. Invest. 106, 473–481 [DOI] [PMC free article] [PubMed] [Google Scholar]
- 11. Rosen E. D., Spiegelman B. M. (2006) Adipocytes as regulators of energy balance and glucose homeostasis. Nature 444, 847–853 [DOI] [PMC free article] [PubMed] [Google Scholar]
- 12. Badman M. K., Flier J. S. (2007) The adipocyte as an active participant in energy balance and metabolism. Gastroenterology 132, 2103–2115 [DOI] [PubMed] [Google Scholar]
- 13. Hotamisligil G. S., Peraldi P., Budavari A., Ellis R., White M. F., Spiegelman B. M. (1996) IRS-1-mediated inhibition of insulin receptor tyrosine kinase activity in TNF-α- and obesity-induced insulin resistance. Science 271, 665–668 [DOI] [PubMed] [Google Scholar]
- 14. Cheung A. T., Ree D., Kolls J. K., Fuselier J., Coy D. H., Bryer-Ash M. (1998) An in vivo model for elucidation of the mechanism of tumor necrosis factor-α (TNF-α)-induced insulin resistance: evidence for differential regulation of insulin signaling by TNF-α. Endocrinology 139, 4928–4935 [DOI] [PubMed] [Google Scholar]
- 15. Cheung A. T., Wang J., Ree D., Kolls J. K., Bryer-Ash M. (2000) Tumor necrosis factor-α induces hepatic insulin resistance in obese Zucker (fa/fa) rats via interaction of leukocyte antigen-related tyrosine phosphatase with focal adhesion kinase. Diabetes 49, 810–819 [DOI] [PubMed] [Google Scholar]
- 16. Boden G., Cheung P., Stein T. P., Kresge K., Mozzoli M. (2002) FFA cause hepatic insulin resistance by inhibiting insulin suppression of glycogenolysis. Am. J. Physiol. Endocrinol. Metab. 283, E12–E19 [DOI] [PubMed] [Google Scholar]
- 17. Berg A. H., Combs T. P., Du X., Brownlee M., Scherer P. E. (2001) The adipocyte-secreted protein Acrp30 enhances hepatic insulin action. Nat. Med. 7, 947–953 [DOI] [PubMed] [Google Scholar]
- 18. Kabir M., Catalano K. J., Ananthnarayan S., Kim S. P., Van Citters G. W., Dea M. K., Bergman R. N. (2005) Molecular evidence supporting the portal theory: a causative link between visceral adiposity and hepatic insulin resistance. Am. J. Physiol. Endocrinol. Metab. 288, E454–E461 [DOI] [PubMed] [Google Scholar]
- 19. Xu H., Barnes G. T., Yang Q., Tan G., Yang D., Chou C. J., Sole J., Nichols A., Ross J. S., Tartaglia L. A., Chen H. (2003) Chronic inflammation in fat plays a crucial role in the development of obesity-related insulin resistance. J. Clin. Invest. 112, 1821–1830 [DOI] [PMC free article] [PubMed] [Google Scholar]
- 20. Stienstra R., Duval C., Keshtkar S., van der Laak J., Kersten S., Müller M. (2008) Peroxisome proliferator-activated receptor γ activation promotes infiltration of alternatively activated macrophages into adipose tissue. J. Biol. Chem. 283, 22620–22627 [DOI] [PubMed] [Google Scholar]
- 21. Todoric J., Löffler M., Huber J., Bilban M., Reimers M., Kadl A., Zeyda M., Waldhäusl W., Stulnig T. (2006) Adipose tissue inflammation induced by high-fat diet in obese diabetic mice is prevented by n-3 polyunsaturated fatty acids. Diabetologia 49, 2109–2119 [DOI] [PubMed] [Google Scholar]
- 22. Lumeng C. N., Bodzin J. L., Saltiel A. R. (2007) Obesity induces a phenotypic switch in adipose tissue macrophage polarization. J. Clin. Invest. 117, 175–184 [DOI] [PMC free article] [PubMed] [Google Scholar]
- 23. Odegaard J. I., Ricardo-Gonzalez R. R., Goforth M. H., Morel C. R., Subramanian V., Mukundan L., Red Eagle A., Vats D., Brombacher F., Ferrante A. W., Chawla A. (2007) Macrophage-specific PPARγ controls alternative activation and improves insulin resistance. Nature 447, 1116–1120 [DOI] [PMC free article] [PubMed] [Google Scholar]
- 24. Odegaard J. I., Ricardo-Gonzalez R. R., Red Eagle A., Vats D., Morel C. R., Goforth M. H., Subramanian V., Mukundan L., Ferrante A. W., Chawla A. (2008) Alternative M2 activation of Kupffer cells by PPARd ameliorates obesity-induced insulin resistance. Cell Metab. 7, 496–507 [DOI] [PMC free article] [PubMed] [Google Scholar]
- 25. Sag D., Carling D., Stout R. D., Suttles J. (2008) Adenosine 5′-monophosphate-activated protein kinase promotes macrophage polarization to an anti-inflammatory functional phenotype. J. Immunol. 181, 8633–8641 [DOI] [PMC free article] [PubMed] [Google Scholar]
- 26. Saberi M., Woods N.-B., de Luca C., Schenk S., Lu J. C., Bandyopadhyay G., Verma I. M., Olefsky J. M. (2009) Hematopoietic cell-specific deletion of toll-like receptor 4 ameliorates hepatic and adipose tissue insulin resistance in high-fat-fed mice. Cell Metab. 10, 419–429 [DOI] [PMC free article] [PubMed] [Google Scholar]
- 27. Solinas G., Vilcu C., Neels J. G., Bandyopadhyay G. K., Luo J.-L., Naugler W., Grivennikov S., Wynshaw-Boris A., Scadeng M., Olefsky J. M., Karin M. (2007) JNK1 in hematopoietically derived cells contributes to diet-induced inflammation and insulin resistance without affecting obesity. Cell Metab. 6, 386–397 [DOI] [PubMed] [Google Scholar]
- 28. Han M. S., Jung D. Y., Morel C., Lakhani S. A., Kim J. K., Flavell R. A., Davis R. J. (2013) JNK expression by macrophages promotes obesity-induced insulin resistance and inflammation. Science 339, 218–222 [DOI] [PMC free article] [PubMed] [Google Scholar]
- 29. Turek F. W., Joshu C., Kohsaka A., Lin E., Ivanova G., McDearmon E., Laposky A., Losee-Olson S., Easton A., Jensen D. R., Eckel R. H., Takahashi J. S., Bass J. (2005) Obesity and metabolic syndrome in circadian Clock mutant mice. Science 308, 1043–1045 [DOI] [PMC free article] [PubMed] [Google Scholar]
- 30. Marcheva B., Ramsey K. M., Buhr E. D., Kobayashi Y., Su H., Ko C. H., Ivanova G., Omura C., Mo S., Vitaterna M. H., Lopez J. P., Philipson L. H., Bradfield C. A., Crosby S. D., JeBailey L., Wang X., Takahashi J. S., Bass J. (2010) Disruption of the clock components CLOCK and BMAL1 leads to hypoinsulinaemia and diabetes. Nature 466, 627–631 [DOI] [PMC free article] [PubMed] [Google Scholar]
- 31. Paschos G. K., Ibrahim S., Song W.-L., Kunieda T., Grant G., Reyes T. M., Bradfield C. A., Vaughan C. H., Eiden M., Masoodi M., Griffin J. L., Wang F., Lawson J. A., Fitzgerald G. A. (2012) Obesity in mice with adipocyte-specific deletion of clock component Arntl. Nat. Med. 18, 1768–1777 [DOI] [PMC free article] [PubMed] [Google Scholar]
- 32. Keller M., Mazuch J., Abraham U., Eom G. D., Herzog E. D., Volk H.-D., Kramer A., Maier B. (2009) A circadian clock in macrophages controls inflammatory immune responses. Proc. Natl. Acad. Sci. U.S.A. 106, 21407–21412 [DOI] [PMC free article] [PubMed] [Google Scholar]
- 33. Gibbs J. E., Blaikley J., Beesley S., Matthews L., Simpson K. D., Boyce S. H., Farrow S. N., Else K. J., Singh D., Ray D. W., Loudon A. S. (2012) The nuclear receptor REV-ERBa mediates circadian regulation of innate immunity through selective regulation of inflammatory cytokines. Proc. Natl. Acad. Sci. U.S.A. 109, 582–587 [DOI] [PMC free article] [PubMed] [Google Scholar]
- 34. Kohsaka A., Laposky A. D., Ramsey K. M., Estrada C., Joshu C., Kobayashi Y., Turek F. W., Bass J. (2007) High-fat diet disrupts behavioral and molecular circadian rhythms in mice. Cell Metab. 6, 414–421 [DOI] [PubMed] [Google Scholar]
- 35. Castanon-Cervantes O., Wu M., Ehlen J. C., Paul K., Gamble K. L., Johnson R. L., Besing R. C., Menaker M., Gewirtz A. T., Davidson A. J. (2010) Dysregulation of inflammatory responses by chronic circadian disruption. J. Immunol. 185, 5796–5805 [DOI] [PMC free article] [PubMed] [Google Scholar]
- 36. Yoo S.-H., Yamazaki S., Lowrey P. L., Shimomura K., Ko C. H., Buhr E. D., Siepka S. M., Hong H.-K., Oh W. J., Yoo O. J., Menaker M., Takahashi J. S. (2004) PERIOD2::LUCIFERASE real-time reporting of circadian dynamics reveals persistent circadian oscillations in mouse peripheral tissues. Proc. Natl. Acad. Sci. U.S.A. 101, 5339–5346 [DOI] [PMC free article] [PubMed] [Google Scholar]
- 37. Bae K., Jin X., Maywood E. S., Hastings M. H., Reppert S. M., Weaver D. R. (2001) Differential functions of mPer1, mPer2, and mPer3 in the SCN circadian clock. Neuron 30, 525–536 [DOI] [PubMed] [Google Scholar]
- 38. Wu C., Okar D. A., Newgard C. B., Lange A. J. (2001) Overexpression of 6-phosphofructo-2-kinase/fructose-2,6-bisphosphatase in mouse liver lowers blood glucose by suppression of hepatic glucose production. J. Clin. Invest. 107, 91–98 [DOI] [PMC free article] [PubMed] [Google Scholar]
- 39. Wu C., Kang J. E., Peng L. J., Li H., Khan S. A., Hillard C. J., Okar D. A., Lange A. J. (2005) Enhancing hepatic glycolysis reduces obesity: differential effects on lipogenesis depend on site of glycolytic modulation. Cell Metab. 2, 131–140 [DOI] [PubMed] [Google Scholar]
- 40. Ko M. L., Shi L., Tsai J.-Y., Young M. E., Neuendorff N., Earnest D. J., Ko G. Y. (2011) Cardiac-specific mutation of Clock alters the quantitative measurements of physical activities without changing behavioral circadian rhythms. J. Biol. Rhythms 26, 412–422 [DOI] [PMC free article] [PubMed] [Google Scholar]
- 41. Farnell Y. F., Shende V. R., Neuendorff N., Allen G. C., Earnest D. J. (2011) Immortalized cell lines for real-time analysis of circadian pacemaker and peripheral oscillator properties. Eur. J. Neurosci. 33, 1533–1540 [DOI] [PubMed] [Google Scholar]
- 42. Prieur X., Mok C. Y., Velagapudi V. R., Núñez V., Fuentes L., Montaner D., Ishikawa K., Camacho A., Barbarroja N., O'Rahilly S., Sethi J. K., Dopazo J., Orešič M., Ricote M., Vidal-Puig A. (2011) Differential lipid partitioning between adipocytes and tissue macrophages modulates macrophage lipotoxicity and M2/M1 polarization in obese mice. Diabetes 60, 797–809 [DOI] [PMC free article] [PubMed] [Google Scholar]
- 43. Huo Y., Guo X., Li H., Xu H., Halim V., Zhang W., Wang H., Fan Y.-Y., Ong K. T., Woo S.-L., Chapkin R. S., Mashek D. G., Chen Y., Dong H., Lu F., Wei L., Wu C. (2012) Targeted overexpression of inducible 6-phosphofructo-2-kinase in adipose tissue increases fat deposition but protects against diet-induced insulin resistance and inflammatory responses. J. Biol. Chem. 287, 21492–21500 [DOI] [PMC free article] [PubMed] [Google Scholar]
- 44. Guo X., Li H., Xu H., Halim V., Thomas L. N., Woo S.-L., Huo Y., Chen Y. E., Sturino J. M., Wu C. (2013) Disruption of inducible 6-phosphofructo-2-kinase impairs the suppressive effect of PPARγ activation on diet-induced intestine inflammatory response. J. Nutr. Biochem. 24, 770–775 [DOI] [PMC free article] [PubMed] [Google Scholar]
- 45. Guo X., Li H., Xu H., Halim V., Zhang W., Wang H., Ong K. T., Woo S. L., Walzem R. L., Mashek D. G., Dong H., Lu F., Wei L., Huo Y., Wu C. (2012) Palmitoleate induces hepatic steatosis but suppresses liver inflammatory response in mice. PLoS ONE 7, e39286. [DOI] [PMC free article] [PubMed] [Google Scholar]
- 46. Herzig S., Hedrick S., Morantte I., Koo S. H., Galimi F., Montminy M. (2003) CREB controls hepatic lipid metabolism through nuclear hormone receptor PPAR-γ. Nature 426, 190–193 [DOI] [PubMed] [Google Scholar]
- 47. Zhang J., Fu M., Cui T., Xiong C., Xu K., Zhong W., Xiao Y., Floyd D., Liang J., Li E., Song Q., Chen Y. E. (2004) Selective disruption of PPARγ2 impairs the development of adipose tissue and insulin sensitivity. Proc. Natl. Acad. Sci. U.S.A. 101, 10703–10708 [DOI] [PMC free article] [PubMed] [Google Scholar]
- 48. Kamei N., Tobe K., Suzuki R., Ohsugi M., Watanabe T., Kubota N., Ohtsuka-Kowatari N., Kumagai K., Sakamoto K., Kobayashi M., Yamauchi T., Ueki K., Oishi Y., Nishimura S., Manabe I., Hashimoto H., Ohnishi Y., Ogata H., Tokuyama K., Tsunoda M., Ide T., Murakami K., Nagai R., Kadowaki T. (2006) Overexpression of monocyte chemoattractant protein-1 in adipose tissues causes macrophage recruitment and insulin resistance. J. Biol. Chem. 281, 26602–26614 [DOI] [PubMed] [Google Scholar]
- 49. Shi S.-Q., Ansari T. S., McGuinness O. P., Wasserman D. H., Johnson C. H. (2013) Circadian disruption leads to insulin resistance and obesity. Curr. Biol. 23, 372–381 [DOI] [PMC free article] [PubMed] [Google Scholar]
- 50. Bass J., Takahashi J. S. (2010) Circadian integration of metabolism and energetics. Science 330, 1349–1354 [DOI] [PMC free article] [PubMed] [Google Scholar]
- 51. Spengler M. L., Kuropatwinski K. K., Comas M., Gasparian A. V., Fedtsova N., Gleiberman A. S., Gitlin I. I., Artemicheva N. M., Deluca K. A., Gudkov A. V., Antoch M. P. (2012) Core circadian protein CLOCK is a positive regulator of NF-kB-mediated transcription. Proc. Natl. Acad. Sci. U.S.A. 109, E2457–E2465 [DOI] [PMC free article] [PubMed] [Google Scholar]
- 52. Fontaine C., Rigamonti E., Pourcet B., Duez H., Duhem C., Fruchart J.-C., Chinetti-Gbaguidi G., Staels B. (2008) The nuclear receptor Rev-erba is a liver X receptor (LXR) target gene driving a negative feedback loop on select LXR-induced pathways in human macrophages. Mol. Endocrinol. 22, 1797–1811 [DOI] [PMC free article] [PubMed] [Google Scholar]
- 53. Bouhlel M. A., Derudas B., Rigamonti E., Dièvart R., Brozek J., Haulon S., Zawadzki C., Jude B., Torpier G., Marx N., Staels B., Chinetti-Gbaguidi G. (2007) PPARγ activation primes human monocytes into alternative M2 macrophages with anti-inflammatory properties. Cell Metab. 6, 137–143 [DOI] [PubMed] [Google Scholar]
- 54. Hevener A. L., Olefsky J. M., Reichart D., Nguyen M. T., Bandyopadyhay G., Leung H. Y., Watt M. J., Benner C., Febbraio M. A., Nguyen A. K., Folian B., Subramaniam S., Gonzalez F. J., Glass C. K., Ricote M. (2007) Macrophage PPARγ is required for normal skeletal muscle and hepatic insulin sensitivity and full antidiabetic effects of thiazolidinediones. J. Clin. Invest. 117, 1658–1669 [DOI] [PMC free article] [PubMed] [Google Scholar]