

Abstract
Bottom-up proteomics largely relies on tryptic peptides for protein identification and quantification. Tryptic digestion often provides limited coverage of protein sequence because of issues such as peptide length, ionization efficiency, and post-translational modification colocalization. Unfortunately, a region of interest in a protein, for example, because of proximity to an active site or the presence of important post-translational modifications, may not be covered by tryptic peptides. Detection limits, quantification accuracy, and isoform differentiation can also be improved with greater sequence coverage. Selected reaction monitoring (SRM) would also greatly benefit from being able to identify additional targetable sequences. In an attempt to improve protein sequence coverage and to target regions of proteins that do not generate useful tryptic peptides, we deployed a multiprotease strategy on the HeLa proteome. First, we used seven commercially available enzymes in single, double, and triple enzyme combinations. A total of 48 digests were performed. 5223 proteins were detected by analyzing the unfractionated cell lysate digest directly; with 42% mean sequence coverage. Additional strong-anion exchange fractionation of the most complementary digests permitted identification of over 3000 more proteins, with improved mean sequence coverage. We then constructed a web application (https://proteomics.swmed.edu/confetti) that allows the community to examine a target protein or protein isoform in order to discover the enzyme or combination of enzymes that would yield peptides spanning a certain region of interest in the sequence. Finally, we examined the use of nontryptic digests for SRM. From our strong-anion exchange fractionation data, we were able to identify three or more proteotypic SRM candidates within a single digest for 6056 genes. Surprisingly, in 25% of these cases the digest producing the most observable proteotypic peptides was neither trypsin nor Lys-C. SRM analysis of Asp-N versus tryptic peptides for eight proteins determined that Asp-N yielded higher signal in five of eight cases.
Mass-spectrometry based proteomics provides various tools to detect and quantify changes in protein expression or post-translational modifications (PTMs).1 In bottom-up proteomics, these analyses typically involve using peptides derived from the tryptic digestion of proteins. Although trypsin is a robust enzyme and provides peptides suitable for mass spectrometry, not all sequences are detectable by this approach (1). Sequences may be missed because of the limited number and uneven distribution of lysine and arginine residues throughout a protein sequence. Tryptic coverage of interesting regions of sequence, such as trans-membrane domains that may contain notable PTMs, is often incomplete (2). Sequence coverage greater than that offered by trypsin is a requirement for many studies (3).
Missing sequence coverage can also adversely affect analysis by selected reaction monitoring (SRM). Although SRM has emerged in recent years as a highly sensitive and accurate method for protein detection and quantification (4), it is sometimes hampered by the limited number of targetable peptides (primarily tryptic peptides) available in public databases. Improving amino acid sequence coverage would provide more targets for SRM assay development, facilitating protein quantification and the ability to target specific isoforms or sequence regions of interest.
Fractionation is commonly employed to increase protein identifications and improve sequence coverage, but introduces a number of complexities. Separation of proteins or peptides significantly increases the number of samples to analyze and the amount of data to process. Species may be present in multiple fractions or in different fractions in different runs, which makes quantitative analysis with techniques like SRM difficult. However, SRM has sufficient sensitivity that peptides identified in fractionated discovery experiments are often targetable in whole lysate (5).
One approach to increase sequence coverage without fractionation or purification is to use proteases other than trypsin for digestion (6, 7). In recent years, there has been a surge in the use of alternative proteases to improve sequence coverage. Biringer et al. demonstrated in 2006 that combining the MS data from tryptic and Glu-C digestions of human cerebrospinal fluid (CSF) resulted in increased protein identifications. Sequence coverage also improved versus individual enzyme digests, though this was shown only for the 38 most confidently identified proteins (8). In 2010, Swaney et al. expanded the multi-enzyme approach to five specific proteases (trypsin, Lys-C, Arg-C, Asp-N, and Glu-C) and showed that although this method only modestly increases the number of protein IDs, it significantly increases the average sequence coverage (from 24.5% to 43.4%) (9). The most comprehensive coverage of a human cell line to date was reported by Nagaraj et al., in which in-depth proteomics with two levels of prefractionation and analysis using trypsin, Lys-C, and Glu-C was carried out for the HeLa cell line. A total of 10,255 proteins and 166,420 peptides were identified (10). However, none of these studies investigated the use of consecutive enzymatic digestion on a sample.
The Mann laboratory recently introduced a strategy, using consecutive digestion in conjunction with filter-aided sample preparation (FASP), for two-step and three-step digestions with various combinations of trypsin, Lys-C, Glu-C, Arg-C, and Asp-N (11). The consecutive use of Lys-C and trypsin enabled the identification of up to 40% more proteins and phosphorylation sites in comparison to trypsin alone. However, a systematic study of all common commercially available proteases for comprehensive mapping of the human proteome has not yet been performed.
These prior studies have clearly shown the ability of tandem and parallel protease digestion to improve protein ID and sequence coverage. However, their focus has been either to improve the number of protein identifications or to improve the sequence coverage of few targets. In an effort to provide a resource for targeting as much of the amino acid sequence in a human cell line as possible, we conducted a comprehensive study in which seven commercially available enzymes were used individually and in combination. First, we digested HeLa lysate with a total of 48 single, double, and triple enzyme combinations. Across these combinations we detected 5223 proteins with an average of 42% sequence coverage by analyzing the total cell lysate digest without fractionation. We then selected the best five complementary digests for each of Orbitrap elite collision induced dissociation (CID) and Q exactive higher-energy CID (HCD) analyses. A strong-anion exchange fractionation strategy was applied to these best digests, from which we were able to identify 8470 proteins with 40.3% mean sequence coverage. Combining all digests, both unfractionated and SAX, gave 8539 proteins with 44.7% mean coverage. These data are now publically available (https://proteomics.swmed.edu/confetti) and can be queried using a simple web interface to discover the enzyme or combination of enzymes required to yield a peptide spanning a certain region of interest on a protein.
Finally, we performed a proof-of-concept experiment to demonstrate that SRM assays using nontryptic peptides are viable, and in some cases more sensitive than tryptic assays. Though tryptic peptides are generally sufficient for protein quantification by SRM we believe there will be increased use of nontryptic SRM as coverage of specific regions of sequence becomes more important. For example, bio-marker studies considering the presence of specific PTMs rather than general protein abundance are increasingly common. Truly comprehensive PTM studies require access to the nontryptic proteome.
EXPERIMENTAL PROCEDURES
Single, Double, and Triple Digestion
Lysate from HeLa Human cervical cancer cells was prepared, reduced, and alkylated according to standard protocols detailed in the supplementary methods. Seven commercially available endopeptidases, trypsin (Promega Madison, WI), chymotrypsin (Worthington, Freehold, NJ), elastase (Worthington), Glu-C (Promega), Lys-C (Promega), Asp-N (Roche), and Arg-C (Roche) were used in single, double, and triple sequential digestions, with the exception of Arg-C, which was not used in triple-sequential digestions. The order of the enzymes used for sequential digestions was determined based on the theoretical average length of the generated peptides (9) and the specificity of the enzymes. In detail, specific enzymes were used before nonspecific enzymes (chymotrypsin and elastase), specific enzymes that generate longer peptides were used before the ones generate shorter peptides, and trypsin was used as the last enzyme in all occasions. The enzyme order for the sequential digestion is as follows; Arg-C > Asp-N > Glu-C > Lys-C > chymotrypsin > elastase > trypsin.
Combining one, two, or three enzymes in this manner led to a total of 48 digests which are summarized in Table I. 10 μl of the reduced and alkylated protein solution (20 μg total protein) was used for each enzyme digestion. Digestion procedures are detailed in the supplementary methods.
Table I. List of the 48 digests using seven commercially available proteases that were performed in this study. Against each digest the number of replicate injections for Orbitrap Elite CID and Q Exactive HCD analyses is shown. The best five digests for each of CID and HCD were additionally analyzed after SAX fractionation. Cleavage specificities were chosen from those supported by all search engines within CPFP. If a specific cleavage definition was not supported, nonspecific cleavage searches were performed. * The AspN SAX sample was injected only twice on the Orbitrap Elite for CID analysis. A planned third injection was not possible after sample loss due to instrument failure.
| First enzyme | Second enzyme | Third enzyme | Replicate injections |
Search specificity [..] - AA permitted, <..>–AA not permitted, - cleavage site | ||||
|---|---|---|---|---|---|---|---|---|
| CID | HCD | CID (SAX) | HCD (SAX) | |||||
| Single digestion | ArgC | 3 | 3 | [R] <p> | ||||
| (7 Total) | AspN | 3 | 3 | 2* | 3 | [X] [D] | ||
| Chymotrypsin | 3 | 3 | [FLWY] <p> | |||||
| Elastase | 3 | 3 | Nonspecific | |||||
| GluC | 3 | 3 | 3 | 3 | [DE] <p> | |||
| LysC | 3 | 3 | 3 | 3 | [K] <p> | |||
| Trypsin | 3 | 3 | 3 | 3 | [KR] <p> | |||
| Double digestion | ArgC | AspN | 3 | 3 | Nonspecific | |||
| (21 Total) | ArgC | Chymotrypsin | 3 | 3 | Nonspecific | |||
| ArgC | Elastase | 3 | 3 | Nonspecific | ||||
| ArgC | GluC | 3 | 3 | Nonspecific | ||||
| ArgC | LysC | 3 | 3 | [KR] <p> | ||||
| ArgC | Trypsin | 3 | 3 | 3 | [KR] <p> | |||
| AspN | Chymotrypsin | 3 | 3 | Nonspecific | ||||
| AspN | Elastase | 3 | 3 | Nonspecific | ||||
| AspN | GluC | 3 | 3 | Nonspecific | ||||
| AspN | LysC | 3 | 3 | Nonspecific | ||||
| AspN | Trypsin | 3 | 3 | Nonspecific | ||||
| Chymotrypsin | Elastase | 3 | 3 | Nonspecific | ||||
| Chymotrypsin | Trypsin | 3 | 3 | 3 | Nonspecific | |||
| Elastase | Trypsin | 3 | 3 | Nonspecific | ||||
| GluC | Chymotrypsin | 3 | 3 | Nonspecific | ||||
| GluC | Elastase | 3 | 3 | Nonspecific | ||||
| GluC | LysC | 3 | 3 | Nonspecific | ||||
| GluC | Trypsin | 3 | 3 | Nonspecific | ||||
| LysC | Chymotrypsin | 3 | 3 | Nonspecific | ||||
| LysC | Elastase | 3 | 3 | Nonspecific | ||||
| LysC | Trypsin | 3 | 3 | [KR] <p> | ||||
| Triple digestion | AspN | Chymotrypsin | Elastase | 1 | 1 | Nonspecific | ||
| (20 Total) | AspN | Chymotrypsin | Trypsin | 1 | 1 | Nonspecific | ||
| AspN | Elastase | Trypsin | 1 | 1 | Nonspecific | |||
| AspN | GluC | Chymotrypsin | 1 | 1 | Nonspecific | |||
| AspN | GluC | Elastase | 1 | 1 | Nonspecific | |||
| AspN | GluC | LysC | 1 | 1 | Nonspecific | |||
| AspN | GluC | Trypsin | 1 | 1 | Nonspecific | |||
| AspN | LysC | Chymotrypsin | 1 | 1 | Nonspecific | |||
| AspN | LysC | Elastase | 1 | 1 | Nonspecific | |||
| AspN | LysC | Trypsin | 1 | 1 | Nonspecific | |||
| Chymotrypsin | Elastase | Trypsin | 1 | 1 | Nonspecific | |||
| GluC | Chymotrypsin | Elastase | 1 | 1 | Nonspecific | |||
| GluC | Chymotrypsin | Trypsin | 1 | 1 | Nonspecific | |||
| GluC | Elastase | Trypsin | 1 | 1 | Nonspecific | |||
| GluC | LysC | Chymotrypsin | 1 | 1 | Nonspecific | |||
| GluC | LysC | Elastase | 1 | 1 | Nonspecific | |||
| GluC | LysC | Trypsin | 1 | 1 | Nonspecific | |||
| LysC | Chymotrypsin | Elastase | 1 | 1 | Nonspecific | |||
| LysC | Chymotrypsin | Trypsin | 1 | 1 | Nonspecific | |||
| LysC | Elastase | Trypsin | 1 | 1 | Nonspecific | |||
LC-MS/MS Analysis
All digests were analyzed using Q Exactive and Orbitrap Elite mass-spectrometers (Thermo Fischer, Bremen). Single and double enzyme digestions were injected in triplicate using a 160 min analytical gradient. Triple sequential digests were injected once on each system, after preliminary analyses indicated limited improvement in identifications over single and double enzyme digests. Full details of LC-MS/MS methods are given in the supplementary methods. Fig. 1 shows the general experimental design, detailing the MS analysis performed on each sample.
Fig. 1.

A multi-protease approach for bottom-up proteomics. Forty-eight single, double, and triple-enzyme sequential digests were analyzed by LC-MS/MS using Orbitrap Elite CID and QExactive HCD. The five best digests by complimentary proteome amino acid coverage for CID and HCD were then identified, and SAX fractionated to achieve deeper proteome coverage. All resulting data was used to build Confetti, our web-accessible coverage map of the HeLa proteome.
Peptide Identification
After conversion to MGF format, peak lists were searched using OMSSA 2.1.8 (12) and X!Tandem 2008.12.01.1 (13) within CPFP version 2.0.3 (14, 15). HPC functionality was enabled with database searches performed on the TACC LoneStar4 compute cluster, as detailed in Trudgian and Mirzaei (15). All searches were performed against the UniProtKB human complete proteome sequence database (release 2012_04) (16). Reversed decoy sequences were appended to the database to permit FDR analysis (total 162,388 sequences). Decoys were split into two sets, each containing 50% of the reversed sequences. Fixed carbamidomethylation of cysteine and variable oxidation of methionine were the only PTMs specified for searches. Q Exactive HCD data were searched with precursor and fragment mass-tolerances of 20 ppm and 0.1Da respectively. Orbitrap CID, ETD, and CID-ETD data were searched at 20 ppm and 0.5 Da precursor and fragment values. Consideration of incorrect monoisotopic peak-picking was enabled, allowing mass errors corresponding to the first or second 13C containing peak for each peptide.
Enzyme specificities chosen for searches were limited by the options supported by search engines and post-processing tools. Whenever an appropriate specific cleavage definition was consistent between all tools it was used, with the exception of elastase digests. We routinely observe greater performance from elastase searches using a nonspecific enzyme option, rather than the typical AGILV motif. This is supported by Rietschel et al. who noted substantial levels of cleavage at Ser and Thr (17). Combinations of Lys-C, ArgC, and trypsin that are expected to cleave at both Arg and Lys residues were searched with tryptic specificity. All other combination digests were searched using the nonspecific digest option. Three missed cleavages were permitted for specific searches. The length of peptides in nonspecific searches was limited to 30 amino acids for X!Tandem, and the default setting of 40 amino acids for OMSSA. Minimum peptide length in search results was seven amino acids. A summary of enzyme specificities is given in Table I. Annotated spectra for all PSMs can be accessed via the confetti web tool. Single-hit protein IDs are listed in supplemental Table S11 with spectra provided.
Proteome Amino Acid Coverage and Digest Complementarity
The coverage and complementarity of digests was assessed using a proteome amino acid coverage (PAAC) metric in order to select a subset of digests for deeper proteome coverage in a SAX fractionated workflow. The PAAC metric counts the number of amino acids in the protein sequence database that are covered by an identified peptide, after every peptide is mapped to all matching protein sequences. It is simple and quick to compute, a requirement to perform a tractable analysis of the complementarity of the 48 digests. A peptide to protein mapping is constructed once, from all peptides identified across all digests. The coverage of any subset of digests can then be calculated by querying this map.
The mean sequence coverage of proteins identified in an analysis is a more widely used and intuitive metric, but requires that protein identifications must first be inferred from the peptide identifications obtained. Protein inference is a complex and computationally expensive problem compared with computing PAAC. To compute just the coverage of every possible pair of digests 1128 individual computations must be made, and for triplets 17,296 computations would be required. Performing protein inference to compute mean protein sequence coverage was not feasible at this scale. Full detail regarding the implementation of the PAAC computation is given in the supplementary methods.
Despite the speed of computing PAAC, it is not reasonably possible to exhaustively assess the coverage of combinations of digests beyond a depth of three digests. Identifying the best combination of four digests would require 194,580 PAAC computations, needing 6.7 days assuming 3 s per computation. We wished to perform deep SAX fractionated proteome analysis with the best combination of five digests for HCD and CID platforms, requiring 1,712,304 PAAC computations (approx. 59 days) to identify exhaustively. A heuristic greedy forward selection algorithm (18) was employed to arrive at an approximately correct solution in reasonable time. Details are given in the supplementary methods.
SAX Fractionated Analyses
Strong anion-exchange fractionation (SAX) of the selected complimentary digests was carried out using a StageTip-based fractionation protocol with minor modifications (19). Briefly, digests prepared from 100 μg of total proteins were loaded into 200 μl tip columns packed with six layers of 3M Empore anion-exchange disk (1214–5012, Varian, Palo Alto, CA, U.S.A.). Britton and Robinson universal buffers (containing 20 mm acetic acid, 20 mm phosphoric acid, and 20 mm boric acid) were prepared at pH 11.0, 8.0, 6.0, 5.0, 4.0, 3.0, and 2.0. Digests were loaded in pH 11.0 buffer, and the flow-through and seven other eluates using pH 8.0, 6.0, 5.0, 4.0, 3.0, 2.0, and 80% acetonitrile with 0.1% TFA were collected sequentially. The addition of the 80% ACN elution has been observed in our laboratory to result in increased peptide identifications, and is discussed later with reference to differences between the fractionation outcomes on alternative digests.
LC-MS/MS analysis of the fractions was performed as described for unfractionated samples, except that the shallow portion of the LC gradient was adjusted to a linear gradient of 1%–25% acetonitrile in 0.1% formic acid over 200 min. Triplicate injections were carried made on the QExactive HCD and Orbitrap Elite CID platforms. MzML peak-list files were generated using ProteoWizard msconvert (version 3.0.4778) with the MS2Denoise filter. Peptide identification was performed as for unfractionated digests, but using CPFP - version 2.1.0, with X!Tandem 2008.12.01.1 (Native and K-Score plugins), OMSSA 2.1.8, MyriMatch 2.1.138 (20).
Protein Inference and Confetti Build
The ProteinProphet tool used for protein inference in CPFP does not scale well to extremely large data sets, often computing inaccurate probabilities (21). It is also cumbersome to use with extremely large XML input and output files on a data set of this nature. Alternative Bayesian inference methods such as Fido (22) and MSBayesPro (23) have other drawbacks: although they are capable of accurate probability calculation they are prohibitively slow to use on data of this size. It would also be difficult or impossible to derive the necessary accurate prior probabilities for peptide emission and detectability, as our data set consist of peptides drawn from many different digests and instrument methods.
To identify sets of proteins observed across several large combinations of digests we used a greedy minimal set cover (MSC) algorithm (see supplementary methods), which is also implemented in the stand-alone IDPicker described by Zhang et al. (24). The final set of 7,774,832 peptide-spectrum matches with a q-value of 0.01 or lower (1% FDR) was imported into the Confetti MySQL database from CPFP. We extracted all unique peptide sequences, and filtered to a 1% FDR at the unique peptide level. The remaining 419,952 peptide sequences were mapped to the UniProt Human database. The greedy MSC algorithm was then used to resolve ambiguity. Resultant protein groups were assigned a score equal to the highest probability among nondegenerate peptide sequences (unique to the protein). Q-values for each protein group were estimated by counting decoy sequences. A protein group is considered a decoy group if any of its same-set sequences (containing all peptides assigned to the group) are decoy sequences. All statistics in this manuscript are given after filtering to a 1% FDR (q-value ≤ 0.01). A complete list of proteins identified is given in supplemental Table S10.
Confetti Web Site
The Confetti web application provides access to the protein, peptide, and coverage information in the Confetti MySQL database. It is a Perl application built using the Catalyst Model-View-Controller framework. Confetti features the ability to search for a protein of interest and visualize or download coverage information for digests performed in this study. Candidate SRM peptides for a protein can be generated from the SAX data. MS/MS spectrum used to build the database can be viewed online, and can be exported in the NIST .msp spectral library format from the SRM design tool.
SRM Experimental Design
To demonstrate the utility of nontryptic peptides for SRM we first identified the best digest to generate three SRM candidate peptides for proteins in the HCD SAX data set. Three gene-unique peptides were required to ensure assay specificity according to best practices (25). The best digest was then chosen, according to the number of spectral counts observed for the weakest of the three peptides in each digest. We selected eight proteins for a pilot SRM experiment using AspN and trypsin, where AspN gave a large increase (>5-fold) in SRM candidate peptide spectral counts versus trypsin. We required that the proteins be identified with both AspN and trypsin to ensure they were targetable by SRM with both enzymes in our sample. Three AspN SRM candidate peptides were needed, but a single tryptic peptide was satisfactory for inclusion (see below). supplemental Table S5 lists all proteins with three valid SRM candidate peptides in Confetti, and highlights those chosen for the SRM experiment.
AspN SRM peptides were selected using the confetti web-based SRM design tool. Tryptic peptides were chosen from PeptideAtlas (26), selecting peptides with highest Empirical Suitability Score (ESS), avoiding methionine containing sequences unless alternatives had far lower ESS. Our rationale for using PeptideAtlas was that the tryptic assays would not be hampered by the smaller amount of tryptic information in confetti versus other resources. 48 Pepotec Grade 3 crude synthetic heavy-isotope peptides were obtained from Pierce Biotechnology, (Rockford, IL), with typical sequence purities of 10%–80% and isotopic purities >99%. All tryptic peptides contained either C-terminal Lys[13C(6)15N(2)] or Arg[13C(6)15N(4)] with the exception of a single terminal peptide labeled with Phe[13C(9)15N(1)]. AspN peptides are labeled with one of Lys[13C(6)15N(2)], Phe[13C(9)15N(1)], Arg[13C(6)15N(4)], Pro[13C(5)15N(1)], or Leu[13C(6)15N(1)]. Heavy amino acids for AspN peptides were selected based on availability, cost, mass shift, and proximity to the C-terminal. We selected an amino acid closest to the C-terminal that had a large enough mass shift to prevent cross-talk between heavy and light.
SRM Mass Spectrometry and Data Analysis
SRM assays were performed using a 6500 QTRAP (AB Sciex, Foster City CA) mass-spectrometer, coupled to an Ultimate 3000 RSLCnano HPLC system equipped with a PepMap100 reverse-phase C18 column (75 μm × 15 cm) (Dionex, Sunnyvale, CA, U.S.A.). Separation of peptides was carried out at 200 nl/min using a gradient from 0%–25% B in 15 min, 25%–35% B in 5 min, and 35%–80% B in 5 min, where mobile phase A was 0.1% formic acid in water and mobile phase B was 0.08% formic acid in 10% water, 80% acetonitrile, and 10% trifluoroethanol.
The top seven transitions per peptide were first identified using Skyline v1.4 on data acquired from heavy peptide mixtures. Lists of the transitions, retention times, declustering potentials, and collision energies used for tryptic and Asp-N peptides are given in supplemental Tables S7 and S8. Full details of LC-MS parameters and assay optimization are given in the supplementary methods. Three separate digests of HeLa cell lysate were performed using each of AspN and trypsin, and the resulting mixtures spiked with heavy peptides. Samples were run as follows: each replicate digest was injected with AspN and tryptic digests interleaved - AspN1, Trypsin1, AspN2, Trypsin2, AspN3, and Trypsin3. This procedure was then repeated twice, so that each replicate digest was analyzed a total of three times, with an equal number of other samples run between repeat injections of any given digest. This experimental design was chosen to allow separation of digest replicate effects from sample degradation or any loss in LC or MS performance throughout the experiment.
Data was analyzed using Skyline (version 1.4) (27). Transition chromatograms were manually inspected to ensure presence of sufficient confirming ions, absence of interference, and correct peak selection with reference to signals from the heavy peptide standards. The top three most intense transitions per peptide were selected for quantitation using integrated peak areas. Results from Skyline were exported for further analysis using the R statistical environment (28). For each replicate, peak areas for the three transitions per peptide were summed. The resulting peptide areas are plotted by digest and injection in supplemental Fig. S7 (Asp-N peptides) and supplemental Fig. S8 (tryptic peptides). Full results are given in supplemental Table S9.
RESULTS
We first analyzed an unfractionated HeLa lysate using a comprehensive panel of seven single-enzyme digests, 21 double-enzyme digests, and 20 triple-enzyme digests. Every digest was run on both Orbitrap Elite and Q Exactive instrumentation using CID and HCD fragmentation respectively. Including replicates, a total of 208 injections with 160 min analytical gradients were made, requiring ∼30 days of continuous acquisition time. After conversion to MGF peak list format, which excludes MS survey scan data, 68.9 GB of MS/MS spectral data were searched for peptide ID using our in-house developed pipeline. Although many digests were searched using specific enzyme definitions, the majority of combination digests required lengthy nonspecific searches. Approximately 40,000 core-hours of compute time on the Texas Advanced Computing Center Lonestar4 system were consumed during the project, including method development and the analysis of final experimental data.
Standard tryptic analysis of the unfractionated HeLa lysate by CID and HCD methods yielded a total of 4155 protein groups at an estimated 1% FDR, with mean sequence coverage of 20.2%. HCD analysis on the QExactive was superior to CID analysis on the Orbitrap Elite. Individually 3476 protein groups were found using Elite CID and 3985 by Q Exactive HCD. Others have found a slight advantage for Orbitrap Elite CID analysis of complex lysates (29, 30). The small increase of 170 protein groups when CID data is added to HCD shows there is little reason to use both instruments for tryptic work. We continued to use both instruments in this project to identify any differences in performance on nontryptic digests. Limited analysis of single and double digests was performed using ETD and CID-ETD decision-tree analysis (31) on the Orbitrap Elite, but this was not pursued because of the small increases in proteome coverage observed (supplemental Table S1 and S4), and restrictions on instrument time available for the project.
Once peptide identifications were obtained for all 48 digests of the lysate we examined their complementarity using a simple Proteome Amino Acid Coverage metric, counting the number of amino acids in the proteome covered by identified peptides. PAAC was computed across all replicate injections of a digest. The large number of comparisons to perform between the 48 digests prohibits computing mean protein sequence coverage (see supplementary methods). Tryptic baseline PAAC was 976,667 AA for CID, and 1,198,540 from HCD data. We used a forward selection algorithm to identify the order in which digests should be combined to maximize PAAC, separately for HCD and CID analyses. If selections were made from both CID and HCD data then HCD digests were strongly preferred.
On HCD data trypsin, LysC, AspN, ArgC-Trypsin, and GluC digests were selected in that order. Adding LysC gave a 25.29% increase in PAAC over trypsin alone. The remaining digests gave further consecutive improvements of 16.66%, 10.41%, and 7.64%. Overall using these best five digests raised PAAC to 194% of the tryptic value, for a 500% increase in acquisition time. In the CID case trypsin, LysC, Chymotrypsin-Trypsin, GluC, and AspN were chosen. Overall these digests raised PAAC to 200% of the CID tryptic value. The full selection trees, to a complete depth of 48 digests, can be found in supplemental Tables S2 and S3. As the number of digests selected increases, the improvement in PAAC realized by each subsequent addition drops rapidly, as seen in Fig. 2A for HCD data. After the results of eight digests have been combined each further digest raises PAAC by <5%. At a depth of 18 digests additions in both CID and HCD have <1% additional benefit. Ultimate PAAC using all 48 single, double and triple enzyme digests reaches 3,544,328 AA for HCD versus 3,020,924 for CID—approximately triple the coverage of a tryptic digest, but requiring 48× acquisition time.
Fig. 2.
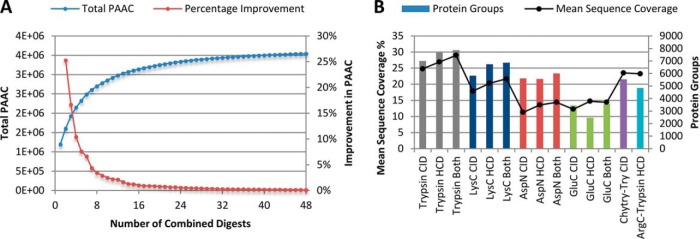
A, As up to 48 single, double, and triple enzyme HeLa lysate digests are combined, total proteome amino acid coverage (PAAC) increases, reaching ∼3x of trypsin alone (HCD analysis). The percentage improvement with each addition drops rapidly as the total number of digests grows. B, Mean sequence coverage and number of protein groups identified for CID and HCD analyses of SAX-fractionated digests, using the best five enzyme combinations for each method.
We proceeded to digest additional lysate with each of the ‘best 5’ digests identified for both HCD and CID, and then fractionated these digests using SAX to achieve deep proteome coverage. Fig. 2B shows the number of protein groups identified and sequence coverage achieved for these digests. We found that although Q Exactive HCD analysis was superior to Orbitrap Elite CID for trypsin and LysC, CID analysis identified 39% more proteins from our GluC digest. However, sequence coverage was greater on the smaller set of proteins in the GluC HCD data. Combining HCD and CID data always resulted in a small increase in the number of protein groups identified.
Despite the different cleavage specificities of the digests, which result in peptides having differing physiochemical characteristics (9), our SAX fractionation had consistent performance. We observed that the distribution of peptides among fractions was similar, as seen in Fig. 3A for HCD data. Generally the most basic (pH11), most acidic (pH3 + pH2), and ACN elutions contained the highest number of unique and total peptide identifications. pH5 and pH4 fractions always had fewer peptide IDs, suggesting that the pH5 elution could be dropped with little effect on overall results. The addition of the final 80% ACN elution that is not present in the original SAX stage-tip protocol is warranted, because up to 7146 unique peptides were found in this elution (Trypsin HCD). Only AspN digests have a lower number of unique peptides found in the ACN elution than the pH2 elution, and this number is still higher than for the central pH4/pH5 fractions. Across digests and instruments the resolution of separation was consistent. A mean (over three replicate injections) of between 54.4% and 64.1% of peptides identified were unique to a single SAX fraction. Fig. 2B shows the uniqueness of peptide identifications in the Trypsin HCD data set, and is typical across all digests (see supplemental Figs. S1–S4 for other digests). The CVs for total number of unique peptides identified across triplicate injections varied between 4.6% and 23.5% (supplemental Table S1). Surprisingly, total peptide numbers were most variable for LysC digests on both Orbitrap and Q Exactive (CVs 13.1% and 23.5%), whereas AspN had lowest variation (CV 4.6% HCD). CID and HCD analysis had similar mean CVs across all digests (9.8% versus 10.7%).
Fig. 3.

Resolution of SAX fractionation for five digests analyzed with Q Exactive HCD LC-MS/MS. A, Graphs show the mean number of peptide identifications for each fraction, across three replicate injections. Colored stacked bars indicate the number of peptides in each fraction that are unique to that fraction (green, labeled) or present in 2–8 fractions. Total peptide IDs per fraction are given above bars. B, Proportions of fraction-unique and duplicated peptide identifications across the trypsin SAX data set. Across three replicate injections a mean of 57.5% of peptide sequences were identified in a single SAX fraction.
Once data for all unfractionated and SAX samples were accumulated we built the database of protein coverage that underlies our Confetti web tool. On multiple subsets of both unfractionated and fractionated data we performed protein inference, to find parsimonious lists of protein identifications that can be made from the data. Fig. 4A presents the number of protein groups identified, and mean sequence coverage across those groups, for select subsets of our digests. Further detail can be found in supplemental Table S4 where statistics are given for additional subsets of our digests, and separately for CID and HCD runs. On our unfractionated lysate, combing all single-enzyme digests gave 5225 protein groups and 32.5% mean sequence coverage, versus 4155 groups and 20.2% coverage for trypsin alone. Addition of the 21 double, and 20 triple-enzyme digests did not increase protein identifications appreciably, but improved mean sequence coverage to 40.7% and 42.0% respectively. The number of unique peptides observed, both total and per protein, increases markedly when additional digests are added to an analysis (supplemental Table S4). However, the complex double and triple digests mostly provide redundant coverage of the same portions of protein sequence as single enzyme digests.
Fig. 4.
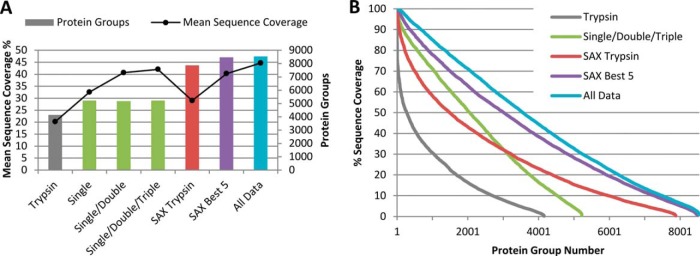
Multiple digests substantially improve protein identification and sequence coverage. A, Total number protein groups identified and mean percentage sequence coverage for combinations of tryptic digests, 48 unfractionated single/double/triple enzyme digests, and SAX fractionated “best 5” digests. B, Distribution of sequence coverage among all protein groups identified at a 1% FDR using various digests. Using multiple digests sequence coverage decreases more slowly as protein depth increase than for trypsin alone.
For SAX fractionated lysate our panel of six digests (best five on each of CID and HCD) delivered a total of 8470 protein groups identified with a mean of 40.3% sequence coverage. Again, the increase in depth of protein identifications is limited—trypsin alone gave 7877 protein groups. The additional 11.3% mean sequence coverage does, however, allow access to a substantially larger portion of the proteome's sequence. Our final coverage map of the HeLa proteome, accessible through the Confetti web tool, incorporates all unfractionated and fractionated data for a total of 8539 protein groups with 44.7% mean sequence coverage. These proteins were identified from 419,952 unique peptide sequences, with a mean of 54 sequences and 1045.3 PSMs assigned per protein. A mean of 665.6 PSMs and 39 peptides per protein are from sequences unique to a single protein group. ≥75% coverage was achieved for 1698 proteins, and ≥50% coverage for 3558 proteins, as seen in Fig. 4B. The decrease in sequence coverage seen as protein depth increases is shallower when multiple enzyme digests are performed.
To demonstrate the utility of Confetti for SRM assay design, and the suitability of nontryptic peptides, we conducted an SRM experiment. Using our HCD SAX fractionated data we first asked “which digest produces the most observed set of three peptides that are unique to a specific gene?” The requirement of three unique peptides per protein is best-practice in SRM experiments to ensure specificity (25). The sensitivity of an assay then depends on the ionization efficiency and fragmentation, or observability, of the poorest of these three peptides. From our data set, observability can be approximated by the number of peptide spectrum matches (PSMs) per peptide. Although we use fractionated data to identify candidate SRM peptides, we propose that unfractionated assays are possible because of the superior sensitivity of SRM versus shotgun proteomics (5).
We found 6528 protein sequences from 6056 genes that had three or more candidate peptides per digest, from one or more digests. For each sequence, digests were ranked according to the number of PSMs observed for the weakest of the three candidate peptides. Fig. 5A shows the distribution of the top-ranked digests across these proteins. Trypsin and Lys-C digests are preferred for the majority (75%) of proteins, as expected. However, a large number of proteins have three candidate peptides with greater predicted observability from alternative digests. PSM statistics for the preferred and tryptic digests are given for each sequence in supplemental Table S5.
Fig. 5.
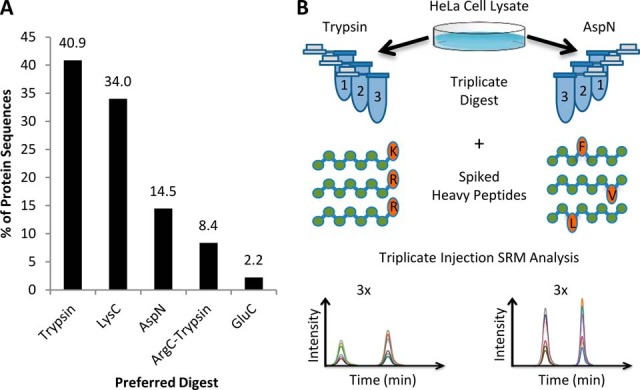
A, The Top5 SAX data set was used to identify the single digest that produced the three most abundant SRM candidate peptides per protein group. Chart shows the percentage of proteins in which each enzyme produces the most abundant three candidate peptides by spectral counting. B, The SRM workflow used to validate digestion reproducibility and determine peak areas of Asp-N and tryptic peptides for eight proteins.
We examined protein length and grand average hydropathy (GRAVY score) (32) distributions for proteins with different SRM candidate digest preferences (supplemental Figs. S5–S6). Applying the Mann-Whitney U test, protein lengths for LysC, AspN, and ArgC-Trypsin were significantly different than trypsin (p values <2.2 × 10⁻¹⁶, 8.6 × 10⁻⁹, 2.4 × 10⁻⁵). GRAVY scores were significantly different versus trypsin for LysC (p < 2.2 × 10⁻¹⁶) and ArgC-Trypsin (p 2.2 × 10⁻⁷). LysC preference proteins had lower median GRAVY score, and higher median protein length. ArgC-Trypsin results had lower median protein length, and higher GRAVY score. To follow-up we performed Gene Ontology term enrichment analysis using GOrilla (33). For each digest at least one GO term was significantly enriched (FDR q-value <0.05) versus a background of all protein sequences across the five digests (supplemental Table S6). However, the magnitude of enrichments was generally small. Enrichment >2-fold was observed for chromosome and nuclear related terms in the set of proteins with LysC-preferred SRM candidates. For Asp-N, extracellular components are most enriched.
We continued, selecting eight proteins with AspN preference for the SRM experiment (Fig 5B), as described in the experimental procedures. We hypothesized that these proteins (AKR1C3, ALDH3A1, CAV1, CD9, CHMP1B, PODXL, PSMB8, and SERPINB5) would be easier to assay in lysate using Asp-N than trypsin because of differences in spectral count values for the candidate peptides. Three peptides were chosen for AspN and tryptic SRM assays of each of these eight proteins. Mis-cleavage present in tryptic digests was recently examined in a study proposing that the addition of Lys-C allows more complete, reproducible digestion for SRM assays (34). Digestion enzymes other than trypsin may produce mis-cleaved peptides more frequently, to the extent that mis-cleaved forms can be dominant (35). Our candidate assays include mis-cleaved peptides because of this. The increased sensitivity afforded by a nontryptic peptide must be balanced against a possible reduction in reproducibility.
Equal starting quantities of HeLa lysate were digested in triplicate using AspN and trypsin. Samples were injected three times and the light peak areas for the top three transitions per peptide for each protein were measured. Isotopically pure, but sequence impure heavy standards were used for prior assay optimization and to ensure quantification of the correct peptide in the lysate. Sensitivity of the trypsin and AspN assays was compared using light peak areas only, in a label-free analysis. We specifically wish to identify differences in ionization efficiency between our AspN and tryptic SRM peptides that could be exploited. Higher ionization efficiency leading to greater peak area for an AspN peptide infers greater sensitivity than the tryptic assay.
For five of the proteins greater peak areas were obtained from Asp-N than trypsin digestion (Fig. 6). The largest increase in peak area, summed across the top three transitions for three peptides, was 6.4-fold observed for ALDH3A1. PODXL lost the greatest amount of sensitivity using Asp-N with a fivefold decrease in signal versus tryptic digest. Over three replicate digests × three replicate injections the mean coefficient of variance for peak areas across the eight proteins was 14.2% for trypsin and 14.7% for Asp-N. By two-way ANOVA we found no significant effect on peak area between replicates of either Asp-N or tryptic digests (p values 0.16 Asp-N, 0.32 trypsin), after mean-centering and scaling to remove heteroscedasticity in the raw peak areas. A greater effect on peak area was observed between replicate injections (p values 0.03 Asp-N, 0.05 trypsin). Homoscedasticity of the transformed peak areas with respect to grouping by digest and injection was confirmed using Levene's test (p values 0.9986 Asp-N, 0.9955 trypsin). Normality was observed using Q-Q plots.
Fig. 6.

Testing the suitability of alternative enzymes (Asp-N) for SRM assay development. A comparison of summed peak areas for eight proteins - three peptides per protein, with three transitions measured per peptide. AspN peak areas exceed tryptic signal for five proteins, indicating improved ionization and/or transition response can be achieved for some assays using alternative digests. CV of peak area measurements is comparable.
Sensitivity improvements, as judged by peak area, are lower than would be expected from shotgun spectral counts. Imperfect correlation between spectral counts and SRM sensitivity has been noted by others, but the proposed alternative using full-length expressed protein for SRM assay design (36) is likely to be prohibitively complex for many laboratories. However, we believe we have demonstrated that alternative enzyme digests may be more sensitive in some cases. In this experiment we injected every replicate digest once, interleaving tryptic and AspN digests, before performing second and then third replicate injections of all digests. In our hands, the variation in peak area between triplicate digests (affected by digest reproducibility) was lower than the variation in peak area across the replicate injections of a digest (from sample degradation or deteriorating LC/MS performance). This finding is unusual, and likely reflects the fact our replicate digests were performed in a batch, rather than over time, by different staff, or in different facilities. Nonetheless we believe it indicates that, at least using AspN, alternative digest SRM assays need not be less reproducible that tryptic assays.
DISCUSSION
Significant progress has been made in recent years to improve the number of proteins identified from complex proteomes such as cell lysate or plasma. Comparatively little attention is paid to the issue of individual protein sequence coverage, but as more and more fields rely on proteomics to address their specific problems it is becoming clear that increased sequence coverage is necessary. For example, in biochemistry where proteins are expressed and purified routinely to find novel PTMs via shotgun proteomics, better sequence coverage is necessary to cover as many amino acids as possible. Other targeted assays using SRM rely on the availability of targetable peptides. Many peptides are not suitable for synthesis or not stable enough for long-term experiments, so increased sequence coverage is needed to provide more targets for reliable assays. In SISCAPA (stable isotope standards and capture by antipeptide antibodies) (37) experiments the inability to develop viable antibodies against certain peptides can further reduce the number of SRM assay targets (38). Understanding how to achieve redundant coverage of regions of sequence using overlapping peptides from multiple digests can be valuable in these and other studies.
Our results reinforce those of previous studies that have clearly demonstrated the ability of multiple enzyme digests to increase protein sequence coverage in complex samples. An increase in both protein identifications and mean sequence coverage was observed as nontryptic digests were added to the analysis of a single HeLa lysate sample. We expanded on previous work by examining a large panel of double and triple enzyme digests. Although the use of double-enzyme digests did not raise number of protein groups identified, the 7% increase in mean sequence coverage and the improved number of unique peptides per protein indicate the potential for these multienzyme digests to expand coverage of difficult regions of a protein sequence. In some cases the complexity of these digests will be outweighed by the need to observe specific portions of a sequence. Our data set does not achieve as many protein identifications as some other efforts, because we use less fractionation than for example, by Nagaraj et al. (single stage versus two-stages). The depth of protein identifications is primarily limited by dynamic range rather than enzyme bias, and addressed by fractionation. We wished to address total sequence coverage, where we have shown that enzyme specificity is a major factor. We believe that the total number of unique peptide sequences identified in our study (419,952) is the largest achieved from a single origin sample. This number includes a large amount of redundant coverage from similar peptides originating from different digests. It is greater than the number of sequences present in the current PeptideAtlas Human build which lists 338,013 unique sequences from > 60 million PSMs (26, 39).
Although trypsin is an efficient and robust digestion enzyme that generates peptides with favorable characteristics for MS experiments, it may not always be the best choice for targeted SRM assays (33) and may not provide coverage of a region of interest. Our web tool, Confetti (https://proteomics.swmed.edu/confetti), provides easy access to coverage maps by digest that indicate when nontryptic digests may be usefully employed to cover a specific region of a protein sequence that may contain for example, an important PTM. For general SRM transition design Confetti will report the most commonly observed peptides per protein for various digests and can filter for gene/sequence exclusivity and other sequence requirements.
We have shown that alternative enzymes can be used successfully for SRM experiments based on the reproducibility of the Asp-N digest, increase in peak area versus tryptic assays for some proteins, and the availability of affordable heavy peptide standards. Though shotgun spectral-counts are not wholly predictive of SRM assay sensitivity we believe that nontryptic digestion will be increasingly used in targeted proteomics for proteins that are difficult to observe with trypsin, and where coverage of specific regions of a sequence is necessary.
Finally, the range of digestions performed here, and the scale of the MS analysis, has produced a valuable representative data set of peptide and protein identifications that can be exploited for software development. We believe the data set will permit and encourage the development and refinement of tools for nontryptic digest prediction and peptide observability calculations.
Supplementary Material
Acknowledgments
We thank the Texas Advanced Computing Center (TACC) at The University of Texas at Austin for providing HPC resources that have contributed to the research results reported within this paper. We thank Benjamin Thomas and Philip Charles, University of Oxford for mass-spectrometry discussion and software bug fixes.
Footnotes
Author contributions: X.G., D.C.T., A.L., and H.M. designed research; X.G., D.C.T., A.L., and S.Y. performed research; D.C.T. contributed new reagents or analytic tools; X.G., D.C.T., A.L., and H.M. analyzed data; X.G., D.C.T., A.L., S.Y., and H.M. wrote the paper.
* This work was supported by Cancer Research and Prevention Institute of Texas grants RP120613 and R1121 to HM, and an AWS in Education Research Grant to DCT.
 This article contains supplemental Figs. S1 to S9 and Tables S1 to S12.
1 The abbreviations used are:
- PTM
- posttranslational modification
- SRM
- Selected Reaction Monitoring
- SAX
- Strong-anion Exchange
- CID
- Collision Induced Dissociation
- HCD
- Higher-energy Collisional Dissociation
- CPFP
- Central Proteomics Facilities Pipeline
- PAAC
- Proteome Amino Acid Coverage
- MSC
- Minimal Set Cover
- PSM
- Peptide to Spectrum Match
- FASP
- Filter-Aided Sample Preparation
- HCD
- Higher-Energy Collisional Dissociation.
REFERENCES
- 1. Sanders W. S., Bridges S. M., McCarthy F. M., Nanduri B., Burgess S. C. (2007) Prediction of peptides observable by mass spectrometry applied at the experimental set level. BMC Bioinformatics 8, S23. [DOI] [PMC free article] [PubMed] [Google Scholar]
- 2. Eichacker L. A., Granvogl B., Mirus O., Muller B. C., Miess C., Schleiff E. (2004) Hiding behind hydrophobicity: transmembrane segments in mass spectrometry. J. Biol. Chem. 279, 50915–50922 [DOI] [PubMed] [Google Scholar]
- 3. Meyer B., Papasotiriou D. G., Karas M. (2011) 100% protein sequence coverage: a modern form of surrealism in proteomics. Amino Acids 41, 291–310 [DOI] [PubMed] [Google Scholar]
- 4. Nature Methods (2013) Method of the Year 2012. Nat. Methods 10, 1. [DOI] [PubMed] [Google Scholar]
- 5. Ebhardt H. A., Sabido E., Huttenhain R., Collins B., Aebersold R. (2012) Range of protein detection by selected/multiple reaction monitoring mass spectrometry in an unfractionated human cell culture lysate. Proteomics 12, 1185–1193 [DOI] [PubMed] [Google Scholar]
- 6. MacCoss M. J., McDonald W. H., Saraf A., Sadygov R., Clark J. M., Tasto J. J., Gould K. L., Wolters D., Washburn M., Weiss A., Clark J. I., Yates J. R., 3rd (2002) Shotgun identification of protein modifications from protein complexes and lens tissue. Proc. Natl. Acad. Sci. U.S.A. 99, 7900–7905 [DOI] [PMC free article] [PubMed] [Google Scholar]
- 7. Choudhary G., Wu S. L., Shieh P., Hancock W. S. (2003) Multiple enzymatic digestion for enhanced sequence coverage of proteins in complex proteomic mixtures using capillary LC with ion trap MS/MS. J. Proteome Res. 2, 59–67 [DOI] [PubMed] [Google Scholar]
- 8. Biringer R. G., Amato H., Harrington M. G., Fonteh A. N., Riggins J. N., Huhmer A. F. (2006) Enhanced sequence coverage of proteins in human cerebrospinal fluid using multiple enzymatic digestion and linear ion trap LC-MS/MS. Brief Funct. Genomic Proteomic 5, 144–153 [DOI] [PubMed] [Google Scholar]
- 9. Swaney D. L., Wenger C. D., Coon J. J. (2010) Value of using multiple proteases for large-scale mass spectrometry-based proteomics. J. Proteome Res. 9, 1323–1329 [DOI] [PMC free article] [PubMed] [Google Scholar]
- 10. Nagaraj N., Wisniewski J. R., Geiger T., Cox J., Kircher M., Kelso J., Paabo S., Mann M. (2011) Deep proteome and transcriptome mapping of a human cancer cell line. Mol. Syst. Biol. 7, 548. [DOI] [PMC free article] [PubMed] [Google Scholar]
- 11. Wisniewski J. R., Mann M. (2012) Consecutive proteolytic digestion in an enzyme reactor increases depth of proteomic and phosphoproteomic analysis. Anal. Chem. 84, 2631–2637 [DOI] [PubMed] [Google Scholar]
- 12. Geer L. Y., Markey S. P., Kowalak J. A., Wagner L., Xu M., Maynard D. M., Yang X., Shi W., Bryant S. H. (2004) Open mass spectrometry search algorithm. J. Proteome Res. 3, 958–964 [DOI] [PubMed] [Google Scholar]
- 13. Craig R., Beavis R. C. (2004) TANDEM: matching proteins with tandem mass spectra. Bioinformatics 20, 1466–1467 [DOI] [PubMed] [Google Scholar]
- 14. Trudgian D. C., Thomas B., McGowan S. J., Kessler B. M., Salek M., Acuto O. (2010) CPFP: a central proteomics facilities pipeline. Bioinformatics 26, 1131–1132 [DOI] [PubMed] [Google Scholar]
- 15. Trudgian D. C., Mirzaei H. (2012) Cloud CPFP: A shotgun proteomics data analysis pipeline using cloud and high performance computing. J. Proteome Res. 11, 6282–6290 [DOI] [PubMed] [Google Scholar]
- 16. UniProt Consortium (2012) Reorganizing the protein space at the Universal Protein Resource (UniProt). Nucleic Acids Res. 40, D71–75 [DOI] [PMC free article] [PubMed] [Google Scholar]
- 17. Rietschel B., Arrey T. N., Meyer B., Bornemann S., Schuerken M., Karas M., Poetsch A. (2009) Elastase digests: new ammunition for shotgun membrane proteomics. Mol. Cell. Proteomics 8, 1029–1043 [DOI] [PMC free article] [PubMed] [Google Scholar]
- 18. Guyon I., Elisseeff A. (2003) An introduction to variable and feature selection. J. Mach. Learn. Res. 3, 1157–1182 [Google Scholar]
- 19. Wisniewski J. R., Zougman A., Mann M. (2009) Combination of fasp and stagetip-based fractionation allows in-depth analysis of the hippocampal membrane proteome. J. Proteome Res. 8, 5674–5678 [DOI] [PubMed] [Google Scholar]
- 20. Tabb D. L., Fernando C. G., Chambers M. C. (2007) MyriMatch: Highly accurate tandem mass spectral peptide identification by multivariate hypergeometric analysis. J. Proteome Res. 6, 654–661 [DOI] [PMC free article] [PubMed] [Google Scholar]
- 21. Reiter L., Claassen M., Schrimpf S. P., Jovanovic M., Schmidt A., Buhmann J. M., Hengartner M. O., Aebersold R. (2009) Protein identification false discovery rates for very large proteomics data sets generated by tandem mass spectrometry. Mol. Cell. Proteomics 8, 2405–2417 [DOI] [PMC free article] [PubMed] [Google Scholar]
- 22. Serang O., MacCoss M. J., Noble W. S. (2010) Efficient marginalization to compute protein posterior probabilities from shotgun mass spectrometry data. J. Proteome Res. 9, 5346–5357 [DOI] [PMC free article] [PubMed] [Google Scholar]
- 23. Li Y. F., Arnold R. J., Li Y., Radivojac P., Sheng Q., Tang H. (2009) A bayesian approach to protein inference problem in shotgun proteomics. J. Comput. Biol. 16, 1183–1193 [DOI] [PMC free article] [PubMed] [Google Scholar]
- 24. Zhang B., Chambers M. C., Tabb D. L. (2007) Proteomic parsimony through bipartite graph analysis improves accuracy and transparency. J. Proteome Res. 6, 3549–3557 [DOI] [PMC free article] [PubMed] [Google Scholar]
- 25. Carr S. A., Abbatiello S. E., Ackermann B. L., Borchers C., Domon B., Deutsch E. W., Grant R. P., Hoofnagle A. N., Huttenhain R., Koomen J. M., Liebler D. C., Liu T., Maclean B., Mani D. R., Mansfield E., Neubert H., Paulovich A. G., Reiter L., Vitek O., Aebersold R., Anderson L., Bethem R., Blonder J., Boja E., Botelho J., Boyne M., Bradshaw R. A., Burlingame A. L., Chan D., Keshishian H., Kuhn E., Kinsinger C., Lee J. S., Lee S. W., Moritz R., Oses-Prieto J., Rifai N., Ritchie J., Rodriguez H., Srinivas P. R., Townsend R. R., Van Eyk J., Whiteley G., Wiita A., Weintraub S. (2014) Targeted peptide measurements in biology and medicine: best practices for mass spectrometry-based assay development using a fit-for-purpose approach. Mol. Cell. Proteomics [DOI] [PMC free article] [PubMed] [Google Scholar]
- 26. Desiere F., Deutsch E. W., King N. L., Nesvizhskii A. I., Mallick P., Eng J., Chen S., Eddes J., Loevenich S. N., Aebersold R. (2006) The PeptideAtlas project. Nucleic Acids Res. 34, D655–D658 [DOI] [PMC free article] [PubMed] [Google Scholar]
- 27. MacLean B., Tomazela D. M., Shulman N., Chambers M., Finney G. L., Frewen B., Kern R., Tabb D. L., Liebler D. C., MacCoss M. J. (2010) Skyline: an open source document editor for creating and analyzing targeted proteomics experiments. Bioinformatics 26, 966–968 [DOI] [PMC free article] [PubMed] [Google Scholar]
- 28. R Development Core Team (2005) R: A language and environment for statistical computing. R Foundation for Statistical Computing, Vienna, Austria [Google Scholar]
- 29. Pachl F., Ruprecht B., Lemeer S., Kuster B. (2013) Characterization of a high field Orbitrap mass spectrometer for proteome analysis. Proteomics 13, 2552–2562 [DOI] [PubMed] [Google Scholar]
- 30. Hebert A. S., Richards A. L., Bailey D. J., Ulbrich A., Coughlin E. E., Westphall M. S., Coon J. J. (2014) The one hour yeast proteome. Mol. Cell. Proteomics 13, 339–347 [DOI] [PMC free article] [PubMed] [Google Scholar]
- 31. Swaney D. L., McAlister G. C., Coon J. J. (2008) Decision tree-driven tandem mass spectrometry for shotgun proteomics. Nat. Methods 5, 959–964 [DOI] [PMC free article] [PubMed] [Google Scholar]
- 32. Kyte J., Doolittle R. F. (1982) A simple method for displaying the hydropathic character of a protein. J. Mol. Biol. 157, 105–132 [DOI] [PubMed] [Google Scholar]
- 33. Eden E., Navon R., Steinfeld I., Lipson D., Yakhini Z. (2009) GOrilla: a tool for discovery and visualization of enriched GO terms in ranked gene lists. BMC Bioinformatics 10, 48. [DOI] [PMC free article] [PubMed] [Google Scholar]
- 34. Glatter T., Ludwig C., Ahrne E., Aebersold R., Heck A. J. R., Schmidt A. (2012) Large-scale quantitative assessment of different in-solution protein digestion protocols reveals superior cleavage efficiency of tandem lys-c/trypsin proteolysis over trypsin digestion. J. Proteome Res. 11, 5145–5156 [DOI] [PubMed] [Google Scholar]
- 35. Keil B. (1992) Specificity of Proteolysis, Springer Verlag [Google Scholar]
- 36. Stergachis A. B., MacLean B., Lee K., Stamatoyannopoulos J. A., MacCoss M. J. (2011) Rapid empirical discovery of optimal peptides for targeted proteomics. Nat. Methods 8, 1041–1043 [DOI] [PMC free article] [PubMed] [Google Scholar]
- 37. Anderson N. L., Anderson N. G., Haines L. R., Hardie D. B., Olafson R. W., Pearson T. W. (2004) Mass spectrometric quantitation of peptides and proteins using Stable Isotope Standards and Capture by Anti-Peptide Antibodies (SISCAPA). J. Proteome Res. 3, 235–244 [DOI] [PubMed] [Google Scholar]
- 38. Lee B. S., Huang J. S., Jayathilaka G. D., Lateef S. S., Gupta S. (2010) Production of antipeptide antibodies. Methods Mol. Biol. 657, 93–108 [DOI] [PubMed] [Google Scholar]
- 39. Deutsch E. W. (2010) The PeptideAtlas Project. Methods Mol. Biol. 604, 285–296 [DOI] [PMC free article] [PubMed] [Google Scholar]
Associated Data
This section collects any data citations, data availability statements, or supplementary materials included in this article.