

Abstract
Dampness and visible mold in homes are associated with asthma development, but causal mechanisms remain unclear. The goal of this research was to explore associations among measured dampness, fungal exposure, and childhood asthma development without the bias of culture-based microbial analysis. In the low-income, Latino CHAMACOS birth cohort, house dust was collected at age 12 months, and asthma status was determined at age 7 years. The current analysis included 13 asthma cases and 28 controls. Next-generation DNA sequencing methods quantified fungal taxa and diversity. Lower fungal diversity (number of fungal operational taxonomic units) was significantly associated with increased risk of asthma development: unadjusted odds ratio (OR) 4.80 (95% confidence interval (CI) 1.04–22.1). Control for potential confounders strengthened this relationship. Decreased diversity within the genus Cryptococcus was significantly associated with increased asthma risk (OR 21.0, 95% CI 2.16–204). No fungal taxon (species, genus, class) was significantly positively associated with asthma development, and one was significantly negatively associated. Elevated moisture was associated with increased fungal diversity, and moisture/mold indicators were associated with four fungal taxa. Next-generation DNA sequencing provided comprehensive estimates of fungal identity and diversity, demonstrating significant associations between low fungal diversity and childhood asthma development in this community.
Keywords: 454 pyrosequencing, asthma, dampness, fungi, moisture, mold
Introduction
Growing evidence suggests that the development of asthma is associated with microbial exposures (Heederik et al., 2012; Mendell et al., 2011). Although the specific microbial exposure routes and causal agents are not clear (Tischer et al., 2013), qualitative assessments of dampness and visible mold in homes have been documented as consistently associated with asthma development (Quansah et al., 2012; Pekkanen et al., 2007; Mendell et al., 2011). Dampness can also contribute to changes in the indoor microbial population (Hyvärinen et al., 2002; Pitkäranta et al., 2011). The traditional fungal measurement technique of culturing has not identified consistent associations between microbial populations and asthma and severely underestimates the quantity and diversity of microorganisms (Douwes et al., 2003; Bridge et al., 2001). The lack of adequate quantitative fungal sampling and analysis techniques for use in homes has been cited as a limitation to linking indoor fungal exposure with respiratory outcomes (Hamilos, 2010; Douwes et al., 2003), and this lack of techniques prevents the development of thresholds to define health-related microbial exposure limits and identify effective interventions.
Taxonomic analysis via next-generation DNA sequencing of ribosomal RNA-encoding genes represents an underutilized opportunity to quantitatively study fungal populations in the residential environment in relation to asthma development and dampness or visible mold growth. Sequencing of the internal transcribed spacer (ITS) region of ribosomal fungal DNA allows identification down to the species level (Schoch et al., 2012). DNA sequencing of the fungal ITS region provides accurate, quantitative information about the diversity of a fungal community not available from culture-based analysis, or even quantitative polymerase chain reaction (qPCR) assays. Decreased microbial diversity has previously been associated with asthma development through culturing (Ege et al., 2011), although an ITS DNA sequence-based study of fungal diversity and asthma development has not yet been conducted.
In this study, next-generation DNA sequencing of fungal ITS regions was utilized to describe fungal diversity and species relative abundances in house dust collected at 12 months of age of children later determined to be asthmatic or non-asthmatic. Dust samples and data on home environmental characteristics and health outcomes used in this nested case-control study were obtained from the Center for the Health Assessment of Mothers and Children of Salinas (CHAMACOS) prospective birth cohort study (Eskenazi et al., 2003, Bradman et al., 2005). Statistical analyses examined relationships between fungal diversity/species abundance and childhood asthma development, as well as between fungal diversity/species abundance and dampness/mold in homes.
Methods
This method section provides an overview of the study cohort, indoor dust sampling, fungal analyses, and statistical methods to determine associations among microbial populations, asthma development, and moisture. Detailed methods are available online in the Supporting Information at http://onlinelibrary.wiley.com/journal/10.1111/(ISSN)1600-0668.
Study population
The CHAMACOS birth cohort study enrolled 601 predominantly low-income, Latina pregnant women living in the Salinas Valley, California, USA. Of the 601 enrolled, 526 (88%) delivered surviving singletons. By the 7-year visit, children were lost to follow-up for the following reasons: 72 moved, 59 refused, 24 could not be traced, 21 could not schedule a visit, and 2 became deceased (Bouchard et al., 2011). Of the remaining 348 participants, 292 (84%) had available dust collected from the 12-month home visit for possible inclusion in this analysis.
For this analysis, asthma cases and controls were selected based on asthma status at age 7 years. Children were defined as having asthma if a maternal interview indicated current asthma symptoms and either currently prescribed asthma medication or prior physician asthma diagnosis. All 13 asthma cases with available dust from the 12-month home visit were included, plus 28 randomly-selected controls without asthma, frequency matched by sex (Table 1). Chi-square analysis revealed that the 28 representative control homes did not differ significantly from the original cohort of singleton births based on maternal education, poverty category, or mother’s birth country. However, the chi-square test for mother’s birth country may not be valid due to too few homes in some categories. The institutional review board at University of California, Berkeley, approved the study, and written informed consent was obtained.
Table 1.
Demographic information for the 41 children in this study.
| Characteristic | Case n (%) | Control n (%) | Total n (%) |
|---|---|---|---|
| Household income | |||
| At or below US poverty line | 11 (85%) | 20 (71%) | 31 (76%) |
| Above US poverty line up to 200% | 2 (15%) | 8 (29%) | 10 (24%) |
| >200% US poverty line | 0 (0%) | 0 (0%) | 0 (0%) |
| Mother’s country of birth | |||
| Mexico | 13 (100%) | 24 (86%) | 37 (90%) |
| US | 0 (0%) | 3 (11%) | 3 (7.3%) |
| Other | 0 (0%) | 1 (3.6%) | 1 (2.4%) |
| Mother’s education level | |||
| Up to 6th grade | 8 (62%) | 15 (54%) | 23 (56%) |
| 7th–12th grade | 4 (31%) | 8 (29%) | 12 (29%) |
| High school graduate or more | 1 (7.7%) | 5 (18%) | 6 (15%) |
| Child’s gender | |||
| Male | 4 (31%) | 7 (25%) | 11 (27%) |
| Female | 9 (69%) | 21 (75%) | 30 (73%) |
US = United States
Home visit and dust collection
The home visit at enrollment and 12 months postpartum included maternal interview, environmental assessment, wall moisture readings, and dust collection. Dust was collected using a high volume surface sampler (HVS3) vacuum cleaner (Lewis et al., 1994) with a MediVac dust sampling head (Medivac Plc, Wilmslow, Cheshire, UK) from the main living area, child’s sleeping area, and kitchen. Dust was collected from a 1 m2 area vacuumed for at least 2 minutes using four double passes of the surface. After collection, samples were placed on ice with a desiccant and then transferred to the laboratory for storage at −80°C.
Moisture was quantitatively measured from the middle of three walls, a window corner, and any suspected damp areas in the living area and child’s sleeping area using a CT100 pinless moisture meter (Electrophysics, Ontario, Canada). Moisture meters from different manufacturers may have different absolute reading values on gypsum board (Harriman, 2008), and the moisture content readings on drywall or plaster using this device are on a relative scale. Thus our analysis included a range of moisture value thresholds to demarcate damp walls, including readings of 17, 21, and 24. Homes with any reading above these thresholds were characterized as having damp walls and were analyzed for associations with microbial growth and asthma. Qualitative moisture indicators included visible mold growth, water damage, leaks under the kitchen sink, peeling paint, rotting wood, and musty odor. Other collected information included income, smoking indoors, indoor pets, other occupants, and season of visit (rainy/dry).
Fungal analysis
DNA was extracted (Yamamoto et al., 2012) from 10 mg of dust and amplified with multiplexed ITS1F and ITS4 primers (Manter et al., 2007, Larena et al., 1999). Unincorporated primers and PCR reagents were separated from PCR amplicons using the UltraClean 96 well PCR Clean-Up Kit (Mobio Laboratory, Carlsbad, CA, USA), and amplicons were quantified using the Quant-iT PicoGreen assay (Invitrogen, Carlsbad, CA, USA) prior to normalizing the concentrations in all samples and pooling. Pooled DNA was further purified with Angencourt Ampure beads (Beckman Coulter, USA) and sequenced on 1/8 of a plate on the 454 GS FLX Titanium DNA sequencing platform (454 Life Sciences, Branford, CT, USA) at the Duke University Genome Sequencing and Analysis Core Resource. PCR no-template controls and laboratory negative controls (no dust added) produced in parallel with sample preparation and DNA extraction did not amplify. No DNA was detected in these control samples when analyzed by the Quant-iT PicoGreen DNA assay or by gel electrophoresis. Sequences have been archived in the European Nucleotide Archive with accession number ERP002369.
Five allergenic fungal species (Aspergillus fumigatus, Alternaria alternata, Cladosporium cladosporioides, Epicoccum nigrum, and Penicillium spp.), total bacteria, total fungi, and shed human skin cells were measured with qPCR, with additional details in the Supporting Information.
For diversity analyses, the bioinformatics analysis toolkit QIIME, version 1.5 (Caporaso et al., 2010) was used to process DNA sequencing data. Sequences were trimmed if the read length was less than 300 bp or if the read quality score was less than 20. All sequences containing ambiguous bases and sequences unassigned to a multiplex identifier (MID) were removed prior to denoising. After denoising (Quince et al., 2011), sequences were clustered using uclust (Edgar, 2010) at 97% similarity. For rarefaction curve production and α diversity (within sample diversity) analysis, the operational taxonomic unit (OTU) table was trimmed to 450 reads per sample (3 samples with <450 reads were excluded), and the number of observed species were determined for each sample (in addition to Fisher’s α, Shannon diversity index, and Chao1 richness estimator). For β diversity (between sample diversity) and principal coordinate analysis (PCoA), all available quality-trimmed reads were utilized to calculate the Morisita Horn (Horn, 1966) (non-phylogenetic) distance. Results were assessed through PCoA plots and analysis of similarity (ANOSIM, available through QIIME) to determine the statistical significance of clustering.
For taxonomic assignment, the RDP pipeline initial process (Cole et al., 2009) was used to trim the raw sequence read file with the equivalent quality and length criteria specified above, and BLASTn-based annotation (Altschul et al., 1990) was performed against a database containing all fungal sequences identified to the rank of species (Nilsson et al., 2009). Multilevel taxonomic identification was made at all taxonomic ranks by FHiTINGS, version 1.1 (Dannemiller et al., 2013). The values at all taxonomic levels from the FHiTINGS files were used to calculate the relative abundance for each identification at the species or genus level. Also, to estimate the absolute concentration of each identified species per gram of dust, relative abundance values were multiplied by the total fungal spore quantities per mg of dust, as determined by qPCR with universal fungal primers, to produce absolute abundance values.
Diversity within genera with at least 10 species and classes was determined using the FHiTINGS output. Only samples with at least 1000 sequences per sample were included in this analysis for normalization. The number of different species identified by at least one sequence was determined within each genus and class.
Statistical Analysis
SAS version 9.2 (SAS Institute, Inc., Cary, NC, USA) was used for statistical analysis, with significance defined as p < 0.05. Fungal diversity differences were assessed with two-sample t-tests. Odds ratios (ORs) for associations between asthma status, fungal diversity, and household/demographic factors were calculated on dichotomous independent variables (continuous variables dichotomized at median value). Binary variables were used to avoid concerns with normality of the data distributions and also due to the semi-quantitative nature of 454 pyrosequencing taxon abundance data (Amend et al., 2010). Potential confounding variables were selected for analysis a priori (Table 2).
Table 2.
Unadjusted and adjusted odds ratios for the association of potential risk factors with asthma development and with low fungal diversity, and for the association of low fungal diversity with asthma development.
| Potential Risk Factor1 | n (%) | Unadjusted | Adjusted | ||
|---|---|---|---|---|---|
| Potential Risk Factor OR for Low Fungal Diversity2 OR (95% CI) |
Potential Risk Factor OR for Asthma Development OR (95% CI) |
Potential Risk Factor OR for Asthma Development, Adjusted for Low Fungal Diversity OR (95% CI) |
Low Fungal Diversity and Asthma Development, Adjusted for Potential Risk Factor OR (95% CI) |
||
| Low fungal diversity | – | – | 4.80 (1.04–22.1) | – | – |
| Rainy season3 | 21 (55%) | 1.24 (0.34–4.45) | 0.45 (0.11–1.80) | 0.36 (0.08–1.65) | 5.52 (1.12–27.3) |
| Smoking inside home4 | 0 (0%) | – | – | – | – |
| Pets5 | 5 (13%) | 1.59 (0.24–10.8) | 1.53 (0.22–10.6) | 1.35 (0.17–10.6) | 4.74 (1.03–21.9) |
| Other children6 | 19 (50%) | 1.23 (0.35–4.41) | 1.00 (0.25–3.93) | 0.92 (0.21–3.94) | 4.83 (1.04–22.3) |
| Below poverty line7 | 30 (79%) | 0.53 (0.11–2.60) | 4.05 (0.44–37.4) | 6.28 (0.6–65.3) | 6.21 (1.25–31.0) |
| Moisture8 (>17) | 15 (39%) | 1.25 (0.34–4.59) | 1.14 (0.28–4.60) | 1.06 (0.24–4.68) | 4.79 (1.04–22.1) |
| Moisture8 (>21) | 12 (32%) | 0.61 (0.15–2.44) | 0.63 (0.14–2.93) | 0.73 (0.14–3.70) | 4.68 (1.01–21.7) |
| Moisture8 (>24) | 5 (13%) | 0.21 (0.02–2.07) | 1.53 (0.22–10.6) | 3.47 (0.35–34.1) | 6.43 (1.15–35.8) |
| Visible mold9 | 11 (29%) | 0.77 (0.19–3.16) | 0.75 (0.16–3.53) | 0.8 (0.16–4.16) | 4.76 (1.03–22.0) |
| ≥2 moisture indicators10 | 13 (34%) | 0.79 (0.21–3.03) | 0.53 (0.12–2.46) | 0.54 (0.11–2.73) | 4.77 (1.02–22.2) |
Statistically significant (p < 0.05) odds ratios are in bold.
Low fungal diversity was defined by creating a dichotomous variable separated by the median (80.5 fungal OTUs).
Rainy season was defined as sampling between November 1–April 30.
Smoking was defined as at least one person smoking indoors as reported by the resident. While 2 (5.3%) case and 2 (5.3%) control children were exposed to smoke, there was no smoking inside any of the homes.
Pets included birds or mammals living inside the home within one year, and no homes had cats.
“Other children” represents at least two other children under age 12 years living inside the home as reported by the resident.
“Below poverty line” represents homes with incomes below the US government-defined poverty line.
“Moisture” variables represent a dichotomous variable for any moisture meter reading anywhere in the living area or child’s sleeping area that exceeded the indicated threshold (17, 21, or 24).
Visible mold growth represents moderates or extensive growth.
The sum of two or more moisture indicators represents qualitative moisture indicators including peeling paint, water damage, rotting wood, musty odor, water leak in the kitchen, or visible mold growth.
Associations between fungal taxa and asthma or moisture were first analyzed by calculating ORs based on dichotomized variables. Next, these findings were adjusted for multiple comparisons using Significance Analysis of Microarrays (SAM) (Tusher et al., 2001; Li et al., 2011), version 4.00a. While SAM was designed for gene expression analysis, here it was used to calculate the false discovery rate and q-values for many taxonomic comparisons (species, genus, class) against case/control status and moisture indicators. A q-value is similar to a p-value but is adjusted for multiple comparison testing. More details of this analysis are in the Supporting Information. Results were considered statistically significant after adjustment for multiple comparisons if p < 0.05 and q < 0.05.
Results
Overview
Demographic information for the 13 asthma cases and 28 controls included in the study is shown in Table 1.
After quality trimming, 52,058 sequences total were included in the analysis, and the normalized samples contained 902 different operational taxonomic units (OTUs) combined. Fungal diversity was reported here as the number of species-level OTUs in samples normalized to 450 sequences and ranged from 29 to 142 fungal OTUs per sample with a median of 80.5. The coefficients of variation for the number of fungal OTUs of four replicates (different aliquots of the same dust samples) were 4%, 8%, 11%, and 13%, and the cumulative coefficient of variation was 9%. A total of 652 non-singleton species were identified by BLAST analysis, and 180 had at least 20 sequences total among all samples (Table S1). Replicate analysis for fungal taxonomic identifications appears in Figure S1 A, B, C, D.
Fungal diversity, asthma, and moisture
Lower fungal diversity in house dust was associated with increased risk of childhood asthma development by t-test (p = 0.04) (Figure 1A, B). The unadjusted OR of developing asthma with low fungal diversity (dichotomized at the median) was 4.80 (95% confidence interval (CI) 1.04–22.1) (Table 2). Other fungal α diversity (within-sample diversity) measures, including Fisher’s α, Shannon diversity index, and Chao1 richness estimator (Table S2), also demonstrated lower diversity measurements in case versus control homes. In addition to diversity for all fungi, species diversity within abundant fungal genera and classes were also examined (Table S3). Only decreased Cryptococcus genus diversity was statistically significantly associated with an increase in asthma risk (OR 21.0, 95% CI 2.16–204). Increased diversity within any genus or class was not associated with increased asthma risk.
Figure 1.

Figure 1(A, B, C, D, E). Fungal diversity associations with asthma development and with the presence of moisture indicators.
(A, B) Rarefaction analysis for fungi in case and control homes (n = 12 for asthma cases, n = 26 for controls), with values summarized in a bar graph. (C, D) Rarefaction analysis for fungi in houses with two or more qualitative moisture indicators (n=13 for homes with two or more moisture indicators, n = 25 for homes with fewer than two moisture indicators), with values summarized in a bar graph. Moisture indicators included peeling paint, water damage, rotting wood, musty odor, water leak in the kitchen, or visible mold growth. (E) Bar graph summary of rarefaction analysis for measured moisture at three threshold values (17, 21, and 24). The maximum moisture reading anywhere in the living area or child’s sleeping area was used. For the three thresholds of 17, 21, and 24, the respective numbers of homes with low moisture were n = 23, 26, and 33 and the respective numbers of homes with high moisture were n = 15, 12, and 5. Rarefaction curves appear in Figure S4. Error bars represent standard errors. All OTUs are defined at 97%
Increases in some quantitative and qualitative measures of moisture were associated with increased fungal diversity. Homes with two or more of six qualitative moisture indicators showed a trend toward higher fungal diversity (p = 0.17) (Figure 1C, D). Water damage, rotting wood, and musty odor were present in few (<5) homes with fungal diversity values and were not statistically associated with fungal diversity. Among the variables visible mold growth, water leak in the kitchen, and peeling paint (Figures S2 and S3), water leak in the kitchen was associated with increased fungal diversity (p = 0.04). Dust sampling during the rainy season did not affect fungal diversity (Figure S2). For quantitative wall moisture measurements, presence in a home of levels exceeding each of the three thresholds of 17, 21, and 24 was associated with increased fungal diversity, and this difference was significant for the most stringent threshold (>24, p = 0.02) (Figures 1E and S4). Finally, neither moisture indicators nor sampling during the rainy season were associated with asthma status (Table S4).
Other asthma risk factors
Potential confounders of the relationship between fungal diversity and asthma, selected a priori, were all not significantly associated with either asthma development or fungal diversity in logistic models (Table 2). None of these variables showed positive confounding of the relationship between fungal diversity and asthma development. Rainy season, poverty, and measured moisture (>24) showed a tendency toward negative confounding (partially obscuring the relationship between asthma development and fungal diversity) (Table 2). Including these three variables individually in logistic regression models increased the OR for asthma and fungal diversity between 15–34%, and moved the OR for the potential confounder and asthma farther from the null. In the adjusted models, 95% CIs for low fungal diversity and asthma always excluded 1.0, while those for the potential confounding variables did not.
Visible mold growth and case status modified the relationship between moisture presence and fungal diversity. Figure 2 shows that in homes without visible mold growth, increased moisture content was associated with statistically significantly increased fungal diversity (Figure 2A). In homes with visible mold growth, increased moisture content was associated with non-significantly decreased fungal diversity (Figure 2B). In control homes, moisture content was associated with statistically significantly increased fungal diversity (Figure 2C), whereas in case homes moisture content had no association with fungal diversity (Figure 2D). Similar trends were also present with Cryptococcus diversity (Figure S5), and Cryptococcus diversity was highly related to the total number of fungal OTUs (Figure S6). Overall, these results indicate that unknown factor(s) that partially obscure the relationship of increased diversity with increased moisture may be present in homes with visible mold and in asthma case homes.
Figure 2.

Figure 2A, B, C, D. Pearson correlation coefficients and graphs comparing maximum moisture content of any wall in the home compared to number of fungal OTUs in floor dust.
Graphs are (A, B) stratified by homes without (n = 27) and with (n = 11) visible mold growth and (C, D) stratified by asthma control (n = 26) and case (n = 12) homes. All OTUs are defined at 97% similarity. Sequences were normalized to 450 sequences per sample. The respective Pearson correlation coefficient p-values were (A) 0.009, (B) 0.22, (C) 0.04, and (D) 0.81.
Fungal taxa, asthma and moisture
Quantitative PCR measurement of total fungal spore equivalents, bacterial genomes, human cells, and five allergenic fungal species were not significantly related to asthma (Table S5). By pyrosequencing, the most abundant (>1%) species were examined for differences in relative abundance between case and control homes (Figure S7A). While average differences were observed, such as for human-associated Candida intermedia and Malassezia globosa, none were statistically significant. Using total fungal qPCR results to transform data into absolute concentrations did not significantly alter the results (Figure S7BC).
ORs for asthma and all individual species (Table S6), genera (Table S7), and classes (Table S8 and Figure S8) showed no statistically significant positive associations between any specific fungal taxa and asthma risk. After adjustment for multiple comparisons, only Aureobasidium pullulans showed a statistically significant negative association (OR 0.19, 95% CI 0.04–0.87) (Table S9). Finally, analysis of fungal population β diversity (between samples) showed that fungal communities in asthma case and control homes shared many similarities and no clear, consistent differences (ANOSIM p = 0.10) (Figure S9A).
The species Cryptococcus uzbekistanensis, Cryptococcus albidus, Coniosporium apollinis, and the class Ustilaginomycetes were significantly positively associated with mold/moisture indicators after adjustment for multiple comparisons (Table S9). No differences in fungal population β diversity were found with these moisture or mold measures (Figures S9 and S10).
Discussion
This is the first study to our knowledge to examine fungal diversity in house dust and associations with later asthma development using next-generation DNA sequencing in a prospective, nested case-control study. In this population, lower number of fungal OTUs in house dust was strongly and significantly associated with increased risk of later asthma development, and this was strengthened with control for potential confounders. Previous studies have associated lower bacterial diversity with increased asthma risk (Ege et al., 2011), and one previous study examined nine fungal species by culturing and found a similar trend (Ege et al., 2011). This trend was seen even though culturing underestimates fungal diversity (Bridge et al., 2001).
Moisture and visible mold
Moisture was associated with increased fungal diversity in house dust, as found previously (Pitkäranta et al., 2008). Moisture has also been positively associated with asthma (Pekkanen et al., 2007; Mendell et al., 2011). This relationship may be partially obscured by the possible negative confounding seen here among asthma development, moisture, and fungal diversity. Although high measured wall moisture (Figure 3) had a non-significant positive unadjusted association with asthma development, it also was inversely associated with low fungal diversity. In turn, low fungal diversity was strongly, positively associated with asthma development. However, when both measured wall moisture and low fungal diversity were included in the asthma model (Figure 3), the adjusted ORs for each increased by 127% and 34%, respectively, relative to the unadjusted ORs. Thus, there is a suggestion of negative confounding that may partially obscure both the relationship between low fungal diversity and asthma, as well as the relationship between moisture and asthma.
Figure 3. Negative confounding of the relationship between low fungal diversity and asthma development by measured home moisture.
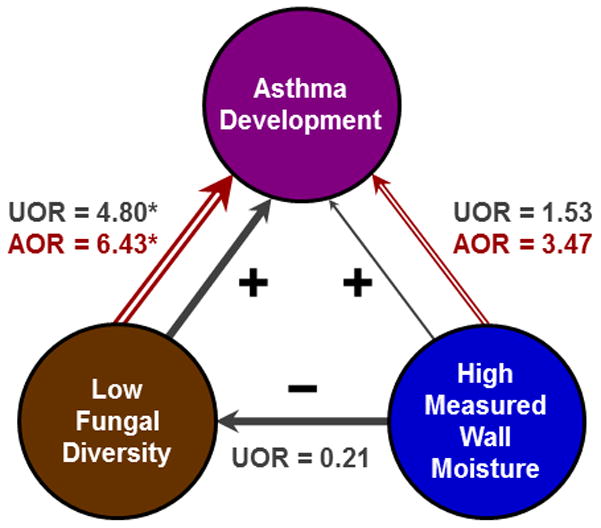
The unadjusted models are represented in solid grey arrows and the adjusted model is represented in open red arrows. (A) Negative confounding by high measured wall moisture (>24) reduced the association seen in unadjusted models for low fungal diversity and asthma development. This was because measured wall moisture had a positive association with asthma development but a negative association with low fungal diversity. With adjustment for measured wall moisture, the association between low fungal diversity and asthma development increased by 34% and that between measured wall moisture and asthma development increased by 127%. UOR = unadjusted odds ratio (solid grey), AOR = adjusted odds ratio (open red), * = p < 0.05.
Visible mold growth modified the relationship between moisture and fungal diversity. Potential hypotheses include that visible mold growth with high moisture releases antifungal metabolites (Schalchli et al., 2011) that reduce fungal diversity in house dust, or that the number of fungal OTUs decreases due to the dominance of one or more actively growing species (Adams et al., 2013a). In asthma case homes, there may be growth inhibitors present or diversity may be reduced for other yet unknown reasons. These results suggest that homes with visible mold growth and homes of asthma cases may be similar in some way related to the prevention of an increase in microbial diversity with an increase in moisture.
Fungal exposure and increased asthma risk
Previous studies have focused on associating the presence of detrimental fungal species with asthma risk (Reponen et al., 2012; Agarwal et al., 2011; Stark et al., 2005; Arbes et al., 2007). While multiple mechanisms may be important, here we found similar fungal taxa in asthma case and control homes, with no detrimental and one potentially protective species. Similarities in fungal taxa in house dust may be due to contributions from common sources, such as outdoor air (Adams et al., 2013b; Goebes et al., 2010) and human shedding (Park et al., 2012). Although abundance of no fungal taxon was identified as an asthma risk factor, reduced diversity within Cryptococcus was associated with increased asthma risk. Cryptococcus is a genus of yeasts associated with soil, humans, and animals, and some species are pathogens (Levitz et al., 1991). Here, Cryptococcus was the most prevalent genus, and diversity within Cryptococcus was associated with overall diversity. This genus is in the Basidiomycota phylum, which is a source of aeroallergens (Lehrer et al., 1994) but until recently lacked allergen research compared to Ascomycota due to culturing difficulties (Simon-Nobbe et al., 2008). Subclinical infection with Cryptococcus neoformans has been suggested to have a role in the pathogenesis of asthma (Goldman et al., 2006; Goldman et al., 2009). Further research is needed to explore the association of this genus with asthma development.
Together, these findings advance knowledge about household factors associated with increased asthma risk. Fungal concentration and diversity are not necessarily related, and the dominance of a taxon within a population may affect human health due more to decreased diversity than the related increase in the taxon’s absolute concentration. Our results point to the “biodiversity hypothesis” (von Hertzen et al., 2011) since a decrease in fungal diversity was the main factor consistently associated with increased asthma risk. Visible mold growth and household moisture may also increase risk of asthma development; if these two factors work through a reduction in fungal diversity as in Figure 2B, then perhaps both need to be present simultaneously to have an effect, as found previously (Gunnbjörnsdottir et al., 2003). Moisture/mold and asthma may also be linked through diversity of specific taxa (perhaps Cryptococcus, and/or others). These findings give new direction to the study of microbes in homes and, if validated in future studies, represent a step toward eventual public health recommendations to reduce asthma development. Further research aimed at understanding household factors that control diversity in the indoor environment will also be necessary.
Additional considerations
This study was conducted in a low-income, immigrant community of predominantly Mexican descent. The novel results should be confirmed in future studies with larger cohorts and in groups with different demographics. One characteristic of populations of Mexican descent is low overall asthma prevalence rates compared to other racial/ethnic groups (Arif et al., 2003; Lara et al., 2006). These asthma rates for those of Mexican descent are reported at approximately 5% in the United States (Akinbami et al., 2011; Akinbami et al., 2012), compared to the asthma prevalence rate of those of Puerto Rican descent in the United States of 16.1% (Akinbami et al., 2012). In California, the childhood current asthma prevalence rate among all Hispanics is 5.1% (95% CI 3.6–7.1%) (CDC, 2010). Using data collected from Salinas, CA (Vogt et al., 2008), we also estimate the asthma prevalence of those of Mexican descent in the area to be 4.4%. The overall asthma prevalence rate in the CHAMACOS cohort of 292 was 4.5%, which is consistent with previously reported values.
Humans are exposed to house dust through inhalation, dermal, and oral exposure routes (Butte et al., 2002). Room occupants resuspend floor dust, which contributes to the microbial population in the air (Hospodsky et al., 2012). While much literature has focused on inhalation exposure for allergic asthma (Cockcroft et al., 2007), reduced gut microbial diversity is also associated with hypersensitivity disease (Sjögren et al., 2009, Bisgaard et al., 2011) and autoimmune disease (Markle et al., 2013), and skin contact may be an important exposure route for asthma development (Redlich et al., 2010). All three exposure routes may be additive (Marsella et al., 2006) and may contribute to the relationship between low fungal diversity exposure early in life and later asthma development, possibly through immune system training (Heederik et al., 2012).
Strengths and Limitations
Strengths of this study include the prospective, nested case-control design with early exposure measurements. The previous study estimating fungal diversity by culturing nine species was cross-sectional (Ege et al., 2011). The largely homogeneous, agricultural community of similar socio-economic status in a defined geographic region reduced variability that might otherwise obscure associations. Previously, DNA-based techniques (qPCR) have found associations between fungal exposures and asthma development (Reponen et al., 2011; Reponen et al., 2012). However, qPCR-based techniques require a priori selection of species or taxa of interest, even though many fungal species that bind human IgE have not yet been clinically recognized (Green et al., 2009) and the types of microorganisms that are responsible for immune system priming and development are not yet known. The thoroughness of a qPCR-based diversity analysis is also limited by the number of currently available assays. The 454 pyrosequencing method allows for comprehensive analysis of fungal communities, including diversity analysis and taxa-specific analysis without a priori selection of specific taxonomic groups. Given the large number of potential associations assessed, we also controlled for “multiple testing” to reduce the likelihood of chance findings.
Limitations of this study include the small sample size, which limited statistical power and precision of estimates. However, the nested case-control design that included all available asthma cases in a larger prospective cohort enhances power and the ability to generate causal hypotheses. The relationship between fungal diversity and asthma was sufficiently strong to be detectable in this sample, although with wide confidence limits. The ability to explore confounding was also limited, but individual potential confounding variables appeared not to enhance this relationship, but actually to obscure it. Other potential confounders not addressed here may exist, and exposures to allergens or endotoxin should be considered in future studies. Larger sample sizes in future studies may result in increased ability to identify additional significant associations. This study was conducted in a homogeneous low-income community of Mexican descent, and future studies should also confirm the generalizability of these findings to other populations. Additionally, while pyrosequencing represents the most thorough fungal population analysis method reported to date, additional species at very low abundance may not have been detected. A previous study has raised concerns that differences in collected fungal biomass can artificially alter fungal diversity estimates (Adams et al., 2013a). However, in this study fungal biomass determined by qPCR was not associated with the detected number of fungal OTUs. Floor dust sampling methods can affect the results of microbial measurements (Hyvärinen et al., 2006; Schram-Bijkerk et al., 2006), such that care should be taken with direct comparison of this study’s quantitative results to other studies that may have used disparate sampling methods. Although these results require replication in a larger population with more rigorous confirmation of asthma status, these findings demonstrate novel relationships among childhood asthma development, fungal diversity, and moisture in homes.
Conclusions
Lower fungal diversity in homes of children at 12 months of age was associated with increased probability of later asthma development. While no individual fungal taxa were associated with increased risk of asthma development, low Cryptococcus diversity was associated with higher asthma risk. The association between high moisture and high fungal diversity has a tendency to partially obscure their true relationships with asthma development. Our results indicate that future research should expand from primarily exclusive study of individual fungal taxa in homes to also incorporate fungal diversity measurements. Improved understanding of household exposure to low fungal diversity and the associations with health outcomes may eventually inform preventive medicine and public health interventions to reduce the burden of asthma on our society and especially on our children.
Supplementary Material
Practical Implications.
Early life exposure to low fungal diversity in house dust was associated with increased risk for later asthma development in this low-income, immigrant community. No individual fungal taxon (species, genus, or class) was associated with asthma development, although exposure to low diversity within the genus Cryptococcus was associated with asthma development. Future asthma development studies should incorporate fungal diversity measurements, in addition to measuring individual fungal taxa. These results represent a step toward identifying the aspect of indoor microbial population that are associated with asthma development and suggest that understanding the factors that control diversity in the indoor environment may lead to public health recommendations for asthma prevention in the future.
Acknowledgments
Karen Dannemiller is supported by the National Science Foundation Graduate Research Fellowship, and additional data analysis was supported by the Advanced Graduate Leadership Program at Yale University. Funding for the fungal ITS sequencing was provided by an Alfred P. Sloan Foundation grant to Jordan Peccia. CHAMACOS was funded by U.S. EPA grant R82679-01-0 and NIEHS grant PO1ES09605-02. This research has not been subjected to agency review and does not necessarily reflect the views of the funding agencies. No official endorsement should be inferred. The authors would like to thank Naomichi Yamamoto for his thoughts and advice on the project and Michael Lipsett for comments on the manuscript. We also thank the CHAMACOS staff and the families that participated in this study.
Abbreviations
- CHAMACOS
Center for Health Assessment of Mothers and Children of Salinas
- CI
Confidence interval
- ITS
Internal transcribed spacer
- OTU
Operational taxonomic unit
- OR
Odds ratio
- qPCR
quantitative polymerase chain reaction
- SAM
Significance Analysis of Microarrays
Footnotes
Conflict of Interest Statement: The authors declare that they have no conflicts of interest.
References
- Adams R, Amend A, Taylor J, Bruns T. A Unique Signal Distorts the Perception of Species Richness and Composition in High-Throughput Sequencing Surveys of Microbial Communities: a Case Study of Fungi in Indoor Dust. Microb Ecol. 2013a doi: 10.1007/s00248-013-0266-4. [DOI] [PMC free article] [PubMed] [Google Scholar]
- Adams RI, Miletto M, Taylor JW, Bruns TD. Dispersal in microbes: fungi in indoor air are dominated by outdoor air and show dispersal limitation at short distances. ISME J. 2013b doi: 10.1038/ismej.2013.28. [DOI] [PMC free article] [PubMed] [Google Scholar]
- Agarwal R, Gupta D. Severe asthma and fungi: current evidence. Med Mycol. 2011;49:S150–157. doi: 10.3109/13693786.2010.504752. [DOI] [PubMed] [Google Scholar]
- Akinbami LJ, Moorman JE, Bailey C, Zahran HS, King M, Johnson CA, Liu X. NCHS Data Brief. Vol. 94. Hyattsville, MD: National Center for Health Statistics; 2012. Trends in Asthma Prevalence, Health Care Use, and Mortality in the United States, 2001–2010. [PubMed] [Google Scholar]
- Akinbami LJ, Moorman JE, Liu X. National Health Statistics Report. Vol. 32. Hyattsville, MD: National Center for Health Statistics; 2011. Asthma Prevalence, Health Care Use, and Mortality: United States, 2005–2009. [PubMed] [Google Scholar]
- Altschul SF, Gish W, Miller W, Myers EW, Lipman DJ. Basic local alignment search tool. J Mol Biol. 1990;215:403–410. doi: 10.1016/S0022-2836(05)80360-2. [DOI] [PubMed] [Google Scholar]
- Amend AS, Seifert KA, Bruns TD. Quantifying microbial communities with 454 pyrosequencing: does read abundance count? Mol Ecol. 2010;19:5555–5565. doi: 10.1111/j.1365-294X.2010.04898.x. [DOI] [PubMed] [Google Scholar]
- Arbes SJ, Jr, Gergen PJ, Vaughn B, Zeldin DC. Asthma cases attributable to atopy: Results from the Third National Health and Nutrition Examination Survey. J Allergy Clin Immunol. 2007;120:1139–1145. doi: 10.1016/j.jaci.2007.07.056. [DOI] [PMC free article] [PubMed] [Google Scholar]
- Arif AA, Delclos GL, Lee ES, Tortolero SR, Whitehead LW. Prevalence and risk factors of asthma and wheezing among US adults: an analysis of the NHANES III data. Eur Respir J. 2003;21:827–833. doi: 10.1183/09031936.03.00054103a. [DOI] [PubMed] [Google Scholar]
- Bisgaard H, Li N, Bonnelykke K, Chawes BL, Skov T, Paludan-Muller G, Stokholm J, Smith B, Krogfelt KA. Reduced diversity of the intestinal microbiota during infancy is associated with increased risk of allergic disease at school age. J Allergy Clin Immunol. 2011;128:646–652. e641–645. doi: 10.1016/j.jaci.2011.04.060. [DOI] [PubMed] [Google Scholar]
- Bouchard MF, Chevrier J, Harley KG, Kogut K, Vedar M, Calderon N, Trujillo C, Johnson C, Bradman A, Barr DB, Eskenazi B. Prenatal exposure to organophosphate pesticides and IQ in 7-year-old children. Environ Health Perspect. 2011;119:1189–1195. doi: 10.1289/ehp.1003185. [DOI] [PMC free article] [PubMed] [Google Scholar]
- Bradman A, Chevrier J, Tager I, Lipsett M, Sedgwick J, Macher J, Vargas AB, Cabrera EB, Camacho JM, Weldon R, Kogut K, Jewell NP, Eskenazi B. Association of housing disrepair indicators with cockroach and rodent infestations in a cohort of pregnant Latina women and their children. Environ Health Perspect. 2005;113:1795–1801. doi: 10.1289/ehp.7588. [DOI] [PMC free article] [PubMed] [Google Scholar]
- Bridge P, Spooner B. Soil fungi: diversity and detection. Plant Soil. 2001;232:147–154. [Google Scholar]
- Butte W, Heinzow B. Pollutants in House Dust as Indicators of Indoor Contamination. Rev Environ Contam Toxicol. 2002;175:1–46. [PubMed] [Google Scholar]
- Caporaso JG, Kuczynski J, Stombaugh J, Bittinger K, Bushman FD, Costello EK, Fierer N, Pena AG, Goodrich JK, Gordon JI, Huttley GA, Kelley ST, Knights D, Koenig JE, Ley RE, Lozupone CA, Mcdonald D, Muegge BD, Pirrung M, Reeder J, Sevinsky JR, Turnbaugh PJ, Walters WA, Widmann J, Yatsunenko T, Zaneveld J, Knight R. QIIME allows analysis of high-throughput community sequencing data. Nat Meth. 2010;7:335–336. doi: 10.1038/nmeth.f.303. [DOI] [PMC free article] [PubMed] [Google Scholar]
- CDC. Behavioral Risk Factor Surveillance Survey. Centers for Disease Control and Prevention; 2010. Available at: http://www.cdc.gov/asthma/brfss/2010/child/current/tableC5.htm. [Google Scholar]
- Cockcroft DW, Hargreave FE, O’byrne PM, Boulet LP. Understanding allergic asthma from allergen inhalation tests. Can Respir J. 2007;14:414–418. doi: 10.1155/2007/753450. [DOI] [PMC free article] [PubMed] [Google Scholar]
- Cole JR, Wang Q, Cardenas E, Fish J, Chai B, Farris RJ, Kulam-Syed-Mohideen AS, Mcgarrell DM, Marsh T, Garrity GM, Tiedje JM. The Ribosomal Database Project: improved alignments and new tools for rRNA analysis. Nucleic Acids Res. 2009;37:D141–145. doi: 10.1093/nar/gkn879. [DOI] [PMC free article] [PubMed] [Google Scholar]
- Dannemiller KC, Reeves D, Bibby K, Yamamoto N, Peccia J. Fungal High-throughput Taxonomic Identification tool for use with Next-Generation Sequencing (FHiTINGS) J Basic Microb. 2013 doi: 10.1002/jobm.201200507. [DOI] [PubMed] [Google Scholar]
- Douwes J, Pearce N. Invited Commentary: Is Indoor Mold Exposure a Risk Factor for Asthma? Am J Epidemiol. 2003;158:203–206. doi: 10.1093/aje/kwg149. [DOI] [PubMed] [Google Scholar]
- Edgar RC. Search and clustering orders of magnitude faster than BLAST. Bioinformatics. 2010;26:2460–2461. doi: 10.1093/bioinformatics/btq461. [DOI] [PubMed] [Google Scholar]
- Ege MJ, Mayer M, Normand A-C, Genuneit J, Cookson WOCM, Braun-Fahrländer C, Heederik D, Piarroux R, Von Mutius E. Exposure to Environmental Microorganisms and Childhood Asthma. New Engl J Med. 2011;364:701–709. doi: 10.1056/NEJMoa1007302. [DOI] [PubMed] [Google Scholar]
- Eskenazi B, Bradman A, Gladstone EA, Jaramillo S, Birch K, Holland N. CHAMACOS, A Longitudinal Birth Cohort Study: Lessons from the Fields. J Child Health. 2003;1:3–27. [Google Scholar]
- Goebes MD, Boehm AB, Hildemann LM. Contributions of Foot Traffic and Outdoor Concentrations to Indoor Airborne Aspergillus. Aerosol Sci Tech. 2010;45:352–363. [Google Scholar]
- Goldman DL, Davis J, Bommarito F, Shao X, Casadevall A. Enhanced Allergic Inflammation and Airway Responsiveness in Rats with Chronic Cryptococcus neoformans Infection: Potential Role for Fungal Pulmonary Infection in the Pathogenesis of Asthma. J Infect Dis. 2006;193:1178–1186. doi: 10.1086/501363. [DOI] [PubMed] [Google Scholar]
- Goldman DL, Huffnagle GB. Potential contribution of fungal infection and colonization to the development of allergy. Med Mycol. 2009;47:445–456. doi: 10.1080/13693780802641904. [DOI] [PubMed] [Google Scholar]
- Green BJ, Tovey ER, Beezhold DH, Perzanowski MS, Acosta LM, Divjan AI, Chew GL. Surveillance of fungal allergic sensitization using the fluorescent halogen immunoassay. J Mycol Med. 2009;19:253–261. doi: 10.1016/j.mycmed.2009.10.003. [DOI] [PMC free article] [PubMed] [Google Scholar]
- Gunnbjörnsdottir MI, Norback D, Plaschke P, Norrman E, Bjornsson E, Janson C. The relationship between indicators of building dampness and respiratory health in young Swedish adults. Respir Med. 2003;97:302–307. doi: 10.1053/rmed.2002.1389. [DOI] [PubMed] [Google Scholar]
- Hamilos DL. Allergic Fungal Rhinitis and Rhinosinusitis. Proc Am Thorac Soc. 2010;7:245–252. doi: 10.1513/pats.200909-098AL. [DOI] [PubMed] [Google Scholar]
- Harriman LG. M2-2 Practical Aspects of Locating and Measuring Moisture in Buildings. Building Enclosure Science and Technology; Minneapolis, MN: 2008. [Google Scholar]
- Heederik D, Von Mutius E. Does diversity of environmental microbial exposure matter for the occurrence of allergy and asthma? J Allergy Clin Immunol. 2012;130:44–50. doi: 10.1016/j.jaci.2012.01.067. [DOI] [PubMed] [Google Scholar]
- Horn HS. Measurement of Overlap in Comparative Ecological Studies. Am Nat. 1966;100:419–424. [Google Scholar]
- Hospodsky D, Qian J, Nazaroff WW, Yamamoto N, Bibby K, Rismani-Yazdi H, Peccia J. Human Occupancy as a Source of Indoor Airborne Bacteria. PLoS ONE. 2012;7:e34867. doi: 10.1371/journal.pone.0034867. [DOI] [PMC free article] [PubMed] [Google Scholar]
- Hyvärinen A, Meklin T, Vepsäläinen A, Nevalainen A. Fungi and actinobacteria in moisture-damaged building materials — concentrations and diversity. Int Biodeter Biodegr. 2002;49:27–37. [Google Scholar]
- Hyvärinen A, Roponen M, Tiittanen P, Laitinen S, Nevalainen A, Pekkanen J. Dust sampling methods for endotoxin – an essential, but underestimated issue. Indoor Air. 2006;16:20–27. doi: 10.1111/j.1600-0668.2005.00392.x. [DOI] [PubMed] [Google Scholar]
- Lara M, Akinbami L, Flores G, Morgenstern H. Heterogeneity of Childhood Asthma Among Hispanic Children: Puerto Rican Children Bear a Disproportionate Burden. Pediatrics. 2006;117:43–53. doi: 10.1542/peds.2004-1714. [DOI] [PubMed] [Google Scholar]
- Larena I, Salazar O, Gonzalez V, Julian MC, Rubio V. Design of a primer for ribosomal DNA internal transcribed spacer with enhanced specificity for ascomycetes. J Biotechnol. 1999;75:187–194. doi: 10.1016/s0168-1656(99)00154-6. [DOI] [PubMed] [Google Scholar]
- Lehrer SB, Hughes JM, Altman LC, Bousquet J, Davies RJ, Gell L, Li J, Lopez M, Malling HJ, Mathison DA, et al. Prevalence of basidiomycete allergy in the USA and Europe and its relationship to allergic respiratory symptoms. Allergy. 1994;49:460–465. doi: 10.1111/j.1398-9995.1994.tb00840.x. [DOI] [PubMed] [Google Scholar]
- Levitz SM. The Ecology of Cryptococcus neoformans and the Epidemiology of Cryptococcosis. Rev Infect Dis. 1991;13:1163–1169. doi: 10.1093/clinids/13.6.1163. [DOI] [PubMed] [Google Scholar]
- Lewis RG, Fortmann RC, Camann DE. Evaluation of methods for monitoring the potential exposure of small children to pesticides in the residential environment. Arch Environ Contam Toxicol. 1994;26:37–46. doi: 10.1007/BF00212792. [DOI] [PubMed] [Google Scholar]
- Li J, Tibshirani R. Finding consistent patterns: A nonparametric approach for identifying differential expression in RNA-Seq data. Stat Methods Med Res. 2011 doi: 10.1177/0962280211428386. [DOI] [PMC free article] [PubMed] [Google Scholar]
- Manter D, Vivanco J. Use of the ITS primers, ITS1F and ITS4, to characterize fungal abundance and diversity in mixed-template samples by qPCR and length heterogeneity analysis. J Microbiol Meth. 2007;71:7–14. doi: 10.1016/j.mimet.2007.06.016. [DOI] [PubMed] [Google Scholar]
- Markle JGM, Frank DN, Mortin-Toth S, Robertson CE, Feazel LM, Rolle-Kampczyk U, Von Bergen M, Mccoy KD, Macpherson AJ, Danska JS. Sex Differences in the Gut Microbiome Drive Hormone-Dependent Regulation of Autoimmunity. Science. 2013;339:1084–1088. doi: 10.1126/science.1233521. [DOI] [PubMed] [Google Scholar]
- Marsella R, Nicklin C, Lopez J. Studies on the role of routes of allergen exposure in high IgE-producing beagle dogs sensitized to house dust mites. Vet Dermatol. 2006;17:306–312. doi: 10.1111/j.1365-3164.2006.00541.x. [DOI] [PubMed] [Google Scholar]
- Mendell MJ, Mirer AG, Cheung K, Tong M, Douwes J. Respiratory and Allergic Health Effects of Dampness, Mold, and Dampness-Related Agents: A Review of the Epidemiologic Evidence. Environ Health Perspect. 2011;119:748–756. doi: 10.1289/ehp.1002410. [DOI] [PMC free article] [PubMed] [Google Scholar]
- Nilsson RH, Bok G, Ryberg M, Kristiansson E, Hallenberg N. A software pipeline for processing and identification of fungal ITS sequences. Source Code Biol Med. 2009;4:1. doi: 10.1186/1751-0473-4-1. [DOI] [PMC free article] [PubMed] [Google Scholar]
- Park HK, Ha M-H, Park S-G, Kim MN, Kim BJ, Kim W. Characterization of the Fungal Microbiota (Mycobiome) in Healthy and Dandruff-Afflicted Human Scalps. PLoS ONE. 2012;7:e32847. doi: 10.1371/journal.pone.0032847. [DOI] [PMC free article] [PubMed] [Google Scholar]
- Pekkanen J, Hyvärinen A, Haverinen-Shaughnessy U, Korppi M, Putus T, Nevalainen A. Moisture damage and childhood asthma: a population-based incident case–control study. Eur Respir J. 2007;29:509–515. doi: 10.1183/09031936.00040806. [DOI] [PubMed] [Google Scholar]
- Pitkäranta M, Meklin T, Hyvarinen A, Nevalainen A, Paulin L, Auvinen P, Lignell U, Rintala H. Molecular profiling of fungal communities in moisture damaged buildings before and after remediation--a comparison of culture-dependent and culture-independent methods. BMC Microbiol. 2011;11:235–235. doi: 10.1186/1471-2180-11-235. [DOI] [PMC free article] [PubMed] [Google Scholar]
- Pitkäranta M, Meklin T, Hyvärinen A, Paulin L, Auvinen P, Nevalainen A, Rintala H. Analysis of Fungal Flora in Indoor Dust by Ribosomal DNA Sequence Analysis, Quantitative PCR, and Culture. Appl Environ Microbiol. 2008;74:233–244. doi: 10.1128/AEM.00692-07. [DOI] [PMC free article] [PubMed] [Google Scholar]
- Quansah R, Jaakkola MS, Hugg TT, Heikkinen SA, Jaakkola JJ. Residential dampness and molds and the risk of developing asthma: a systematic review and meta-analysis. PLoS ONE. 2012;7:e47526. doi: 10.1371/journal.pone.0047526. [DOI] [PMC free article] [PubMed] [Google Scholar]
- Quince C, Lanzen A, Davenport R, Turnbaugh P. Removing Noise From Pyrosequenced Amplicons. BMC Bioinformatics. 2011;12:38. doi: 10.1186/1471-2105-12-38. [DOI] [PMC free article] [PubMed] [Google Scholar]
- Redlich CA. Skin exposure and asthma: is there a connection? Proc Am Thorac Soc. 2010;7:134–137. doi: 10.1513/pats.201002-025RM. [DOI] [PMC free article] [PubMed] [Google Scholar]
- Reponen T, Lockey J, Bernstein DI, Vesper SJ, Levin L, Khurana Hershey GK, Zheng S, Ryan P, Grinshpun SA, Villareal M, Lemasters G. Infant origins of childhood asthma associated with specific molds. J Allergy Clin Immunol. 2012;130:639–644. e635. doi: 10.1016/j.jaci.2012.05.030. [DOI] [PMC free article] [PubMed] [Google Scholar]
- Reponen T, Vesper S, Levin L, Johansson E, Ryan P, Burkle J, Grinshpun SA, Zheng S, Bernstein DI, Lockey J, Villareal M, Khurana Hershey GK, Lemasters G. High environmental relative moldiness index during infancy as a predictor of asthma at 7 years of age. Ann Allerg Asthma Im. 2011;107:120–126. doi: 10.1016/j.anai.2011.04.018. [DOI] [PMC free article] [PubMed] [Google Scholar]
- Schalchli H, Hormazabal E, Becerra J, Birkett M, Alvear M, Vidal J, Quiroz A. Antifungal activity of volatile metabolites emitted by mycelial cultures of saprophytic fungi. Chem Ecol. 2011;27:503–513. [Google Scholar]
- Schoch CL, Seifert KA, Huhndorf S, Robert V, Spouge JL, Levesque CA, Chen W. Nuclear ribosomal internal transcribed spacer (ITS) region as a universal DNA barcode marker for Fungi. Proc Natl Acad Sci U S A. 2012;109:6241–6246. doi: 10.1073/pnas.1117018109. [DOI] [PMC free article] [PubMed] [Google Scholar]
- Schram-Bijkerk D, Doekes G, Boeve M, Douwes J, Riedler J, Üblagger E, Von Mutius E, Benz M, Pershagen G, Wickman M, Alfvén T, Braun-Fahrländer C, Waser M, Brunekreef B the PARSIFAL study group . Exposure to microbial components and allergens in population studies: a comparison of two house dust collection methods applied by participants and fieldworkers. Indoor Air. 2006;16:414–425. doi: 10.1111/j.1600-0668.2006.00435.x. [DOI] [PubMed] [Google Scholar]
- Simon-Nobbe B, Denk U, Pöll V, Rid R, Breitenbach M. The Spectrum of Fungal Allergy. Int Arch Allergy Imm. 2008;145:58–86. doi: 10.1159/000107578. [DOI] [PubMed] [Google Scholar]
- Sjögren YM, Jenmalm MC, Bottcher MF, Bjorksten B, Sverremark-Ekstrom E. Altered early infant gut microbiota in children developing allergy up to 5 years of age. Clin Exp Allergy. 2009;39:518–526. doi: 10.1111/j.1365-2222.2008.03156.x. [DOI] [PubMed] [Google Scholar]
- Stark PC, Celedon JC, Chew GL, Ryan LM, Burge HA, Muilenberg ML, Gold DR. Fungal levels in the home and allergic rhinitis by 5 years of age. Environ Health Perspect. 2005;113:1405–1409. doi: 10.1289/ehp.7844. [DOI] [PMC free article] [PubMed] [Google Scholar]
- Tischer CG, Heinrich J. Exposure assessment of residential mould, fungi and microbial components in relation to children’s health: Achievements and challenges. Int J Hyg Environ Health. 2013;216:109–114. doi: 10.1016/j.ijheh.2012.05.002. [DOI] [PubMed] [Google Scholar]
- Tusher VG, Tibshirani R, Chu G. Significance analysis of microarrays applied to the ionizing radiation response. Proc Natl A Sci USA. 2001;98:5116–5121. doi: 10.1073/pnas.091062498. [DOI] [PMC free article] [PubMed] [Google Scholar]
- Vogt R, Bersamin A, Ellemberg C, Winkleby MA. Evaluation of risk factors and a community intervention to increase control and treatment of asthma in a low-income semi-rural California community. J Asthma. 2008;45:568–574. doi: 10.1080/02770900802005269. [DOI] [PMC free article] [PubMed] [Google Scholar]
- Von Hertzen L, Hanski I, Haahtela T. Natural immunity. EMBO Rep. 2011;12:1089–1093. doi: 10.1038/embor.2011.195. [DOI] [PMC free article] [PubMed] [Google Scholar]
- Yamamoto N, Bibby K, Qian J, Hospodsky D, Rismani-Yazdi H, Nazaroff WW, Peccia J. Particle-size distributions and seasonal diversity of allergenic and pathogenic fungi in outdoor air. ISME J. 2012;6:1801–1811. doi: 10.1038/ismej.2012.30. [DOI] [PMC free article] [PubMed] [Google Scholar]
Associated Data
This section collects any data citations, data availability statements, or supplementary materials included in this article.