Abstract
Our eyes are increasingly exposed to light from the emitting diode (LED) light of video display terminals (VDT) which contain much blue light. VDTs are equipped with televisions, personal computers, and smart phones. The present study aims to clarify the mechanism underlying blue LED light-induced photoreceptor cell damage. Murine cone photoreceptor-derived cells (661 W) were exposed to blue, white, or green LED light (0.38 mW/cm2). In the present study, blue LED light increased reactive oxygen species (ROS) production, altered the protein expression level, induced the aggregation of short-wavelength opsins (S-opsin), resulting in severe cell damage. While, blue LED light damaged the primary retinal cells and the damage was photoreceptor specific. N-Acetylcysteine (NAC), an antioxidant, protected against the cellular damage induced by blue LED light. Overall, the LED light induced cell damage was wavelength-, but not energy-dependent and may cause more severe retinal photoreceptor cell damage than the other LED light.
Humans spend increasing amounts of time in the presence of video display terminals (VDT) equipped with a liquid crystal display, such as televisions, personal computers, and smart phones. In addition to these VDT, we are constantly exposed to various other types of light that shine around us. Light emitting diodes (LED) light are emerging as an important source of light replacing conventional lights. It is widely used for illumination, especially in liquid crystal displays, car lights and so on. VDT emit a large amount of blue light, and blue light has been reported to be harmful to the retina1,2.
Age-related macular degeneration (AMD), a retinal degenerative disease, affects more than 30% of the people at or over 75 years of age3. The pathogenesis of AMD usually advances with retinal photic injury caused by excessive light exposure and consequent oxidative stress4,5. The retina contains much chromophores which can lead to the photochemical damage when excited at the each wavelength light, and age-related decrease of antioxidants such as superoxide dismutase (SOD) and increase of ROS following light exposure can progress to the pathology of AMD6. The loss of vision is the major symptom of retinal diseases such as AMD, and the early pathogenesis involves degeneration of retinal pigment epithelial (RPE) cells7. It is reported that the accumulation of lipofuscin and the formation of drusen in the Bruch's membrane cause apoptosis of RPE cells8,9,10,11. These are considered as the initial stages that lead to AMD. Subsequently, photoreceptor cell degeneration occurs after RPE cell death and can lead to vision loss7. Furthermore, it is known that the photoreceptor cell death is facilitated by oxidative stress induced the generation of reactive oxygen species (ROS) such as superoxide (·O2−) and hydrogen peroxide (H2O2)12. In addition to RPE cell death, the oxidative stress due to ROS generation causes photoreceptor cell death12,13.
Blue light (from 450 to 495 nm) has a short wavelength, and it is a part of the high- energy visible light spectrum unlike several other colors. Previous reports suggested that the blue light more severe damaged retinal photoreceptor cells than green light in rats1. The short wavelength (blue) light usually recover rhodopsin by photoreversal of bleaching in rod photoreceptor cells14,15. However, following exposure to excessive light the regeneration could occur very rapidly through the process of photoreversal, and therefore rhodopsin can bleach several times in a short period in vivo15. While, the aggregation of short-wavelength opsins (S-opsin) can cause rapid cone degeneration. It is reported medium wavelength opsins (M-opsin) are easily degraded, but S-opsin is not easily degraded by proteasome degradation16. We have reported that the excessive light exposure induced the aggregation of S-opsin, and leading to endoplasmic reticulum (ER) stress in the cone photoreceptor-derived cell line, 661 W17.
In some groups, the mouse-derived 661 W cells have been used as a light-induced retinal damage model in vitro18,19. In this study, we investigated how the in vitro exposure to blue LED lights affects 661 W cells and primary retinal cells. Furthermore, we evaluated the effects of an antioxidant, N-acetylcysteine (NAC), against the blue LED light-induced photoreceptor-derived cell damage.
Methods
Cell culture
Murine photoreceptor-derived 661 W cells were kindly gifted by Dr. Muayyad R. Al-Ubaidi (Department of Cell Biology, University of Oklahoma Health Sciences Center, Oklahoma City, OK, USA). The cells were maintained in Dulbecco's modified Eagle medium (DMEM; Nacalai Tesque Inc, Kyoto, Japan) containing 10% fetal bovine serum (FBS; Sigma-Aldrich, St. Louis, MO, USA), 100 U/mL penicillin (Meiji Seika Kaisha Ltd., Tokyo, Japan), and 100 μg/mL streptomycin (Meiji Seika) under a humidified atmosphere of 5% CO2 at 37°C. These cells were passaged by trypsinization every 3 to 4 days.
LED light-induced cell death in 661 W cell cultures
The 661 W cells were seeded at a density of 3 × 10³ cells per well into 96-well plates, and then incubated for 24 h under a humidified atmosphere of 5% CO2 at 37°C. After 661 W cells were treated N-acetylcystein (NAC) (Wako, Osaka, Japan) or vehicle (1% FBS, DMEM), the cells were incubated for 1 h. Then, the cells were exposed to 0.38 mW/cm2 [equivalent to 450 lux for blue LED light (464 nm); 1,600 lux for white LED light (the wavelength peak is 456 nm and 553 nm); and 2,500 lux for green LED light (522 nm)] or altermately, to 2,500 lux of blue, white, or green LED light from below the 96-well plates for 24 h. Subsequently, they were incubated for 12 h. Control cells incubated in the dark and light-irradiated 661 W cells were obtained from the same stock, thereby eliminating any preexisting bias (such as light and temperature) as previously described by Kanan et al. (Kanan et al., 2007). The energy was measured by 1916-R Handheld Optical Power Meter (Newport, Osaka, Japan).
Cell viability assay
We examined the change in the fluorescence intensity after the cellular mitochondrial reduction of WST-8 to formazan. The 661 W cells were seeded at a density of 3 × 10³ cells per well into 96-well plates, and then incubated for 24 h under a humidified atmosphere of 5% CO2 at 37°C. After the addition of NAC at 1 mM or vehicle (1% FBS, DMEM), the cells were incubated for 1 h. Then, the cells were exposed to 0.38 mW/cm2 or 2,500 lux of blue, white, or green LED light for 24 h. Cell viability was measured by culturing the cells in a culture medium containing 10% WST-8 (Cell Counting Kit-8; Dojin Kagaku, Kumamoto, Japan) for 2 h at 37°C and then by scanning using with a microplate reader (Varioskan Flash 2.4; Thermo Fisher Scientific, Waltham, MA, USA).
Mitochondrial membrane potential assay
Mitochondrial membrane potential assay was performed after blue LED light exposure for 24 h in 661 W cells. The mitochondrial membrane potential was measured using the JC-1 Mitochondrial Membrane Potential Assay Kit (Cayman Chemical Company, Ann Arbor, MI) according to the manufacturer's protocol. The images were captured using a BZ-9000 Biorevo all-in-one fluorescence microscope (Keyence, Osaka, Japan), which detects healthy cells with mainly JC-1 J-aggregates (excitation/emission = 540/605 nm) and apoptotic or unhealthy cells with mainly JC-1 monomers (excitation/emission = 480/510 nm). Merged cells were considered to be pre-apoptotic (early or middle state of transition to cell death) cells20. The number of cells (red or yellow stained cells) was counted in a blind manner with image-processing software (Image-J).
Measurement of cellular ROS production
The 661 W cells were seeded at a density of 3 × 10³ cells per well in 96-well plates, and then incubated for 24 h under a humidified atmosphere of 5% CO2 at 37°C. After the addition of NAC 1 mM or vehicle (1% FBS, DMEM), the cells were incubated for 1 h and then exposed to 0.38 mW/cm2 or 2,500 lux of blue, white, or green LED light for 6 h or 24 h. Then 10 μM of 5-(and-6)-chloromethyl-2′,7′-dichlorodihydrofluorescein diacetate, acetyl ester (CM-H2DCFDA; Invitrogen, Carlsbad, CA, USA), a free radical probe, was added to the cell culture after LED light exposure and incubation was continued for 1 h at 37°C. The radical probe was converted to 2′,7′-dichlorodihydrofluorescein (DCFH) by the action of intracellular esterase. Intracellular DCFH (nonfluorescent) was oxidized to 2′, 7′-dichlorfluorescein (DCF, fluorescent) by intracellular ROS. Fluorescence was measured by a Varioskan Flash 2.4 microplate reader (Thermo Fisher Scientific) at 485 nm (excitation) and 535 nm (emission).
Western blotting analysis
The 661 W cells were seeded at a density of 3 × 10⁴ cells per well in 12-well plates, and then incubated for 24 h under a humidified atmosphere of 5% CO2 at 37°C. After treatment with 1 mM NAC or vehicle (1% FBS, DMEM), the cells were incubated for 1 h. The cells were exposed to 2,500 lux of blue, white, or green LED light for 24 h. Then, the cells were washed with PBS, lysed in RIPA buffer (Sigma-Aldrich) containing 1% protease inhibitor cocktail and 1% of the phosphatase inhibitor cocktails 2 and 3 (Sigma-Aldrich), and harvested. Lysates were centrifuged at 12,000 g for 15 min at 4°C. Protein concentrations were measured by using a BCA Protein Assay Kit (Thermo Scientific, Rockford, IL, USA) with bovine serum albumin as a standard. Thereafter, an equal volume of protein sample and sample buffer was mixed, and the samples were boiled for 5 min at 100°C. The protein samples were separated by 5–20% SDS-PAGE gradient electrophoresis and then transferred to polyvinylidene difluoride membranes (Immobilon-P; Millipore). For immunoblotting, the following primary antibodies were used: rabbit anti-phospho NF-κB (Cell Signaling Technology, Danvers, MA, USA), rabbit anti-NF-κB (Cell Signaling Technology), rabbit anti-p38 antibody (Cell Signaling Technology), rabbit anti-phospho p38 (Cell Signaling Technology), rabbit anti-phospho ERK (Cell Signaling Technology), rabbit anti-ERK (Cell Signaling Technology), rabbit anti-LC3-I and II (Cell Signaling Technology) and mouse anti-β-actin mouse monoclonal (Sigma-Aldrich) antibodies. A horseradish peroxidase (HRP)-conjugated goat anti-rabbit antibody (Pierce Biotechnology, Rockford, IL, USA) and an HRP-conjugated goat anti mouse antibody were used as secondary antibodies. Immunoreactive bands were visualized using Immunostar-LD (Wako) and a LAS-4000 luminescent image analyzer (Fuji Film Co., Ltd., Tokyo, Japan). β-actin was used as the loading control. The membrane was stripped by stripping buffer (Thermo Fisher Scientific) after observing phosphorylated-proteins, and then observed total-proteins.
Immunostaining
The 661 W cells were seeded at a density of 1.5 × 10⁴ cells per well into glass chamber slides (Laboratory-Tek;Life Technologies, Gaithersburg, MD, USA), and incubated for 24 h. The medium was changed by 1% FBS, DMEM and incubated for 1 h. Then, the cells were exposed to 0.38 mW/cm2 of blue, white, or green LED light for 24 h or blue LED light for 3 or 6 h. Thereafter, the cells were fixed with 4% paraformaldehyde for 15 minutes, blocked in 3% horse serum for 30 minutes, and incubated overnight at 4°C with primary antibodies [anti-S-opsin rabbit polyclonal antibody (Chemicon, Temecula, CA,USA)]. After being washed, the cells were incubated for 1 h with secondary antibodies [Alexa Fluor® 488 goat anti-rabbit IgG (Invitrogen)]. Then, being washed, and counter-stained with Hoechst 33342 (Invitrogen). Images were taken using a confocal fluorescence microscope (Olympus). After taking images, the perinuclear S-opsin aggregated cells were counted in the 212 μm area with Image-J.
Cell death analysis
The cell death rate was calculated by double staining with two fluorescent dyes: Hoechst 33342 (Invitrogen) and propidium iodide (PI; Invitrogen). Hoechst 33342 stains the nuclei of all cells, whereas PI stains only dead cells. At the end of the culture period, Hoechst 33342 and PI were added to the culture medium for 15 min at final concentrations of 8.1 μM and 1.5 μM, respectively. Images were collected using an Olympus IX70 inverted epifluorescence microscope (Olympus, Tokyo, Japan). The total number of cells was counted in a blind manner and the percentage of PI-positive cells was calculated.
Caspase 3/7 activation assay
Activation of caspase 3/7 was assayed after blue LED light exposure for 24 h in 661 W cells. Caspase 3/7 was measured by using the Caspase-Glo 3/7 Assay (Promega, Madison, WI, USA) according to the manufacturer's instructions. After LED light exposure, caspase-Glo 3/7 reagent was added with at 1:1 ratio to the sample volume, and the cells were incubated for 1 h at 37°C. The luminescence of each sample was measured using a microplate reader (Varioskan Flash 2.4; Thermo Fisher Scientific, Waltham, MA, USA).
Animals
Female ddY pregnant mice and the neonatal mice (Japan SLC, Hamamatsu) were maintained under controlled lighting environment (12 h:12 h light/dark cycle). All experiments were performed in accordance with the ARVO Statement for the Use of Animals in Ophthalmic and Vision Research and were approved and monitored by the Institutional Animal Care and Use Committee of Gifu Pharmaceutical University.
Primary retinal culture
Retinas from P8 ddY mice were dissected without choroidal vessels and dissociated by activated papain for 30 min at 37°C, using the protocol of Tsuruma et al.21. Neurobasal medium (Invitrogen) including ovomucoid (Sigma-Aldrich) plus DNase (Invitrogen) was added, and the cells were centrifuged at 800 rpm for 8 min at room temperature. The pellet was suspended in neurobasal medium including ovomucoid without DNase, and recentrifuged. Then, the cells were resuspended in neurobasal medium containing L-glutamine, B27 (Invitrogen), and antibiotics. Cells were plated onto poly-D-lysine/laminin–coated 96-well dishes at 2.0 × 10⁵ cells/well and glass chamber slides at 1.0 × 10⁶ cells/well. After incubation for 20 h, medium was changed and blue LED light exposure started. After blue LED light exposure for 24 h, WST-8 assay and ROS measurement were performed. For immunostaining, the cells were fixed with 4% paraformaldehyde and subsequently same protocol as described above was applied. Following antibodies were used as primary antibodies [anti-S-opsin goat polyclonal antibody (Santa Cruz, CA, USA) and anti-cleaved caspase-3 rabbit polyclonal antibody (Cell Signaling Technology)] and as secondary antibodies [Alexa Fluor® 488 donkey anti-goat IgG (Invitrogen) and Fluor® 546 donkey anti-rabbit IgG (Invitrogen)]. Images were taken using a confocal fluorescence microscope (Olympus). After taking images, the S-opsin and cleaved caspase-3 positive cells were counted in the 212 μm area with Image-J.
Statistical analysis
Data are presented as the means ± S.E.M. Statistical comparisons were conducted using ANOVA or one-way ANOVA followed by Bonferroni's test, Dunnett's test, Tukey's test [STAT VIEW version 5.0 (SAS Institute, Cary, NC, USA)]. p < 0.05 was considered as statistically significant.
Results
Blue LED light damaged most severely compared to white and green LED light
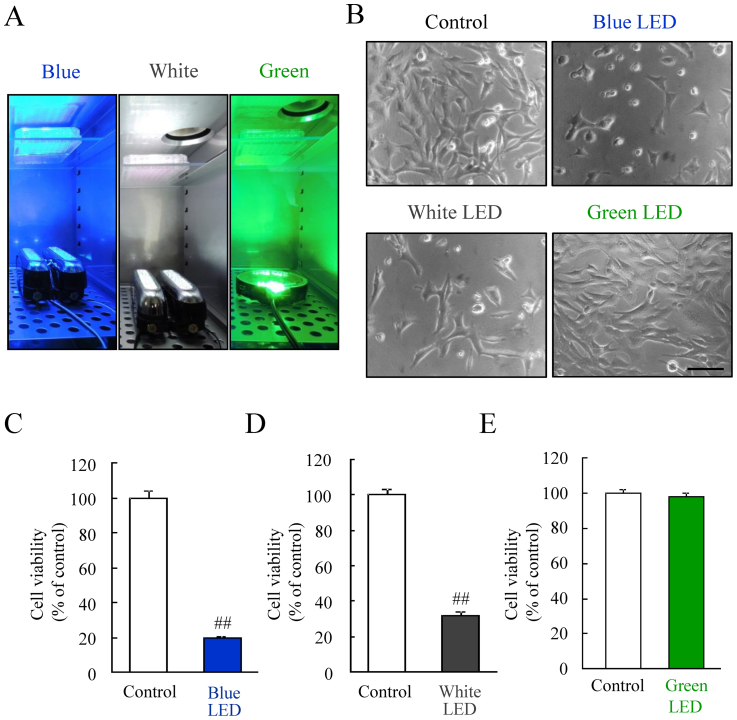
We first examined the relationship between the photoreceptor-derived cell damage and the difference in the color of the LED lights, under the same illuminance of 2,500 lux. Our results suggested that the blue LED light damaged the photoreceptor-derived cells more severely than white and green LED light (see Supplementary Fig. S1 online). Next, we investigated the effects of LED light on the cells under unified energy (0.38 mW/cm2). This energy equals to 2,500 lux of green LED light. The photograph illustrates 96 well plates exposed to each LED light (Figure 1A). A representative photomicrograph of cell morphology was taken using bright field microscopy. The photoreceptor-derived cells were changed by blue and white LED light (Figure 1B). Green LED light did not change the cells. Quantitative data showed blue and white LED lights significantly reduced cell viability, but green LED light did not affect it (Figure 1C–E).
Figure 1. The effects of blue, white, and green LED lights on the cell viability.
(A) The exposure of blue, white, and green LED light to cells cultured in a 96-well plate. (B) The observation of cell morphology using bright field microscopy, showing blue LED light caused the morphological changes compared with the control. Green LED light did not change the cells. (C–E) The quantitative evaluation of cell viability by the CCK-8 assay. This result is consistent with the observed change in cell morphology. Cell viability was reduced by blue and white LED light exposure, but not green LED light. The scale bar represents 50 μm. Data are expressed as mean ± SEM (n = 6). ## indicates p < 0.01 vs. control (ANOVA).
Blue LED light exposure increased ROS generation compared to white and green LED lights
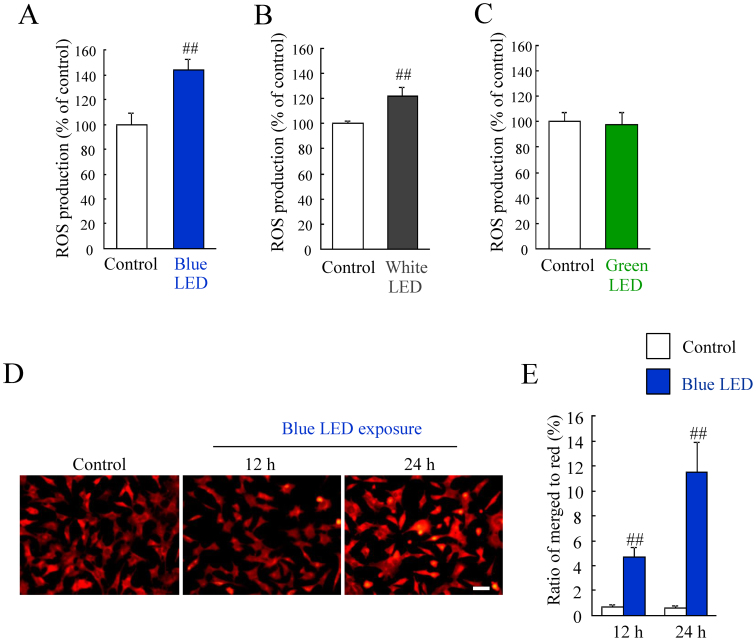
First, we evaluated the relationship between ROS generation and exposure to three different colored LED lights for 24 h at 2,500 lux. We found that blue LED light induced a higher ROS production than white and green LED lights (see Supplementary Fig. S2 and S4C online). Then, we investigated these changes under unified LED energy (0.38 mW/cm2). Blue LED light induced ROS increase (see Supplementary Fig. S4A online). White and green LED lights also increased the ROS generation but at lower levels compared to blue LED light (see Supplementary Fig. S4B and S4C online). The direct comparison in each LED exposed groups showed blue LED light-induced ROS production was most severely than the other LED light-induced ROS production (see Supplementary Fig. S4D online). Moreover, we examined whether the LED light exposure for 6 h induced ROS production. Blue LED light exposure for 6 h induced 1.4-fold ROS increase, and white LED light exposure for 6 h induced 1.2-fold ROS increase (Figure 2A, B). Green LED light exposure for 6 h did not induce ROS increase (Figure 2C). The photoreceptor cell death is promoted by oxidative stress induced the generation of ROS12, and it is confirmed that the damage induced by light exposure reduces the mitochondrial membrane potential in vivo light-induced retinal degeneration model22. Therefore, we evaluated the mitochondrial membrane potential. The healthy cells were detected with mainly JC-1 J-aggregates (red) and apoptotic or unhealthy cells with mainly JC-1 monomers (green). Merged cells (yellow) were considered to be pre-apoptotic (early or middle state of transition to cell death) cells19. Control cells were almost stained with red (Figure 2D). Blue LED light increased the pro-apoptotic cells (yellow) in time dependent manner (Figure 2E). The ratio of merged cells to red stained cells was significantly increased by blue LED exposure for 12 or 24 h (Figure 2E).
Figure 2. ROS production by blue, white, and green LED light exposure.
(A–C) Blue LED light and white LED light exposure increased each 1.4-fold and 1.2-fold ROS production, and green LED light did not increase ROS level. Data are expressed as mean ± SEM (n = 6). ## indicates p < 0.01 vs. control (ANOVA). (D) Representative images show JC-1 stained cells. The healthy cells with mainly JC-1 J-aggregates (red) and apoptotic or unhealthy cells with mainly JC-1 monomers (green). Merged cells (yellow) were considered to be pre-apoptotic (early or middle state of transition to cell death) cells. Scale bar represents 50 μm. (E) The number of cells with red or yellow color were counted. The ratio of merged cells to red color cells was increased by blue LED light exposure for 12 h or 24 h. Data are expressed as mean ± SEM (n = 6). ## indicates p < 0.01 vs. control (ANOVA).
Blue LED light altered the levels of activated-NF-κB, phosphorylated-p38 MAPK, and phosphorylated-ERK
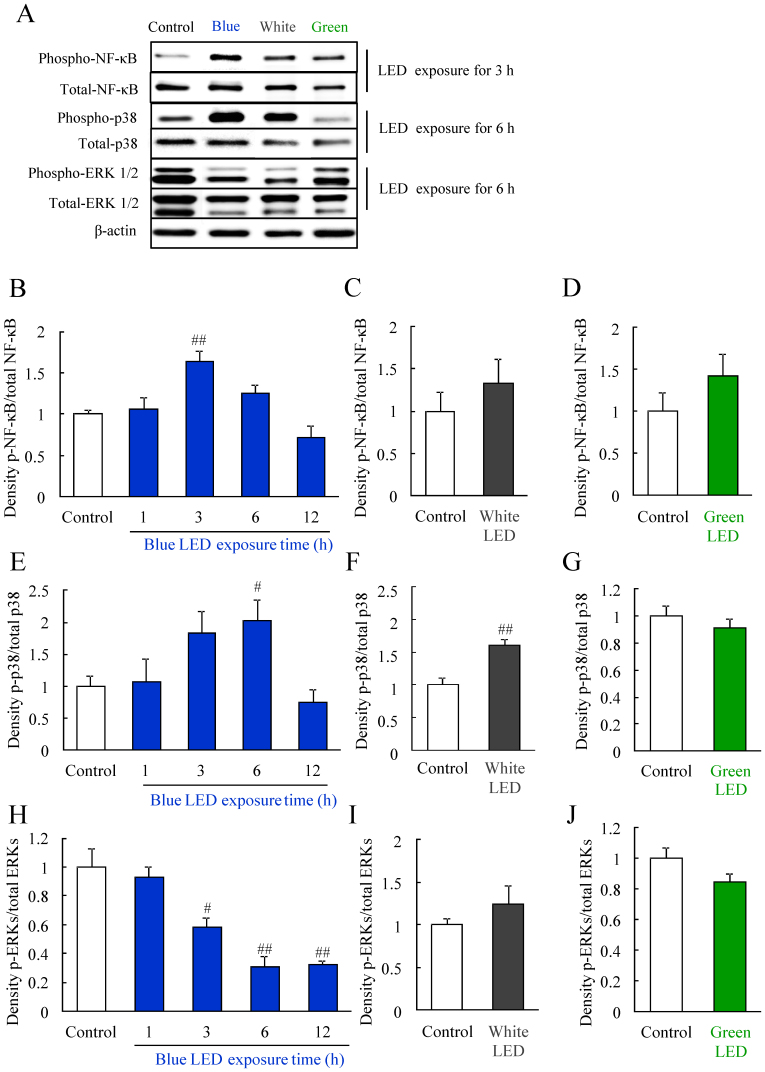
ROS generation induces MAPK activation, and MAPK modulates inflammation, cell death and so on23. p38 MAPK is activated by light exposure19,24. Western blotting was used to investigate the mechanism of photoreceptor-derived cell damage by LED light exposure at 2,500 lux. The protein expression of NF-κB, p38, and ERK were detected after LED exposure (Figure 3A–J). The level of activated NF-κB significantly increased at 3 h after blue LED light (Figure 3B), but not white or green LED light exposure (Figure 3C and 3D). The level of phosphorylated p38 MAPK significantly increased at 3 h, peaked at 6 h, and then declined to control levels at 12 h after blue LED light exposure and similarly increased at 6 h after white LED exposure (Figure 3E and 3F). In contrast, green LED light did not alter the levels of phosphorylated p38 MAPK (Figure 3G). Moreover, blue LED light reduced the levels of phosphorylated ERK after LED light exposure in a time-dependent manner (Figure 3H). White or green LED light did not alter the levels of phosphorylated ERK (Figure 3I and 3J).
Figure 3. Changes in protein levels induced by blue LED light exposure.
(A) Western blotting showed changes in the levels of phosphorylated NF-κB, p38, and ERK (p-NF-κB, p-p38, and p-ERK). The bands indicate protein expression levels at each 3 h (NF-κB), 6 h (p38), and 6 h (ERK) after LED light exposure. (B–D) Quantitative analysis of protein levels. Quantitative data of the groups of white LED and green LED exposure indicates 3 h (NF-κB), 6 h (p38), and 6 h (ERK) results. The phosphorylated NF-κB level is increased 3 h after exposure to blue LED light. The phosphorylated p38 level is increased 6 h after blue and white LED light exposure. The phosphorylated ERK level is decreased 6 h after blue LED light exposure. These changes were not observed after green LED light exposure. Data are expressed as mean ± SEM (n = 3 to 6). # indicates p < 0.05, ## indicates p < 0.01 vs. control (B, E, H; one-way ANOVA followed by Dunnett's test, F; ANOVA). The cropped blots are used in this Figure and the full-length blots are presented in Supplementary Figure S5–7.
The aggregation of S-opsin induced by blue and white LED light was observed
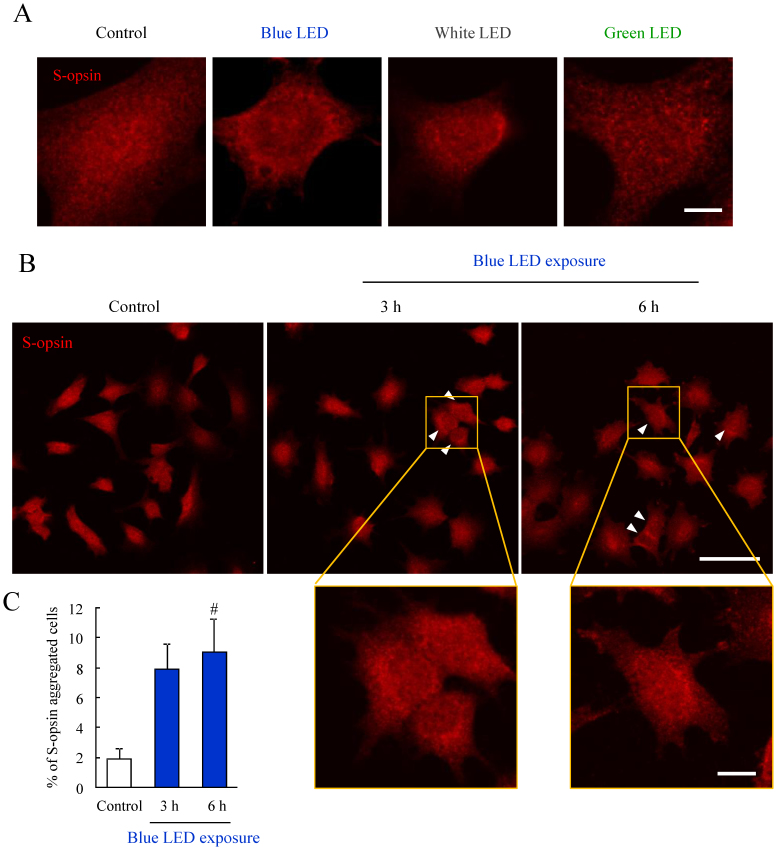
When compared to 661 W and NB1-RGB cell damage, 661 W cells were more damaged than NB1-RGB cells by blue LED light exposure (see Supplementary Fig. S3A online). This difference may be due to the exisitence of cone photoreceptor specific protein, S-opsin. S-opsin did not observe in NB1-RGB cells (see Supplementary Fig. S3B online). It has been reported that S-opsin is present in 661 W cells25. We evaluated whether LED light exposure caused the aggregation of S-opsin in 661 W cells by immunostaining in LED light exposure for 24 h. The perinuclear aggregation of S-opsin as observed in blue and white LED light exposed cells (Figure 4A). Green LED light did not cause the aggregation (Figure 4A). Next, we investigated whether blue LED light-induced the S-opsin aggregation during early stage. When the cells were exposed by blue LED light for 3 h or 6 h, S-opsin aggregated cells (arrowhead) were observed (Figure 4B). The graph shows the ratio of S-opsin aggregated cells to total cell numbers was increased by blue LED light exposure for 3 or 6 h (Figure 4C).
Figure 4. The aggregation of S-opsin induced by blue LED light exposure.
(A) Representative immunostaining images of S-opsin after LED light exposure for 24 h. Blue and white LED light-induced the perinuclear aggregation of S-opsin compared to control and green LED light. n = 4. (B) Representative immunostaining images of S-opsin shows that the S-opsin aggregated cells after blue LED light exposure for 3 or 6 h (arrowhead). (C) Quantitative analysis of immunostaining images. The ratio of the S-opsin aggregated cells was increased by blue LED light exposure for 3 or 6 h. Data are expressed as mean ± SEM (n = 3 or 4). # indicates p < 0.05 vs. control (one-way ANOVA followed by Dunnett's test). The scale bars represent 5 μm (A), 50 μm and 10 μm (B).
Blue LED light induced the photoreceptor cell specific damage
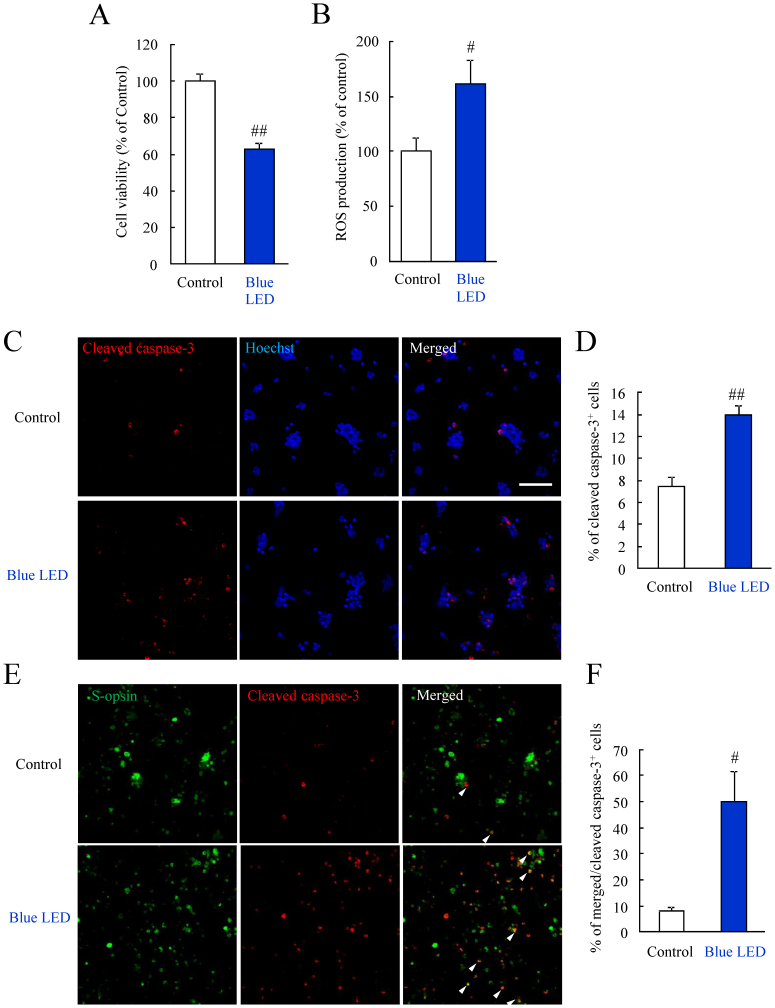
To consider the blue LED light-induced retinal photoreceptor cell damage in detail, we used the primary retinal cells. In this protocol of primary cell culture, the rod photoreceptor cells were obtained about 60% of total cells in our previous report21. In this study, we confirmed the ratio of S-opsin positive cells was about 15%. Blue LED light decreased the primary retinal cell viability (Figure 5A). Blue LED light increased the ROS level in primary retinal cells (Figure 5B). Next, we performed the experiment to confirm that the cell damage induced by blue LED light exposure is the definite event in photoreceptor cells. Blue LED light increased the cleaved caspase-3 positive cells by immunostaining (Figure 5C, D). Cleaved caspase-3 implicates active caspase-3. Then, we performed double immunostaining for S-opsin and cleaved caspase-3. Blue LED light increased the S-opsin and cleaved caspase-3 double positive cells (Figure 5E, F).
Figure 5. Blue LED light caused the primary retinal cell damage.
(A) Primary retinal cells were exposed to blue LED light for 24 h. The cell viability was evaluated by the CCK-8 assay. Blue LED light decreased the primary retinal cell viability. (B) Blue LED light increased the ROS level in primary retinal cells. (C, D) Immunostaining of cleaved caspase-3. Blue LED light increased the cleaved caspase-3 positive cells compared to control. (E, F) Double immunostaining for S-opsin and cleaved caspase-3. Blue LED light increased the S-opsin and cleaved caspase-3 double positive cells (arrowhead). Data are expressed as mean ± SEM (n = 3 or 4). # indicates p < 0.05, ## indicates p < 0.01 vs. control (ANOVA). The scale bar represents 50 μm.
The antioxidant NAC, inhibited the blue LED light-induced cellular damage, ROS generation, and NF-κB activation
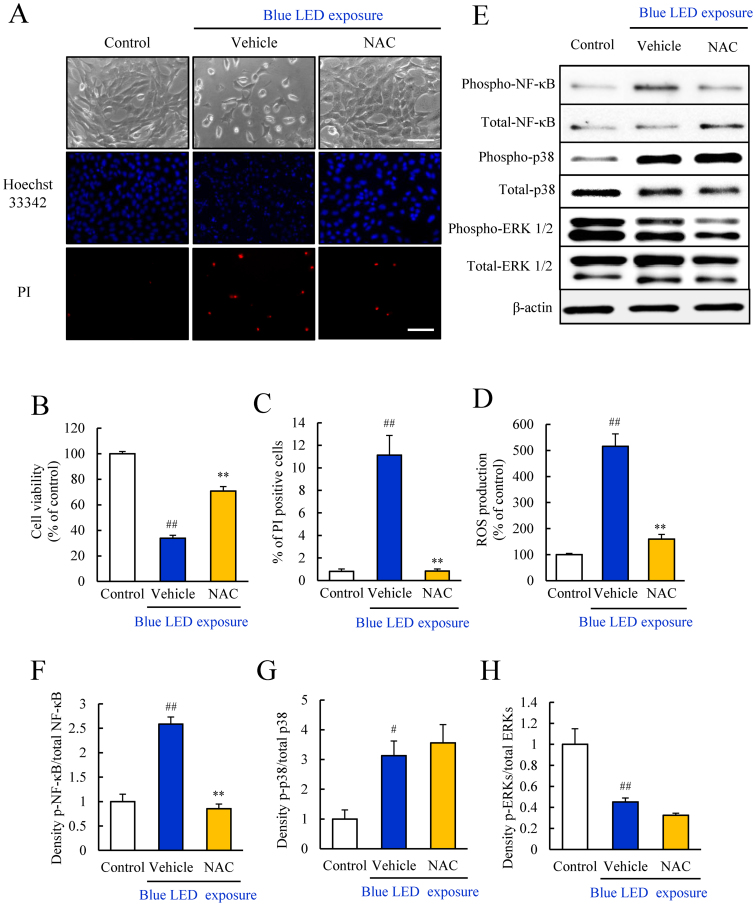
Our findings suggested that blue LED light damaged photoreceptor-derived cell most severely compared to the other LED lights. Then, we investigated the protective effects of an antioxidant against blue LED light-induced photoreceptor-derived cell damage. Representative photomicrographs of cell morphology, with Hoechst 33342 and PI staining shows the control, as well as cells treated with vehicle and NAC at 1 mM (Figure 6A). The number of dead cells (PI-positive) was increased in the vehicle-treated group. The treatment with NAC at 1 mM increased the number of viable cells and inhibited photoreceptor-derived cell death (Figure 6A). Furthermore, NAC improved cell viability, and markedly suppressed cell death and ROS production (Figure 6B–D). NAC at 1 mM suppressed the activation of NF-κB caused by blue LED light exposure, but did not affect the blue light-induced phosphorylation of p38 MAPK or ERK (Figure 6E–H).
Figure 6. NAC suppressed the blue LED light-induced damage and inhibited NF-κB activation.
(A–C) Evaluation of the cell viability by the CCK-8assay and the rate of cell death by Hoechst and PI staining. The rate of cell death indicates by the ratio of PI (red) stained cells per Hoechst (blue) stained cells. NAC at 1 mM significantly improved the cell viability reduced by blue LED light. (D) NAC reduced the ROS level elevated by blue LED light. (E–H) The effect of NAC against blue LED light-induced changes in protein expression was assessed by Western blots. NAC suppressed the blue LED light-induced increase in activated NF-κB levels, but did not suppress activated p38. NAC did not alter the reduced ERK level. Data are expressed as mean ± SEM (n = 5 or 6). ** indicates p < 0.01 vs. vehicle; ## indicates p < 0.01 vs. control (one-way ANOVA followed by Tukey's test). The scale bar represents 50 μm. The cropped blots are used in this Figure and the full-length blots are presented in Supplementary Figure S8.
NAC inhibited caspase-3/7 activity and autophagic cell death induced by blue LED light exposure
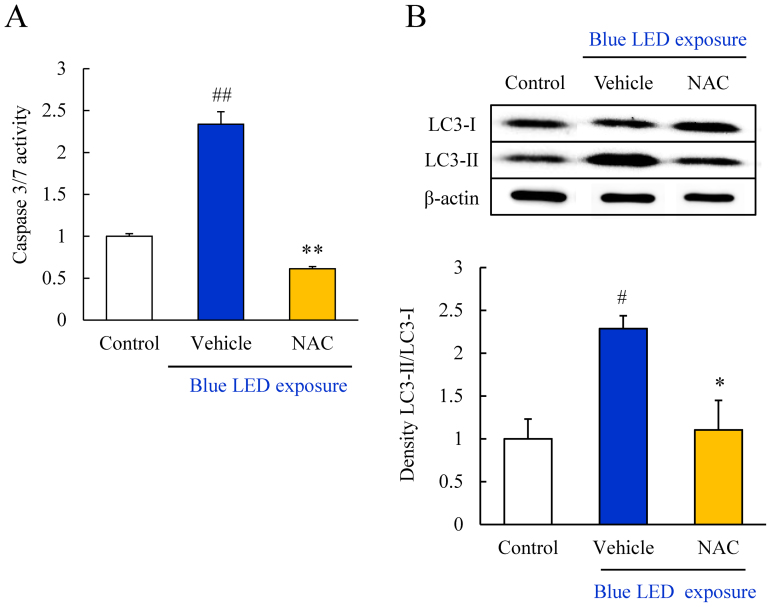
We evaluated the caspase-3/7 activity by using Caspase-Glo® 3/7 Assay kit. NAC significantly inhibited the increase in caspase-3/7 activity at 12 h after blue LED light exposure (Figure 7A). Moreover, blue LED light-induced changes in the expression of an autophagosome marker, LC3, were evaluated by western blotting. Activation of autophagy is indicated by the conversion of LC3-I into LC3-II. LC3-II was markedly upregulated by blue LED light exposure; however, the conversion of LC3 was significantly decreased by treatment with 1 mM NAC (Figure 7B).
Figure 7. NAC suppressed blue LED light-induced caspase-3/7 activation and autophagy activation.
(A) Measurement of caspase-3/7 activity by Caspase-Glo® 3/7 Assay kit. Activation of caspase-3/7 was observed after blue LED light exposure. NAC treatment significantly inhibited the activation. Data are expressed as mean ± SEM (n = 3 or 4). ** indicates p < 0.01 vs. vehicle; ## indicates p < 0.01 vs. control (one-way ANOVA followed by Tukey's test). (B) Western blots of LC3-II/LC3-I indicated an increase in the expression level after blue LED light exposure. NAC treatment significantly reduced the expression. Data are expressed as mean ± SEM (n = 6). * indicates p < 0.05 vs. vehicle; ## indicates p < 0.01 vs. control (one-way ANOVA followed by Tukey's test). The cropped blots are used in this Figure and the full-length blots are presented in Supplementary Figure S9.
Discussion
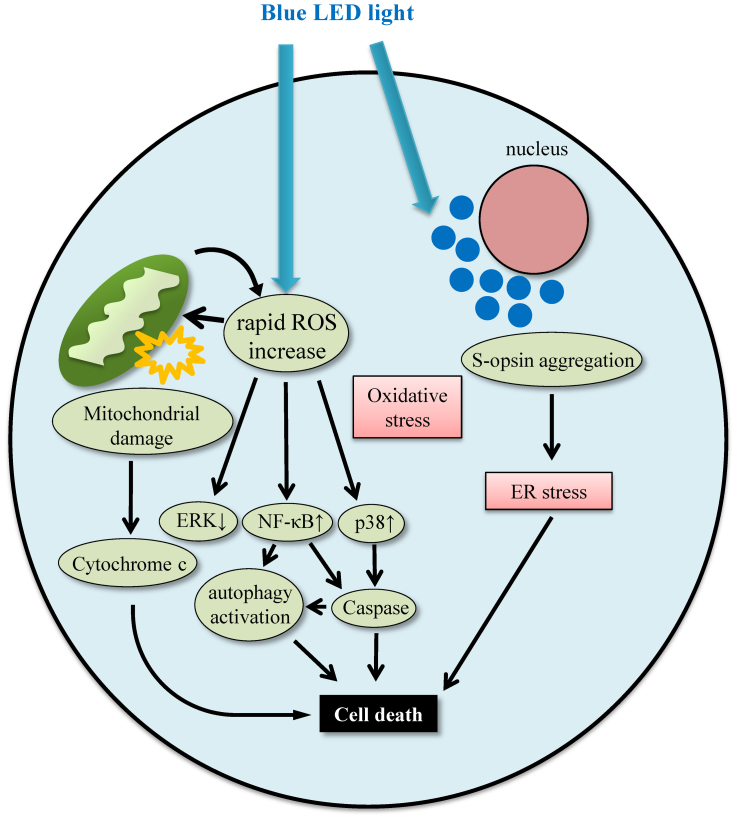
In the present study, we demonstrated that the in vitro exposure to blue LED light damaged the 661 W cells more severely compared to white or green LED light. In primary retinal cell culture, blue LED light damaged retinal photoreceptor cells. Blue LED light-induced 661 W cell damage was associated with rapid ROS increase, NF-κB activation, p38 activation, ERK 1/2 inactivation, S-opsin aggregation, and activated caspase-3/7 and autophagy (Figure 8).
Figure 8. The putative pathway of blue LED light-induced retinal photoreceptor-derived cell damage.
In 661 W cells, blue LED light induces ROS production and S-opsin aggregation. The rapid ROS increase leads to mitochondrial damage and the MAPK activation or the nuclear translocation of NF-κB. Activated MAPK and NF-κB induces the activation of caspase and leads to apoptotic cell death. Active NF-κB also activates autophagy, and excessive autophagy leads to cell death. While, S-opsin aggregation causes endoplasmic reticulum (ER) stress. Blue LED light-induced retinal photoreceptor-derived cell death may be associated with both oxidative stress and ER stress.
Although the effect of blue LED light in altering the circadian rhythm has been reported26, the retinal photoreceptor cell damage induced by blue LED light is not fully understood. Compared to three types of colored LED light, blue LED light damaged the photoreceptor-derived cells the more severely than white and green LED lights. It is known that blue light has a shorter wavelength, while green light has a longer wavelength. It has been reported that ROS levels are more increased by shorter wavelength light than by longer wavelength light exposure27. Furthermore, in RPE, the association between blue light-induced ROS increase and mitochondria has been reported28. This is thought that mitochondria include blue light-sensitive chromophore. In addition to this significance, photoreceptor cells possess S-opsin and S-opsin absorbs the short wavelength light. We observed the S-opsin aggregation by blue LED light exposure (Figure 4A–C). The S-opsin aggregates could cause the ROS increase. The photoreceptor cell death may be associated with the oxidative stress induced by ROS generation. In the present study, ROS production by blue LED light exposure for 24 h was greater than that induced by white and green LED lights exposure for 24 h. Also, green LED light did not induce the cell damage, although green LED light increased the ROS level in 24 h exposure. This may be due to the mild increase of ROS production over 24 h of green LED light exposure. ROS production by blue, white and green LED light exposure for 6 h increased each 1.4-fold, 1.2-fold and 1.0-fold (not changed) compared to control (Figure 2A–C). These findings indicate that 661 W cell damage is induced by the ROS generated by short wavelength LED light. Moreover, it was suggested that rapid ROS increase caused the decrease of the mitochondrial membrane potential. Although this result is consistent with in an in vivo light-induced retinal degeneration model22, it is considerable because this result is obtained in vitro study. The ratio of mitochondrial membrane potential decreased cells was about 12% and it seemed to be not correlated with the result of cell viability (Figure 2E, 1C). However, the cells exposed to blue LED light for 24 h were not stained PI. The cells were stained PI when the cells were exposed to blue LED light for 24 h and incubated for 12 h. The percent of PI positive cells per total cells was about 10% (Figure 6C). From the above, the cells were not completely dead in blue LED light for 24 h. Most of the cells might be in an early apoptotic state and decreased the viability. We observed the 12% of cells which have mitochondria with a high and low membrane potential and this ratio was correlated with the ratio of PI positive cells in 12 h after blue LED light exposure. Moreover, we observed the aggregation of S-opsin by blue and white LED light exposure. The perinuclear aggregates lead to the photoreceptor cell death, and the cell death is associated with ER stress16,17. The percent of S-opsin aggregated cells was about 9%, and it was thought that this ratio was correlated with 10% of PI positive cells in 12 h after blue LED light exposure (Figure 6C). These findings indicate that the short wavelength LED light can cause the cone photoreceptor-derived cell death by both oxidative stress induced by rapid ROS increase and ER stress induced by the aggregation of S-opsin. In present study, blue LED light exposure decreased by 60% of cell viability and induced 1.6-fold increase of ROS production in primary retinal cells (Figure 5A, B). This result was different from the result of 661 W cells. This difference was due to containing the cells except photoreceptor cells in the primary retinal cells, and it was thought that blue LED light damaged only photoreceptor cells. The consideration reflected the increase of cleaved caspase-3 positive cells in S-opsin positive cells. However, about half of cleaved caspase-3 positive cells were not stained S-opsin. It is thought that rhodopsin absorves approximately 500 nm wavelength light, and it was reported blue light-induced retinal damage was mediated rhodopsin1. Hence, cleaved caspase-3 positive cells but not positive S-opsin were supposed to be rod photoreceptor cells.
NAC improved the cell viability decreased by blue LED light exposure, and also reduced the rate of blue LED light-induced cell death. NAC dramatically suppressed the ROS generation. Oxidative stress induced by ROS generation facilitates photoreceptor cell damage following light exposure. In a previous report, NAC prevented the increase in the number of 8-hydroxydeoxyguanosine (8OHdG: an oxidative stress marker)-positive cells induced by light exposure and rescued retinal function29. These findings suggest that NAC confers protection against blue light-induced cell damage by inhibiting the increase in ROS generation.
In the present study, the activation of NF-κB, p38 MAPK, and ERK preceded the photoreceptor cell damage by blue LED light. Tumor necrosis factor α (TNF-α) and phorbol-12-myristate 13-acetate (PMA) induced NF-κB activation occur through ROS generation, and NAC suppressed this activation30. The nuclear translocation of NF-κB promotes apoptosis31. Thus, it is presumed that the blue LED light-induced ROS production promotes NF-κB phosphorylation and subsequent the nuclear translocation of NF-κB, leading to photoreceptor cell death. Similar results were obtained in another study29,32. In this study, NAC suppressed the NF-κB phosphorylation and the ROS generation induced by blue LED light in 661 W photoreceptor cells. Taken together, it can be suggested that NAC inhibited the blue light-induced photoreceptor damage through suppression of NF-κB phosphorylation and nuclear translocation and ROS generation. p38 MAPK was also activated by blue LED light. This is considered to be an apoptotic factor, and in oxidative stress, its activation is mainly occurs by superoxide anion33. NAC is known to scavenge the hydroxyl radical and hydrogen peroxide, but not superoxide anion33. Moreover, it is reported that tempol, a free radical scavenger, removes the superoxide anion and inhibits p38 MAPK more strongly than NAC34,35. Thus, NAC might not inhibit the p38 MAPK activation induced by blue LED light. However, further studies will be needed to reveal the roles of p38 MAPK in photoreceptor cells. In our study, ERK 1/2 was downregulated by blue LED light exposure, and NAC did not attenuate the changes in the expression level. ERK has both a prosurvival and proapoptotic activity36,37. ERK is fundamentally considered a regulator of cell proliferation, and is downregulated by oxidative stress38,39. These findings suggest that the protective effect of NAC on the retinal photoreceptor-derived cells was not through the ERK pathway.
In the present study, blue LED light-induced cell death activated caspase-3/7 and autophagy. It has been reported that caspase-3/7 is involved in the photoreceptor cell death induced by light exposure40. The damage induced by light exposure reduces the mitochondrial membrane potential22,41. We investigated the extent of cell damage using CCK-8 assay, which reflects the mitochondrial function. Also, in our JC-1 study, we observed blue LED light caused the mitochondrial damage. Caspase-3 is activated via the release of cytochrome c from the mitochondria42. Thus, it is thought that blue LED light-induced caspase-3/7 activation is due to the disruption of the mitochondrial membrane potential. On the other hand, autophagy is generally a self-clearance mechanism, that favors cell survival43, while excessive autophagy can induce cell death44,45. Moreover, NF-κB regulates the transcription of Beclin 1, which has a role in autophagy, and promotes this process46. Active caspase-3 facilitates in the cleavage of Beclin 1 and leads to autophagy47,48. It has been reported that oxidative stress induces autophagy49, and LC3 conversion, from LC3-I into LC3-II, is influenced by light-induced photoreceptor cell damage50. Therefore, NAC might suppress cell death by inhibiting the initiation of autophagy by scavenging the ROS generated by blue LED light exposure. These findings suggest that blue LED light activates caspases and autophagy, which are the downstream events of NF-κB activation.
In conclusion, the present findings suggest that the blue LED light can damage the retinal cone photoreceptor cells severely. Antioxidants could potentially be used to improve the retinal photoreceptor cell damage induced by blue LED light.
Author Contributions
Y.K., K.O., K.T., M.S. and H.H. conceived and designed the experiments. Y.K. and K.O. performed the analysis and the experiments. Y.K., M.S. and H.H. wrote the paper. All authors reviewed the manuscript.
Supplementary Material
Supplementary info
References
- Grimm C. et al. Rhodopsin-mediated blue-light damage to the rat retina: effect of photoreversal of bleaching. Invest Ophthalmol Vis Sci 42, 497–505 (2001). [PubMed] [Google Scholar]
- Roehlecke C., Schumann U., Ader M., Knels L. & Funk R. H. Influence of blue light on photoreceptors in a live retinal explant system. Mol Vis 17, 876–84 (2011). [PMC free article] [PubMed] [Google Scholar]
- Bok D. New insights and new approaches toward the study of age-related macular degeneration. Proc Natl Acad Sci U S A 99, 14619–21 (2002). [DOI] [PMC free article] [PubMed] [Google Scholar]
- Shahinfar S., Edward D. P. & Tso M. O. A pathologic study of photoreceptor cell death in retinal photic injury. Curr Eye Res 10, 47–59 (1991). [DOI] [PubMed] [Google Scholar]
- Beatty S., Koh H., Phil M., Henson D. & Boulton M. The role of oxidative stress in the pathogenesis of age-related macular degeneration. Surv Ophthalmol 45, 115–34 (2000). [DOI] [PubMed] [Google Scholar]
- Jarrett S. G. & Boulton M. E. Consequences of oxidative stress in age-related macular degeneration. Mol Aspects Med 33, 399–417 (2012). [DOI] [PMC free article] [PubMed] [Google Scholar]
- Liang F. Q. & Godley B. F. Oxidative stress-induced mitochondrial DNA damage in human retinal pigment epithelial cells: a possible mechanism for RPE aging and age-related macular degeneration. Exp Eye Res 76, 397–403 (2003). [DOI] [PubMed] [Google Scholar]
- Ishibashi T., Sorgente N., Patterson R. & Ryan S. J. Pathogenesis of drusen in the primate. Invest Ophthalmol Vis Sci 27, 184–93 (1986). [PubMed] [Google Scholar]
- Wassell J., Davies S., Bardsley W. & Boulton M. The photoreactivity of the retinal age pigment lipofuscin. J Biol Chem 274, 23828–32 (1999). [DOI] [PubMed] [Google Scholar]
- Suter M. et al. Age-related macular degeneration. The lipofusion component N-retinyl-N-retinylidene ethanolamine detaches proapoptotic proteins from mitochondria and induces apoptosis in mammalian retinal pigment epithelial cells. J Biol Chem 275, 39625–30 (2000). [DOI] [PubMed] [Google Scholar]
- Crabb J. W. et al. Drusen proteome analysis: an approach to the etiology of age-related macular degeneration. Proc Natl Acad Sci U S A 99, 14682–7 (2002). [DOI] [PMC free article] [PubMed] [Google Scholar]
- Dunaief J. L., Dentchev T., Ying G. S. & Milam A. H. The role of apoptosis in age-related macular degeneration. Arch Ophthalmol 120, 1435–42 (2002). [DOI] [PubMed] [Google Scholar]
- Luthra S. et al. Activation of caspase-8 and caspase-12 pathways by 7-ketocholesterol in human retinal pigment epithelial cells. Invest Ophthalmol Vis Sci 47, 5569–75 (2006). [DOI] [PubMed] [Google Scholar]
- Williams T. P. Photoreversal of Rhodopsin Bleaching. J Gen Physiol 47, 679–89 (1964). [DOI] [PMC free article] [PubMed] [Google Scholar]
- Grimm C., Reme C. E., Rol P. O. & Williams T. P. Blue light's effects on rhodopsin: photoreversal of bleaching in living rat eyes. Invest Ophthalmol Vis Sci 41, 3984–90 (2000). [PubMed] [Google Scholar]
- Zhang T., Zhang N., Baehr W. & Fu Y. Cone opsin determines the time course of cone photoreceptor degeneration in Leber congenital amaurosis. Proc Natl Acad Sci U S A 108, 8879–84 (2011). [DOI] [PMC free article] [PubMed] [Google Scholar]
- Nakanishi T. et al. Role of endoplasmic reticulum stress in light-induced photoreceptor degeneration in mice. J Neurochem 125, 111–24 (2013). [DOI] [PubMed] [Google Scholar]
- Santos A. M. et al. Sortilin participates in light-dependent photoreceptor degeneration in vivo. PLoS One 7, e36243 (2012). [DOI] [PMC free article] [PubMed] [Google Scholar]
- Yang L. P., Zhu X. A. & Tso M. O. Role of NF-kappaB and MAPKs in light-induced photoreceptor apoptosis. Invest Ophthalmol Vis Sci 48, 4766–76 (2007). [DOI] [PubMed] [Google Scholar]
- Tsuruma K., Tanaka Y., Shimazawa M., Mashima Y. & Hara H. Unoprostone reduces oxidative stress- and light-induced retinal cell death, and phagocytotic dysfunction, by activating BK channels. Mol Vis 17, 3556–65 (2011). [PMC free article] [PubMed] [Google Scholar]
- Tsuruma K. et al. Role of oxidative stress in retinal photoreceptor cell death in N-methyl-N-nitrosourea-treated mice. J Pharmacol Sci 118, 351–62 (2012). [DOI] [PubMed] [Google Scholar]
- Donovan M., Carmody R. J. & Cotter T. G. Light-induced photoreceptor apoptosis in vivo requires neuronal nitric-oxide synthase and guanylate cyclase activity and is caspase-3-independent. J Biol Chem 276, 23000–8 (2001). [DOI] [PubMed] [Google Scholar]
- Junttila M. R., Li S. P. & Westermarck J. Phosphatase-mediated crosstalk between MAPK signaling pathways in the regulation of cell survival. Faseb J 22, 954–65 (2008). [DOI] [PubMed] [Google Scholar]
- Sun M. H. et al. Photoreceptor protection against light damage by AAV-mediated overexpression of heme oxygenase-1. Invest Ophthalmol Vis Sci 48, 5699–707 (2007). [DOI] [PubMed] [Google Scholar]
- Tang P. H., Buhusi M. C., Ma J. X. & Crouch R. K. RPE65 is present in human green/red cones and promotes photopigment regeneration in an in vitro cone cell model. J Neurosci 31, 18618–26 (2011). [DOI] [PMC free article] [PubMed] [Google Scholar]
- Wright H. R., Lack L. C. & Partridge K. J. Light emitting diodes can be used to phase delay the melatonin rhythm. J Pineal Res 31, 350–5 (2001). [DOI] [PubMed] [Google Scholar]
- Rozanowska M. et al. Blue light-induced singlet oxygen generation by retinal lipofuscin in non-polar media. Free Radic Biol Med 24, 1107–12 (1998). [DOI] [PubMed] [Google Scholar]
- Godley B. F. et al. Blue light induces mitochondrial DNA damage and free radical production in epithelial cells. J Biol Chem 280, 21061–6 (2005). [DOI] [PubMed] [Google Scholar]
- Tanito M. et al. Change of redox status and modulation by thiol replenishment in retinal photooxidative damage. Invest Ophthalmol Vis Sci 43, 2392–400 (2002). [PubMed] [Google Scholar]
- Staal F. J., Roederer M., Herzenberg L. A. & Herzenberg L. A. Intracellular thiols regulate activation of nuclear factor kappa B and transcription of human immunodeficiency virus. Proc Natl Acad Sci U S A 87, 9943–7 (1990). [DOI] [PMC free article] [PubMed] [Google Scholar]
- Khandelwal N. et al. Nucleolar NF-kappaB/RelA mediates apoptosis by causing cytoplasmic relocalization of nucleophosmin. Cell Death Differ 18, 1889–903 (2011). [DOI] [PMC free article] [PubMed] [Google Scholar]
- Wu T., Chen Y., Chiang S. K. & Tso M. O. NF-kappaB activation in light-induced retinal degeneration in a mouse model. Invest Ophthalmol Vis Sci 43, 2834–40 (2002). [PubMed] [Google Scholar]
- Aruoma O. I., Halliwell B., Hoey B. M. & Butler J. The antioxidant action of N-acetylcysteine: its reaction with hydrogen peroxide, hydroxyl radical, superoxide, and hypochlorous acid. Free Radic Biol Med 6, 593–7 (1989). [DOI] [PubMed] [Google Scholar]
- McDonald M. C., Zacharowski K., Bowes J., Cuzzocrea S. & Thiemermann C. Tempol reduces infarct size in rodent models of regional myocardial ischemia and reperfusion. Free Radic Biol Med 27, 493–503 (1999). [DOI] [PubMed] [Google Scholar]
- Jia Y. T. et al. Activation of p38 MAPK by reactive oxygen species is essential in a rat model of stress-induced gastric mucosal injury. J Immunol 179, 7808–19 (2007). [DOI] [PubMed] [Google Scholar]
- Cheung E. C. & Slack R. S. Emerging role for ERK as a key regulator of neuronal apoptosis. Sci STKE 2004, PE45 (2004). [DOI] [PubMed] [Google Scholar]
- Luo Y. & DeFranco D. B. Opposing roles for ERK1/2 in neuronal oxidative toxicity: distinct mechanisms of ERK1/2 action at early versus late phases of oxidative stress. J Biol Chem 281, 16436–42 (2006). [DOI] [PubMed] [Google Scholar]
- Li G. Y., Li T., Fan B., Zheng Y. C. & Ma T. H. The D(1) dopamine receptor agonist, SKF83959, attenuates hydrogen peroxide-induced injury in RGC-5 cells involving the extracellular signal-regulated kinase/p38 pathways. Mol Vis 18, 2882–95 (2011). [PMC free article] [PubMed] [Google Scholar]
- Nakata K. et al. Deficiency of SHP1 leads to sustained and increased ERK activation in mast cells, thereby inhibiting IL-3-dependent proliferation and cell death. Mol Immunol 48, 472–80 (2011). [DOI] [PubMed] [Google Scholar]
- Wu J., Gorman A., Zhou X., Sandra C. & Chen E. Involvement of caspase-3 in photoreceptor cell apoptosis induced by in vivo blue light exposure. Invest Ophthalmol Vis Sci 43, 3349–54 (2002). [PubMed] [Google Scholar]
- van de Water B., Zoeteweij J. P., de Bont H. J., Mulder G. J. & Nagelkerke J. F. Role of mitochondrial Ca2+ in the oxidative stress-induced dissipation of the mitochondrial membrane potential. Studies in isolated proximal tubular cells using the nephrotoxin 1,2-dichlorovinyl-L-cysteine. J Biol Chem 269, 14546–52 (1994). [PubMed] [Google Scholar]
- Li Z. et al. Caspase-3 activation via mitochondria is required for long-term depression and AMPA receptor internalization. Cell 141, 859–71 (2010). [DOI] [PMC free article] [PubMed] [Google Scholar]
- Levine B. & Yuan J. Autophagy in cell death: an innocent convict? J Clin Invest 115, 2679–88 (2005). [DOI] [PMC free article] [PubMed] [Google Scholar]
- Pattingre S. et al. Bcl-2 antiapoptotic proteins inhibit Beclin 1-dependent autophagy. Cell 122, 927–39 (2005). [DOI] [PubMed] [Google Scholar]
- Yu L., Strandberg L. & Lenardo M. J. The selectivity of autophagy and its role in cell death and survival. Autophagy 4, 567–73 (2008). [DOI] [PubMed] [Google Scholar]
- Copetti T., Bertoli C., Dalla E., Demarchi F. & Schneider C. p65/RelA modulates BECN1 transcription and autophagy. Mol Cell Biol 29, 2594–608 (2009). [DOI] [PMC free article] [PubMed] [Google Scholar]
- Kang R., Zeh H. J., Lotze M. T. & Tang D. The Beclin 1 network regulates autophagy and apoptosis. Cell Death Differ 18, 571–80 (2011). [DOI] [PMC free article] [PubMed] [Google Scholar]
- Tiwari M., Lopez-Cruzan M., Morgan W. W. & Herman B. Loss of caspase-2-dependent apoptosis induces autophagy after mitochondrial oxidative stress in primary cultures of young adult cortical neurons. J Biol Chem 286, 8493–506 (2011). [DOI] [PMC free article] [PubMed] [Google Scholar]
- Scherz-Shouval R. et al. Reactive oxygen species are essential for autophagy and specifically regulate the activity of Atg4. Embo J 26, 1749–60 (2007). [DOI] [PMC free article] [PubMed] [Google Scholar]
- Kunchithapautham K., Coughlin B., Lemasters J. J. & Rohrer B. Differential effects of rapamycin on rods and cones during light-induced stress in albino mice. Invest Ophthalmol Vis Sci 52, 2967–75 (2011). [DOI] [PMC free article] [PubMed] [Google Scholar]
Associated Data
This section collects any data citations, data availability statements, or supplementary materials included in this article.
Supplementary Materials
Supplementary info


