Abstract
Oat kernels were extracted with methanol, and glycolipid-enriched fractions were prepared using silica solid phase extraction. Using direct infusion electrospray ionization (ESI) tandem mass spectrometry (MS), high performance liquid chromatography (HPLC)-ESI-MS, and HPLC-atmospheric pressure chemical ionization (APCI)-MS, we confirmed previous reports that digalactosyldiacylglycerol (DGDG) was the most abundant glycolipid in oat kernels and confirmed a previous report of the presence of a DGDG mono-estolide in oat kernels. In the current study we also identified several additional natural galactolipid estolides: two new DGDG estolides (di- and tri-estolides), two trigalactosyldiacylglycerol (TriGDG) estolides (mono- and di-estolides), and one tetragalactosyldiacylglycerol (TetraGDG) estolide (monoestolide). The levels of total galactolipid estolides in oat kernels were estimated to be about 29% of the total glycolipid fraction. To our knowledge, this report is the first evidence of natural diand tri-estolides of polar lipids.
Keywords: oat kernels, estolides, digalactosyldiacylglycerol, trigalactosyldiacylglycerol, tetragalactosyldiacylglycerol, galactolipid, mass spectrometry
INTRODUCTION
Although the major lipid components of most biological membranes are phospholipids, the most abundant lipids of plant chloroplasts are the galactolipids, MGDG and DGDG [1]. In addition to their occurrence in chloroplasts, MGDG and DGDG have been observed in significant levels in oat kernels and other seeds [2]. Smaller amounts of two other galactolipids have also been detected in some plant tissues; TriGDG has been reported in wheat [3], potatoes [4], rice [5], Adzuki beans [6], and pumpkin [5,7,8]; TetraGDG has been reported in rice [5].
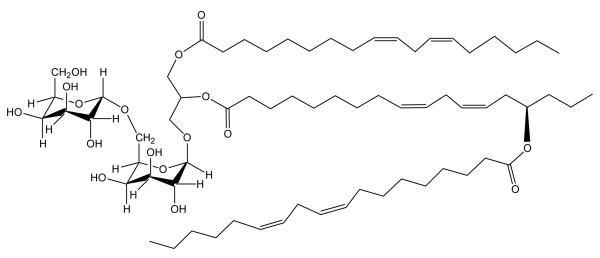
Hamberg et al. [9] previously reported that oat kernels contain significant amounts of an unusual hydroxy fatty acid, 15(R)–hydroxylinoleic acid (avenoleic acid), and later [10] described an unusual galactolipid in oat kernels (Figure 1), containing this fatty acid. The galactolipid was a DGDG with 15(R)–hydroxylinoleic acid esterified to the sn-2 position of the glycerol and a third fatty acid esterified to the free OH on the hydroxy fatty acid (Figure 1). This “acyl-DGDG” is a natural estolide. An estolide is formed when a hydroxy fatty acid is esterified to another fatty acid [11]. Natural estolides are rare, but natural triacylglycerol estolides have been described in the seed oils of three species of Sebastiana [11,12,13], in ergot oil [14], in Lesquerella oil [15], and more recently, in castor oil [16]. Synthetic estolides have been prepared from common vegetable oils [17] and from oils that contain hydroxy fatty acids such as those in Lesquerella and castor oil [18]. The current study employs HPLC-MS and direct infusion ESI-MS/MS to characterize additional unusual glycolipids in oat kernels and oat oil.
Figure 1.
The structure of the DGDG mono-estolide (DGDG 54:6) reported by Hamberg et al. [10]. Exact mass (C69H118O17), 1218.8369 Da; average mass, 1219.69 Da; m/z of [M+NH4]+ (C69H122O17N), 1236.8707.
MATERIALS AND METHODS
Materials
Oats (Avena sativa L., cv Morton) were grown in the field in Fargo, North Dakota. DGDG for HPLC standardization was purchased from Matreya, Inc., Pleasant Gap, PA.
Extraction of lipids
Oat grain was dehulled with a Codema (Codema, Inc., Eden Prairie, MN) compressed air oat dehuller. Oat groats (caryopses) were steamed with a vegetable steamer for 20 min to inactivate hydrolytic enzymes. Enzyme-inactivated groats were ground with a Retsch (Haan, Germany) Z-200 centrifugal mill with a 0.5 mm collar screen. For polar lipid extraction, a sample of 10 g of flour was extracted in 50 ml of methanol in a 150 ml Corex (Corning, New York) centrifuge bottle. Solvent and flour were mixed thoroughly by vortexing and shaking the sealed bottle by hand. The bottle was centrifuged at 1500 x g for 15 min to pellet particulates, and the supernatant was removed. The pellet was suspended in 20 ml methanol and shaken vigorously by hand to extract a second time. The bottle was centrifuged as before and the supernatant pooled with the first supernatant. About 15 g of sodium sulfate were added to the extract to remove traces of water, and the extract was filtered through Whatman (Middlesex, UK) #1 filter paper. Solvent was reduced to about 15 ml with a rotary evaporator, using an aspirator to draw a vacuum, with a water bath temperature of 42°C. The remaining extract was divided into three tubes and evaporated to dryness under nitrogen, on a block evaporator at 48°C. Samples were stored under nitrogen at −80°C until further fractionation.
Glycolipid fractionation via solid phase extraction
Crude oat oil extracts (80-200 mg) were dissolved in chloroform/methanol (9:1, by vol). A silica SPE column (10 g silica in a 75 ml column) was equilibrated with chloroform, and the crude extract was applied to the column. Neutral lipids were eluted with 100 ml chloroform/acetone (4:1, by vol). Glycolipids were eluted with 100 ml acetone/methanol (9:1, by vol), and phospholipids were eluted with 100 ml methanol [19]. Solvent was removed by a rotary evaporator under the conditions described above. Several ml of acetone/methanol (9:1, by vol) were added to each flask, and several grams of sodium sulfate were added to remove moisture. Solvent was removed by pipette and several more ml of solvent added to the flask and mixed before the solvent was removed and pooled with the first aliquot of solvent. The combined aliquots were filtered with Whatman #541 filter paper and evaporated to dryness under nitrogen, on a block evaporator at 48°C.
Subfractions enriched in the putative Tri- and TetraGDG were generated. Thirty to one hundred milligrams of the total glycolipid fraction (eluted with acetone/methanol (9:1, by vol) as described above) were loaded onto a silica SPE column equilibrated with chloroform. Subfraction 1 was eluted with 100 ml of chloroform/acetone (1:1, by vol). Subfraction 2, which contained primarily DGDG and its estolides, was eluted with 100 ml chloroform/acetone (1:4, by vol). Subfraction 3, which was enriched in TriGDG and TetraGDG, was eluted with acetone/methanol (9:1, by vol). Solvents were evaporated with a rotary evaporator, and samples were stored dry under nitrogen at −80°C.
ESI-MS/MS
An aliquot of the oat total glycolipid SPE fraction in chloroform was combined with solvents, such that the ratio of chloroform/methanol/300 mM ammonium acetate in water was 300:665:35 (by vol) and the final volume was 1 mL. This solution was introduced by continuous infusion into the ESI source on a triple quadrupole MS/MS (API 4000, Applied Biosystems, Foster City, CA), using an autosampler (LC Mini PAL, CTC Analytics AG, Zwingen, Switzerland) fitted with the required injection loop for the acquisition time, and presented to the ESI needle at 30 μl/min. The collision gas pressure was set at 1 (arbitrary units). The collision energy, with nitrogen in the collision cell, was 84 V. The declustering potential was 215 V, the entrance potential was 15 V, and the exit potential was 17 V. The mass analyzers were adjusted to a resolution of 0.7 Da full width at half height. For each spectrum, 9 to 150 continuum scans were averaged in multiple channel analyzer (MCA) mode. The source temperature (heated nebulizer) was 100°C, the interface heater was on, +5.5 kV or −4.5 kV was applied to the electrospray capillary, the curtain gas was set at 20 (arbitrary units), and the two ion source gases were set at 45 (arbitrary units). DGDG species were detected by neutral loss (NL) of “341” (digalactose – H – H2O + NH4+; NL setting, 341.13 Da) to identify the [M + NH4]+ ions of DGDG and DGMG, neutral loss of “503” (trigalactose – H – H2O + NH4+; NL setting, 503.18 Da) to identify the [M + NH4]+ ions of TriGDG and TriGMG, and neutral loss of “665” (tetragalactose – H – H2O + NH +4; NL setting, 665.24 Da) to identify the [M + NH4]+ ions of TetraGDG. Sequential neutral loss scans of the extracts produced a series of spectra with each spectrum revealing a class of lipid species containing a common head group fragment.
Multiple acyl precursor scanning in negative ion mode was combined with head group neutral loss ion scanning to identify and quantify DGDG species with specified individual acyl chains [20]. Briefly, scans of the head group (NL 341 in positive ion mode) and acyl anions (precursors of m/z 255.23, 277.22, 279.23, 281.25, 283.28, 295.23, 305.25, 307.26, and 309.28 in negative ion mode) were performed in the DGDG mass range (m/z 900-1050). The neutral loss of 341 scan (to identify the [M + NH4]+ ions of DGDG) was used to quantify the total amount of each galactolipid at each nominal mass in comparison to internal standards [DGDG 16:0/18:0 (0.49 nmol) and DGDG 18:0/18:0 (0.71 nmol)]. By integrating data from the acyl precursor scans with those from the neutral loss head group scan, individual molecular species (i.e. with both acyl chains identified) were quantified.
ESI-MS/MS product ion analysis
The structures of the galactolipid species were discerned by product ion analysis in the positive mode as [M + NH4]+ ions. The solvent was chloroform/methanol/300 mM ammonium acetate in water (300:665:35, by vol). The collision energy was 45 V.
Normal-phase HPLC, HPLC-APCI-MS, and HPLC-ESI-MS methods for lipid class analysis
Normal-phase (NP) polar lipid HPLC analyses were performed on a Hewlett Packard Model 1100 HPLC, with autosampler, and detected by both an HP Model 1100 diode-array UV-visible detector (Agilent Technologies, Avondale, PA) and a Sedex Model 55 ELSD (Richard Scientific, Novato, CA), operated at 40°C and a nitrogen gas pressure of 2 bars. The column was a LiChrosorb, 3 mm diameter and 100 mm length, 7 micron DIOL (Chrompack, Raritan, NJ). The ternary gradient had a constant flow rate of 0.5 ml/min, with solvent A = hexane/acetic acid (1000:1, by vol), solvent B = isopropanol, and solvent C = aqueous 50 mM ammonium formate. Gradient timetable: at 0 min, 90:10:0, by vol (%A / %B / %C); at 30 min, 58:38:2, by vol; at 40 min, 12:80:8, by vol; at 50 min, 12:80:8, by vol; at 51 min, 50:50:0, by vol; at 52 min, 90:10:0, by vol; and at 60 min, 90:10:0, by vol. Using this method, the retention times of the polar lipid standards were: MGDG, 10.5 min and DGDG, 20.5 min. For HPLC-APCI-MS, the column effluent was routed into an Agilent 1100 MSD mass spectrometer operated with APCI in the positive mode in the range of m/z 200-2000, with drying gas at 6.0 L/min, nebulizer pressure at 60 psi, drying gas temperature at 350°C, vaporizer gas temperature at 325°C, capillary voltage of 4000 V, corona current of 4.0 μA, and fragmentor at 80 V. For HPLC-ESI-MS, the column effluent was routed into an Agilent 1100 MSD mass spectrometer operated with ESI in the positive mode in the range of m/z 200-2000, with the fragmentor at 5 V, drying gas at 6 L/min, nebulizing pressure at 50 psi, drying gas temperature at 300°C, and a capillary voltage of 5500 V.
Reverse-phase HPLC and HPLC-ESI-MS method for lipid class analysis
For the reverse-phase (RP) analyses the HPLC, ELSD, and MS parameters were as described above. The column was a Prevail C18, 3 micron particle size (2.1 × 150 mm), from Alltech Associates, Northfield, IL. The binary gradient had a flow rate of 0.2 ml/min, with solvent A = methanol/water/ammonium formate (95:5:0.126, vol/vol/w), and solvent B = isopropanol. Gradient timetable: at 0 min, 100:0, by vol (%A / %B); at 5 min, 100:0, by vol; at 40 min, 60:40, by vol; at 45 min, 60:40, by vol; at 46 min, 100:0, by vol; and at 60 min, 100:0, by vol.
Lipid nomenclature and mass description
Lipid molecular species are described as “X y:z”, where X indicates the class of galactolipid, y indicates the total number of carbon atoms in the fatty acyl moieties, and z indicates the total number of carbon-carbon double bonds in the fatty acyl groups. For example, the DGDG mono-estolide previously reported [10] is abbreviated DGDG 54:6 because it is a DGDG with three 18-carbon fatty acids and a total of 6 double bonds. For clarification, nominal masses are provided in parentheses.
RESULTS AND DISCUSSION
Normal-phase HPLC-ELSD separation of the oat kernel glycolipids indicated the presence of multiple lipid classes
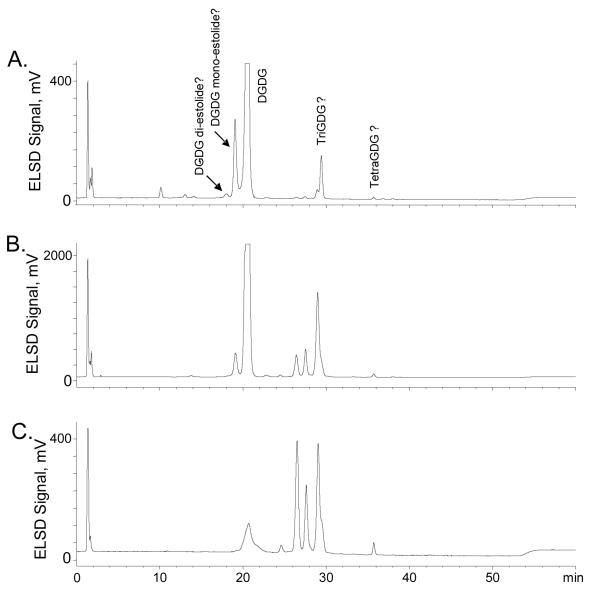
In our previous report on oat kernel lipids, the levels of DGDG and phospholipids were quantified using normal-phase HPLC with evaporative light scattering detection [2]. For the current study this HPLC method was modified by increasing the proportions of both isopropanol and water in the hexane/acetic acid/isopropanol/water system to potentially permit the separation of very polar glycolipids (Figure 2). As expected, DGDG (identified by co-chromatography with commercial DGDG standard) eluted at 20 min and was the major class of lipid detected in the total glycolipid fraction obtained by SPE (Figure 2a). A smaller peak eluting at 19 min was proposed to be the DGDG mono-estolide previously reported [10]. A very small peak eluted at 18 min; its retention time suggested that it may be a DGDG diestolide. Two other groups of peaks also appeared in the regions of 26-30 min and 35-39 min, and based on their retention times as compared with those determined in previous analyses of more polar glycolipids in other plants [3-8], their structures were postulated to be TriGDG and TetraGDG, respectively. NP-HPLC-ELSD analyses of two glycolipid subfractions, also prepared by SPE, indicated that subfraction 2 contained higher levels of the 26-30 min series of peaks (Figure 2b), and in subfraction 3, these unknown peaks in the region of 26-30 min were the major components (Figure 2c). The small putative TetraGDG peaks in the region of 35-39 min in the total glycolipid fraction (Figure 2a) were also present in glycolipid subfraction 2 (Figure 2b) and subfraction 3 (Figure 2c).
Figure 2.
NP-HPLC-ELSD chromatogram of the classes of lipids in: a) the oat total glycolipid fraction, b) oat glycolipid subfraction 2, and c) oat glycolipid subfraction 3.
Identification of DGDG, DGDG mono-estolide and DGDG di-estolide using normal-phase HPLC-APCI-MS
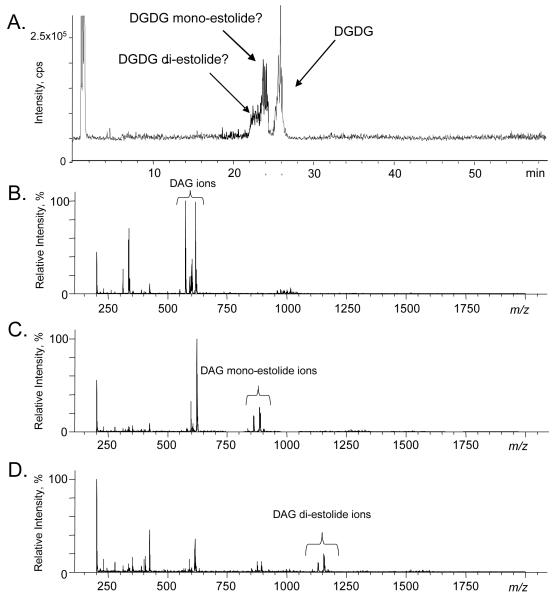
APCI-MS was employed previously for the structural characterization of DGDG and other glycolipids in red bell pepper [21]. In that study, the major ions observed were fragments attributed to loss of digalactose (i.e., protonated diacylglycerol (DAG)) and loss of digalactose and one fatty acid (i.e. protonated monoacylglycerol); the precursor DGDG ions were observed to be of low intensity. Using an NP-HPLC system similar to the one in the previous experiment, APCI-MS in the positive mode was used to obtain structural information about the three DGDG peaks identified in Figure 2a. In this experiment (Figure 3a), the HPLC conditions described in our previous report were used [2], and DGDG eluted at about 26 min, whereas it eluted at about 20 min under the conditions used in the analyses depicted in Figure 2. The major peaks in the APCI-MS spectrum of the putative DGDG peak (Figure 3b) were in the mass range consistent with DAG ions. The APCI-MS spectra of the putative mono-estolide (Figure 3c) and di-estolide DGDG (Figure 3d) species contained ions consistent with loss of digalactose from each species, leaving fragments consistent with protonated DAG mono- and diestolides, respectively. Thus, the APCI data (Figure 3) support the tentative identifications of the three peaks (Figure 2A), but stronger evidence was sought to confirm the identifications.
Figure 3.
NP-HPLC-APCI-MS to identify classes of glycolipids in the oat total glycolipid fraction. a) Total ion chromatogram (TIC) of the oat glycolipid fraction when separated in NPHPLC-APCI-MS in the positive ion mode, b) spectrum of the peak at 24.7 to 26.9 min in “a”, which has the same retention time as commercial DGDG, c) spectrum of the peak at 23.3 to 24.7 min in “a”, which is tentatively identified as DGDG mono-estolide (Figure 1), and d) spectrum of the peak at 21.8 to 23.3 min in “a”, which is tentatively identified as DGDG di-estolide.
ESI-MS/MS neutral loss scanning reveals digalactosyl acylglycerol molecular species
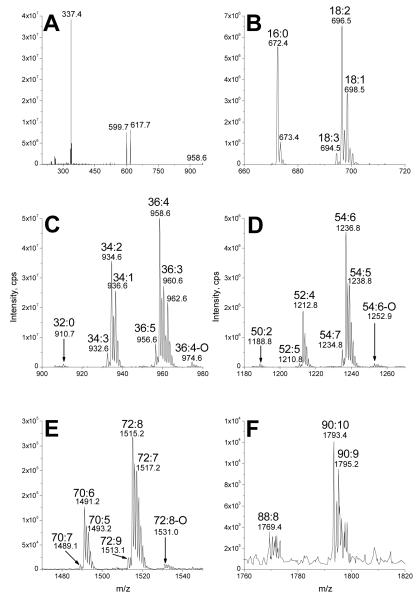
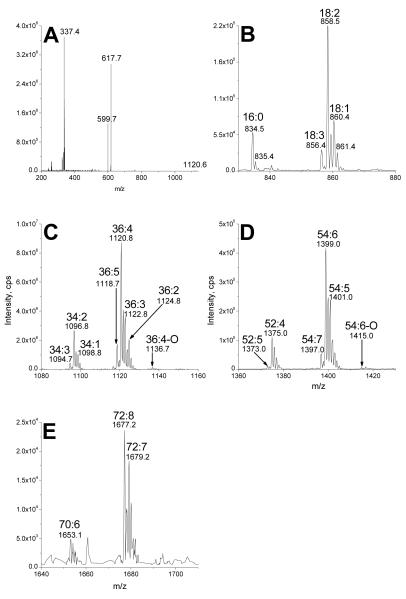
Precursor or neutral loss scanning by ESI-MS/MS can be utilized to identify the lipid species within a lipid class [22]. ESI-MS/MS is the main tool employed in the new field of “lipidomics” and has been employed to characterize the “lipidome” of humans, other animals, and plants [20,23-26]. Figure 4a shows that, in the positive mode, in solvent containing ammonium acetate, DGDG species underwent neutral loss of ammoniated digalactose minus H2O (NL 341; the neutral fragment is C12H23O10N) or ammoniated digalactose (NL 359; the neutral fragment is C12H25O11N). Specifically, the ammoniated precursor ion of DGDG 36:4 at m/z 958.6 (958) underwent neutral loss of 341 or 359 to produce the fragments observed at m/z 617.7 (617) and m/z 599.7 (599). (Loss of an “ammoniated digalactose minus H2O” is equivalent to the loss of the ammoniated digalactose with the bridging oxygen left behind as a glycerol hydroxyl group.)
Figure 4.
Fragmentation of DGDG and neutral loss scans identifying digalactosyl acylglycerol species in the oat glycolipid SPE fraction. a) Product ion spectrum of DGDG 36:4 [M + NH4]+ ion at m/z 958 (nominal mass). b through f: Scans of neutral loss of 341, showing b) DGMG species, c) DGDG species, d) DGDG mono-estolide species, e) DGDG di-estolide species, and f) DGDG tri-estolide species.
In this product ion spectrum, the peak at m/z 337.4 (337) was a protonated 18:2 esterified to glycerol minus H2O (C21H37O3), indicating that the major molecular species of DGDG 36:4 was DGDG 18:2/18:2. Small peaks at m/z 335 (nominal) and m/z 339 (nominal) correspond to analogous acylglycerol fragments, indicating that DGDG 36:4 contained a smaller amount of DGDG 18:3/18:1.
To elucidate the varied digalactosyl acylglycerol species in the glycolipid SPE extract, NL 341 scans were utilized (Figure 4b-f). These spectra depict the molecular species of DGDG and provide the total number of acyl carbons: total number of carbon-carbon double bonds. Figure 4b shows the NL 341 scan in the mass range corresponding to DGMG species; these peaks represent species with only one acyl moiety per molecule. To identify the individual acyl chains associated with the non-estolide DGDG class, as depicted in Figure 4c, multiple acyl precursor scanning in the negative ion mode [20], in combination with quantitative analysis of the DGDG class via the NL 341 scan in the positive mode, was carried out (Table 1). Hydrogenated DGDG species were used as internal standards. The data indicate that two DGDG species, 16:0/18:2 and 18:2/18:2 accounted for over half of the DGDG. A little over 1% of the DGDG (non-estolide) species contained 18:2-OH, consistent with the presence of 15(R)-hydroxylinoleic acid (avenoleic acid) [9,10].
Table 1.
The fatty acyl combinations that make up the DGDG species were identified by multiple acyl precursor scanning in negative ion mode, in combination with neutral loss head group scanning in positive ion mode.
| DGDG Species | % of Total DGDG |
Acyl species |
|---|---|---|
| DGDG 32:0 | 0.7 | 16:0/16:0 |
| DGDG 34:3 | 3.2 | 16:0/18:3 (79%) > 16:1/18:2 |
| DGDG 34:2 | 26.3 | 16:0/18:2 (99+%) > 16:1/18:1 |
| DGDG 34:1 | 10.3 | 16:0/18:1 (99+%) > 16:1/18:0 |
| DGDG 36:6 | 0.6 | 18:3/18:3 |
| DGDG 36:5 | 4.8 | 18:3/18:2 |
| DGDG 36:4 | 31.7 | 18:2/18:2 (94%) > 18:3/18:1 > 16:1/20:3 |
| DGDG 36:3 | 9.6 | 18:2/18:1 (97%) > 16:0/20:3 > 18:3/18:0 > 16:1/20:2 |
| DGDG 36:2 | 8.8 | 18:1/18:1 (79%) > 18:2/18:0 (21%) > 16:0/20:2 |
| DGDG 36:1 | 0.8 | 18:1/18:0 (96%) > 16:0/20:1 |
| DGDG 36:5-OH | 0.1 | 18:3/18:2-OH (51%) |
| DGDG 36:4-OH | 1.0 | 18:2/18:2-OH (97%) |
| DGDG 36:3-OH | 0.2 | 18:1/18:2-OH (91%) |
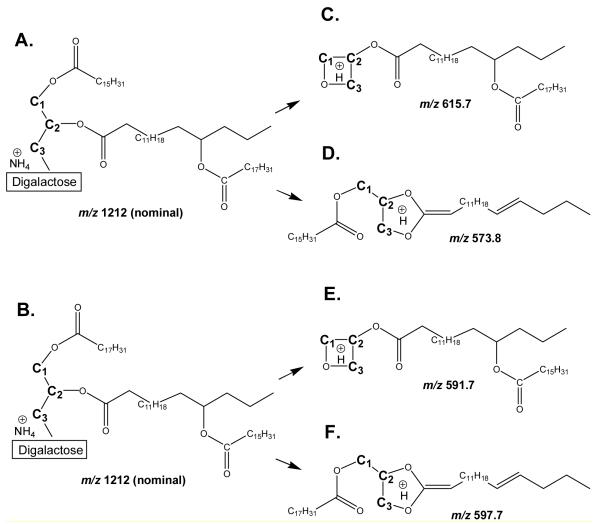
Figures 4d through 4f show that NL 341 scanning of the glycolipid SPE extract produced mass spectral peaks consistent with the identification of mono-, di-, and tri-estolides, respectively. Product ion spectra of specific mono-, di-, and tri-estolides of DGDG also were consistent with these identifications. The spectra suggest that some estolides are made up of multiple isomeric species. Figure 5 shows the product ion spectrum of the compound tentatively identified as DGDG 52:4, a DGDG mono-estolide species containing the fatty acids 18:2, 16:0 and 18:2-OH. The ammoniated DGDG 52:4 [M + NH4]+ ion at m/z 1212 (nominal, not visible in figure) underwent neutral loss to m/z 871.9 (871) or 853.8 (853). These species are likely to be due to loss of an ammoniated digalactose minus H2O (C12H23O10N; 341 Da) or an ammoniated digalactose (C12H25O11N; 359 Da). The low abundance peak observed at m/z 871.9 (871) is likely to represent a protonated diacylglycerol mono-estolide containing the fatty acids 18:2, 16:0, and 18:2-OH. The more abundant fragment at m/z 853.8 (853) is likely to depict a conventional diacylglycerol-like fragment that lost the bridging oxygen during collision induced dissociation (CID) [27,28]. The peaks observed at m/z 615.7 (615) and 597.7 (597) contain glycerol, one 18:2-OH, and one 18:2 fatty acid; the 16:0 fatty acid has been lost. These two peaks differ only in the amount of dehydration (1 dehydration for 615; 2 for 597). The peaks at m/z 591.7 (591) and 573.8 (573) likely represent fragments with glycerol, one 18:2-OH, and one 16:0 fatty acid; the 18:2 fatty acid has been lost. Again, these two peaks differ only in the amount of dehydration (1 dehydration for 591; 2 for 573). These four peaks may depict fragments originating from two different isomers of the DGDG 52:4 mono-estolide species. Figure 6 shows two possible structures for DGDG 52:4, one with 16:0 and an 18:2-OH/18:2 linked moiety each esterified to the glycerol (Figure 6a). Another possible structure has 18:2 and an 18:2-OH/16:0 linked moiety each esterified to the glycerol (Figure 6b). When the ammoniated digalactose head group and one fatty acid are lost during CID, the resulting structures can be stabilized by cyclization, by analogy to the structures produced during CID of triacylglcycerols and phosphatidylethanolamines [27,28], resulting in different apparent amounts of dehydration (Figure 6c-f). Loss of the 16:0 esterified to glycerol, along with the head group, from the structure in Figure 6a, can produce the ion seen at m/z 615.7 (615; Figure 5, 6c). Loss of the 18:2 esterified to 18:2-OH, along with the head group, from the same structure (Figure 6a) can produce the ion seen at m/z 573.8 (573; Figure 5, 6d). The DGDG 52:4 isomer shown in Figure 6b can fragment during CID in the same manner. Loss of the glycerol-esterified fatty acid, 18:2, along with the head group, can produce the ion seen at m/z 591.7 (591; Figure 5, 6e). Loss of the 18:2-OH-esterified fatty acid, 16:0, along with the head group, can produce the ion seen at m/z 597.7 (597; Figure 5, 6f). In comparing Figures 6c with 6f or 6e with 6d, loss of ammoniated digalactose plus loss of a fatty acid from the glycerol backbone results in one apparent dehydration, whereas loss of ammoniated digalactose plus loss of the same fatty acid from the 18:2-OH-esterified position results in two apparent dehydrations. The peak observed in Figure 5 at m/z 337.4 (337) is tentatively identified as protonated 18:2 esterified to glycerol minus H2O (C21H37O3). The peak observed at m/z 335.4 (335) appears to correspond to protonated 18:2-OH esterified to glycerol minus 2 H2O (C21H35O3), while the peak at m/z 313.4 (313) most likely represents protonated 16:0 esterified to glycerol minus H2O (C19H37O3). Again, these products are likely to have been cyclized, by analogy to structures formed in phosphatidylethanolamine fragmentation [28]. The presence in the spectrum of peaks representing each of the three fatty acids esterified to the glycerol is also consistent with DGDG 52:4 being a mixture of DGDG 16:0/18:2-O-18:2 (Figure 6a) and DGDG 18:2/18:2-O-16:0 (Figure 6b). The larger size of the peak at m/z 313.4 (313; acylglycerol 16:0 minus H2O) as compared to the peak at m/z 337.4 (337; acylglycerol 18:2 minus H2O) suggests that DGDG 16:0/18:2-O-18:2 was likely the more abundant species.
Figure 5.
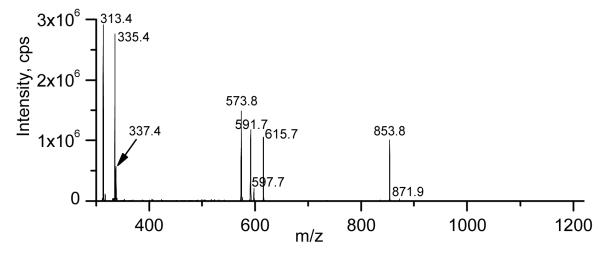
Product ion spectrum of DGDG 52:4, m/z 1212 (nominal mass), a DGDG monoestolide species containing the fatty acids 18:2, 16:0 and 18:2-OH.
Figure 6.
Proposed structures of ammoniated DGDG 52:4 mono-estolide, m/z 1212 (nominal mass), and CID fragments at m/z 615, 573, 591, and 597 (nominal mass), based on structures demonstrated for triacylglycerol and phosphatidylethanolamine [27,28]. Please note that, although we have indicated the glycerol carbons by C1, C2, and C3, we have no information to indicate esterification to specific glycerol positions. We also do not know the position of carbon-carbon double bonds. a) DGDG 52:4, with 16:0 and 18:2-OH/18:2 esterified to glycerol. b) DGDG 52:4, with 18:2 and 18:2-OH/16:0 esterified to glycerol. c) Fragment resulting from loss of ammoniated digalactose and 16:0 from structure in “a”. d) Fragment resulting from loss of ammoniated digalactose and 18:2 from structure in “a”. e) Fragment resulting from loss of ammoniated digalactose and 18:2 from structure in “b”. f) Fragment resulting from loss of ammoniated digalactose and 16:0 from structure in “b”.
Figure 7 shows the product ion spectrum of putative DGDG 70:6, a DGDG di-estolide species containing the fatty acids 18:2, 16:0 and two 18:2-OH species. The ammoniated 70:6 DGDG [M + NH4]+ ion observed at m/z 1491.1 (1490) underwent neutral loss of 341 or 359 Da, like the mono-estolide, to yield the small peak at m/z 1149 (nominal) and the larger peak observed at m/z 1132.1 (1131). The m/z 1149 (nominal) peak represents loss of an ammoniated digalactose minus H2O (C12H23O10N; 341 Da), leaving a protonated diacylglycerol di-estolide. Loss of the intact digalactosyl moiety (NL 359) formed a conventional diacylglycerol-like fragment ion at m/z 1132.1 (1131) [27,28]. The peak observed at m/z 893.8 (893), by analogy to the proposed structures for DGDG 52:4 detailed above in Figure 6, most likely represents a protonated monoacylglycerol di-estolide, with two 18:2-OH groups and one 18:2 minus 1 H2O; 16:0, along with the head group, was lost from the glycerol backbone. The peak at m/z 875.9 (875) probably represents its isomer, a protonated diacylglycerol mono-estolide. The 16:0 fatty acid was most likely lost from an 18:2-OH linkage, resulting in an additional dehydration. Likewise, the peaks at m/z 869.9 (869) and 851.9 (851) are likely to represent separate isomers of protonated glycerol esterified with two 18:2-OH and one 16:0, with one or two dehydrations, respectively. The peaks in the range m/z 573 to 615 represent additional acyl losses. The peaks at m/z 615.6 (615) and 597 (nominal) are consistent with protonated 18:2 and 18:2-OH esterified to glycerol, with the higher mass ion representing a protonated monoacylglycerol mono-estolide minus 1 H2O and the lower mass ion representing a protonated diacylglycerol minus 2 H2O. The peaks at m/z 613.6 (613) and 595 (nominal) are likely to represent protonated fragments with two 18:2-OH fatty acids esterified to glycerol with 2 or 3 dehydrations. The peaks at m/z 591.7 (591) and 573.7 (573) are tentatively identified as protonated 16:0 and 18:2-OH esterified to glycerol minus 1 and 2 H2O, respectively. On the other hand, the peak at m/z 559.7 (559) may represent a free fatty acid protonated mono-estolide made up of 18:2-OH and 18:2. The peak at m/z 337 is likely to correspond to protonated 18:2 esterified to glycerol minus H2O (C21H37O3). The peak at m/z 335 may represent protonated 18:2-OH esterified to glycerol minus 2 H2O (C21H35O3), while the peak at m/z 313 is probably protonated 16:0 esterified to glycerol minus H2O (C19H37O3). These data indicate that DGDG 70:6 most likely was a mixture of isomers, including DGDG 16:0/18:2-O-18:2-O-18:2 and DGDG 18:2/18:2-O-18:2-O-16:0. The presence of additional arrangements of the fatty acids, such as 18:2-O-18:2/18:2-O-16:0, cannot be ruled out by these data.
Figure 7.
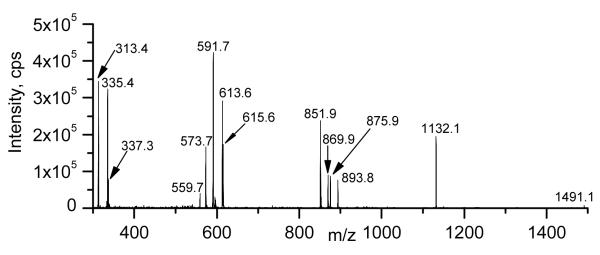
Product ion spectrum of DGDG 70:6, m/z 1490 (nominal mass), a DGDG di-estolide species containing the fatty acids 18:2, 16:0 and 2 18:2-OH species.
Similarly, Figure 8 shows the product ion spectrum of the peak tentatively assigned as DGDG 88:8, a DGDG tri-estolide species containing the fatty acids 18:2, 16:0 and three 18:2-OH species. The ammoniated DGDG 88:8 [M + NH4]+ ion at m/z 1769.4 (1768) underwent neutral loss to the peaks observed at m/z 1410. 3 (1409) and 1427 (nominal). These probably represent loss of an ammoniated digalactose (NL 359) and an ammoniated digalactose minus H2O (NL 341). Thus, the peak at 1410.3 (1409) lost the bridging glycerol-galactose oxygen and is probably a conventional diacylglycerol-like fragment [27,28]. The peaks at m/z 1171.6 (1171) and 1153.8 (1153) are likely to represent a protonated monoacylglycerol tri-estolide with one dehydration and a protonated diacylglycerol di-estolide with two dehydrations, respectively, with three 18:2-OH groups and one 18:2 each, by analogy to the proposed structures for DGDG 52:4 in Figure 6. The peaks observed at m/z 1147 (nominal) and 1130.2 (1129) probably reflect protonated glycerol esterified with three 18:2-OH and one 16:0 minus 1 or 2 H2O. The peaks in the range m/z 851.7 (851) to 893 (nominal) represent additional acyl losses. The small peak at m/z 893 (nominal) represents a protonated fragment with two 18:2-OH and one 18:2 esterified to glycerol minus H2O. The peaks at m/z 891.8 (891) and 873 (nominal) are likely to represent a protonated fragment with three 18:2-OH esterified to glycerol with either 2 or 3 dehydrations. The peaks observed at m/z 869.9 (869) and 851.7 (851) probably are protonated 16:0 and two 18:2-OH esterified to glycerol minus 1 or 2 H2O. On the other hand, the peak at m/z 837.9 (837) may represent a free fatty acid protonated di-estolide species made up of two 18:2-OH and 18:2. The peaks in the range m/z 573.5 (573) to 615.7 (615) represent further acyl losses leading to species with two acyl chains. The peaks at m/z 615.7 (615) and 597 (nominal) probably represent protonated 18:2 and 18:2-OH esterified to glycerol, either a protonated monoacylglycerol mono-estolide with one dehydration or a protonated diacylglycerol with two dehydrations, respectively. The peaks at m/z 613.6 (613) and 595 (nominal) are consistent with a protonated fragment with two 18:2-OH esterified to glycerol with 2 or 3 dehydrations. The peak at m/z 591.7 (591) and that observed at m/z 573.5 (573) are likely to show protonated 16:0 and 18:2-OH esterified to glycerol minus 1 or 2 H2O. The peak at m/z 557.5 (557) may represent a free fatty acid protonated mono-estolide species made up of two 18:2-OH minus H2O. The peak at m/z 337 is likely to be protonated 18:2 esterified to glycerol minus H2O (C21H37O3). The peak at m/z 335 is protonated 18:2-OH esterified to glycerol minus 2 H2O (C21H35O3), while the peak at m/z 313 is probably protonated 16:0 esterified to glycerol minus H2O (C19H37O3). These data imply that the tentatively assigned DGDG 88:8 was a mixture of isomers, including DGDG 16:0/18:2-O-18:2-O-18:2-O-18:2 and DGDG 18:2/18:2-O-18:2-O-18:2-O-16:0. Again, the presence of additional arrangements of the fatty acids, such as 18:2-O-18:2/18:2-O-18:2-O-16:0, cannot be ruled out by these data.
Figure 8.
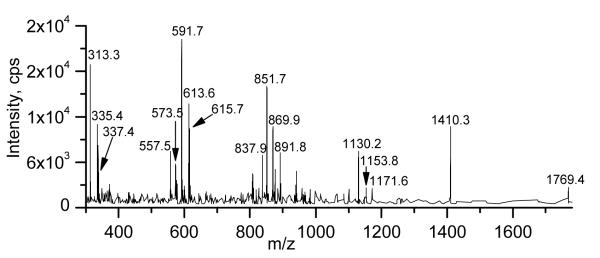
Product ion spectrum of DGDG 88:8, m/z 1768 (nominal mass), a DGDG tri-estolide species containing the fatty acids 18:2, 16:0 and 3 18:2-OH species.
ESI-MS/MS of trigalactosyldiacylglycerol and tetragalactosyldiacylglycerol species
The product ion spectrum shown in Figure 9a indicates that, in the positive mode, in solvent containing ammonium acetate, putative TriGDG species underwent a neutral loss of ammoniated trigalactose minus H2O (NL 503). Specifically, the ammoniated precursor ion of TriGDG 36:4 at m/z 1120.6 (1120) underwent neutral loss to m/z 617.7 (617). The observed fragment is consistent with loss of an ammoniated trigalactose minus H2O (C18H33O15N; 503 Da). The peak observed at m/z 337.4 (337) is a protonated 18:2 esterified to glycerol minus H2O (C21H37O3), indicating that the major molecular species of TriGDG 36:4 was TriGDG 18:2/18:2. Peaks at m/z 335 (nominal) and 339 (nominal) correspond to analogous acylglycerol fragments indicating that TriGDG 36:4 contains a smaller amount of TriGDG 18:3/18:1. Scanning for NL 503 (Figure 9b-e) can be used to identify TriGMGs, TriGDGs, TriGDG mono-estolides, and TriGDG di-estolides, respectively. Similarly, in the positive mode, in solvent containing ammonium acetate, TetraGDGs underwent a neutral loss of ammoniated tetragalactose minus H2O (NL 665), and scanning for NL 665 displays species of TetraGDG and TetraGDG mono-estolide (Figure 10a and b).
Figure 9.
Fragmentation of TriGDG and neutral loss scans identifying trigalactosyl acylglycerol species. a) Product ion spectrum of TriGDG 36:4 [M + NH4]+ ion at m/z 1120 (nominal mass). b through e: Scans of neutral loss of 503, showing b) TriGMG species, c) TriGDG species, d) TriGDG mono-estolide species, and e) TriGDG di-estolide species.
Figure 10.
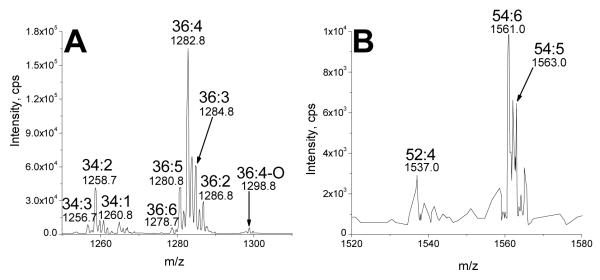
Neutral loss scans identifying tetragalactosyldiacylglycerol species. TetraGDGs are identified in scans for neutral loss of an ammoniated tetragalactose minus H2O (C24H43O20N; 665 Da). Scans of neutral loss of 665, showing a) TetraGDG species and b) TetraGDG monoestolide species.
Normal-phase HPLC-ESI-MS evidence for the structural identification of glycolipids and their estolides in the oat total glycolipid fraction
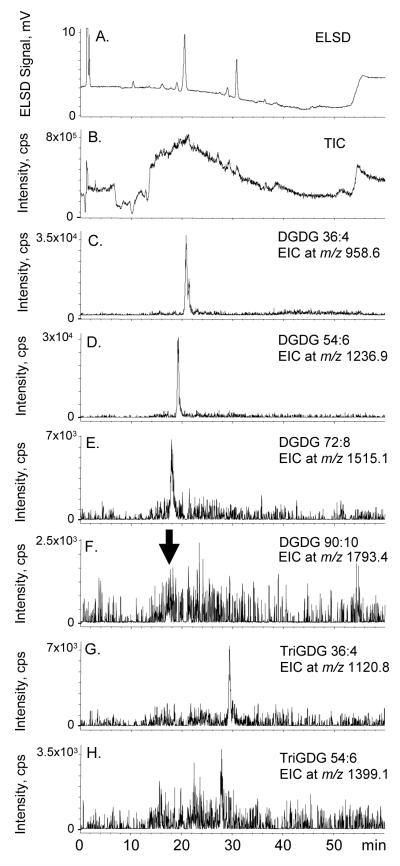
Based on the numerous glycolipids and estolides that were identified by ESI-MS/MS (Figure 4,5,7-10), we used NP-HPLC-ESI-MS to try to identify some of the same lipids. The HPLC-ELSD chromatogram is shown in Figure 11a. To assist in this evaluation, the major [M + NH4] + ions identified in Figure 4, 9, and 10 are listed in Table 2, and we searched for these “extracted ions” in the NP-HPLC-ESI-MS total ion chromatogram (TIC) (Figure 11b); the results are plotted as “extracted ion chromatograms” (EIC) (Figure 11c-11h). Early attempts to employ ESI produced very few ions, and it was only after we added ammonium formate to the mobile phase that we started to obtain good ESI spectra. After we began routinely including ammonium formate in our mobile phase, the [M + NH4]+ ions were present in the greatest abundance (we saw very little of the [M + H]+ and [M + Na]+ ions), so we focused our attention on [M + NH4]+. Even with ammonium formate, the TIC for the normal-phase separation contained a very high background (Figure 11b). However, by examining the EICs, we were able to identify peaks that corresponded to the major [M + NH4]+ ions of: non-estolide DGDG (DGDG 36:4) (Figure 11c), DGDG mono-estolide (DGDG 54:6) (Figure 11d), DGDG di-estolide (DGDG 72:8) (Figure 11e), DGDG tri-estolide (DGDG 90:10) (Figure 11f, with an arrow indicating the possible location of this very small peak, which is consistent with the expected retention time for this hydrophobic DGDG estolide), non-estolide TriGDG (TriGDG 36:4) (Figure 11g), and TriGDG mono-estolide (TriGDG 54:6) (Figure 11h).
Figure 11.
NP-HPLC chromatograms of the oat total glycolipid SPE fraction. a) NP-HPLCELSD chromatogram, b) positive ESI TIC, m/z 200-2000, c) EIC of m/z 958.6, a major DGDG non-estolide, DGDG 36:4, d) EIC of m/z 1236.9, a major DGDG mono-estolide, DGDG 54:6, e) EIC of m/z 1515.1, a major DGDG di-estolide, DGDG 72:8, f) EIC of m/z 1793.4, a major DGDG tri-estolide, DGDG 90:10 (The arrow indicates the possible location of this very small peak.), g) EIC of m/z 1120.8, a major TriGDG non-estolide, TriGDG 36:4, and h) EIC of m/z 1399.1, a major TriGDG mono-estolide, TriGDG 54:6.
Table 2.
Identification of the major galactolipids and estolides in oats and their abbreviations and ammoniated ion masses.
| Galactolipid molecular species | Abbreviation |
m/z of [M + NH4]+ |
|---|---|---|
| DGDG | DGDG 34:2 | 934.6 |
| DGDG 36:4 | 958.6 | |
| DGDG-with 1 hydroxy FA | DGDG 36:4-OH | 974.6 |
| DGDG mono-estolide | DGDG 52:4 | 1212.9 |
| DGDG 54:6 | 1236.9 | |
| DGDG 54:7 | 1234.9 | |
| DGDG mono-estolide with free OH | DGDG 54:6-OH | 1252.9 |
| DGDG di-estolide | DGDG 70:6 | 1491.1 |
| DGDG 72:8 | 1515.1 | |
| DGDG tri-estolide | DGDG 88:8 | 1769.4 |
| DGDG 90:10 | 1793.4 | |
|
| ||
| TriGDG | TriGDG 34:2 | 1096.7 |
| TriGDG 36:4 | 1120.8 | |
| TriGDG-with 1 hydroxy FA | TriGDG 36:4-OH | 1136.7 |
| TriGDG mono-estolide | TriGDG 54:6 | 1399.1 |
| TriGDG di-estolide | TriGDG 72:8 | 1677.4 |
|
| ||
| TetraGDG | TetraGDG 34:2 | 1258.9 |
| TetraGDG 36:4 | 1282.9 | |
| TetraGDG mono-estolide | TetraGDG 54:6 | 1561.2 |
Reverse-phase HPLC-ESI-MS evidence for the structural identification of glycolipids and their estolides in the oat total glycolipid fraction
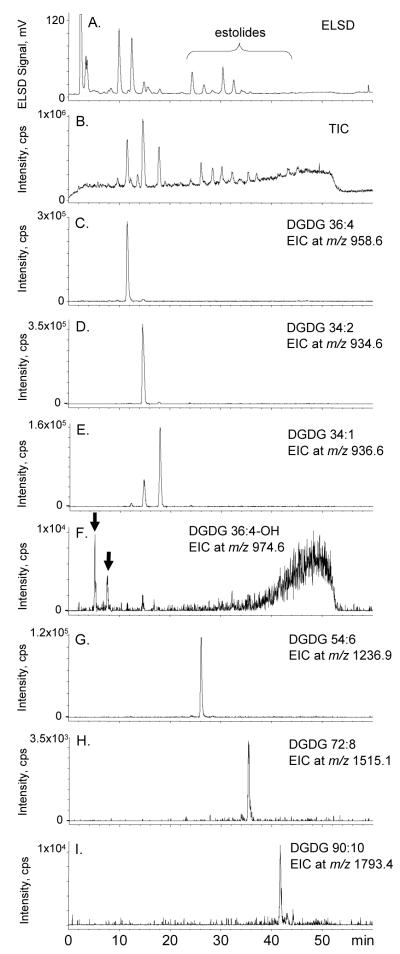
RP-HPLC-ESI-MS was also employed to identify the glycolipids and their estolides determined above by ESI-MS/MS. The HPLC-ELSD chromatogram is shown in Figure 12a. The major difference that was observed when switching to the reverse phase HPLC method was that the reverse phase TIC (Figure 12b) contained much less background noise than the comparable normal phase TIC (Figure 11b). Examination of the EICs revealed several large sharp peaks that corresponded to the major [M + NH4]+ ions of: four non-estolide DGDGs (DGDG 36:4, 34:2, 34:1, and 36:4-OH) (Figures 12c-f), DGDG monoestolide (DGDG 54:6) (Figure 12g), DGDG di-estolide (DGDG 72:8) (Figure 12h), and DGDG tri-estolide (DGDG 90:10) (Figure 12i). The putative DGDG 34:1 EIC (Figure 12e) likely shows both an A + 2 isotope peak of the more abundant DGDG 34:2 (coeluting with DGDG 34:2, Figure 12d) and DGDG 34:1, eluting slightly later. The EIC for DGDG 36:4-OH shows two sharp peaks (Figure 12f). The location of the peaks is consistent with the notion that the presence of an extra OH would cause DGDG 36:4-OH to elute early in RP-HPLC, but it is not clear which peak is DGDG 36:4-OH, nor is the identity of the lipids in the large broad peak at 40-55 min in Figure 12f known.
Figure 12.
RP-HPLC chromatograms of the oat total glycolipid SPE fraction. a) RP-HPLCELSD chromatogram, b) positive ESI TIC, m/z 200-2000, c) EIC of m/z 958.6, a major DGDG non-estolide, DGDG 36:4, d) EIC of m/z 934.6, a major DGDG non-estolide, DGDG 34:2, e) EIC of m/z 936.6, a major DGDG non-estolide, DGDG 34:1, f) EIC of m/z 974.6, a major DGDG non-estolide with a free hydroxyl group, DGDG 36:4-OH (The peaks marked by the arrows are both candidates for authentic DGDG 36:4-OH; the identity of the lipids in the large broad peak at 40-55 min is unknown.), g) EIC of m/z 1236.9, a major DGDG mono-estolide, DGDG 54:6, h) EIC of m/z 1515.1, a major DGDG di-estolide, DGDG 72:8, and i) EIC of m/z 1793.4, a major DGDG tri-estolide, DGDG 90:10.
Reverse-phase HPLC-ESI-MS evidence for the structural identification of glycolipids and their estolides in the oat glycolipid subfraction 2
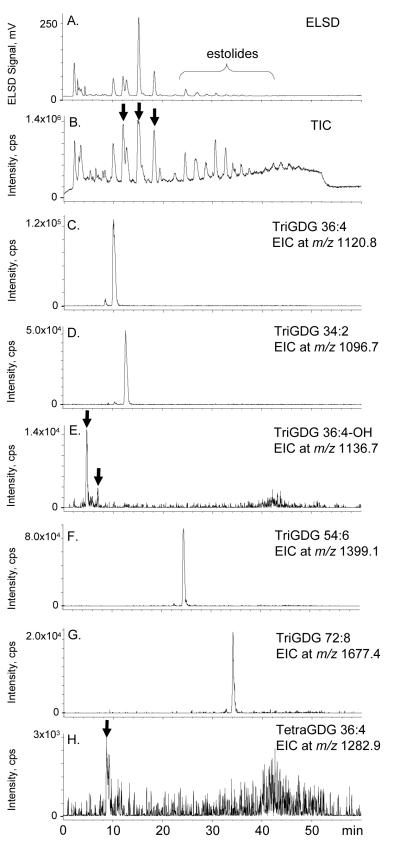
As noted previously, oat glycolipid subfraction 2 contained high levels of DGDG and moderate levels of the putative TriGDG peaks (eluting at 26-30 min in Figure 2). The RP-HPLC-ELSD chromatogram (Figure 13a) and RP-HPLC-ESIMS-TIC (Figure 13b) revealed peaks at 10-20 min that appeared to correspond to non-estolides and peaks at about 20-40 minutes that corresponded to estolides. The retention times of the three major non-estolide DGDG peaks previously identified in Figure 12c-e were labeled with arrows in Figure 13b. The EICs revealed peaks that were tentatively identified as the major [M + NH4]+ ions of: non-estolide TriGDGs 36:4, 34:2, and 36:4-OH (Figure 13c-e), TriGDG mono-estolide (TriGDG 54:6) (Figure 13f), and TriGDG di-estolide (TriGDG 72:8) (Figure 13g). It is unknown which early-eluting peak corresponds to TriGDG 36:4-OH in Figure 13e. The EIC for m/z 1282.9, corresponding to TetraGDG 36:4 (Figure 13h), revealed weak peaks at about 9 (marked) and 40-42 min; the peak at 9 min exhibits a slightly shorter elution time than TriGDG 36:4 (Figure 13c), consistent with expected behavior for TetraGDG 36:4 on a reverse-phase column.
Figure 13.
RP-HPLC chromatograms of the oat total glycolipid SPE subfraction 2, enriched in DGDG and TriGDG. a) RP-HPLC-ELSD chromatogram, b) positive ESI TIC, m/z 200-2000 (The retention times of the three major non-estolide DGDG peaks previously identified in Figure 12c-e were labeled with arrows.), c) EIC of m/z 1120.8, a major TriGDG non-estolide, TriGDG 36:4, d) EIC of m/z 1096.7, a major TriGDG non-estolide, TriGDG 34:2, e) EIC of m/z 1136.7, a major TriGDG non-estolide with a free hydroxyl group, TriGDG 36:4-OH, f) EIC of m/z 1399.1, a major TriGDG mono-estolide, TriGDG 54:6, g) EIC of m/z 1677.4, a major TriGDG diestolide, TriGDG 72:8, and h) EIC of m/z 1282.9, a major TetraGDG non-estolide, TetraGDG 36:4.
Reverse phase HPLC-ESI-MS evidence for the structural identification of glycolipids and their estolides in the oat glycolipid subfraction 3
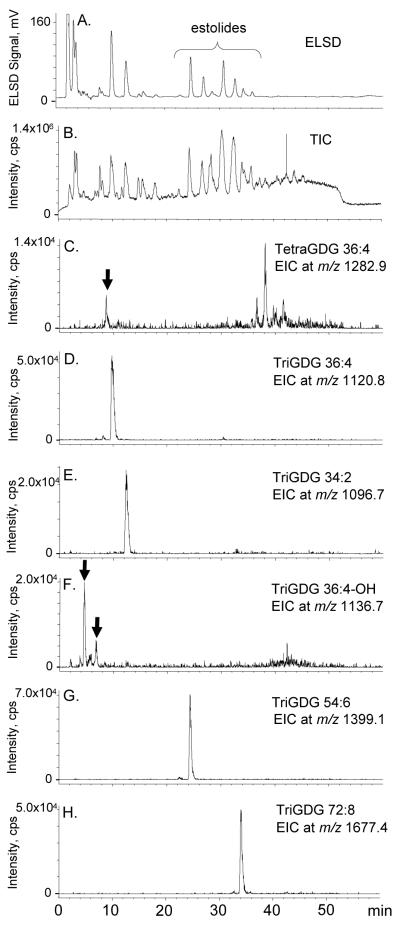
As noted previously, oat glycolipid subfraction 3 was enriched in the putative TriGDG peaks (eluting at 26-30 min in Figure 2) and contained a small putative TetraGDG peak (eluting at about 36 min). When analyzed via reverse-phase HPLC-ESI-MS (Figure 14), the EICs revealed peaks that corresponded to the major [M + NH4]+ ions of TriGDG non-estolide and estolide peaks as identified in Figure 13. The EIC of TetraGDG 36:4 revealed weak peaks at about 9 and 35-45 min (Figure 14c) that were slightly stronger than those observed above (Figure 13h). Based on its early elution time and the polar structure of TetraGDG, we speculate that the peak at 9 min is probably authentic TetraGDG and the peaks of less polar compounds at 35-45 min probably correspond to estolides with the same mass.
Figure 14.
RP-HPLC chromatograms of the oat total glycolipid SPE subfraction 3, enriched in TriGDG and TetraGDG. a) RP-HPLC-ELSD chromatogram, b) positive ESI TIC, m/z 200-2000, c) EIC of m/z 1282.9, a major TetraGDG non-estolide, TetraGDG 36:4 (The probable retention time of authentic TetraGDG 36:4 was identified with an arrow; the identity of the lipids in the multiple peaks at 35-45 min is unknown.), d) EIC of m/z 1120.8, a major TriGDG non-estolide, TriGDG 36:4, e) EIC of m/z 1096.7, a major TriGDG non-estolide, TriGDG 34:2, f) EIC of m/z 1136.7, a major TriGDG non-estolide with a free hydroxyl group, TriGDG 36:4-OH, g) EIC of m/z 1399.1, a major TriGDG mono-estolide, TriGDG 54:6, and h) EIC of m/z 1677.4, a major TriGDG di-estolide, TriGDG 72:8.
Estimation of the total amount of estolides in oat lipids
The main objective of the current study was to provide structural evidence for the occurrence of several galactolipids and their estolides in oat kernels. In a future study we plan to report a comprehensive quantitative analysis of the levels of galactolipids and their estolides in several cultivars of oat kernels. However, we believe that it is important to estimate their approximate levels in this report to demonstrate that they are present in more than trace amounts. Using direct infusion electrospray ionization mass spectrometry we estimate that the oat glycolipid fraction contains: 58 mol% DGDG nonestolides, 25 mol% DGDG estolides, 8 mol% TriGDG non-estolides, 4 mol% TriGDG estolides, 0.3 mol% TetraGDG non-estolides, and 0.1 mol% TetraGDG estolides. Estolides therefore comprise about 29% of the total glycolipid fraction and 10% of the total methanol-extractable lipid fraction (based on the SPE fractionation yields).
Conclusion
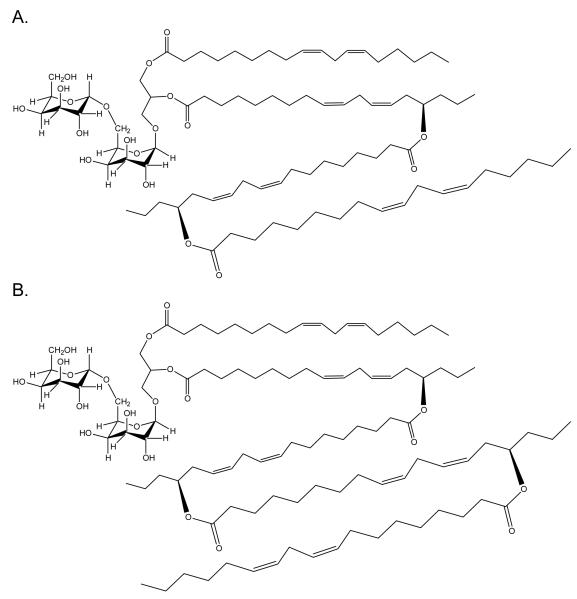
We have confirmed the presence of DGDG mono-estolide (Figure 1) in oat kernels, as previously reported by Hamberg et al. [10], and we have demonstrated that it is the most abundant estolide in oat kernels, but it is not the only estolide. Two larger DGDG estolides (di- and tri-estolides) (Figure 15), two TriGDG estolides (mono- and di-estolides), and one TetraGDG estolide (mono-estolide) were also tentatively identified. The amounts of various estolide species did not vary, regardless of whether the oats were steamed to inactivate lipases before extraction, as in this study, or whether the oats were extracted directly (data not shown). To our knowledge, this report is the first evidence of natural di- and tri-estolides of polar lipids.
Figure 15.
Proposed structures of: a) a DGDG di-estolide (DGDG 72:8) identified in this study by HPLC-MS and MS/MS. Exact mass (C87H148O19), 1497.0615 Da; m/z of [M+NH4]+ (C87H152O19N), 1515.0953. b) a DGDG tri-estolide (DGDG 90:10) identified in this study by HPLC-MS and MS/MS. Exact mass (C105H178O21), 1775.2861 Da; m/z of [M+NH4]+ (C105H182O21N), 1793.3199. In these figures the estolide is shown esterified to the sn-2 position of glycerol, as suggested by Hamberg [10], but our data do not preclude the possibility that some or all of the estolides may be esterified at sn-1.
ACKNOWLEDGEMENTS
We thank the reviewers for their detailed comments, which helped us to improve the manuscript. Kansas Lipidomics Research Center was supported by National Science Foundation (EPS 0236913, MCB 0455318, DBI 0521587), Kansas Technology Enterprise Corporation, Kansas IDeA Network of Biomedical Research Excellence (INBRE) of National Institute of Health (P20RR16475), and Kansas State University. This is contribution 08-122-J from the Kansas Agricultural Experiment Station.
Abbreviations
- APCI
atmospheric pressure chemical ionization
- CID
collision induced dissociation
- DAG
diacylglycerol
- DGDG
digalactosyldiacylglycerol
- DGMG
digalactosylmonoacylglycerol
- ESI
electrospray ionization
- ELSD
evaporative light scattering detector
- EIC
extracted ion chromatogram
- HPLC
high-performance liquid chromatography
- MS
mass spectrometry
- MGDG
monogalactosyldiacylglycerol
- NL
neutral loss
- NP
normal-phase
- RP
reverse-phase
- SPE
solid phase extraction
- MS/MS
tandem mass spectrometry
- TetraGDG
tetragalactosyldiacylglycerol
- TIC
total ion chromatogram
- TriGDG
trigalactosyldiacylglycerol
- TriGMG
trigalactosylmonoacylglycerol
Footnotes
Mention of trade names or commercial products in this publication is solely for the purpose of providing specific information and does not imply recommendation or endorsement by the U.S. Department of Agriculture.
REFERENCES
- 1.Dörmann P, Benning C. Galactolipids rule in seed plants. Trends Plant Sci. 2002;7:112–118. doi: 10.1016/s1360-1385(01)02216-6. [DOI] [PubMed] [Google Scholar]
- 2.Moreau RA, Powell MJ, Singh V. Pressurized liquid extraction of polar and nonpolar lipids in corn and oats with hexane, methylene chloride, isopropanol, and ethanol. J Am Oil Chem Soc. 2003;80:1063–1067. [Google Scholar]
- 3.Morrison WR. Wheat lipid composition. Cereal Chem. 1978;55:548–558. [Google Scholar]
- 4.Galliard T. The isolation and characterization of trigalactosyl diglyceride from potato tubers. Biochem J. 1969;115:335–339. doi: 10.1042/bj1150335. [DOI] [PMC free article] [PubMed] [Google Scholar]
- 5.Fujino Y, Miyazawa T. Chemical structures of mono-, di-, tri-, and tetraglycosylglycerides in rice bran. Biochim Biophys Acta. 1979;572:442–451. [PubMed] [Google Scholar]
- 6.Kojima M, Seki K, Ohnishi M, Ito S, Fujino Y. Structure of novel glyceroglycolipids in Adzuki bean (Vigna angularis) seeds. Biochem Cell Biol. 1990;68:59–64. [PubMed] [Google Scholar]
- 7.Ito S, Fujino Y. Trigalactosyl diglyceride of pumpkin. Phytochemistry. 1975;14:1445–1447. [Google Scholar]
- 8.Sugawara T, Miyazawa T. Separation and determination of glycolipids from edible plant sources by high-performance liquid chromatography and evaporative-light scattering detection. Lipids. 1999;34:1231–1237. doi: 10.1007/s11745-999-0476-3. [DOI] [PubMed] [Google Scholar]
- 9.Hamberg M, Hamberg G. 15(R)-Hydroxylinoleic acid, an oxylipin from oat seeds. Phytochemistry. 1996;42:729–732. [Google Scholar]
- 10.Hamberg M, Liepinsh E, Otting G, Griffiths W. Isolation and structure of a new galactolipid in oat seeds. Lipids. 1998;33:355–363. doi: 10.1007/s11745-998-0215-9. [DOI] [PubMed] [Google Scholar]
- 11.Spitzer V, Tomberg W, Pohlentz G. Structure analysis of an allene-containing estolide tetraester triglyceride in the seed oil of Sebastiana commersonionia (Euphorbiaceae) Lipids. 1997;32:549–557. doi: 10.1007/s11745-997-0070-8. [DOI] [PubMed] [Google Scholar]
- 12.Sprecher HW, Maier R, Barber M, Holman RT. Structure of an optically active allene-containing tetraester triglyceride isolate from the seed oil of Sapium Sebiferum. Biochemistry-US. 1965;4:1856–1863. [Google Scholar]
- 13.Heimermann WH, Holman RT. Highly optically active triglycerides from Sebastiana ligustrina and related species. Phytochemistry. 1972;11:799–802. [Google Scholar]
- 14.Morris LJ, Hall SW. The structures of glycerides in ergot oil. Lipids. 1966;1:188–196. doi: 10.1007/BF02531871. [DOI] [PubMed] [Google Scholar]
- 15.Hayes DG, Kleiman R, Bliss SP. The triglyceride composition, structure, and presence of estolides in the oils of Lesquerella and related species. J Am Oil Chem Soc. 1955;72:559–569. [Google Scholar]
- 16.Lin J-T, Arcinas A, Harden LR, Fagerquist CK. Identification of (12-Ricinoleolylricinoleoyl) diricinoleoylglycerol, and acylglycerol containing four acyl chains, in castor (Ricinus communis L.) oil by LC-ESI-MS. J Agric Food Chem. 2006;54:3498–3504. doi: 10.1021/jf060150e. [DOI] [PubMed] [Google Scholar]
- 17.Isbell TA, Kleiman R. Characterization of estolides from acid-catalyzed condensation of oleic acid. J Am Oil Chem Soc. 1994;71:379–383. [Google Scholar]
- 18.Isbell TA, Cermak SC. Synthesis of triglyceride estolides from Lesquerella and castor oils. J Am Oil Chem Soc. 2002;79:1227–1233. [Google Scholar]
- 19.Ohm JB, Chung OK. Estimation of free glycolipids in wheat flour by HPLC. Cereal Chem. 1999;76:873–876. [Google Scholar]
- 20.Buseman CM, Tamura P, Sparks AA, Baughman EJ, Maatta S, Zhao J, Roth MR, Esch SW, Shah J, Williams TD, Welti R. Wounding stimulates the accumulation of glycerolipids containing oxophytodienoic acid and dinor-oxophytodienoic acid in Arabidopsis leaves. Plant Physiol. 2006;142:28–39. doi: 10.1104/pp.106.082115. [DOI] [PMC free article] [PubMed] [Google Scholar]
- 21.Yamauchi R, Aizawa K, Inakuma T, Kato K. Analysis of molecular species of glycolipids in fruit pastes of red bell pepper (Capsicum annuum L.) by high-performance liquid chromatography-mass spectrometry. J Agric Food Chem. 2001;49:622–627. doi: 10.1021/jf001192k. [DOI] [PubMed] [Google Scholar]
- 22.Welti R, Wang X. Lipid species profiling: A high-throughput approach to identify lipid compositional changes and determine the function of genes involved in lipid metabolism and signaling. Curr Opin Plant Biol. 2004;7:337–344. doi: 10.1016/j.pbi.2004.03.011. [DOI] [PubMed] [Google Scholar]
- 23.Brügger B, Erben G, Sandhoff R, Wieland FT, Lehmann WD. Quantitative analysis of biological membrane lipids at the low picomole level by nano-electrospray ionization tandem mass spectrometry. Proc Natl Acad Sci USA. 1997;94:2339–2344. doi: 10.1073/pnas.94.6.2339. [DOI] [PMC free article] [PubMed] [Google Scholar]
- 24.Devaiah SP, Roth MR, Baughman E, Li M, Tamura P, Jeannotte R, Welti R, Wang X. Quantitative profiling of polar glycerolipid species and the role of phospholipase Dα1 in defining the lipid species in Arabidopsis tissues. Phytochemistry. 2006;67:1907–1924. doi: 10.1016/j.phytochem.2006.06.005. [DOI] [PubMed] [Google Scholar]
- 25.Welti R, Li W, Li M, Sang Y, Biesiada H, Zhou H-E, Rajashekar CB, Williams TD, Wang X. Profiling membrane lipids in plant stress responses: role of phospholipase Dα in freezing-induced lipid changes in Arabidopsis. J Biol Chem. 2002;277:31994–32002. doi: 10.1074/jbc.M205375200. [DOI] [PubMed] [Google Scholar]
- 26.Welti R, Wang X, Williams TD. Electrospray ionization tandem mass spectrometry scan modes for plant chloroplast lipids. Anal Biochem. 2003;314:149–152. doi: 10.1016/s0003-2697(02)00623-1. [DOI] [PubMed] [Google Scholar]
- 27.Hsu F-F, Turk J. Structural characterization of triacylglycerols as lithiated adducts by electrospray ionization mass spectrometry using low-energy collisionally activated dissociation on a triple stage quadrupole instrument. J Am Soc Mass Spec. 1999;10:587–599. doi: 10.1016/S1044-0305(99)00035-5. [DOI] [PubMed] [Google Scholar]
- 28.Hsu F-F, Turk J. Characterization of phosphatidylethanolamine as a lithiated adduct by triple quadrupole tandem mass spectrometry with electrospray ionization. J Mass Spectrom. 2000;35:596–606. doi: 10.1002/(SICI)1096-9888(200005)35:5<595::AID-JMS965>3.0.CO;2-D. [DOI] [PubMed] [Google Scholar]


