

Significance
Recent years have seen incredible growth in both the scale and specificity of projects analyzing the microbial organisms living in and on the human body (the human microbiome). Such studies typically require subjects to report to clinics for sample collection, a complicated practice that is impractical for large studies. To address these issues, we developed a protocol that allows subjects to collect microbiome samples at home and ship them to laboratories for multiple different types of molecular analysis. Measurements of microbial species, gene, and gene transcript composition within self-collected samples were consistent across sampling methods. In addition, our subsequent analysis of these samples revealed interesting similarities and differences between the measured functional potential and functional activity of the human microbiome.
Abstract
Although the composition of the human microbiome is now well-studied, the microbiota’s >8 million genes and their regulation remain largely uncharacterized. This knowledge gap is in part because of the difficulty of acquiring large numbers of samples amenable to functional studies of the microbiota. We conducted what is, to our knowledge, one of the first human microbiome studies in a well-phenotyped prospective cohort incorporating taxonomic, metagenomic, and metatranscriptomic profiling at multiple body sites using self-collected samples. Stool and saliva were provided by eight healthy subjects, with the former preserved by three different methods (freezing, ethanol, and RNAlater) to validate self-collection. Within-subject microbial species, gene, and transcript abundances were highly concordant across sampling methods, with only a small fraction of transcripts (<5%) displaying between-method variation. Next, we investigated relationships between the oral and gut microbial communities, identifying a subset of abundant oral microbes that routinely survive transit to the gut, but with minimal transcriptional activity there. Finally, systematic comparison of the gut metagenome and metatranscriptome revealed that a substantial fraction (41%) of microbial transcripts were not differentially regulated relative to their genomic abundances. Of the remainder, consistently underexpressed pathways included sporulation and amino acid biosynthesis, whereas up-regulated pathways included ribosome biogenesis and methanogenesis. Across subjects, metatranscriptional profiles were significantly more individualized than DNA-level functional profiles, but less variable than microbial composition, indicative of subject-specific whole-community regulation. The results thus detail relationships between community genomic potential and gene expression in the gut, and establish the feasibility of metatranscriptomic investigations in subject-collected and shipped samples.
Of all of the human microbiomes across the diverse landscape of the human organism, the oral and gut microbiome represent the two best studied to date. Both microbiomes are subject to distinctive environments along the gastrointestinal tract and have their own unique ecologies. Several hundred taxa live in and along the saliva, teeth, and gingival structures, and over 500 taxa have been estimated to inhabit the distal gut (1). However, although robust methods for studying diversity of the human microbiota exist for the oral and gut microbiome, recent studies suggest that functional activity may vary widely across hosts and in response to distinct perturbations (2, 3), and highlight the need for methods development that bridges analyses of metagenomic and metatranscriptomic interrogations of the microbiome.
Early high-throughput metatranscriptomic investigations of microbial communities were focused largely on ocean-derived environmental samples (4–6). These efforts demonstrated the feasibility of RNA-based profiling of microbial community structure, function, and diversity, and also produced large amounts of novel sequence information (transcripts) unseen by earlier metagenomic investigations. Metatranscriptomic analysis has subsequently been applied to the human gut microbiome, revealing strong intersubject and temporal variability in microbial gene expression, as well as core modules of actively transcribed versus repressed functions (7–9). In addition, metatranscriptomic analyses of the gut microbiome during exposure to dietary (10) and xenobiotic (2) interventions have revealed significant alterations of the microbial community gene-expression profile, but often without large changes in overall community structure. One of the next major challenges facing human microbiome studies is relating the current understanding of microbial ecology to this growing knowledge of the biomolecular activities and regulatory systems of the microbiota (11).
Although recent population studies have established a framework for interrogating the community composition and genomic potential of these microbiomes, it is not yet well-understood how genomic potential relates to whole-community transcriptional regulation. This knowledge gap is in part because of the lack of standardized human microbiome sampling methodologies appropriate both for functional assays of the microbiota and for large cohort-based research (12, 13). Despite the success of efforts by the Human Microbiome Project (14) and MetaHIT consortia (15), identification of best practices and experimental processes that affect microbiome measurements represents a key challenge for functional meta’omics and for enabling microbiome investigation in larger epidemiological studies. In particular, the field requires development of microbiome sampling methods that are: (i) cost-effective, (ii) easily applied outside of a clinical setting, (iii) amenable to a variety of downstream meta’omic analyses, (iv) highly accurate in comparison with clinically collected controls, and (v) devoid of large biases or batch effects.
In this work, we proposed and validated a method for studying functional aspects of the microbiota in large human cohorts. We then applied the data collected during the validation process to address important knowledge gaps regarding relationships between the oral metagenome, gut metagenome, and gut metatranscriptome. Working with eight subjects from the Health Professionals Follow-up Study (HPFS) cohort, we demonstrated the representativeness of self-collected, self-shipped saliva and stool samples in metagenomic and metatranscriptomic assays of the microbiome. Comparing saliva and stool samples from the same subject further allowed us to explore microbial co-occurrence relationships between the oral and gut environments. In particular, only a small number of abundant oral residents survived transport to the gut environment, and their functional activity there was consistently greatly reduced. This proved to be the case even when microbes were identified at the strain level, indicating the transport of one population per species rather than the differentiation of two niche-specific subpopulations.
Finally, we compared and contrasted the metagenomic and metatranscriptomic compositions of the human gut. Although metagenomic analysis reveals the functional potential of a microbial community, it remains largely unknown how this potential is translated to functional activity, as measured by the metatranscriptome. Our analysis revealed that although functional potential and activity were often closely coupled in the gut, they were also distinguished by two strong forces: (i) a subset of microbial functional activities that were consistently transcriptionally up- or down-regulated in the gut, and (ii) activities that varied in a highly subject-specific manner in the context of a common functional potential. Together, these results provide a community-wide profile of biomolecular regulatory processes in the gut, as well as validating one of the first protocols appropriate for large-scale functional profiling of the microbiome in human populations.
Results
Self-Collected Stool Aliquots Provide Representative Metagenomes and Metatranscriptomes.
We recruited eight members of the HPFS cohort to provide saliva and stool samples to dissect relationships between the human oral metagenome, gut metagenome, and gut metatranscriptome. To simultaneously evaluate the feasibility of sample self-collection and shipping methods in functional studies of the human microbiome, saliva and stool samples were self-collected by the subjects and then stored on ice for delivery to our laboratory facilities within 24 h following an established protocol (14). We additionally evaluated this standard transport procedure relative to freshly collected, immediately processed samples and found only minimal differences (SI Appendix, SI Methods and Fig. S1). Upon arrival, aliquots of each stool sample were fixed in ethanol and RNAlater and then stored at ambient temperature for 48 h to simulate shipping conditions; additional aliquots were kept frozen as controls. DNA and RNA were subsequently extracted from the samples, assessed to ensure high-quality (RNA integrity number, RIN, scores) (Methods and SI Appendix, Table S1), and sequenced by Illumina HiSeq (Methods). The resulting raw read data were processed to remove low-quality reads and human contamination and finally profiled at the taxonomic and functional levels using MetaPhlAn (16) and HUMAnN (17), respectively (Fig. 1).
Fig. 1.

A self-sampling method compatible with metagenomic and metatranscriptomic sequencing of the human microbiome. (A) Eight participants from the HPFS cohort were recruited to assess the viability of self-collection methods in meta’omics studies and to simultaneously investigate relationships between the human oral metagenome, gut metagenome, and gut metatranscriptome. (B) Subjects self-collected samples of saliva and stool, which were returned to the laboratory. (C) Saliva samples were frozen and stool samples were tested under three conditions, including simulated shipping conditions: (i) frozen control, (ii) fixed in ethanol, and (iii) fixed in RNAlater. (D) DNA was extracted from all saliva and stool samples; RNA was extracted from stool samples only and reverse-transcribed to cDNA. All samples were then sequenced using the Illumina HiSeq platform. Raw sequence data were filtered to remove low quality and human host reads. (E) Metagenomic and metatranscriptomic read data were profiled for functional and taxonomic composition using HUMAnN (17) and MetaPhlAn (16), respectively.
We first sought to determine whether subject-collected, fixed, and shipped samples provided equivalent metagenomic and metatranscriptomic data to state-of-the-art fresh-frozen sample-collection protocols (14). This was assessed quantitatively by determining the extent to which stool samples taken from the same individual but handled by different methods yielded equivalent metagenomic and metatranscriptomic profiles. We thus compared profiles of microbial species, gene, and transcript abundances from 24 stool samples: one from each of eight subjects subdivided and stored by three different methods before DNA/RNA extraction and sequencing (frozen control, ethanol-fixed and mock-shipped, and RNAlater-fixed and mock-shipped) (Fig. 1). We found that for all three types of meta’omic profiles (species, genes, and transcripts), within-subject correlations between frozen and mock-shipped samples were universally very strong (minimum Spearman’s r = 0.83, P ≪ 0.001), with gene-level abundances being the most consistent between methods, followed by species, and then transcripts. Both direct comparisons (Fig. 2 A–C) and overview ordination (SI Appendix, Fig. S2) supported the conclusion that subject-shipment of samples had minimal effect on meta’omic profiling, particularly in contrast to the typically large intersubject differences.
Fig. 2.
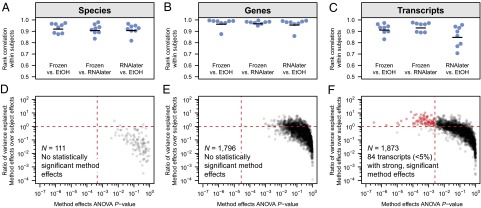
Taxonomic and functional profiles are consistent across sample handling methods. Global profiles of (A) species composition, (B) gene-level functional composition, and (C) transcript-level functional composition were highly concordant in within-subject comparisons of frozen controls vs. mock-shipped samples (Spearman’s rank correlation coefficient); black bars represent the averages across each group of eight correlation coefficients. Sample handling effect was further quantified by two-way ANOVA for all (D) species, (E) genes, and (F) transcripts detected with relative abundance of at least 10−4 (0.01%) in at least three samples. Following correction for multiple hypothesis testing, <5% of transcripts showed a strong, significant effect from choice of sample handling method; we observed no significant sample handling effects for either species or genes. Vertical red lines represent the threshold for statistical significance (Benjamini–Hochberg FDR, α = 0.05); features above the horizontal red lines have greater between-method variation than between-subject variation.
Effects of Sample Handling Method on Individual Meta’omic Features.
To assess the contribution of individual features (e.g., specific microbial species or genes) to this strong global agreement, we performed two-way ANOVA tests on each metagenomic and metatranscriptomic feature, normalizing abundance data (Methods) to partition feature variance across the eight subjects and three sample handling methods (Fig. 2 D–F). Only features exceeding a minimum relative abundance of 10−4 (0.01%) in at least 3 of the 24 samples were considered. Relative to between-subject variation, no individual microbial species demonstrated statistically significant variation across sample collection methods after correction for multiple hypothesis testing (Benjamini–Hochberg α = 0.05) (18) (Fig. 2D). Similarly, sample handling method was not observed to have a statistically significant effect on the relative abundance of any individual genes (Fig. 2E). These findings are consistent with the strong within-subject, between-method agreements observed for DNA-level species and gene relative-abundance profiles in the correlation analyses described above (Fig. 2 A and B), and further suggest that—in addition to strong global agreement—individual metagenomic measurements are robust to subject-collected stool sample handling methods.
The effect of sample shipping on metatranscriptomics was comparably small, with only a very small minority (n = 84, <5% of total) of transcripts exhibiting statistically significant variation across sample handling methods (Fig. 2F and Dataset S1). The nature of these differentially abundant transcripts was consistent with a pattern of live cells responding to an altered environment via changes in gene regulation. For example, up-regulated genes in ethanol-fixed samples were largely involved in oxidative metabolic processes, a signal consistent with bacteria responding to a combination of oxygen exposure and a new carbon source. On the other hand, a subset of genes up-regulated in the RNAlater-fixed samples were involved in response to osmotic stress [e.g., the glycine betaine/proline transport system (19)], which is consistent with the high saline content of RNAlater solution. It is also possible that some transcripts experienced a sample handling method effect because of variation in RNA stability across the three storage conditions.
Comparison of Oral-Gut Microbial Ecology in the HPFS and Human Micobiome Project Cohorts.
After establishing the data quality of subject-collected samples, we next sought to meta-analyze the relationship between the oral and gut microbial communities in our own HPFS cohort and the larger healthy population of the Human Microbiome Project (HMP) (20) (Fig. 3A). In addition to characterizing potential microbial transit along the gastrointestinal tract, this contextualized our eight subjects within a broader population, as the HPFS participants were healthy but of both restricted geography (Boston metropolitan area) and age range (over 65). We identified a subset of 62 commonly occurring species in the eight frozen HPFS saliva and stool samples and compared their abundance profiles with 69 oral (tongue dorsum) and 81 stool samples from the HMP. As expected, differences in body-site specific ecology proved to be the largest effect in both cohorts, with HPFS and HMP stool samples forming a single, well-mixed cluster and HPFS saliva samples associated with but distinct from HMP oral metagenomes from the buccal mucosa and tongue dorsum (SI Appendix, Fig. S3). Whereas the compositions of the oral versus gut samples were largely distinct, we did observe a small number of species that occurred regularly at both body sites (Fig. 3A).
Fig. 3.
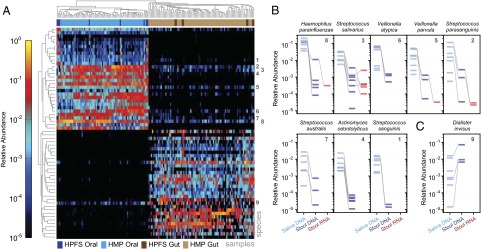
Oral-gut ecology in the HPFS and HMP cohorts. (A) We isolated species observed in the eight pairs of frozen stool and saliva samples from the HPFS cohort with relative abundance of at least 10−2 (1%) in two HPFS samples. The taxonomic profiles of these species were compared with stool and tongue samples from the HMP cohort, with tongue representing the oral community. Samples were clustered by Bray–Curtis distance, and species were clustered by rank correlation. Note that samples cluster strongly by body site (oral vs. gut). Highly abundant oral species are more likely to be detected at low levels in the gut. Green numbers associate oral-gut co-occurring species with detailed abundance profiles in B and C. (B) Eight abundant oral species detected in the HPFS saliva samples were detectable at low abundance in the stool samples from the same individuals, but showed minimal transcriptional activity in the stool. Gray lines connect oral DNA (light blue), gut DNA (dark blue), and gut RNA (red) from the same individual. (C) D. invisus is an unusual example of a gut-dominant species that also occurs in the oral cavity.
Detection of Oral Bacterial Strains in the Gut Microbiota.
Although the oral and gut environments are anatomically linked, the degree of exchange between their resident microbiota is not completely understood (21). Bacterial species from the oral community are carried along with food into the stomach, but the degree to which they survive or remain biologically active in the lower gastrointestinal tract has not been systematically characterized, particularly whether oral microbes contribute to the stable commensal gut community as measured by the stool. We first examined our frozen saliva and stool samples for cases of bacterial species co-occurring in the oral and gut communities of each subject. We defined a species as co-occurring if, for at least two subjects, the species occurred with relative abundance greater than 10−2 (1%) in a subject’s saliva sample and greater than 10−5 (0.001%) in the same subject’s frozen stool sample. Of 33 species meeting the first criterion (common oral species), eight met our criteria for detection in the stool: four members of the Streptococcus genus (Streptococcus salivarius, Streptococcus parasanguinis, Streptococcus australis, and Streptococcus sanguinis), along with Haemophilus parainfluenzae, Veillonella atypica, Veillonella parvula, and Actinomyces odontolyticus (Fig. 3B). For each of these species, the typical drop in relative abundance between the oral and gut communities was one-to-two orders-of-magnitude, with higher oral abundance generally corresponding to higher gut abundance. This finding suggests that, although DNA from these oral species does survive transit to the gut, it does not form a dominant component of that community.
If a small fraction of oral microbiome members do survive transit to the healthy gut, the gut metatranscriptome provides one means of assessing their active biological contribution to this community, albeit agnostic of their transcriptional activities at the oral site. Our metagenomic samples were assessed, among other methods, by mapping DNA reads to sets of species-specific marker genes using MetaPhlAn (16) (Methods). We applied the same procedure to RNA read data, in which case MetaPhlAn provides a profile of a subset of the metatranscriptome that can be unambiguously assigned to individual species. Based on this analysis, we found that when oral species were detectable in the gut at the DNA level, they rarely appeared to be transcriptionally active there. It was only in those cases where an oral species achieved its highest DNA abundance in the gut that its species-specific RNA was detected, and typically with relative abundance one-to-two orders-of-magnitude lower than the corresponding DNA abundance (some cases of RNA nondetection may correspond to exceptionally small, but still nonzero, RNA abundances that fell below our detection limit). As oral species’ abundances in the gut community were already multiple orders-of-magnitude lower than in the oral microbiome, this indicates that oral microbes that do survive transit to the gut are not stable, active contributors to its ecology.
Although this evidence is consistent with a pattern of abundant oral species passaging through the gut at low levels, co-occurrence could also be explained by separate strains of the same species adapted to the oral and gut environments. To evaluate whether oral and gut signatures of a species represent the same or different strains, we compared profiles of species-specific marker-gene presence and absence across subjects’ stool and saliva samples. These profiles capture gene gain and loss events in specific strains of a species and were used here as molecular “barcodes” for identifying or differentiating strains (Methods). Barcodes for common oral species often differed markedly across the eight saliva samples, indicating the presence of subject-specific strain variation (SI Appendix, Figs. S4–S11). However, in cases of within-subject oral-gut species co-occurrence, we rarely detected markers for a species in a subject’s stool sample that were not also seen in the subject’s saliva sample. This finding supports the hypothesis that oral-gut species co-occurrence is driven not by separate pools of niche-adapted strains of the same species, but instead by oral strains surviving transit to the gut in low quantities.
An even smaller number of abundant gut microbes occurred at appreciable levels in the oral community, the only significant example being Dialister invisus; this was true for samples from both the HMP and HPFS cohorts (Fig. 3C). There were three cases of D. invisus oral-gut co-occurrence among the eight HPFS subjects, and in each case the same strain was carried with high abundance in the stool and low abundance in the saliva (SI Appendix, Fig. S12). Curiously, despite its high DNA abundance in the gut, D. invisus made almost no contribution to the pool of species-specific transcripts, an indicator of reduced transcriptional activity (Fig. 3C and SI Appendix, Fig. S13). Of the remaining five subjects, four carried D. invisus exclusively in the oral community. This evidence resolves previously disparate ecologies for D. invisus, which was isolated from the human oral cavity (22) but also identifed as a marker for human stool (23), suggesting that it is atypically capable of persisting at high abundance in both the oral and gut communities and may freely transit between the two.
Relating Microbial Genes in the Gut at the DNA and RNA Levels.
We next investigated possible global models for metagenome vs. metatranscriptome regulation in the gut microbiota. Among the host-adapted microbes in this community, DNA and RNA abundances would be correlated if many genes were not differentially regulated and were transcribed at the same constant rate. This would be the case, for example, if typical gut microbe molecular activity was regulated by genome modifications over evolutionary time, as opposed to transcriptional regulation on a more rapid time scale. To test this theory, we quantified the relative abundances of genes and transcripts using HUMAnN (17) in the HPFS stool samples, with the Kyoto Encyclopedia of Genes and Genomes (KEGG) Orthogroups (KO) database as a reference set for gene families (Methods). Across all samples, a total of 3,292 KOs were observed with relative abundance of at least 10−4 (0.01%) at either the DNA or RNA level. Averaged over the eight frozen stool samples, we found that gene abundance and corresponding transcript abundance were well correlated (Spearman’s r = 0.76; two-tailed P ≪ 0.001) (Fig. 4).
Fig. 4.
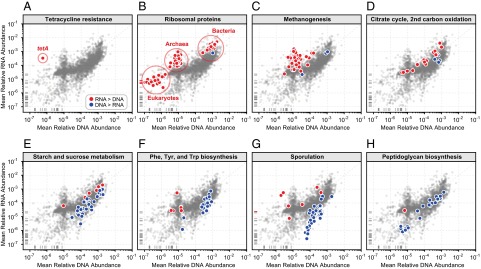
Up- and down-regulated pathways and clades in the gut metatranscriptome. Gene and transcript relative abundances are generally well correlated (Spearman’s r = 0.76). (A–H) Each scatterplot illustrates the average gene (DNA) and transcript (RNA) relative abundance for 3,292 KOs from the eight frozen HPFS stool samples, highlighting a prominent over- or underexpressed functional module. Red circles correspond to KOs where RNA > DNA; blue circles correspond to KOs where DNA > RNA. Marks on the x or y axis margins represent KOs with zero measured abundance in one dataset but nonzero abundance in the other. The trends illustrated here were all of large effect (fold-change > 2) and statistically significant following FDR correction (Methods).
To identify differentially regulated transcripts, we computed the log RNA/DNA abundance ratio for each gene on a subject-by-subject basis and then tested whether the mean of the eight log ratios was significantly different from zero following false-discovery rate (FDR) correction (indicating a pattern of consistent over- or underexpression) (Dataset S2). Although a substantial fraction of KOs were not consistently differentially regulated in the gut (nonsignificant fold-change or fold-change < 2; n = 1,340, 41%), we also observed many transcripts whose relative abundances were an order-of-magnitude higher or lower than expected from the DNA abundance of their corresponding gene families (significant fold-change > 10; n = 724, 22%) (Fig. 4). For example, tetA, which encodes a transporter protein conferring tetracycline resistance, was on average 1,000-times more abundant at the RNA level than the DNA level, one of the strongest such effects (one-sample t test, two-tailed P < 10−5) (Fig. 4A). We then used these rankings of gene-level expression as input to a functional enrichment analysis, searching for KEGG pathways and modules whose member genes (KOs) were enriched for consistent over- or underexpression (Fig. 4 and Dataset S3). All of the over- and underexpression relationships discussed in the following sections were both of large effect (fold-change > 2) and statistically significant following FDR correction (Methods).
Microbial genes encoding ribosomal proteins were among the most strongly overexpressed (Fig. 4B). Note that these are, of course, distinct from the ribosomal rRNAs depleted from metatranscriptomic assays (Methods). Indeed, we observed distinct clusters of ribosomal protein-coding gene overexpression across three domains of life, with bacterial ribosomal genes having the highest overall abundance, followed by archaeal ribosomal genes, and finally eukaryotic ribosomal genes detectable at the low end of DNA relative abundance. Notably, these archaeal ribosomal genes occurred as part of a “burst” of other highly expressed archaea-associated functions, including methanogenesis (Fig. 4C) and the archaeal RNA polymerase. This signal can be explained predominantly by the presence of the archaeon Methanobrevibacter smithii in five of the eight HPFS subjects. In these five subjects, the relative abundance of M. smithii at the DNA level ranged from 0.005 to 0.053 (0.5–5.3%), whereas its relative contribution to the pool of species-specific transcripts ranged from 0.021 to 0.147 (2.1–14.7%) (SI Appendix, Fig. S13). This finding confirms that M. smithii tends to be highly transcriptionally active relative to other species in the gut (9), an activity associated with its unique functional role in maintaining gut energy balance (24) by removal of hydrogen and correspondingly increased rates of fermentation among its bacterial neighbors (25). The second carbon oxidation step of the citrate cycle was also found to be highly overexpressed (Fig. 4D). Given that the vast majority of gut-dwelling bacteria are anaerobic (26), the observed overexpression of the citrate cycle is best explained by its role in replenishing biochemical intermediates, rather than its role in aerobic metabolism. This finding is consistent with the observation that only genes involved in one part of the cycle (reactions yielding oxaloacetate) were significantly overexpressed and emphasizes the need to avoid the blind application of broad pathway names to specific biochemical functions observed in the microbiome.
Conversely, other metabolic routes were consistently underexpressed, including the metabolism of starch and sucrose (Fig. 4E). Moreover, many pathways involved in the biosynthesis of small metabolites tended to be expressed at relatively low levels (Fig. 4F), consistent with earlier findings (8). Because these compounds will have high bioavailability in the gut because of the host’s diet, it is logical that it would, in most cases, be more energetically favorable to import them rather than synthesizing them directly. Genes involved in sporulation were also strongly underexpressed (Fig. 4G). Sporulation is a stress-response mechanism used by Gram-positive bacteria to survive in nonideal conditions (e.g., nutrient depletion) and also plays a role in certain bacterial infections [e.g., Clostridium difficile (27)]. However, neither of these conditions is applicable to this cohort’s healthy human gut environments, with a presumably undisturbed baseline spore fraction, and hence it is not surprising that the sporulation pathway is underexpressed. Finally, we also observed peptidoglycan biosynthesis to be significantly underexpressed in the gut microbiome (Fig. 4H). Peptidoglycans are critical components of bacterial cells walls and have roles in the maintenance of cell shape and integrity (28). To perform those roles, peptidoglycan biosynthesis must be carefully regulated to coordinate with cellular growth (29). Consistent with this idea, we found that peptigoglycan biosynthesis transcription and ribosomal protein transcription were strongly correlated across species (Spearman’s r = 0.78; two-tailed P ≪ 0.001) (SI Appendix, SI Methods and Fig. S14). However, within species, ribosomal protein-coding genes tended to be overexpressed relative to their metagenomic abundance, whereas peptidoglycan biosynthesis tended to be underexpressed (consistent with the community-level trends seen in Fig. 4). This pattern may result from the fact that the end-products of ribosomal protein transcription are physical building blocks of the ribosome and need to be continuously synthesized, whereas the end-products of peptidoglycan biosynthesis transcription are enzymes that act on the building blocks of the cell wall (and may thus persist at smaller concentrations).
The Metatranscriptome Varies Significantly Among Subjects Despite Metagenomic Concordance.
Recent large-scale studies of the human microbiome have shown that, although taxonomic composition at a particular body site can differ dramatically from one individual to the next, functional composition tends to be much more conserved (20, 30). Indeed, we observed similar patterns in our metagenomic (DNA) data from the HPFS cohort. Although there was considerable variation in the 10 most abundant genera across the eight subjects (Fig. 5A), the 10 most abundant functional categories were very well conserved (Fig. 5B). However, when we examined the 10 most abundant functional categories as measured from metatranscriptomic (RNA) data, we found that they were noticeably more variable than their DNA-based counterparts, although still more conserved than genus-level taxonomic composition (Fig. 5C).
Fig. 5.
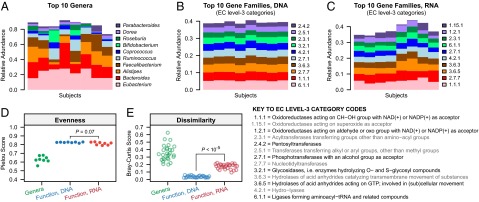
Functional diversity at the transcriptional level suggests a pattern of subject-specific metagenome regulation. (A) The 10 most abundant genera in each subject. (B) The 10 most abundant Enzyme Commission (EC) level-3 function categories in each individual, based on metagenomic measurements. (C) The 10 most abundant EC level-3 function categories in each individual, based on metatranscriptomic measurements. (D) Comparison of within-sample evenness for taxonomic and functional profiles across individuals using the Pielou metric. (E) Comparison of between-sample (β) diversity for taxonomic and functional profiles using the Bray–Curtis metric. Two-tailed P-values are based on the Wilcoxon signed-rank test. Although taxonomic profiles are highly variable among subjects, metagenomes are stable but differentially regulated at the transcriptional level.
To more rigorously quantify these observations, we computed within-subject evenness and between-subject dissimilarity for the taxonomic, DNA-level function, and RNA-level function composition for the eight frozen stool samples. Taxonomic composition was significantly less even than either DNA- or RNA-level functional composition, with a small number of (not always the same) genera dominating each individual’s gut microbiome (Wilcoxon signed-rank test, two-tailed P = 0.01) (Fig. 5D). Moreover, in line with our qualitative observation above, we found that between-subject variation in RNA-level functional composition was significantly stronger than between-subject variation in DNA-level functional composition (P < 10−5) (Fig. 5E). Thus, although subjects share a highly conserved gut metagenome derived from microbial contributors that are quite variable among subjects, its constituent functions are fine-tuned at the transcriptional level in a subject-specific manner.
Specific Pathways That Are Highly Variable at the Transcriptional Level.
The previous section highlighted that microbial function in the gut is considerably more variable at the metatranscriptomic (RNA) level than the metagenomic (DNA) level. To better understand the specific functions driving this variability, we computed the coefficient of variation for each gene family (KO) across the eight subjects at the DNA and RNA levels. We then ranked gene families by the ratio of their RNA coefficient of variation to DNA coefficient of variation (Dataset S4). This procedure highlights between-subject variation in transcript expression while factoring out the influence of (i) absolute expression level and (ii) variation in underlying gene copy number (DNA abundance). We used the list of transcripts ranked by expression variability to identify KEGG pathways and modules (31) that were enriched for differential regulation across subjects (Fig. 6 and SI Appendix, Fig. S15 and Dataset S5).
Fig. 6.

A subset of individual functional groups that are metagenomically stable but differentially transcribed between individuals. (A–C) In each example, the four most DNA-abundant genes from a functional module with strong between-subject expression variation are highlighted. RNA (red) and DNA (blue) measurements from the same individual are connected by gray lines. (D) The proteasome is an example of a functional module whose variability at the RNA level can be attributed largely to variation at the DNA level, rather than differential expression.
Genes encoding protein components of the bacterial ribosome were among the most variable at the RNA level (Fig. 6A). As shown above, these genes were also among the most highly and consistently overexpressed in our dataset (Fig. 4A). The magnitudes of these genes’ normalized RNA-level expression variability were driven in large part by their highly conserved abundances at the DNA-level. We expect this to be the case for genes that are extremely well conserved across species, as is the case for ribosomal genes. This represents the simplest route by which metagenomic stability can be achieved in that if every bacterial cell contributes a copy of a gene, the gene’s relative abundance depends only on the average number of genes per bacterial cell, which may be relatively conserved across subjects. Chaperone-coding genes also tended to be highly variably expressed across subjects, which could, for example, be because of variation in cellular stress conditions across samples (Fig. 6B). Like ribosomal proteins, chaperones are highly conserved across bacterial species [the four examples in Fig. 6C are encoded in the genomes of >99% of commonly occurring gut species (31)]. Notably, the chaperone signal is relatively consistent across the three sample handling methods (SI Appendix, Fig. S15).
Metagenomic stability can also occur in the absence of strong gene or pathway conservation across bacterial species. For example, enzymes involved in uronic acid metabolism are found in only 10–30% of commonly occurring gut species, but their overall metagenomic abundance was relatively stable across subjects (Fig. 6C). This finding suggests that there exists a niche in the human gut for metabolizing uronic acids (a class of sugars derived from proteoglycans) that is differentially filled by distinct subsets of each individual’s microbiome. Like ribosomal protein- and chaperone-coding genes, genes involved in uronic acid metabolism were also found to be variably transcribed across subjects, perhaps because of variation in the subject’s dietary patterns. As a final example, proteasome-associated genes are less broadly conserved across bacteria, but are common among archaea (Fig. 6D) (32). Although the abundance of proteasome-associated transcripts was highly variable at the RNA level, this variation was largely attributable to differences in the DNA-level abundance of their associated genes across subjects (i.e., unlike the previous examples, this functional module was not conserved at the metagenomic level). This finding further underscores the usefulness of combined metagenomic and metatranscriptomic sequencing: only by considering these two types of data simultaneously can we accurately distinguish variability in community-level transcriptional control from underlying variation in community structure.
Discussion
These results have validated a novel self-collected, self-shipped gut microbiome sample collection method as providing representative metagenomic and metatranscriptomic profiles from large human cohorts, such as the HPFS. This method extends previous scalable sample collection methods focused on amplicon profiling to allow shotgun DNA and, critically, RNA sequencing. Providing a means by which subjects can collect samples at home and mail them to analysis centers greatly improves the privacy, convenience, and feasibility of the collection process relative to laboratory-based or frozen collection. We expect this method to have a marked effect on rates of volunteerism in microbiome studies, increasing both the size of study populations and their ability to provide serial samples longitudinally over time. Allowing samples to be shipped at ambient temperature further enhances the geographical range that can be effectively incorporated. Although our results are focused on the oral and gut microbiota (via saliva and stool samples), the validation framework we present here is extensible and highly applicable to other microbial communities and their associated sampling efforts (e.g., human body sites outside of the gastrointestinal tract and environmental samples).
In addition to validating methods for microbiome sample collection, to our knowledge this work represents one of the first efforts to probe the functional activity of the human gut microbiome via combined metagenomic and metatranscriptomic sequencing. This approach produced the striking finding that more than half of the variation in microbial community gene expression can be explained by metagenomic composition (Spearman’s r = 0.76; r2 = 0.58 = 58%). In other words, a gene family’s copy number in the community appears to be the (slightly) dominant determinant of the abundance of its corresponding transcript. Microbial gene expression is no doubt influenced by many other factors, such as variation in the gene’s promoter strength across genomes (strains) and the regulatory states of cells within and across species. However, our results indicate that these factors are on par with genome content in dictating the metatranscriptome composition of the healthy human gut. Notably, our observation of strong correlation between metagenomic and metatranscriptomic composition is consistent with the majority of genes across the majority of microbial genomes being transcribed at similar, relatively fixed rates, a reasonable null model for a community of single-celled organisms well-adapted to their environment. Significant deviations from this model are indicative of finer-level transcriptional control occurring within the microbiome, and can be divided into two types, both of which were observed in this study: (i) consistent up- or down-regulation of a function across individuals, and (ii) regulation that varies in a subject-specific manner.
We observed many examples of gene families that were metagenomically abundant but consistently down-regulated at the transcriptional level. The relative functional importance of such genes to the healthy human gut will tend to be overestimated by metagenomics-only approaches. However, the fact that such functions persist in the gut microbial community’s reservoir of functional potential suggests that they are selectively advantageous under conditions not captured by this study. For example, although sporulation was inactivated in these healthy subjects with, presumably, a fully populated spore component, this pathway persists as a survival mechanism to be activated in response to stress, starvation, or perturbation of the existing spore population (as might occur subsequent to antibiotic treatment). Conversely, a small number of functional modules were consistently transcriptionally activated well beyond their metagenomic abundance, and will tend to be underestimated by metagenomics-only approaches. This was particularly the case for methanogenesis, which demonstrated transcriptional abundance one-to-two orders-of-magnitude greater than its metagenomic abundance. This pathway is particularly important in that it both overexpresses a highly targeted metabolic capacity and emphasizes the significant role of a particular phylogenetic group, the methanogenic archaea, in the gut community of some subjects (24), including their proposed role in directing the metabolic programs of other microbial species, and thus altering host phenotype (33). Combined DNA and RNA sequencing of the gut microbiota thus provides at least two new insights inaccessible by DNA sequencing alone: identifying organisms or pathways differentially regulated on a rapid time scale in response to dynamic aspects of the gut environment, and identifying those whose DNA-level contribution alone (high or low) is not a complete reflection of their role in the community.
Metatranscriptomic data further provide a new lens through which to investigate human hosts, in addition to insights about microbial biomolecular activity. In addition to interspecies and cell–cell transcriptional variation, some transcriptional variation was attributable to systematic under- or overexpression of functions among individuals. This subject-specific transcriptional fine-tuning is particularly intriguing in light of the pattern of strong conservation (lack of variation) we observed in functional potential (metagenomes) between individuals. The inclusion in this category of functions, such as ribosomal synthesis and chaperone activity, are indicative of communities responding to subject-specific environments via changes in growth rate and stress response, respectively. Moreover, subject-specific variation in specific metabolite processing pathways (e.g., up- or down-regulation of uronic acid utilization) may indicate responses to subjects’ dietary patterns. Critically, these observations suggest that transcriptional control in mixed-species microbial communities may operate comparably to that of our own genome. We all possess much the same genome, although the proportionally small differences are critical; similarly, microbial metagenomes are significantly similar among subjects, with small but important differences (20, 34). However, just as distinct tissues in the human body take on radically different phenotypes by altering the expression of this common set of genes, distinct microbial niches may fine-tune behavior by altering expression of similar underlying metagenomes.
Subject-specific metatranscriptomic variation, like single organism transcriptional regulation, can be divided into three components: (i) variation that is constant over time, (ii) short-term variation responding to fluctuations in the environment, and (iii) intercellular stochasticity. Our observation that over- or underexpression of related functional components is often consistent within individuals but variable between them suggests that the variation we observe cannot be explained by stochastic fluctuations alone (SI Appendix, Fig. S15). However, from a single cross-sectional measurement this study cannot determine whether variation across individuals represents a pattern of microbes adapting to their host over the long term, or short-term fluctuations around an otherwise conserved state (for example, response to the subject’s most recent meal). It is also possible that the variation we observe represents a combination of these two effects. Taking advantage of these new methods to track microbial transcription in individuals over time, or before and after application of a dietary stimulus, will provide an important future means for disentangling the contributions of short- versus long-term regulatory changes in the gut and other human-associated microbial ecosystems.
Methods
In summary, eight male subjects provided self-collected stool and saliva samples for shotgun metagenomic and metatranscriptomic sequencing. To evaluate the effects of sample handling method on meta’omic assays, each stool sample was subdivided to produce three aliquots: a fresh frozen control sample, a sample fixed in ethanol, and a sample fixed in RNAlater. In addition, the ethanol- and RNAlater-fixed samples were left exposed to the ambient environment for 48 h to simulate the effects of carrier transport (“mock-shipping”). DNA was extracted from all samples, and RNA was additionally extracted from all stool samples and converted to cDNA. All samples were then sequenced by Illumina HiSeq and the resulting reads filtered to identify high-quality microbial DNA and RNA sequences. This sequence information was used to profile the taxonomic and functional composition of each sample, allowing us to quantitatively compare within and between subjects: (i) stool samples subjected to different sample handling methods (by correlation and two-way ANOVA); (ii) saliva and stool microbial community structure (by hierarchical clustering, ordination, and strain-level profiling); and (iii) stool DNA- and RNA-level functional signatures (by differential expression and functional enrichment analysis). Details of these analyses are described in the following sections.
HPFS Cohort and Subject Recruitment.
We recruited the eight individuals sampled in this study from the Health Professionals Follow-up Study, a prospective cohort of 51,529 United States male dentists (58%), veterinarians (20%), pharmacists (8%), optometrists (7%), osteopathic physicians (4%), and podiatrists (3%), aged 40–75 y at enrollment, who returned a mailed health questionnaire in 1986 (www.hsph.harvard.edu/hpfs). Every 2 y, participants have completed comprehensive questionnaires with updated information on their lifestyle and medical history, with a follow-up rate exceeding 90%. In the spring of 2010, 210 active HPFS participants with current addresses in the greater Boston area were mailed a short questionnaire to assess their interest in providing stool and saliva samples for a pilot investigation of diet and gastrointestinal microbiota. We received positive responses from 75% of participants. From among these participants, we selected 63 men who represented extremes of Western versus prudent dietary intake and sent them kits for self-collection of saliva and stool at home. Subject recruitment and protocols were approved by the Harvard School of Public Health Institutional Review Board.
Sample Collection.
Saliva samples were collected using the self-collection kit Oragene-DNA OG-500 (DNA Genotek) and accompanying instructions. For the stool collection, we took advantage of an established protocol well-received in the HMP cohort, providing us with starting sample material comparable to previous studies (14). Stool was self-collected by deposition in a commode specimen collection system (catalog 02–544-208, Fisher Scientific). Both the saliva and stool samples were placed by the subject in a styrofoam box with frozen icepacks for pick-up by a member of our study team and delivery to our laboratory within 24 h of sample collection. We independently evaluated the effects of this initial transport protocol on stool metagenomes and metatranscriptomes by sequencing DNA and RNA from aliquots of a fresh stool sample that had been (i) immediately flash-frozen versus (ii) incubated on ice for 24 h (SI Appendix, SI Methods and Fig. S1). Participants also completed a brief questionnaire to report their recent diet and other pertinent exposures that may affect specimen composition, including recent consumption of antibiotics or probiotics or the use of oral hygiene products. The sample collection period ran from February to July 2011, during which time we collected samples from 25 participants. From among these participants, we randomly selected complete samples from eight men for this analysis.
Laboratory Procedures.
Upon receipt at the laboratory, saliva tubes were frozen to −80 °C. The stool samples were homogenized using a spatula and separated into three aliquots (fresh-frozen control, mock-shipped RNAlater-fixed, and mock-shipped ethanol-fixed). The homogenization step was intended to reduce between-aliquot variability for the purposes of our methods evaluation; subjects using the self-collection and self-shipping protocol validated here would not be required to homogenize their stool. The first 100-mg subsample (control) was flash-frozen on dry ice and then stored at −80 °C until being thawed for extraction. The control aliquot represented the baseline composition of the sample upon arrival at the laboratory, following the initial HMP-based sample collection and transport protocol described above. To a second 100-mg subsample we added 700 μL of RNAlater (Ambion) and then allowed the mixture to fix at −4 °C overnight. A third 1-g subsample was collected using a feces tube with spatula (catalog 80.623.022, Sarstedt), to which we added 5 mL of 95% (wt/wt) ethanol and allowed the mixture to fix at room temperature overnight. The stool masses described above were acquired by taking a single scoop with a corresponding collection spatula, just as subjects would do when following the proposed self-collection protocol. Ethanol- and RNAlater-fixed subsamples were then stored at −80 °C until all samples were ready for the mock-shipping stage of the experiment. During mock-shipping, all ethanol- and RNA-later fixed samples were transferred to a cardboard box and subjected to natural environmental condition changes (at ambient temperatures) for 48 h to mimic conditions during carrier or mail transport. After this phase, mock-shipped samples were then stored at −80 °C until extraction; the frozen control and RNAlater-fixed subsamples entered the extraction pipeline directly, whereas the ethanol-fixed subsamples were first sliced to yield 100 mg of stool.
DNA and RNA Extraction and Sequencing.
For saliva samples, DNA was extracted using procedures established for the Human Microbiome Project (14). Stool samples in RNAlater and ethanol were centrifuged at maximum speed for 10 min and the supernatant removed. DNA and RNA were extracted and processed following the protocol established in ref. 35. Briefly, bacterial lysis buffer containing lysozyme and proteinase K was added to ∼100 mg of stool sample, incubated for 10 min, followed by 3 min of bead beating to extract the nucleic acids. Qiagen AllPrep DNA spin columns were used for RNA and DNA isolation following the manufacturer’s protocol (Qiagen). Illumina DNA-seq libraries were generated as previously described (36) with the following modifications. For each sample, 100 ng of genomic DNA was sheared to 150–300 bp in size using a Covaris LE220 instrument (Covaris) with the following parameters: temperature: 7–9 °C; duty cycle: 20%; intensity: 5; cycles per burst: 200; time: 90 s; shearing tubes: Crimp-Cap microTUBES with AFA fibers (Covaris). DNA fragments were end-repaired, 3′-adenylated, ligated with indexed Illumina sequencing adapter, and PCR-enriched, as previously described (37). The resulting Illumina fragment sequencing libraries were size-selected to contain inserts of 180 bp ± 3% in length using a Pippen Prep system (Sage Science) following the manufacturer’s recommendations.
For RNA-seq libraries, 5 μg of initial RNA was depleted for ribosomal RNA using Ribo-Zero (Epicentre), subjected to DNase treatment to deplete remaining sample DNA, fragmented, and then used as a template for strand-specific cDNA synthesis by dUTP marking and degradation of second strand cDNA (35). This procedure has been known to introduce 1–2% Escherichia coli genomic DNA into the final cDNA library (a result of E. coli-derived DNA polymerase I and ligase being used in the cDNA generation steps). Including versus excluding E. coli sequences in downstream bioinformatic analyses did not affect the conclusions of this work. RIN scores for all metatranscriptomic samples are provided in SI Appendix, Table S1. The average RIN score over all samples was 6.9, whereas the averages for the control, EtOH-fixed, RNAlater-fixed batches were 5.7, 7.0, and 7.8, respectively.
All DNA-based samples were then sequenced by Illumina HiSeq, with each DNA sample run on a single sequencing lane, and each RNA (cDNA) sample run on a pair of sequencing lanes. Raw sequences were then filtered to remove human sequence contamination, quality trimmed, and depleted of duplicate reads also using HMP protocols (14). Sequences from paired RNA sample lanes were merged before downstream analyses. Fig. 1 reports average sequence statistics for all raw and postprocessed samples. Sequence data are available for download from the Sequence Read Archive with accession no. PRJNA188481.
Taxonomic and Functional Profiling.
We performed taxonomic profiling with MetaPhlAn (16). Briefly, MetaPhlAn operates by mapping raw sequence reads to a database of predefined clade-specific marker genes. Markers are those genes occurring in isolates from a particular clade but not outside of that clade. After mapping reads to clade-specific marker genes, the resulting raw counts are normalized for total marker-gene length and outliers, yielding profiles of (i) clade relative abundance, (ii) marker-gene presence/absence, and (iii) marker gene abundance (in RPKM units). Because of gene gain and loss events, an individual strain will not necessarily carry all of the markers associated with its corresponding species. A specific pattern of marker presence and absence can therefore be used as a molecular “barcode” to identify a strain across samples. Examples of MetaPhlAn-based strain barcodes are illustrated in SI Appendix, Figs. S4–S12. We defined “commonly occurring species” to be those detected with relative abundance of at least 10−2 (1%) in at least two of our eight subjects.
When applying MetaPhlAn to RNA read data, the output is a profile of relative marker gene transcription across clades (focusing on species-level measurements in this work). A species’ value in this profile depends on two factors: (i) its overall genomic abundance in the sample, and (ii) the average transcriptional level of its unique marker genes. Notably, only the first criterion matters when quantifying species abundance at the DNA level, as each marker gene is expected to occur at equal frequency after normalization. If a species has higher RNA-based abundance than DNA-based abundance, this suggests that its marker genes are more actively transcribed than marker genes from other species, which we can interpret as an approximate measure of the species’ clade-specific transcriptional activity. Notably, this measure can only approximate a species’ overall transcriptional activity, as the species’ unique marker genes may be more or less actively transcribed than other pathways (which includes many nonunique genes; e.g., ribosomal RNAs).
We performed functional profiling of genes and transcripts using HUMAnN (17) based on the KEGG database of gene families and pathways (31). This procedure involved first mapping quality- and human-filtered DNA and RNA reads from a meta’omic sample to protein-coding sequences from the KEGG Orthology using USEARCH (38). We then used HUMAnN to collapse the output of this mapping step to produce a table of relative abundances for all KOs. When the input to USEARCH and HUMAnN are DNA read data, the resulting functional profile describes the relative abundance of gene families in the sample; when RNA read data are used as the input, the profile instead quantifies the corresponding transcripts of these gene families. If a gene family or its corresponding transcript is never observed with relative abundance above 10−4 (0.01%) across all samples, then it is merged into an “other” category and excluded from subsequent statistical analysis.
Samples were additionally profiled by mapping reads against a collection of reference genomes (SI Appendix, SI Methods). Raw mapping results for the eight control stool metagenomes and metatranscriptomes are provided as Dataset S6.
Statistical Analysis Details.
Relative abundance values were arcsine square root-transformed before performing ANOVA calculations to variance-stabilize data and better approximate normality. Before computing the RNA/DNA abundance log ratios and RNA- and DNA-level coefficients of variation, all KO-based relative abundance measurements for a sample were smoothed by the Witten–Bell method (39). This procedure calculates the probability mass likely to have been nonobserved because of low frequency events and evenly distributes it over all nonobserved genes in each sample. This method can in many cases provide an accurate way to avoid numerical irregularities, such as dividing a small RNA abundance by zero DNA abundance. The size of the additional probability mass is equal to the number of “first observations” over all detected KOs divided by the total number of observations, which is approximated as the reciprocal of the smallest nonzero relative abundance. This procedure was only applied to genes detected with a relative abundance of at least 10−4 (0.01%) in at least one sample.
We tested sets of log ratios for significant deviation from zero using one-sample t tests. We subjected nominal two-tailed P values to FDR correction following the Benjamini–Hochberg method with α = 0.05 (18) (Dataset S2). Lists of genes ranked by mean RNA/DNA relative abundance ratio across the eight subjects were further tested for KEGG pathway and module enrichment. Treating pathways and modules as unstructured genesets, we evaluated whether each set was enriched at the top or bottom of the ranked gene list using a Mann–Whitney U test, comparing the ratios of genes in the set to those outside the set (Dataset S3). The same procedure was later applied to genes ranked by mean RNA-level coefficient of variation normalized by DNA-level coefficient of variation (Datasets S4 and S5). Nominal two-tailed P values for geneset enrichments were FDR-corrected following the same procedure applied to individual genes.
Supplementary Material
Acknowledgments
We thank the participants in the Health Professionals Follow-up Study who graciously participated in this research; Elizabeth Frost-Hawes, Jill Arnold, and Siobhan Saint-Surin at the Harvard School of Public Health, who assisted with recruitment for this study; and James Bocchichio, Doyle Ward, Kimberly Kanki, Scott Mahan, and Erin Euler at the Broad Institute for their assistance in project logistics, sample handling, and nucleic acid extractions. This work was supported by National Institutes of Health (NIH) National Institute of Allergy and Infectious Diseases Contract HHSN272200900018C (to the Broad Institute); Grant CA166150 (to J.I.); Grants NIH R01 CA137178, P30 DK043351, and P50 CA127003, and an American Gastroenterological Association Gut Microbiome Pilot Research award (to A.T.C.); Danone Research PLF-5972-GD (to W.S.G.); NIH Grant R01 HG005969, National Science Foundation Grant DBI-1053486, Army Research Office Grant W911NF-11-1-0473, and a Center for the Study of Inflammatory Bowel Disease Pilot Study grant (to C.H.); and in part by the generous support of the Eric Larson and Barbara Wu Trust. A.T.C. is a Damon Runyon Clinical Investigator.
Footnotes
The authors declare no conflict of interest.
This article is a PNAS Direct Submission.
Data deposition: Sequence data are available for download from the NCBI Sequence Read Archive database and are grouped as NCBI BioProject PRJNA188481.
This article contains supporting information online at www.pnas.org/lookup/suppl/doi:10.1073/pnas.1319284111/-/DCSupplemental.
References
- 1.Morgan XC, Huttenhower C. Chapter 12: Human microbiome analysis. PLOS Comput Biol. 2012;8(12):e1002808. doi: 10.1371/journal.pcbi.1002808. [DOI] [PMC free article] [PubMed] [Google Scholar]
- 2.Maurice CF, Haiser HJ, Turnbaugh PJ. Xenobiotics shape the physiology and gene expression of the active human gut microbiome. Cell. 2013;152(1-2):39–50. doi: 10.1016/j.cell.2012.10.052. [DOI] [PMC free article] [PubMed] [Google Scholar]
- 3.Smith MI, et al. Gut microbiomes of Malawian twin pairs discordant for kwashiorkor. Science. 2013;339(6119):548–554. doi: 10.1126/science.1229000. [DOI] [PMC free article] [PubMed] [Google Scholar]
- 4.Gilbert JA, et al. Detection of large numbers of novel sequences in the metatranscriptomes of complex marine microbial communities. PLoS ONE. 2008;3(8):e3042. doi: 10.1371/journal.pone.0003042. [DOI] [PMC free article] [PubMed] [Google Scholar]
- 5.Shi Y, Tyson GW, DeLong EF. Metatranscriptomics reveals unique microbial small RNAs in the ocean’s water column. Nature. 2009;459(7244):266–269. doi: 10.1038/nature08055. [DOI] [PubMed] [Google Scholar]
- 6.Frias-Lopez J, et al. Microbial community gene expression in ocean surface waters. Proc Natl Acad Sci USA. 2008;105(10):3805–3810. doi: 10.1073/pnas.0708897105. [DOI] [PMC free article] [PubMed] [Google Scholar]
- 7.Booijink CC, et al. Metatranscriptome analysis of the human fecal microbiota reveals subject-specific expression profiles, with genes encoding proteins involved in carbohydrate metabolism being dominantly expressed. Appl Environ Microbiol. 2010;76(16):5533–5540. doi: 10.1128/AEM.00502-10. [DOI] [PMC free article] [PubMed] [Google Scholar]
- 8.Gosalbes MJ, et al. Metatranscriptomic approach to analyze the functional human gut microbiota. PLoS ONE. 2011;6(3):e17447. doi: 10.1371/journal.pone.0017447. [DOI] [PMC free article] [PubMed] [Google Scholar]
- 9.Turnbaugh PJ, et al. Organismal, genetic, and transcriptional variation in the deeply sequenced gut microbiomes of identical twins. Proc Natl Acad Sci USA. 2010;107(16):7503–7508. doi: 10.1073/pnas.1002355107. [DOI] [PMC free article] [PubMed] [Google Scholar]
- 10.McNulty NP, et al. The impact of a consortium of fermented milk strains on the gut microbiome of gnotobiotic mice and monozygotic twins. Sci Transl Med. 2011;3(106):ra106. doi: 10.1126/scitranslmed.3002701. [DOI] [PMC free article] [PubMed] [Google Scholar]
- 11.Börnigen D, et al. Functional profiling of the gut microbiome in disease-associated inflammation. Genome Med. 2013;5(7):65. doi: 10.1186/gm469. [DOI] [PMC free article] [PubMed] [Google Scholar]
- 12.Muller EE, Glaab E, May P, Vlassis N, Wilmes P. Condensing the omics fog of microbial communities. Trends Microbiol. 2013;21(7):325–333. doi: 10.1016/j.tim.2013.04.009. [DOI] [PubMed] [Google Scholar]
- 13.Morgan XC, Segata N, Huttenhower C. Biodiversity and functional genomics in the human microbiome. Trends Genet. 2013;29(1):51–58. doi: 10.1016/j.tig.2012.09.005. [DOI] [PMC free article] [PubMed] [Google Scholar]
- 14.Human Microbiome Project Consortium A framework for human microbiome research. Nature. 2012;486(7402):215–221. doi: 10.1038/nature11209. [DOI] [PMC free article] [PubMed] [Google Scholar]
- 15.Arumugam M, et al. MetaHIT Consortium Enterotypes of the human gut microbiome. Nature. 2011;473(7346):174–180. doi: 10.1038/nature09944. [DOI] [PMC free article] [PubMed] [Google Scholar]
- 16.Segata N, et al. Metagenomic microbial community profiling using unique clade-specific marker genes. Nat Methods. 2012;9(8):811–814. doi: 10.1038/nmeth.2066. [DOI] [PMC free article] [PubMed] [Google Scholar]
- 17.Abubucker S, et al. Metabolic reconstruction for metagenomic data and its application to the human microbiome. PLOS Comput Biol. 2012;8(6):e1002358. doi: 10.1371/journal.pcbi.1002358. [DOI] [PMC free article] [PubMed] [Google Scholar]
- 18.Benjamini Y, Hochberg Y. Controlling the false discovery rate: A practical and powerful approach to multiple testing. J R Stat Soc Series B Stat Methodol. 1995;57(1):289–300. [Google Scholar]
- 19.Lucht JM, Bremer E. Adaptation of Escherichia coli to high osmolarity environments: Osmoregulation of the high-affinity glycine betaine transport system proU. FEMS Microbiol Rev. 1994;14(1):3–20. doi: 10.1111/j.1574-6976.1994.tb00067.x. [DOI] [PubMed] [Google Scholar]
- 20.Human Microbiome Project Consortium Structure, function and diversity of the healthy human microbiome. Nature. 2012;486(7402):207–214. doi: 10.1038/nature11234. [DOI] [PMC free article] [PubMed] [Google Scholar]
- 21.Segata N, et al. Composition of the adult digestive tract bacterial microbiome based on seven mouth surfaces, tonsils, throat and stool samples. Genome Biol. 2012;13(6):R42. doi: 10.1186/gb-2012-13-6-r42. [DOI] [PMC free article] [PubMed] [Google Scholar]
- 22.Downes J, Munson M, Wade WG. Dialister invisus sp. nov., isolated from the human oral cavity. Int J Syst Evol Microbiol. 2003;53(Pt 6):1937–1940. doi: 10.1099/ijs.0.02640-0. [DOI] [PubMed] [Google Scholar]
- 23.Jeong JY, Park HD, Lee KH, Weon HY, Ka JO. Microbial community analysis and identification of alternative host-specific fecal indicators in fecal and river water samples using pyrosequencing. J Microbiol. 2011;49(4):585–594. doi: 10.1007/s12275-011-0530-6. [DOI] [PubMed] [Google Scholar]
- 24.Samuel BS, et al. Genomic and metabolic adaptations of Methanobrevibacter smithii to the human gut. Proc Natl Acad Sci USA. 2007;104(25):10643–10648. doi: 10.1073/pnas.0704189104. [DOI] [PMC free article] [PubMed] [Google Scholar]
- 25.Stams AJ. Metabolic interactions between anaerobic bacteria in methanogenic environments. Antonie van Leeuwenhoek. 1994;66(1-3):271–294. doi: 10.1007/BF00871644. [DOI] [PubMed] [Google Scholar]
- 26.Vedantam G, Hecht DW. Antibiotics and anaerobes of gut origin. Curr Opin Microbiol. 2003;6(5):457–461. doi: 10.1016/j.mib.2003.09.006. [DOI] [PubMed] [Google Scholar]
- 27.Rupnik M, Wilcox MH, Gerding DN. Clostridium difficile infection: New developments in epidemiology and pathogenesis. Nat Rev Microbiol. 2009;7(7):526–536. doi: 10.1038/nrmicro2164. [DOI] [PubMed] [Google Scholar]
- 28.Vollmer W, Blanot D, de Pedro MA. Peptidoglycan structure and architecture. FEMS Microbiol Rev. 2008;32(2):149–167. doi: 10.1111/j.1574-6976.2007.00094.x. [DOI] [PubMed] [Google Scholar]
- 29.Typas A, Banzhaf M, Gross CA, Vollmer W. From the regulation of peptidoglycan synthesis to bacterial growth and morphology. Nat Rev Microbiol. 2012;10(2):123–136. doi: 10.1038/nrmicro2677. [DOI] [PMC free article] [PubMed] [Google Scholar]
- 30.Turnbaugh PJ, et al. A core gut microbiome in obese and lean twins. Nature. 2009;457(7228):480–484. doi: 10.1038/nature07540. [DOI] [PMC free article] [PubMed] [Google Scholar]
- 31.Kanehisa M, Goto S, Sato Y, Furumichi M, Tanabe M. KEGG for integration and interpretation of large-scale molecular data sets. Nucleic Acids Res. 2012;40(Database issue):D109–D114. doi: 10.1093/nar/gkr988. [DOI] [PMC free article] [PubMed] [Google Scholar]
- 32.De Mot R, Nagy I, Walz J, Baumeister W. Proteasomes and other self-compartmentalizing proteases in prokaryotes. Trends Microbiol. 1999;7(2):88–92. doi: 10.1016/s0966-842x(98)01432-2. [DOI] [PubMed] [Google Scholar]
- 33.Samuel BS, Gordon JI. A humanized gnotobiotic mouse model of host-archaeal-bacterial mutualism. Proc Natl Acad Sci USA. 2006;103(26):10011–10016. doi: 10.1073/pnas.0602187103. [DOI] [PMC free article] [PubMed] [Google Scholar]
- 34.Costello EK, et al. Bacterial community variation in human body habitats across space and time. Science. 2009;326(5960):1694–1697. doi: 10.1126/science.1177486. [DOI] [PMC free article] [PubMed] [Google Scholar]
- 35.Giannoukos G, et al. Efficient and robust RNA-seq process for cultured bacteria and complex community transcriptomes. Genome Biol. 2012;13(3):R23. doi: 10.1186/gb-2012-13-3-r23. [DOI] [PMC free article] [PubMed] [Google Scholar]
- 36.Bentley DR, et al. Accurate whole human genome sequencing using reversible terminator chemistry. Nature. 2008;456(7218):53–59. doi: 10.1038/nature07517. [DOI] [PMC free article] [PubMed] [Google Scholar]
- 37.Fisher S, et al. A scalable, fully automated process for construction of sequence-ready human exome targeted capture libraries. Genome Biol. 2011;12(1):R1. doi: 10.1186/gb-2011-12-1-r1. [DOI] [PMC free article] [PubMed] [Google Scholar]
- 38.Edgar RC. Search and clustering orders of magnitude faster than BLAST. Bioinformatics. 2010;26(19):2460–2461. doi: 10.1093/bioinformatics/btq461. [DOI] [PubMed] [Google Scholar]
- 39.Witten IH, Bell TC. The zero-frequency problem: Estimating the probabilities of novel events in adaptive text compression. IEEE Trans Inf Theory. 1991;37(4):1085–1094. [Google Scholar]
Associated Data
This section collects any data citations, data availability statements, or supplementary materials included in this article.