

Abstract
Hematological traits are important clinical parameters. To test the role of rare and low-frequency coding variants on hematological traits, we analyzed hemoglobin, hematocrit, white blood cell (WBC) and platelet count in 31,340 individuals genotyped on an exome array. We identified several missense variants of CXCR2 associated with reduced WBC count (gene-based P=2.6×10⁻¹³). In a separate family-based re-sequencing study, we identified a novel loss-of-function CXCR2 frameshift mutation in a pedigree with congenital neutropenia that abolished ligand-induced CXCR2 signal transduction and chemotaxis. We also identified novel missense or splice site variants in key hematopoiesis regulators (EPO, TRF2, HBB, TUBB1, SH2B3) associated with blood cell traits. Finally, we were able to detect associations between the rare somatic JAK2 p.Val617Phe mutation and platelet count (P=3.9×10⁻²²) as well as hemoglobin (P=0.002), hematocrit (P=9.5×10⁻⁷) and WBC (P=3.1×10⁻⁵). In conclusion, exome arrays complement GWAS in identifying new variants that contribute to complex human traits.
The proliferation and differentiation of hematopoietic progenitor cells into mature blood cells is a tightly regulated process. Erythrocyte, white blood cell (WBC) and platelet counts are used in medicine as diagnostic and prognostic biomarkers. Inter-individual variation in quantitative blood cell traits is heritable and genome-wide association studies (GWAS) have implicated hundreds of loci1–3. The development of new genotyping arrays that target protein-coding variation offers new opportunities to assess the role of rare (defined here as minor allele frequency (MAF) <0.1%) and low-frequency (0.1% ≤ MAF < 1%) coding variants in human complex trait genetics. We genotyped 6,796 participants from the Montreal Heart Institute (MHI) Biobank and 18,018 women from the Women’s Health Initiative (WHI) on the Illumina HumanExome Beadchip, and analyzed associations between 183,585 polymorphic variants and four blood cell phenotypes: hemoglobin, hematocrit, WBC and platelet counts. We carried forward variants in 19 genes (gene-based P<1×10⁻⁴) and 42 single markers (with P<1×10⁻⁵ along with P<1×10⁻⁴ for coding variants in three strong candidate genes: PKLR, BUB1B and TUBB1) for validation of our top association results in 6,526 participants from the Study of Health in Pomerania (SHIP)(Supplementary Table 1). We identified six genetic associations for platelet count (TUBB1, SH2B3, JAK2), hematocrit/hemoglobin (EPO, HBB) and WBC (CXCR2) that met our predetermined exome-wide significance threshold (P<6.8×10⁻⁸ for single variant and P<3.9×10⁻⁷ for gene-based tests)(Supplementary Fig. 1–3, Tables 1–2 and Supplementary Tables 2–4). These findings highlight the role of rare and low-frequency coding variants in complex traits in large cohorts of apparently hematologically healthy individuals.
Table 1. New genome-wide significant variants associated with blood cell traits.
Variants that reach a P<6.8×10⁻⁸ in the combined analysis and are either outside the GWAS loci or independent of the GWAS sentinel SNPs for hematological traits. Sample size: Discovery MHI+WHI (N=24,814); Replication SHIP (N=6,526); Combined (N=31340). The direction of the effect sizes (Beta) is for the A1 allele. Effect sizes and standard errors (SE) are in the following units: for hematocrit (%), for hemoglobin (g/dl) and for platelet (x109/l). n.d.; not determined because the marker is monomorphic in SHIP. Genomic positions are on the human genome build hg19. bp; base pair. n.a.; not applicable.
| Variant | Chr (Pos) | A1/A2 | Stage | Freq (A1) | Beta (SE) | P | HeteroP | Gene | Annotation |
|---|---|---|---|---|---|---|---|---|---|
| HEMATOCRIT | |||||||||
| rs62483572 | 7:100,319,633 | A/G | Discovery | 0.0045 | −1.07 (0.21) | 3.5×10⁻⁷ | n.a. | EPO | Missense (p.Asp70Asn) |
| Replication | 0.0041 | −1.11 (0.40) | 0.0053 | n.a. | |||||
| Combined | n.a. | −1.08 (0.19) | 6.4×10⁻⁹ | 0.94 | |||||
| HEMOGLOBIN | |||||||||
| rs62483572 | 7:100,319,633 | A/G | Discovery | 0.0045 | −0.35 (0.07) | 9.5×10⁻⁷ | n.a. | EPO | Missense (p.Asp70Asn) |
| Replication | 0.0041 | −0.35 (0.14) | 0.011 | n.a. | |||||
| Combined | n.a. | −0.35 (0.06) | 3.4×10⁻⁸ | 0.96 | |||||
| rs33971440 | 11:5,248,159 | T/C | Discovery | 0.0002 | −2.41 (0.44) | 3.7×10⁻⁸ | n.a. | HBB | 5' donor splice site(exon2:c.92+1G>A) |
| Replication | Monomorphic | n.a. | |||||||
| Combined | n.d. | ||||||||
| PLATELETS | |||||||||
| rs77375493 | 9:5,073,770 | T/G | Discovery | 0.0005 | 124.09 (12.83) | 3.9×10⁻²² | n.a. | JAK2 | Missense (p.Val617Phe) |
| Replication | 0.0041 | 16.41 (8.61) | 0.057 | n.a. | |||||
| Combined | n.a. | 49.86 (7.15) | 3.1×10⁻¹² | 3.2×10⁻¹² | |||||
| rs1465788 | 14:69,263,599 | T/C | Discovery | 0.27 | −2.75 (0.58) | 2.1×10⁻⁶ | n.a. | n.a. | 639 bp upstream of ZFP36L1 |
| Replication | 0.27 | −3.06 (1.01) | 0.0024 | n.a. | |||||
| Combined | n.a. | −2.82 (0.50) | 1.9×10⁻⁸ | 0.78 | |||||
| rs41303899 | 20:57,598,808 | A/G | Discovery | 0.0016 | −27.70 (6.72) | 3.7×10⁻⁵ | n.a. | TUBB1 | Missense (p.Gly109Glu) |
| Replication | 0.0024 | −42.63 (9.07) | 2.7×10⁻⁶ | n.a. | |||||
| Combined | n.a. | −32.99 (5.40) | 9.9×10⁻¹⁰ | 0.19 | |||||
Table 2. Gene-based association results.
We list in this table genes that are exome-wide significant (P<3.9×10⁻⁷) or that have both strong statistical evidence and biological candidacy. The remaining gene-based results are in Supplementary Table 4. We analyzed association between rare non-synonymous (missense, nonsense) and splice site variants and blood cell traits using the Burden T1 and SKAT gene-based tests. When applicable, we also conditioned on GWAS sentinel SNPs or excluded low-frequency variants strongly associated with the traits.
| MHI+WHI (N=24,814) | SHIP (N=6,526) | Combined (N=31,340) | ||||||||
|---|---|---|---|---|---|---|---|---|---|---|
| Phenotype | Test | Gene | Number of variants |
P | PGWAS1 | Plowfreq2 | Number of variants |
P | Number of variants |
P |
| Hematocrit | SKAT | EPO | 5 | 4.6×10⁻⁵ | 1.0×10⁻⁴ | 0.13 | 4 | 0.033 | 5 | 1.4×10⁻⁶ |
| Hemoglobin | Burden T1 | HBB | 4 | 9.2×10⁻⁵ | n.a. | 0.031 | 2 | 0.23 | 5 | 4.3×10⁻⁵ |
| Hemoglobin | SKAT | EPO | 5 | 7.8×10⁻⁵ | 9.6×10⁻⁵ | 0.16 | 4 | 0.072 | 5 | 4.0×10⁻⁶ |
| White blood cell | Burden T1 | CXCR2 | 8 | 1.6×10⁻⁶ | n.a. | 8.2×10⁻⁴ | 6 | 8.3×10⁻⁹ | 8 | 2.6×10⁻¹³ |
| Platelet | SKAT | SH2B3 | 14 | 2.2×10⁻⁷ | 3.9×10⁻⁸ | 0.078 | 11 | 0.024 | 16 | 8.3×10⁻⁷ |
| Platelet | SKAT | TUBB1 | 13 | 2.2×10⁻⁵ | 3.1×10⁻⁵ | 0.018 | 8 | 2.9×10⁻⁴ | 14 | 6.7×10⁻¹⁰ |
For EPO, SH2B3, and TUBB1, we conditioned respectively on rs7385804, rs3184504, and rs6070697.
For EPO, we excluded rs62483572, for HBB, we excluded rs33971440, for CXCR2, we excluded rs61733609, for SH2B3, we excluded rs72650673, and for TUBB1, we excluded rs41303899. n.a.; not applicable.
We found an association between a low-frequency missense variant (MAF=0.45%) in the erythropoietin gene EPO (rs62483572, p.Asp70Asn), that encodes the main cytokine that controls erythrocyte production, and lower hematocrit and hemoglobin levels (Fig. 1A and Table 1). Carriers of the EPO missense variant had 0.35 g/dl lower hemoglobin and 1% lower hematocrit compared to non-carriers. To our knowledge, the p.Asp70Asn variant is the first naturally-occurring EPO coding variant associated with any hematologic phenotype. In the mature EPO protein, p.Asp70Asn (amino acid 43 after cleavage of the signal peptide) is part of the high-affinity receptor binding site (Supplementary Fig. 4)4. Rare, gain-of-function coding variants of the erythropoietin receptor gene (EPOR) have been associated with familial erythrocytosis5. EPO is located near transferrin receptor 2 (TFR2), a gene important for iron transport and hemoglobin production. Non-coding SNPs in the TFR2-EPO region are associated with red blood cell phenotypes3. Conditional analysis on the sentinel SNP TRF2-rs7385804 indicated that the rare missense variant in EPO is independently associated with hematocrit and hemoglobin (Fig. 1A). This conditional analysis also identified a low-frequency 5’ donor splice site variant of TFR2 (rs139178017) independently associated with higher hematocrit and hemoglobin (Fig. 1A and Supplementary Table 2). Other TRF2 splice site variants have been reported in patients with atypical (HFE mutation negative) hemochromatosis6,7.
Figure 1.

Association results in the meta-analysis MHI+WHI (N=24,814) for (A) hematocrit at the TFR2-EPO locus on chromosome 7 and (B) platelet count at the SH2B3 locus on chromosome 12. The x-axis corresponds to genomic coordinates. (A) For TFR2-EPO, we provide association results for each variant in the region before (circles) and after (stars) conditioning on the GWAS sentinel SNP at the locus (rs7385804). (B) Similarly, for SH2B3 we provide association results without (circles) and with (stars) adjustment for genotypes at the GWAS sentinel SNP rs3184504. In the GWAS row, we represent all markers in linkage disequilibrium (LD) with the GWAS sentinel SNP (marked by an inverted triangle) based on data from European populations in the 1000 Genomes Project: the size of the circle is proportional to the strength of LD. We added a vertical line between the GWAS and ExomeChip rows if GWAS LD proxies were also present on the ExomeChip array. On the ExomeChip row, all markers analyzed in the region are represented as triangles (intronic, intergenic and synonymous variants) or diamonds (missense, nonsense and splice site variants). Vertical lines between the ExomeChip and Freq 0.5 rows represent allele frequencies in the meta-analysis MHI+WHI.
A rare 5’ donor splice site variant in the β-globin gene (HBB, rs33971440, MAF=0.02%) was associated with lower hemoglobin and hematocrit levels (Table 1 and Supplementary Table 2). This rare HBB variant was previously identified in Mediterranean patients with β°-thalassemia8, which may explain why it is present in North American cohorts (MHI and WHI) due to immigration, but absent from Northern Germany SHIP.
Using criteria from the World Health Organization to define anemia (hemoglobin <12 g/dl in women and <13 g/dl in men), we confirmed that the EPO p.Asp70Asn variant is associated with clinical anemia in the combined analysis of MHI+WHI (1,866 cases and 22,397 controls, odds ratio=1.7, P=0.008). The rare HBB splice variant is likewise strongly associated with clinical anemia (odds ratio = 36.1, P=1.1×10⁻⁵).
Mutations in TUBB1 (which encodes a megakarocyte-specific form of β-tubulin, a microtubule protein involved in pro-platelet production) cause autosomal dominant macrothrombcytopenia in humans (MIM 612901) and Cavalier King Charles Spaniel dogs9. We report a new low-frequency TUBB1 missense variant (rs41303899, p.Gly109Glu, MAF=0.16%) associated with µ33,000/uL lower mean platelet count (Table 1). The rs41303899-platelet count association is independent from a common TUBB1 missense variant (rs6070697, p.Arg307His, MAF=18%, Supplementary Table 3) previously associated with mean platelet volume (for rs41303899, meta-analysis P=3.7×10⁻⁵, meta-analysis conditional on rs6070697 P=2.4×10⁻⁴).
JAK2 p.Val617Phe is the main cause of myeloproliferative neoplasms (MPNs)10–13. In our discovery sample, JAK2 p.Val617Phe was strongly associated with platelet count (P=3.9×10⁻²²), and also with hematocrit (P=9.5×10⁻⁷), hemoglobin (0.002) and WBC count (P=3.1×10⁻⁵), highlighting the pan-lineage effect of this somatic gain-of-function mutation (Table 1). JAK2 p.Val617Phe was rare in MHI and WHI (MAF=0.05%), consistent with prior frequency estimates obtained by whole-exome sequencing14 or allele-specific PCR15 using peripheral blood samples from unselected individuals. The clinical characteristics, serial blood counts and clinical follow-up information obtained for the 19 mutation carriers in the MHI and WHI studies suggest early-stage MPN in these individuals and also exemplify the phenotypic diversity of the JAK2 p.Val617Phe mutation (Supplementary Table 5). Notably, the frequency of the JAK2 p.Val617Phe mutation appeared to be 10-fold higher in SHIP (MAF=0.4%) (Table 1); however, this spuriously high frequency value resulted from genotype mis-calling, as inspection of the genotyping intensity plots does not reveal clearly distinguishable clusters (Supplementary Fig. 5). These observations are consistent with both the variable sensitivity to JAK2 p.Val617Phe detection across genotyping platforms and also heterogeneity of allelic burden across individuals16,17. These issues raise a number of complexities to be considered in the decision to return results of such incidental findings to research participants.
SH2B3 encodes the adaptor protein LNK, which regulates T and B cell development and myelopoiesis18. LNK inhibits JAK2-STAT and other downstream signaling pathways to modulate hematopoietic cytokine receptor signaling19. Both somatic and germline mutations in SH2B3 have been reported in patients with MPNs20,21. In addition to confirming the association of a missense SNP (rs3184504, p.Trp262Arg, MAF=50%) with all four hematological traits (P<4.0×10⁻¹⁰, Supplementary Table 3)1–3, we identified two independent SH2B3 missense variants associated with higher platelet count (rs148636776, p.Glu395Lys, MAF=0.04%; rs72650673, p.Glu400Lys, MAF=0.1%)(Fig. 1B). These two variants are located in the functional SH2 domain that interacts with JAK2 (Supplementary Fig. 6). The p.Glu400Lys variant was identified previously in µ5% of patients with idiopathic erythrocytosis22. However, in our dataset there was no association between either p.Glu400Lys or the novel missense variant p.Glu395Lys and hematocritor hemoglobin (P>0.10). SH2B3 p.Glu395Lys and p.Glu400Lys were not associated with red blood cell (RBC) count in the MHI Biobank (P>0.3). Unfortunately, RBC count is not available in WHI.
In addition to the new associations described above, we confirmed many SNPs previously associated with blood cell traits by GWAS (Supplementary Table 3). The only new common variant identified, rs1465788 (MAF=27%), is located in the 5’ flanking region of ZFP36L1 and associates with µ3,000/uL lower mean platelet count (Table 1). ZFP36L1 belongs to a family of mRNA destabilization proteins involved in the regulation of self-renewal and differentiation of hematopoietic cells23. The nearest GWAS index SNP for platelet count is rs11627546, which is located 1.1 megabase away and not in linkage disequilibrium (LD) with rs1465788 (r2=0.003 in Europeans)2. Based on ENCODE data from myeloid K562 cells, the rs1465788 variant lies in a nucleosome-depleted region and is in strong LD (r2>0.90 in Europeans) with several common variants in the promoter of ZFP36L1 (Supplementary Fig. 7). Unfortunately, there are no megakaryocyte or platelet expression quantitative trait locus (eQTL) datasets publicly available. Using a large eQTL study of monocytes from 1,490 participants, we were unable to identify eQTL for ZFP36L124. However, according to analyses performed in lymphoblastoid cell lines25, rs1465788 is in LD with rs10873217 (r2=0.38 in Europeans), an eQTL for ZFP36L1. rs1465788 is also located 77 kilobases downstream of ACTN1, a gene mutated in macrothrombocytopenia (MIM 615193), but is neither in LD with markers near ACTN1 nor an eQTL for ACTN1 expression. rs1465788, or markers in LD, have been associated by GWAS with autoimmune disorders26–28. Therefore, it is also plausible that the reason for lower platelet count may involve platelet autoantibody formation, which is a common mechanism of thrombocytopenia in adults29. Several additional common, low-frequency or rare coding variants did not reach our stringent statistical threshold (Supplementary Tables 2–3) but are located in strong candidate genes, have been associated with other hematologic traits, or are in LD with a sentinel SNP and could thus explain a GWAS signal. These findings are detailed further in the Supplementary Note.
The rare and low-frequency coding variant associations described above represent examples where a single rare variant of large effect dominates the phenotypic association. We report an instance of a novel signal for WBC count in a gene previously undetected through GWAS, where the association is comprised of multiple rare and low-frequency missense variants in CXCR2 (combined gene-based P=2.6×10⁻¹³, Table 2 and Supplementary Table 4). The gene-based signal is driven mainly by three independent low-frequency CXCR2 missense variants (rs55799208, p.Arg153His; rs10201766, p.Arg236Cys; rs61733609, p.Arg248Gln) each associated with lower WBC count (Fig. 2 and Supplementary Table 6; conditional analysis in Table 2). The p.Arg153His, p.Arg236Cys, and p.Arg248Gln mutations are located within the second and third intracellular loops of CXCR2, which are important for G-protein interactions and receptor activation (Supplementary Fig. 8)30–32. Moreover, the Ala249 residue adjacent to p.Arg248Gln is important for CXCR2 intracellular signaling and also represents an allosteric binding site for CXCR2 antagonists currently undergoing clinical trials33. Upon binding the chemokine CXCL2, CXCR2 signaling promotes neutrophil release from the bone marrow, thereby elevating blood neutrophil counts34. Accordingly, when we analyzed the association between CXCR2 missense variants and WBC subtypes, the strongest association was with neutrophil count (Supplementary Table 7). Common variants of CXCL2 are associated with WBC, primarily neutrophil count35.
Figure 2.

Rare and low-frequency missense variants in CXCR2 are associated with lower white blood cell (WBC) count. The symbol legend is in the upper left corner of the figure. A vertical line represents the mean WBC count for each study. The middle of each color-coded circle (black=MHI, white=WHI, grey=SHIP) corresponds to the mean WBC count for individuals that carry the corresponding missense variants and the size of the circles is correlated with allele frequency. The three white circles in the lower left corner of the figure are provided as references and represent variants with minor allele frequency of 0.01%, 0.1% and 0.5%. For rs2228413 (p.Arg294Gln), there is a participant from MHI that is homozygote for the rare allele (star).
In mice, neutrophils lacking CXCR2 are preferentially retained in the bone marrow36. A congenital neutropenia in humans resembling this condition termed myelokathexis can occur in isolation or as a feature of the rare, autosomal dominant WHIM syndrome37. Most patients with WHIM syndrome have a gain-of-function mutation in the CXCR4 gene36,37. To further support the role of CXCR2 mutations in neutropenia and neutrophil trafficking, we studied a pedigree in which two siblings were affected with myelokathexis (Supplementary Fig. 9) in the absence of other WHIM syndrome features and in which the involvement of CXCR4 was excluded38. Sequence analysis of CXCR2 in affected individuals II-2 and II-4 revealed a homozygous deletion of the coding sequence (c.968delA)(Supplementary Fig. 9). The encoded mutant protein contains a translational frameshift and premature termination codon after six novel amino acids (H323fs6X, hereinafter referred to as CXCR2fs). We tested the ability of the mutant CXCR2fs receptor to respond to ligand at the level of signal transduction and chemotaxis. Transfected HeLa cells expressing either CXCR2wt or CXCR2fs were stimulated with the ligand CXCL8 over a 15-minute time course. The accumulation of serine-phosphorylated ERK1/2 (pERK) was used to assess the activation of the MAPK signaling cascade. pERK1/2 accumulation was maximal at the five minute timepoint after stimulation of the CXCR2wt receptor, whereas CXCR2fs-transfected cells had no detectable response (Fig. 3A). Consistent with these results, CXCR2wt-transfected cells had a robust chemotactic response to CXCL8, whereas cells expressing CXCR2fs did not, supporting the notion that the frameshift mutation caused a loss of receptor function (Fig. 3B). Together with our population-based results, these family and functional data support the concept that CXCR2 regulates neutrophil mobilization from the bone marrow and peripheral neutrophil counts.
Figure 3.
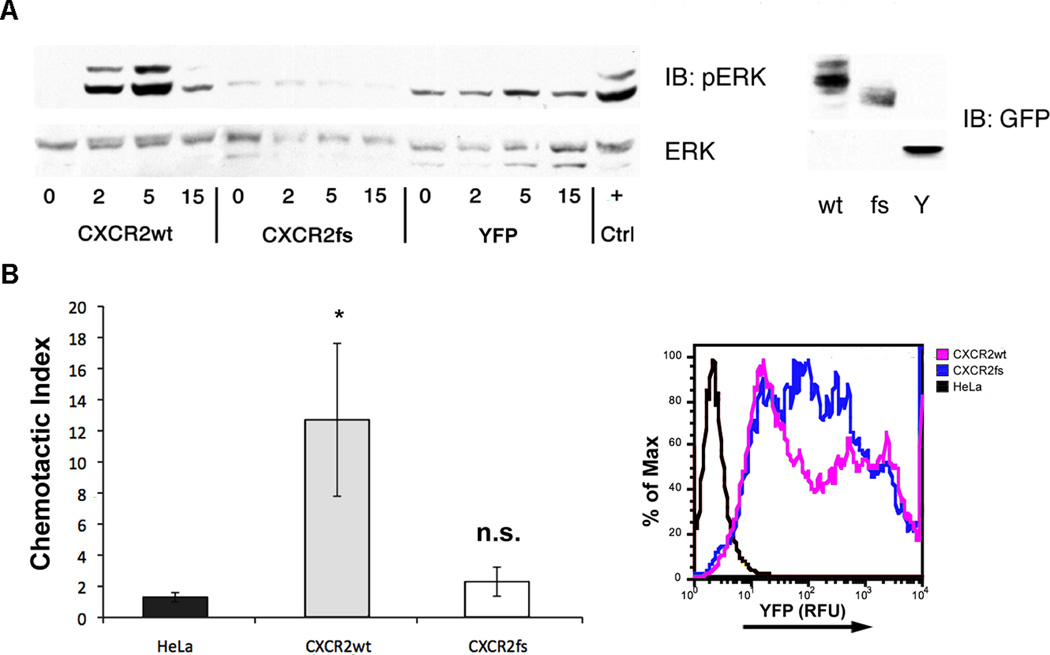
Functional characterization of the CXCR2fs mutant receptor. (A) Intracellular ERK1/2 signaling in HeLa cells transfected with wild type or mutant CXCR2 receptor. HeLa cells transfected with CXCR2wt-YFP, CXCR2fs-YFP or YFP alone were stimulated with CXCL8 (100 ng/mL) and lysates collected over the time course indicated to assess the activation of the ERK1/2 pathway. Peak phosphorylation following stimulation of CXCR2wt occurred at 5 min with significant attenuation of activation by 15 min. No activation over baseline was detected in cells expressing CXCR2fs. ERK1/2 activation at 5 min following stimulation of endogenous CXCR4 with CXCL12 (100 ng/mL) was used as a positive control (+). Protein abundance of CXCR2wt-YFP (wt), CXCR2fs-YFP (fs) and the YPF control (Y) proteins in transfected cell lines are shown (right panel). (B) Chemotaxis assay results for HeLa cells expressing CXCR2wt-YFP or CXCR2fs-YFP. Transiently transfected HeLa cells were seeded in the top chamber of modified Boyden chambers and CXCL8 (100 ng/mL) was added to media in the bottom chamber. The chemotactic index (migration in presence of CXCL8/migration in absence of CXCL8) was calculated from the results of assays performed in triplicate. Robust migration was observed in cells expressing the wild type CXCR2 fusion protein (gray bars), but not in those expressing the frameshift mutant (open bars) or in untransfected cells (black bars). Overexpression of each construct was confirmed by detecting YFP fluorescence (expressed as relative fluorescence units; RFU) in aliquots of transfectants (right panel). *P<0.02, Student’s t-test, n.s., non-significant.
Our results clearly demonstrate that rare and low-frequency coding variants contribute to phenotypic variation in human populations. We discovered novel missense variants in key regulators of hematopoiesis (EPO, SH2B3, TUBB1) that have potential implications for diagnostic screening and drug development in a variety of hematologic and inflammatory disorders (cytopenias, MPNs, lung disease, stroke). For example, rare SH2B3 mutations may account for additional cases of JAK2-negative MPNs. We also provide further support for the biological role of several molecules in the regulation of hematopoiesis (CXCR2, ZFP36L1). Collectively, our findings validate exome-wide genotyping in very large samples as an effective and complementary tool to GWAS and deep DNA re-sequencing studies for defining the allelic architecture of complex traits. The association between a collection of rare and low-frequency CXCR2 coding variants and WBC count emphasizes the relevance of gene-based tests as we continue to query even rarer variants for their role in human phenotypic variation.
Methods
Study participants and phenotypes
The MHI Biobank is a longitudinal cohort with the aim to recruit 30,000 patients of the MHI for clinical and genetic research39. Participants are recruited from different departments within the MHI and at its affiliated EPIC centre, the largest fitness centre in Canada for coronary patients and research in primary and secondary prevention. The MHI ethics committee approves the project and informed consent is obtained from all participants. The MHI Cohort collects data by using a 35-page questionnaire administered by a research nurse at baseline including demographics, personal and family medical history, physical activity, diet, tobacco, medication use, as well as depression and hostility questionnaires. Vital signs (heart rate, blood pressure, weight, height, waist circumference) are obtained by the nurse and blood, DNA, and plasma are collected and stored at the Beaulieu-Saucier Pharmacogenomics Center. Patients’ health status is confirmed by the nurse by using the Hospital’s health record for retrospective and prospective follow-up. The Cohort’s database is updated frequently with patients’ medical information from the hospital’s electronic records. A follow-up study questionnaire is administered every four years. Blood cell counts and other related phenotypes were automatically generated with the UniCel DxH 800 cellular analysis system from Beckman Coulter.
The Women’s Health Initiative (WHI) is one of the largest (n=161,808) U.S. studies of women’s health. This project was approved by the ethics committee at the Fred Hutchinson Cancer Research Center. The WHI consists of two main components: (1) a clinical trial that enrolled 68,132 post-menopausal women ages 50–79 and randomized them to one of three placebo-controlled clinical trials of hormone therapy, dietary modification, or supplementation with calcium and vitamin D; and (2) an observational study that enrolled 93,676 women of the same age range into a parallel prospective study.40 Of the women in WHI who were eligible and consented to genetic research, 18,072 were included in the current study. Samples for blood count were collected at baseline by venipuncture into tubes containing ethylenediaminetetraaetic acid (EDTA). Blood counts were performed with automated hematology cell counters and standardized quality-assurance procedures. Hemoglobin, hematocrit, WBC, and platelet count were the only complete blood count values recorded at data entry during the WHI baseline examination, which was conducted nationwide during 1993–1998.
The Study of Health in Pomerania consists of two independent prospectively collected population-based cohorts in West Pomerania (SHIP and SHIP-TREND), a region in the northeast of Germany, assessing the prevalence and incidence of common population-based diseases and their risk factors. The study followed the recommendations of the Declaration of Helsinki. The study protocol of SHIP was approved by the medical ethics committee of the University of Greifswald. Written informed consent was obtained from each of the study participants. The study design has been previously described in details41. Briefly, a sample from the population aged 20 to 79 years was drawn from population registries. First, the three cities of the region (with 17,076 to 65,977 inhabitants) and the 12 towns (with 1,516 to 3,044 inhabitants) were selected, and then 17 out of 97 smaller towns (with less than 1,500 inhabitants), were drawn at random. Second, from each of the selected communities, subjects were drawn at random, proportional to the population size of each community and stratified by age and gender. Only individuals with German citizenship and main residency in the study area were included.
For SHIP, baseline examinations were carried out from 1997 until 2001, and the sample finally comprised 4,308 participants. Baseline examinations for SHIP-TREND were carried out between 2008 and 2012, finally comprising 4420 participants. The blood count was measured within 60 minutes. The samples were analyzed at the hospital laboratory in Greifswald with a Coulter Max M analyzer (Coulter Electronics, Miami, USA) and with a Coulter T660 analyzer (Coulter Electronics, Miami, USA) at the hospital laboratory in Stralsund. Both analyzers were calibrated and maintained according to the manufacturers’ instructions. Quality control was performed internally as well as externally by participating in external proficiency testing programs. For this project, data of SHIP-TREND and the first 5-year follow-up of SHIP were included. In all association analyses, the cohort was included as an additional covariate in the model.
Genotyping and quality-control steps
We attempted to genotype 10,856 participants from the MHI Biobank on the Illumina ExomeChip array (version Infinium HumanExome v1.0 DNA Analysis BeadChip). Genotyping was performed at the MHI Pharmacogenomics Centre. We initially called genotypes with Illumina’s GenomeStudio software and, after data quality control (see below), recalled missing genotypes with the zCall software42. We carried out most quality control steps in PLINK43, and developed additional custom scripts when needed. We excluded markers with genotyping success rate <95% and Hardy-Weinberg equilibrium P<1×10⁻⁴. We excluded samples with genotyping success rate <95%%, abnormal heterozygosity (inbreeding F values <-0.2 or >0.1) and extensive low-level identity-by-descent (IBD) sharing with a large number of samples. Genotype concordance calculated from samples genotyped in duplicate or samples also sequenced by the 1000 Genomes Project44 was >99.99%. To identify population outliers, we used principal component analysis as implemented in EIGENSOFT45 and anchor our analysis on continental populations from the 1000 Genomes Project44. For this study, we only analyzed individuals of European ancestry. We used the GCTA software46 to detect cryptic relatedness: we removed one individual from each pair of samples that share >18% of their genome (corresponding to duplicates and first- and second-degree relatives). Our final dataset includes 9,656 individuals and 136,997 polymorphic markers. Blood cell phenotypes are available for 6,796 MHI Biobank participants (Supplementary Table 1).
DNA samples from the WHI clinical coordinating center were sent to the Broad Institute (BI) or the Translational Genomics Research Institute (TGEN) for genotyping and were placed on 96-well plates for processing using the Illumina HumanExome v1.0 SNP array. Genotypes were assigned using GenomeStudio v2010.3. All genotypes were then merged into a master-file containing all genotypes from the BI and TGEN. Quality control was performed on this master-file using the PLINK and R47 computing platforms. We excluded markers with a genotyping success rate less than 99%. We excluded samples with a genotyping success rate less than 98%. With the resulting sample set, we performed a principal component (PC) analysis as well as an analysis of relatedness using the PLINK IBS/IBD functionality. Outlier samples on the PC plots were excluded as were samples that were determined to be contaminated via the relatedness analysis (i.e., they were apparently related to hundreds of other samples). For each related/duplicate pair of samples, we excluded the sample with the lower call-rate. Unexpected duplicate samples were also filtered to prevent potential samples swaps from entering the analysis. For intentionally duplicated samples, we removed samples with low relatedness estimates as we expect them to be close to 1. We excluded samples with hemoglobin levels greater than 20 g/dl or a hematocrit (%) to hemoglobin (g/dl) ratio greater than 5. Samples with WBC (x109/l) greater than 100 were also excluded from the analysis. After QC, there were 18,072 samples and 166,836 polymorphic markers.
The SHIP and SHIP-TREND samples were genotyped using the Illumina ExomeChip array (version Infinium HumanExome v1.0 DNA Analysis BeadChip). Hybridisation of genomic DNA was done in accordance with the manufacturer’s standard recommendations at the Helmholtz Zentrum München. Genotype calling was performed according to the ExomeChip quality control SOP version 5. Initial genotypes were determined using the GenomeStudio Genotyping Module v1.0 (GenCall algorithm) with the HumanExome-12v1_A manifest file and the standard Illumina cluster file (HumanExome-12v1.egt). Contaminated samples, samples with a call rate <90%, extreme heterozygosity, extensive estimated IBD sharing with a large number of samples, or mismatch between reported and genotyped gender were excluded. Next, missing genotypes were re-called with the zCall software version 3.3 using the default values. In both cohorts together, 7366 individuals were successfully genotyped with an average call rate of 99.97%.
Trait modeling and study-level association testing
We used untransformed HGB, HCT and PLT values and log10-transformed WBC values for association testing. Because the analysis of rare variants is particularly sensitive to phenotypic outliers, we winsorized our data such that all individuals with a phenotype below the 0.5% or above the 99.5% of the trait distribution were respectively assigned the phenotype corresponding to 0.5% and 99.5% values. In our analysis, phenotype winsorisation reduced inflation while maintaining phenotype scale. In MHI, we used sex, age, age-squared and the first ten principal components as covariates. In WHI, we used age, and the first two principal components as covariates. We also included a term in the linear model to account for the different WHI sub-studies that contributed to this project.
We used PLINK43 to test association between phenotypes and single variant genotypes (including single variant conditional analyses) under an additive genetic model. For the gene-based analyses, each cohort ran an analysis with the rvtests software48. This software calculates a score statistic for each variant and a covariance matrix for markers within sliding windows.
Meta-analysis and statistical significance
We combined single variant results with metal using the inverse variance method49. For the gene-based tests, we combined score test results from rvtests with the raremetal software using default parameters48. A priori, we decided to focus exclusively on missense and nonsense variants as well as variants within donor or acceptor splice sites for these analyses. For each trait, we ran two gene-based test: a simple burden test with a minor allele frequency (MAF) cutoff of <1% (burden T1) and the sequence kernel association test (SKAT) with a MAF cutoff of <5%.
We defined statistical significance using Bonferroni corrections. For single variant analyses, we tested 183,585 DNA sequence variants and four phenotypes: α = 0.05 / 183,585 variants / 4 phenotypes = 6.8×10⁻⁸. For gene-based analyses, we tested 15,930 genes (genes with no or only one missense/nonsense/splice site variants were not tested), four phenotypes and two different statistical tests: α = 0.05 / 15,930 genes / 4 phenotypes / 2 tests = 3.9×10⁻⁷.
Functional characterization of CXCR2
A previously described family in which two sisters were affected with isolated myelokathexis14 was evaluated for mutations in CXCR2. The clinical manifestations in this family included neutropenia without lymphopenia or warts leading to recurrent bacterial infections including septic thrombophlebitis and subacute bacterial endocarditis. At age 43, one of the siblings was reported to have had >80 infectious episodes31. Her younger sister had fewer infectious episodes, which was speculated to result from a more robust transient release of neutrophils into the peripheral blood during infection. The family was lost to follow up and not available for further functional studies on primary cells.
Human CXCR2 is encoded by a single exon with multiple upstream non-coding exons giving rise to a number of different splice isoforms. The coding sequence of the gene was amplified on three overlapping PCR fragments and analyzed by automated sequencing. Exonic boundaries were identified using publicly available genomic database information50 and primers were designed to amplify coding exons and flanking intronic sequences using the Primer3 software51. PCR amplicons were sequenced using an ABI3700 automated platform. Confirmatory restriction enzyme analysis was performed using NcoI (New England Biolabs) under standard conditions.
IMAGE clone 5752441 containing the full-length CXCR2 open reading frame was obtained from Invitrogen. The insert was confirmed by sequencing the clone using CXCR2-specific primers. The 968delA (CXCR2fs), C967T/T969G (H323X), and 968delA/986insC (CXCR2fs-wt) mutations were introduced by site-directed mutagenesis primers and amplified by PfuTurbo (Stratagene). The resulting clones were tagged with epitopes on the C-terminal tail of the receptor by PCR amplification of the CXCR2 open reading frame using the IMAGE clone as a template. The amplification primers contained exogenous restriction sites at the 3’ and 5’ ends and were digested using EcoRI/XhoI (FLAG) or EcoRI/SalI (YFP). After digestion with the appropriate enzymes, fragments were ligated in-frame upstream of the 3xFLAG epitope in pIRES-3xFLAG-hrGFP (Invitrogen) or the YFP full-length protein in pEYFP-N1 (Clontech). The full-length ORFs for FLAG-tagged and YFP-fusion proteins were sequence verified.
HEK293 and HeLa cell cultures were maintained in 5% CO2 at 37°C in DMEM (Cellgro) supplemented with 10% fetal bovine serum (Gibco), 2mM L-glutamine, 100 U/mL penicillin and 100 µg/mL streptomycin (Cellgro). Cultures were transfected using FuGENE-6 (Roche) according to the manufacturer’s protocol. Transgene expression was evaluated 36–72 hrs post-transfection by indirect immunofluorescence or western blot. Primary antibodies used in these studies - anti-FLAG (Sigma), anti-CXCR2 (Santa Cruz Biotechnology), anti-GFP (Molecular Probes), anti-calnexin (Chemicon), anti-phospho-ERK/-ERK (Santa Cruz Biotechnology) - were used at dilutions as suggested by manufacturer. Anti-rabbit and anti-mouse HRP conjugates (Pierce) were used as secondary antibodies for Western blots and FITC-labeled anti-mouse (SCBT), rabbit-AF594- and AF488-labeled anti-rabbit (Invitrogen) and direct-labeled Phalloidin-AF594 (Molecular Probes) were used for immunofluorescence microscopy. Fluorescein-labeled monoclonal 48311 anti-CXCR2 (R&D Systems) and phycoerythrin-labeled 12G5 monoclonal anti-CXCR4 (Pharmingen) and labeled isotype control antibodies were used for flow cytometry experiments.
Transfected HeLa cells were made quiescent in serum-free, antibiotic-free DMEM overnight prior to the addition of ligand. Cells (1 × 10⁶) were stimulated with 100 ng/mL CXCL8, 100 ng/mL CXCL12 (Cell Sciences) or kept in serum-free medium for times as described in figure legends. Cells were either harvested for Western analysis or fixed for immunofluorescence staining.
Prior to harvesting, cells were rinsed with ice cold PBS, lysed on ice in RIPA lysis buffer (50 mM Tris-HCl pH 7.4, 150 mM NaCl, 1.0% Triton X-100, 0.5% DOC, 0.1% SDS, 0.025% NaN3) supplemented with Complete protease inhibitor cocktail (Roche) for a minimum of 30 minutes. After determination of protein concentration by Bradford assay, lysates were denatured in 1x Laemmli sample buffer with 100 mM DTT and equivalent amounts run on 10% SDS-PAGE gels. Proteins were transferred to nitrocellulose (Pall/GE) using the Bio-Rad Semi-Dry Trans-Blot system for 1 hour, blocked in 5% milk in PBS (w/v) for 1 hour, then incubated overnight at 4°C in primary antibody. Blots were washed three times for 10 minutes in PBS-Tween-20 (0.05%). Incubation with species-specific HRP-conjugated antibody for 1 hour was followed by three more 10 min washes in PBST. Membranes were developed using SuperSignal West Pico and Chemiluminescent Substrate (Pierce) on HyBlot CL Film (Denville). For deglycosylation experiments, 30 µg of total protein was incubated with Endo Hf (NEB), PNGase F (NEB) or buffer alone for 1 hour at 37°C as recommended by manufacturer.
Cells were transfected with CXCR2 constructs as described below and an aliquot of cells resuspended by trypsin treatment were fixed for 15 minutes using 2.2% paraformaldehyde (Electron Microscopy Sciences) in PBS (v/v) then spun down at 500g for 5 minutes. Cells were washed twice in Flow Buffer (PBS with 0.5% BSA (w/v), 5 mM EDTA) to inhibit clumping of cells. Approximately 2.5 × 10⁵ cells in 50 µl aliquots were used for each assay. Flow cytometric data for quantitation of CXCR2 construct expression were collected using a FACS LSR II (Becton Dickson). All data were analyzed using Flowjo software (Tree Star, Inc, Ashland, OR 97520). At least three independent experiments were performed for each condition tested.
HeLa cells at 70% confluence in 10 cm dishes were transfected with either pEYFP-N1-CXCR2wt or pEYFP-N1-CXCR2wt and cultured for 3 days. After overnight serum-starvation, cells were harvested on the fourth day and resuspended in DMEM/0.5% BSA at a density of 5×10⁵ cells/100 µl. 100 µl aliquots were added to the upper chamber of 24-well Transwell plates (Corning-Costar) with collagen-coated 8.0 µm pore polycarbonate membranes. Chemotaxis was assayed by addition of CXCL8 (100ng/ml) to DMEM in the bottom chamber of the plates. After 2 hours in a 37° C, 5% CO2 tissue culture incubator, inserts were removed, loose cells scraped off and transmigrated cells fixed and stained in Crystal Violet. Cells migrated onto the lower surface of the membrane were counted for five low power (10X) fields using a brightfield inverted microscope to determine the average cell number migrated per field. Chemotactic index was calculated by dividing the average number of cells migrated per field under conditions of chemokine addition by the average number under conditions of saline addition. Experiments were performed in triplicate at least three times each.
Supplementary Material
Acknowledgments
We thank all participants and staff of the Montreal Heart Institute (MHI) Biobank and acknowledge the technical support of the Beaulieu-Saucier MHI Pharmacogenomic Center. This work was supported by the Centre of Excellence in Personalized Medicine (CEPMed), the “Fonds de Recherche Santé Québec” (FRQS), the Canada Research Chair program and the MHI Foundation. The Women’s Health Initiative (WHI) program is funded by the National Heart, Lung, and Blood Institute, National Institutes of Health, and the United States Department of Health and Human Services. Exome-chip data and analysis were supported through the Women’s Health Initiative Sequencing Project (NHLBI RC2 HL-102924), the Genetics and Epidemiology of Colorectal Cancer Consortium (NCI CA137088), the Genomics and Randomized Trials Network (NHGRI U01-HG005152), and an NCI training grant (R25CA094880). The authors thank the WHI investigators and staff for their dedication and the study participants for making the program possible. SHIP is part of the Community Medicine Research net of the University of Greifswald, Germany, which is funded by the Federal Ministry of Education and Research (grants no. 01ZZ9603, 01ZZ0103, and 01ZZ0403), the Ministry of Cultural Affairs as well as the Social Ministry of the Federal State of Mecklenburg-West Pomerania, and the network ‘Greifswald Approach to Individualized Medicine (GANI_MED)’ funded by the Federal Ministry of Education and Research (grant 03IS2061A). ExomeChip data have been supported by the Federal Ministry of Education and Research (grant no. 03Z1CN22) and the Federal State of Mecklenburg-West Pomerania. The University of Greifswald is a member of the ‘Center of Knowledge Interchange’ program of the Siemens AG and the Caché Campus program of the InterSystems GmbH. GAD acknowledges support from NIH award P01AI061093.
Footnotes
Author contributions
PLA, GAD, APR and GL conceived and designed the experiments. PLA, AT, US, AO, KSL, GAD, APR and GL performed the experiments. PLA, AT, US, AO, KSL, GAD, APR and GL analyzed the data. All authors contributed reagents and materials. PLA, GAD, APR and GL Wrote the paper with contributions from all authors.
Competing financial interests
The authors declare no competing financial interests.
References
- 1.Nalls MA, et al. Multiple loci are associated with white blood cell phenotypes. PLoS Genet. 2011;7:e1002113. doi: 10.1371/journal.pgen.1002113. [DOI] [PMC free article] [PubMed] [Google Scholar]
- 2.Gieger C, et al. New gene functions in megakaryopoiesis and platelet formation. Nature. 2011;480:201–208. doi: 10.1038/nature10659. [DOI] [PMC free article] [PubMed] [Google Scholar]
- 3.van der Harst P, et al. Seventy-five genetic loci influencing the human red blood cell. Nature. 2012;492:369–375. doi: 10.1038/nature11677. [DOI] [PMC free article] [PubMed] [Google Scholar]
- 4.Zhou Z, et al. USF and NF-E2 cooperate to regulate the recruitment and activity of RNA polymerase II in the beta-globin gene locus. J Biol Chem. 2010;285:15894–15905. doi: 10.1074/jbc.M109.098376. [DOI] [PMC free article] [PubMed] [Google Scholar]
- 5.de la Chapelle A, Sistonen P, Lehvaslaiho H, Ikkala E, Juvonen E. Familial erythrocytosis genetically linked to erythropoietin receptor gene. Lancet. 1993;341:82–84. doi: 10.1016/0140-6736(93)92558-b. [DOI] [PubMed] [Google Scholar]
- 6.Biasiotto G, et al. New TFR2 mutations in young Italian patients with hemochromatosis. Haematologica. 2008;93:309–310. doi: 10.3324/haematol.11942. [DOI] [PubMed] [Google Scholar]
- 7.Pelucchi S, et al. Expression of hepcidin and other iron-related genes in type 3 hemochromatosis due to a novel mutation in transferrin receptor-2. Haematologica. 2009;94:276–279. doi: 10.3324/haematol.13576. [DOI] [PMC free article] [PubMed] [Google Scholar]
- 8.Qayyum R, et al. A meta-analysis and genome-wide association study of platelet count and mean platelet volume in african americans. PLoS Genet. 2012;8:e1002491. doi: 10.1371/journal.pgen.1002491. [DOI] [PMC free article] [PubMed] [Google Scholar]
- 9.Forand A, et al. EKLF-driven PIT1 expression is critical for mouse erythroid maturation in vivo and in vitro. Blood. 2013;121:666–678. doi: 10.1182/blood-2012-05-427302. [DOI] [PubMed] [Google Scholar]
- 10.Baxter EJ, et al. Acquired mutation of the tyrosine kinase JAK2 in human myeloproliferative disorders. Lancet. 2005;365:1054–1061. doi: 10.1016/S0140-6736(05)71142-9. [DOI] [PubMed] [Google Scholar]
- 11.James C, et al. A unique clonal JAK2 mutation leading to constitutive signalling causes polycythaemia vera. Nature. 2005;434:1144–1148. doi: 10.1038/nature03546. [DOI] [PubMed] [Google Scholar]
- 12.Kralovics R, et al. A gain-of-function mutation of JAK2 in myeloproliferative disorders. N Engl J Med. 2005;352:1779–1790. doi: 10.1056/NEJMoa051113. [DOI] [PubMed] [Google Scholar]
- 13.Levine RL, et al. Activating mutation in the tyrosine kinase JAK2 in polycythemia vera, essential thrombocythemia, and myeloid metaplasia with myelofibrosis. Cancer Cell. 2005;7:387–397. doi: 10.1016/j.ccr.2005.03.023. [DOI] [PubMed] [Google Scholar]
- 14.Bohinjec J. Myelokathexis: chronic neutropenia with hyperplastic bone marrow and hypersegmented neutrophils in two siblings. Blut. 1981;42:191–196. doi: 10.1007/BF01026389. [DOI] [PubMed] [Google Scholar]
- 15.Xu X, et al. JAK2(V617F): Prevalence in a large Chinese hospital population. Blood. 2007;109:339–342. doi: 10.1182/blood-2006-03-009472. [DOI] [PMC free article] [PubMed] [Google Scholar]
- 16.Sidon P, El Housni H, Dessars B, Heimann P. The JAK2V617F mutation is detectable at very low level in peripheral blood of healthy donors. Leukemia. 2006;20:1622. doi: 10.1038/sj.leu.2404292. [DOI] [PubMed] [Google Scholar]
- 17.Vannucchi AM, Pieri L, Guglielmelli P. JAK2 Allele Burden in the Myeloproliferative Neoplasms: Effects on Phenotype, Prognosis and Change with Treatment. Ther Adv Hematol. 2011;2:21–32. doi: 10.1177/2040620710394474. [DOI] [PMC free article] [PubMed] [Google Scholar]
- 18.Oh ST. When the Brakes are Lost: LNK Dysfunction in Mice, Men, and Myeloproliferative Neoplasms. Ther Adv Hematol. 2011;2:11–19. doi: 10.1177/2040620710393391. [DOI] [PMC free article] [PubMed] [Google Scholar]
- 19.Bersenev A, Wu C, Balcerek J, Tong W. Lnk controls mouse hematopoietic stem cell self-renewal and quiescence through direct interactions with JAK2. J Clin Invest. 2008;118:2832–2844. doi: 10.1172/JCI35808. [DOI] [PMC free article] [PubMed] [Google Scholar]
- 20.Beck L, et al. The phosphate transporter PiT1 (Slc20a1) revealed as a new essential gene for mouse liver development. PLoS ONE. 2010;5:e9148. doi: 10.1371/journal.pone.0009148. [DOI] [PMC free article] [PubMed] [Google Scholar]
- 21.Gerstein MB, et al. Architecture of the human regulatory network derived from ENCODE data. Nature. 2012;489:91–100. doi: 10.1038/nature11245. [DOI] [PMC free article] [PubMed] [Google Scholar]
- 22.McMullin MF, Wu C, Percy MJ, Tong W. A nonsynonymous LNK polymorphism associated with idiopathic erythrocytosis. Am J Hematol. 2011;86:962–964. doi: 10.1002/ajh.22154. [DOI] [PMC free article] [PubMed] [Google Scholar]
- 23.Macari ER, Lowrey CH. Induction of human fetal hemoglobin via the NRF2 antioxidant response signaling pathway. Blood. 2011;117:5987–5997. doi: 10.1182/blood-2010-10-314096. [DOI] [PMC free article] [PubMed] [Google Scholar]
- 24.Zeller T, et al. Genetics and beyond--the transcriptome of human monocytes and disease susceptibility. PLoS ONE. 2010;5:e10693. doi: 10.1371/journal.pone.0010693. [DOI] [PMC free article] [PubMed] [Google Scholar]
- 25.Stranger BE, et al. Population genomics of human gene expression. Nat Genet. 2007;39:1217–1224. doi: 10.1038/ng2142. [DOI] [PMC free article] [PubMed] [Google Scholar]
- 26.Barrett JC, et al. Genome-wide association study and meta-analysis find that over 40 loci affect risk of type 1 diabetes. Nat Genet. 2009;41:703–707. doi: 10.1038/ng.381. [DOI] [PMC free article] [PubMed] [Google Scholar]
- 27.Sawcer S, et al. Genetic risk and a primary role for cell-mediated immune mechanisms in multiple sclerosis. Nature. 2011;476:214–219. doi: 10.1038/nature10251. [DOI] [PMC free article] [PubMed] [Google Scholar]
- 28.Jostins L, et al. Host-microbe interactions have shaped the genetic architecture of inflammatory bowel disease. Nature. 2012;491:119–124. doi: 10.1038/nature11582. [DOI] [PMC free article] [PubMed] [Google Scholar]
- 29.Stasi R. Immune thrombocytopenia: pathophysiologic and clinical update. Semin Thromb Hemost. 2012;38:454–462. doi: 10.1055/s-0032-1305780. [DOI] [PubMed] [Google Scholar]
- 30.Johnston CM, et al. Large-scale population study of human cell lines indicates that dosage compensation is virtually complete. PLoS Genet. 2008;4:e9. doi: 10.1371/journal.pgen.0040009. [DOI] [PMC free article] [PubMed] [Google Scholar]
- 31.Cernelc P, et al. Effects of molgramostim, filgrastim and lenograstim in the treatment of myelokathexis. Pflugers Arch. 2000;440:R81–R82. [PubMed] [Google Scholar]
- 32.Park SH, et al. Structure of the chemokine receptor CXCR1 in phospholipid bilayers. Nature. 2012;491:779–783. doi: 10.1038/nature11580. [DOI] [PMC free article] [PubMed] [Google Scholar]
- 33.Salchow K, et al. A common intracellular allosteric binding site for antagonists of the CXCR2 receptor. Br J Pharmacol. 2010;159:1429–1439. doi: 10.1111/j.1476-5381.2009.00623.x. [DOI] [PMC free article] [PubMed] [Google Scholar]
- 34.Marioni JC, et al. Breaking the waves: improved detection of copy number variation from microarray-based comparative genomic hybridization. Genome Biol. 2007;8:R228. doi: 10.1186/gb-2007-8-10-r228. [DOI] [PMC free article] [PubMed] [Google Scholar]
- 35.Sabeti PC, et al. Genome-wide detection and characterization of positive selection in human populations. Nature. 2007;449:913–918. doi: 10.1038/nature06250. [DOI] [PMC free article] [PubMed] [Google Scholar]
- 36.Bird CP, et al. Fast-evolving noncoding sequences in the human genome. Genome Biol. 2007;8:R118. doi: 10.1186/gb-2007-8-6-r118. [DOI] [PMC free article] [PubMed] [Google Scholar]
- 37.Birney E, et al. Identification and analysis of functional elements in 1% of the human genome by the ENCODE pilot project. Nature. 2007;447:799–816. doi: 10.1038/nature05874. [DOI] [PMC free article] [PubMed] [Google Scholar]
- 38.Hernandez PA, et al. Mutations in the chemokine receptor gene CXCR4 are associated with WHIM syndrome, a combined immunodeficiency disease. Nat Genet. 2003;34:70–74. doi: 10.1038/ng1149. [DOI] [PubMed] [Google Scholar]
- 39.Beaudoin M, et al. Pooled DNA resequencing of 68 myocardial infarction candidate genes in French canadians. Circ Cardiovasc Genet. 2012;5:547–554. doi: 10.1161/CIRCGENETICS.112.963165. [DOI] [PubMed] [Google Scholar]
- 40.Design of the Women's Health Initiative clinical trial and observational study. The Women’s Health Initiative Study Group. Control Clin Trials. 1998;19:61–109. doi: 10.1016/s0197-2456(97)00078-0. [DOI] [PubMed] [Google Scholar]
- 41.Volzke H, et al. Cohort profile: the study of health in Pomerania. Int J Epidemiol. 2011;40:294–307. doi: 10.1093/ije/dyp394. [DOI] [PubMed] [Google Scholar]
- 42.Goldstein JI, et al. zCall: a rare variant caller for array-based genotyping: genetics and population analysis. Bioinformatics. 2012;28:2543–2545. doi: 10.1093/bioinformatics/bts479. [DOI] [PMC free article] [PubMed] [Google Scholar]
- 43.Purcell S, et al. PLINK: a tool set for whole-genome association and population-based linkage analyses. Am J Hum Genet. 2007;81:559–575. doi: 10.1086/519795. [DOI] [PMC free article] [PubMed] [Google Scholar]
- 44.1000 Genomes Project Consortium. An integrated map of genetic variation from 1,092 human genomes. Nature. 2012;491:56–65. doi: 10.1038/nature11632. [DOI] [PMC free article] [PubMed] [Google Scholar]
- 45.Price AL, et al. Principal components analysis corrects for stratification in genome-wide association studies. Nat Genet. 2006;38:904–909. doi: 10.1038/ng1847. [DOI] [PubMed] [Google Scholar]
- 46.Yang J, Lee SH, Goddard ME, Visscher PM. GCTA: a tool for genome-wide complex trait analysis. Am J Hum Genet. 2011;88:76–82. doi: 10.1016/j.ajhg.2010.11.011. [DOI] [PMC free article] [PubMed] [Google Scholar]
- 47.Team RC. Austria: R Foundation for Statistical Computing, Vienna; 2013. R: A language and environment for statistical computing. Vol. http://www.R-project.org/ [Google Scholar]
- 48.Liu DJ, et al. Meta-analysis of gene-level tests for rare variant association. Nat Genet. 2013 doi: 10.1038/ng.2852. [DOI] [PMC free article] [PubMed] [Google Scholar]
- 49.Willer CJ, Li Y, Abecasis GR. METAL: Fast and efficient meta-analysis of genomewide association scans. Bioinformatics. 2010;26:2190–2191. doi: 10.1093/bioinformatics/btq340. [DOI] [PMC free article] [PubMed] [Google Scholar]
- 50.Kent WJ, et al. The human genome browser at UCSC. Genome Res. 2002;12:996–1006. doi: 10.1101/gr.229102. [DOI] [PMC free article] [PubMed] [Google Scholar]
- 51.Rozen S, Skaletsky H. Primer3 on the WWW for general users and for biologist programmers. Methods Mol Biol. 2000;132:365–386. doi: 10.1385/1-59259-192-2:365. [DOI] [PubMed] [Google Scholar]
Associated Data
This section collects any data citations, data availability statements, or supplementary materials included in this article.