

Abstract
Micropatterned substrates are often used to standardize cell experiments and to quantitatively study the relation between cell shape and function. Moreover, they are increasingly used in combination with traction force microscopy on soft elastic substrates. To predict the dynamics and steady states of cell shape and forces without any a priori knowledge of how the cell will spread on a given micropattern, here we extend earlier formulations of the two-dimensional cellular Potts model. The third dimension is treated as an area reservoir for spreading. To account for local contour reinforcement by peripheral bundles, we augment the cellular Potts model by elements of the tension-elasticity model. We first parameterize our model and show that it accounts for momentum conservation. We then demonstrate that it is in good agreement with experimental data for shape, spreading dynamics, and traction force patterns of cells on micropatterned substrates. We finally predict shapes and forces for micropatterns that have not yet been experimentally studied.
Introduction
During attachment to a substrate, most cell types actively sense the adhesive geometry and stiffness of their environment by generating contractile forces in their actin cytoskeleton that are transmitted to the substrate through cell-matrix contacts (1). The resulting traction force then feeds back into biochemical circuits of the cell by a large range of different mechanosensitive processes, with dramatic consequences for cell polarization, migration, proliferation, differentiation, and fate (2). To understand these essential processes, it is therefore very important to measure or predict the cellular forces.
One of the biggest challenges in cell experiments is the inherent variability in their organization, including shape and traction forces. Cells on a homogeneously adhesive substrate display a large variety of shapes, and even cells with similar shapes usually differ in their internal organization. To overcome this difficulty, micropatterned substrates have emerged as a very useful tool to standardize cell experiments (3,4). In a pioneering study using microcontact printing, it has been shown that cell survival depends also on the spatial extension of the pattern and not only on the amount of ligand it contains (5). Many subsequent studies then used micropatterns to show that many essential cellular functions depend on shape, including the distribution of stress fibers (6), the orientation of the mitotic spindle (7), and endomembrane organization (8).
Cellular sensing of micropattern geometry is closely related to stiffness sensing, as both depend on cellular forces being developed in the actin cytoskeleton. To measure cellular forces on flat elastic substrates, different variants of traction force microscopy have been developed (9–11). This approach is now increasingly combined with micropatterning of cell shape, for example, by using microcontact printing (12) or deep-ultraviolet illumination of polyacrylamide substrates (13) or lift-off techniques on silicone rubber substrates (14).
Micropatterning of cell shape is naturally complemented by quantitative image processing and modeling. Several types of mathematical model have been developed to predict cell shape on micropatterns (15). The simplest type is a contour model. It has been suggested, based on observations of circular arc features of cells adhering to homogeneous substrates, that Laplace-type models arise from the competition of tension in the periphery (geometrically a line tension) and tension in the cell body (geometrically a surface tension) (16,17). Here, we call this approach the simple tension model (STM). A quantitative analysis of cell shape on dot patterns has shown that in the presence of strong contour reinforcement by peripheral actin bundles, the STM has to be modified by elastic elements, leading to the tension-elasticity model (TEM) (18). Both STM and TEM describe not only cell shape but also cell forces (19). It was shown recently that the TEM emerges as a good approximation to a bulk model for contractile cells if the tension in the periphery dominates the bulk tension (20,21).
The natural starting point for a bulk model of cell shape is continuum mechanics, which can be implemented with the finite-element method (FEM). To represent contractility in such a framework, one can use isotropic thermoelasticity, which represents contractility by a negative pressure in the elastic equations, as it can be induced in passive materials by lowering temperature. This approach is commonly used for model contraction in cell monolayers (22–24). Recently also, such an isotropic thermoelastic model was used to predict the shape and forces of cells on micropatterns (25). To represent the anisotropic effect of stress fibers, the isotropic thermoelastic approach has been extended by an orientation-dependent order-parameter field for contractility (26,27). The strength of a stress fiber is determined by a positive-feedback mechanism regarding how much force can be built up in a given direction, favoring directions of large effective stiffness. Cell shapes and forces then can be predicted if the attachment sites are known, for example, for micropatterns (20,28) and pillar arrays (29).
FEM-based models for cell shape usually assume linear elastic or hyperelastic material laws for the mechanical properties of cells. Indeed, this is often a good assumption, for example, on the large scale of tissues or for single cells with conserved volume. However, for cells adhering to a substrate, the projected area is not a conserved quantity, and volume can be exchanged with the third dimension. In this case, the mechanical response is mainly determined by the actin cytoskeleton, which behaves like an elastic solid under extension but does not resist compression because actin filaments under compression can buckle, depolymerize, and slide. When modeling cells on an intermediate length scale, this fundamental asymmetry between tension and compression can be represented by cable networks (30,31). If actomyosin contractility is represented not by a reduced resting length, but rather by a constant pull between neighboring nodes, one arrives at the model of actively contracting cable networks (18,21). Because contractile tension dominates in the bulk and passive elastic tension in the periphery, the corresponding computer simulations are described well by the analytical predictions of the TEM, both for actively contracting cable networks (21) and for thermoelastic continuum models (20).
All of the above models are relatively static in nature and assume that the general features of cell shape (in particular, pinning points to the substrate) are already known. Here, we aim to develop a model that predicts the dynamics of cell shape and traction forces on micropatterned substrates without any a priori assumptions regarding the final shape. Two types of model in particular seem to qualify for this purpose. Phase-field models (also known as level-set methods) have recently been used to predict cell shape in the context of cell migration, because they are particularly suited to represent propagating contours (32–34). To represent contractility, however, cellular Potts models (CPMs) seem to be more appropriate. CPMs are lattice-based and represent a cell by a collection of spins (compare Fig. 1 a), thus allowing for arbitrary cell shapes. By defining an energy functional on the spin configuration and exploiting the slow timescale for cell spreading, one can use Metropolis dynamics to propagate the system. CPMs are commonly used to model tissues, as reviewed in Anderson and Rejniak (35). One prominent application is the study of cell sorting by the differential adhesion hypothesis (36,37). Besides their applicability to tissue, CPMs have also been used in systems consisting of only a few cells (38). Recently, however, a CPM was applied also to predict the shape of single cells on micropatterned substrates (39). Moreover, single-keratocyte movement has been modeled with a CPM by coupling Metropolis dynamics to a model for actin polymerization (40).
Figure 1.
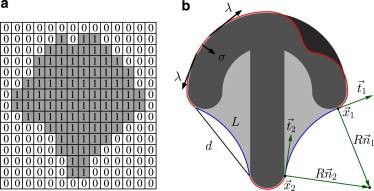
(a) Representation of a cell in the cellular Potts model (CPM). Occupied lattice sites are indicated by the index 1, empty sites by 0. With a sufficiently large number of spins, the resulting shapes are smooth and can be compared to other models or experiments. (b) Schematic representation of a cell (light gray) not fully spread on a crossbow-shaped micropattern (dark gray). Both the line tension, λ, and the surface tension, σ, act on the contour. Free spanning arcs form at concave parts of the pattern. They are characterized by the spanning distance, d, and arc contour length, L. In the tension-elasticity model (TEM), the line tension, λ, of the arcs is augmented by an elastic part. For the arc on the right side, the anchoring points of the contour are indicated by and with tangents and . The normals and point to the center of the circular arc with radius R. To see this figure in color, go online.
As in the case of the Ising model, the shapes predicted by the CPM are dominated by interfacial tension. This generates a close relation not only to contour models, but also to vertex models. However, the latter are not lattice-based but rather define energy functionals for cell shapes with straight or circular contours (that is, for the solutions of the Laplace law). They have been used, for example, to explore the role of mechanical interactions for growth of the Drosophila wing imaginal disk (41) or to investigate the influence of cell elasticity, cell-cell interaction, and cell proliferation on cell sheet-packing geometry (42,43). However, vertex models cannot be used to model single cells on micropatterns because they cannot account for arbitrary shapes.
To arrive at a flexible and dynamic modeling framework for cell shape and forces, here we choose to work with a CPM. To predict not only shape, but also traction forces of adhering cells, the CPM has to be modified in several regards. For this purpose, we use insights from the TEM to derive an energy functional for single cells on micropatterned substrates. The energy functional is based on the different kinds of tension acting in the cell, which are balanced by the adhesive substrate and manifest as traction force. From our predicted cell shapes, we can extract the traction force for any adhesive geometry in a very efficient manner and in good agreement with experimental results.
Cell-Shape Model
Energy functional
Single cells on flat micropatterned substrates are effectively two-dimensional and often form invaginated circular arcs along free edges (18). The circular shape can be understood in the context of a Laplace law, where a surface tension, σ, which draws the contour inward, is balanced by a line tension, λ, which wants to draw the contour straight (16,17). The surface tension results from the combined action of the plasma membrane wrapped around the cell body and the actin cortex underlying it (44). In particular, the actin cortex is contracted by myosin II minifilaments. The line tension reflects the fact that the plasma membrane and actin cortex are folded back onto themselves at the cell periphery and thus lead to a geometrically different contribution than in the bulk. Moreover, it reflects the fact that actin filament bundles tend to accumulate in these folded parts at the cell edge. The appearance of circular arcs is not restricted to cells on a dot pattern; it also occurs on concave parts of the micropatterned island (3,6), as depicted for the crossbow shape in Fig. 1 b. Here, the surface tension, σ, pulls the contour inward while the line tension, λ, pulls the contour outward. This is different at the convex parts, where both surface tension and line tension pull inward. This pull is balanced by the adhesion sites along the cell contour. Because the cell periphery is less reinforced by actin bundles along the convex parts, the line tension there is expected to be weaker.
The simplest model for the situation depicted in Fig. 1 b is the STM, which assumes both line tension, λs, and surface tension, σ, to be constant. A Laplace law results that predicts circular arcs with a constant radius of Rs = λs/σ to occur along free parts of the contour. In experiments, a correlation of the arc radius, R, and the spanning distance, d, between two adhesive islands was observed that can be understood in terms of a TEM (18). In this model, the reinforced actin edge fibers forming at the free spanning edges contribute with an elastic line tension λe = EA(L − L0)/L0, where the one-dimensional elastic modulus, , accounts for the rigidity of the contour, and L and are the contour length and rest length, respectively (see Fig. 1 b). Pinned parts of the contour are not reinforced, and we assume only the simple tension, λs, acting there. For the free arcs, one then has the overall line tension λ = λs + λe. Like the STM, the TEM also leads to a Laplace law. Combining this with the elastic line tension and the geometrical relation between arc radius R and spanning distance d, one finds a self-consistent equation for :
| (1) |
where is a length scale defined by the relative weight of the one-dimensional elastic modulus and the surface tension. Therefore, circular arcs also arise in the TEM, but with a radius, R, that increases with spanning distance, d, and with contour reinforcement, (18).
Like these contour models, the CPM also centers around the concept of geometrical tension, but it allows for much more variable geometries. Our CPM implementation uses a two-dimensional square lattice where the cell is represented by occupied lattice sites (see Fig. 1 a). The adhesive pattern is realized by marking the corresponding lattice sites as adhesive. Typically a pattern is made from 200 × 200 spins and the cell is represented by 30,000 spins. The length, l, of the total cell interface is calculated with a modified marching square algorithm. Because cell spreading is a relatively slow process (typical timescale 10 min), one can assume that the system is close to mechanical equilibrium, and the Metropolis algorithm can be used to propagate cell shape. During each step, a lattice site at the periphery of the cell is selected at random and inverted. Then, an appropriate energy functional is used to calculate the energy difference . The inversion is accepted with the probability if and with certainty otherwise. Here, the effective temperature, T, governs the contour fluctuation amplitude (typical value 0.2 in dimensionless units). Only lattice sites at the periphery of the cells are chosen for update attempts, because cells do not form spontaneous holes in the bulk or nucleate new material far away from the bulk. For a cell with n lattice sites in its periphery, a Monte Carlo sweep is defined as n inversion attempts. A more detailed description of the implementation can be found in the Supporting Material.
The core of the CPM is defined by the energy functional, which we choose to be
| (2) |
The first term accounts for the surface tension, which scales with the cell area, A, as a conjugated quantity. The second term is the contribution of the simple line tension, which scales with the cell perimeter, l. The third term is the sum over the contribution from each actin edge fiber, and a circle is fit to the corresponding part of the contour to calculate . All of the previously mentioned tensions contract a convex-shaped cell and are balanced by the adhesive geometry accounted for by the fourth term. Cells form adhesive contacts with the substrate, and the bond energy of each contact lowers the total energy. The number of adhesion molecules in a cell is finite and the energy gain by covering more adhesive area therefore saturates with the covered area, Aad. This choice ensures a linear growth during initial spreading, which later slows down and plateaus, as observed for many different cell types (45,46). Strength and saturation of the adhesive energy are controlled by E0 and Aref.
Cells in tissue are often described by CPM or vertex models with an energy functional including an elastic (harmonic) constraint on the cell area (36–39,41,42) In contrast to tissue, single cells on a substrate are essentially two-dimensional and can increase their projected surface area by taking material from the third dimension or by making use of the excess area stored in the plasma membrane or nearby vesicles. We therefore do not use an elastic area constraint in our energy functional. The implications of an elastic area constraint for the spreading dynamics and for the dependence of arc radius on spanning distance are discussed in the Supporting Material. There it is also shown that the fourth term in Eq. 2 can alternatively be interpreted as a saturation effect in membrane tension.
Parameter estimation
Surface tension has been estimated previously as σ ≈ 2 nN/μm from pillar deflections for endothelial cells (19) and σ ≈ 0.7 nN/μm from analysis of the traction forces of epithelial cell sheets (24). The simple line tension should be of the order of λs ≈ 10 nN, the typical force acting on a focal adhesion connected to the actin cytoskeleton (47). The rest length, L0, of the elastic arc is assumed to be equal to the spanning distance, d. The ratio of elastic rigidity and surface tension describes the degree of arc reinforcement and, for computational simplicity, is taken to be constant, although in practice it might vary dynamically during cell spreading. It has been estimated as lf = 1300 μm for buffalo rat liver cells on hard substrates with purely elastic arcs and a rest length of L0 = 1.01d (18). In our case, this value has to be reduced for several reasons, namely, that here we consider soft substrates, we have both simple and elastic tension, and we assume that . For typical arcs with R = 15 μm and d = 12 μm, the arc tension reached for a ratio of lf = 340 μm is the same as in the purely elastic case (σ ≈ 0.7 nN/μm, λs ≈ 10 nN). For a typical bundle radius of 100 nm, this would correspond to a Young modulus in the MPa range, as found experimentally (48).
The two remaining parameters, E0 and Aref, can be estimated from the adhesive energy density and the average cell size on homogeneous substrates. For weakly spread cells, the adhesive energy gain in Eq. 2 becomes W = E0/Aref as the number of adhesive contacts is not yet saturated. This adhesive energy density reflects the amount of adhesion receptors available to the cell and has been estimated previously as W = 20 nN/μm (49). Epithelial MCF10A cells on 3kP gels reach a spread area of A0 ≈ 1700 μm2, with an approximately round shape (50). To relate these values to our model, we note that there are no edge bundles on a homogeneous substrate, and the spread area, A, and adhesive area, Aad, in Eq. 2 are equal. The energy functional in Eq. 2 depends then only on A and its minimum determines the final cell size. From this, we calculate
| (3) |
| (4) |
Using these formulae, we obtain typical values for the adhesion parameters of E0 = 104 nN μm and Aref = 530 μm2 (σ ≈ 0.7 nN/μm, λs ≈ 10 nN). In experiments, these values can be varied, for example, by using micropatterns with different ligand density or with mixtures of functional and denatured proteins.
Traction forces
Contractile forces generated in cells are balanced by the adhesive substrate. Both the surface tension, σ, and the simple line tension, λs, pull normally to the contour, but the latter force depends on the curvature of the contour. For a given part of the contour with length dl, the force is (19)
| (5) |
where κ is the curvature and the normal vector of unit length pointing outward from the contour. Free spanning arcs are anchored at their endpoints and exert a force tangential to the contour (19),
| (6) |
where is the tangent at the endpoints. Note that the edge bundles only exert a tangential force at their endpoints if their line tension, λs + λe, is different from the value λs of the rest of the contour.
Having calculated the curvature and normal (as explained in the Supporting Material) for each lattice site along the contour for cell shapes predicted with our CPM, we can now use Eq. 5 to calculate the traction force acting on the adhesive part of the pattern beneath the contour. From circles fitted to the free spanning arcs, the tangent at the anchoring points, arc length, and spanning distance are estimated, which are then used in Eq. 6 to calculate the force acting on the anchoring points (represented in the simulations by a single lattice site). Together with the force generated by the adhesive part this gives the total traction force resulting from our shape model.
For comparison with experimental results, several issues have to be taken into account. First, our model predicts spatially strongly localized forces, whereas in practice they are typically distributed over a stripe of focal adhesions along the cell contour (3). We therefore distribute our simulated forces on a stripe 2 μm wide beneath the membrane using a disk-shaped kernel. Second, our model shows stochastic fluctuations in the cell contour that are expected to be averaged out in experiments. We therefore average it over 5 × 10⁵ Monte Carlo sweeps to account for fluctuation of the contour due to the finite simulation temperature. Third, traction forces are typically reconstructed in experiments by an inverse procedure that filters out displacement noise. To obtain traction data that are comparable to experimental results, we use the FEM as implemented in the deal.II library to calculate the displacement from our CPM. In our FEM calculations, the forces generated by the cell are applied to the surface of a linear elastic material 250 μm × 250 μm in area and 100 μm deep with a displacement-free boundary at the bottom and stress-free boundaries at the sides. The hexahedral mesh is locally refined beneath the cell. We then apply the Fourier-transform traction cytometry method (FTTC) (10,11) to obtain a traction pattern that can be compared directly with experimental results. A complete cycle of simulated forces, calculated displacement fields, and reconstructed forces can be found in Fig. S4 in the Supporting Material.
Momentum conservation and force magnitude
We now show that for our model, the sum of all traction forces vanishes, as required by momentum conservation. For a contour of parameterized by contour length l, the tangent is normalized and we can use Eq. 5 to write the sum of the traction forces resulting from the part of the contour extending from to as
| (7) |
The minus sign in the second term comes from the normal pointing outward. M is the matrix for a counterclockwise rotation and and are the tangents at the endpoints of the contour, as illustrated in Fig. 1 b. For cells without arcs, the start and end points of the integral are the same, and thus it vanishes, as required by momentum conservation.
For cells with a single arc, we can apply this calculation only to the complementary part of the contour. Moreover, we now have to account for the elastic line tension in the arc according to Eq. 6. Because the arc is circular, the contour endpoints and circle normals are related by . Combining this with Eqs. 6 and 7, the total force becomes
| (8) |
Rewriting the arc radius in terms of tension, , and rotating the normals with the matrix, M, shows that the net force vanishes. This also ensures momentum conservation in the STM, as this simply corresponds to setting the elastic tension, λe, to zero. For cells with more than one arc, the same result follows by recursion.
We finally comment on the magnitude of the total traction force. For cells on a homogeneous substrate, this is simply
| (9) |
Thus, the total traction force scales linearly with cell perimeter l as previously described for cell colonies (24). Both shape and size of the cell change the perimeter l and therefore influence the total force through the surface tension, σ. Larger cells or cells that deviate from a round shape exert a higher total force on the substrate than round cells with the same area, as was found experimentally for rectangular micropatterns (12).
Results
Equilibrium shapes and cell spreading
We first discuss the steady-state shape of cells on micropatterns. In Fig. 2, we compare experimental and simulated shapes for HeLa cells plated on three fibronectin-coated patterns commonly used for cell normalization, namely, the crossbow, Y, and H patterns. The pattern width is equal to 30 μm and the CPM simulation uses a lattice constant of 0.15 μm/pixel. One can see that our model predicts very well the typical sequence of convex and concave parts along the cell contour. Moreover, the arc reinforcement modeled by the TEM is clearly visible in all three actin images. Note that here, the same parameter set (λs ≈ 10 nN, σ ≈ 0.7 nN/μm, lf = 340 μm, A0 = 1200 μm2, E0 = 7800 nN μm, and Aref = 390 μm2) is used for all three cases, because they have been realized on the same chip with the same cell type and the same culture conditions.
Figure 2.
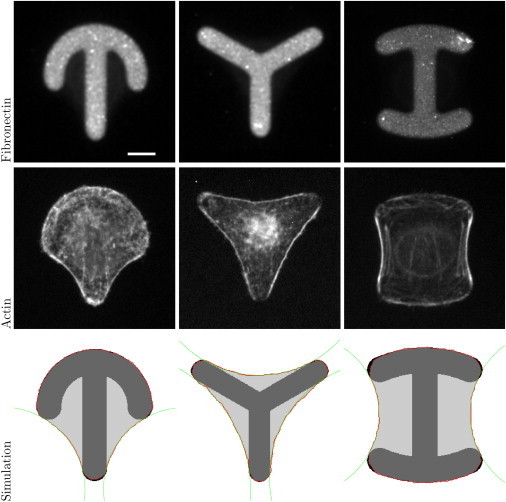
The top row shows experimental images for crossbow, Y, and H patterns coated with fibronectin. Scale bar, 10 μm. The middle row shows HeLa-cells stained for actin on those patterns. The bottom row shows shape predictions by the CPM with circles fitted to the free spanning arcs. Experimental images were kindly provided by Gintarė Garbenčiūtė and Vytaute Starkuviene-Erfle. To see this figure in color, go online.
The steady-state shapes shown in Fig. 2 result from a dynamical spreading process that cannot be easily described by standard models for cell shape. We now show that the CPM also describes this process very well. In our simulations, we start with a small spreading area of ∼10 μm in diameter at an arbitrary location on the pattern and then let the cell spread. Here, we choose the V-shaped pattern used in previous experimental studies (6). For the RPE1 cells used in this study, the steady-state arcs have an unusual small curvature, indicating that these cells have a weak bulk contractility or very strong arc reinforcement. For both STM and TEM, we first fix the model parameters such that this final steady-state shape is achieved. We use a relatively small surface tension of σ = 0.6 nN/μm. In the STM, this surface tension requires a simple line tension of λs ≈ 36.6 nN to reach the final arc radius of 61 μm. Then, adhesive energies of W = 60 nN/μm, several times larger than previous estimates (49), are required to allow spreading. For the TEM, the simple line tension can be reduced to λs ≈ 10 nN, because the final arc radius is also determined by the elastic contribution to the line tension. The elastic tension of EA = 2000 nN required to match the final arc radius is similar to values reported previously for stiff substrates (18). In this case, an adhesive energy of W = 10 nN/μm is sufficient to allow spreading.
With these parameters in place, we now can simulate the spreading dynamics as shown in Fig. 3 a (for a clearer illustration of spreading, see Movies S1 and S2 in the Supporting Material). When the cells bridge the nonadhesive gap of the V-shaped pattern, an actin edge bundle is formed, as indicated by the green circle. After a main spreading phase, during which the cell covers the complete adhesive area of the pattern, the free spanning edge continues to move outward, thereby increasing the spanning distance and the radius of the edge bundle. The same two-step process is seen in experiments (6). The STM and TEM models differ strongly in the timescale of spreading. Fig. 3 b shows the radius of the circles fitted to the edge bundles averaged over 104 cells spreading on a V-shaped pattern. Cells described by the TEM spread faster than cells described by the STM. The reason lies in the increased simple line tension of the STM needed to reach the same final radius as the TEM. The inset of Fig. 3 b compares the curves for the initial spreading phase with experimental data (6). TEM cells cover the whole adhesive area of the pattern after 80 Monte Carlo sweeps, whereas STM cells take up to 300 Monte Carlo sweeps. During this phase, the curves of the two models are qualitatively similar. However, only the TEM data can be fit well to the experimentally measured data. This implies an important role of arc reinforcement for the spreading process and sets the timescale to 30 min for the 80 Monte Carlo sweeps. One can understand the TEM as a mechanism that allows the cell to pull its contour outward above nonadhesive parts of the substrate without sacrificing any spreading potential above adhesive parts. Spreading within the STM on the V-shaped pattern with moderate choices for the simple tension and adhesive energy would only be possible with a reduced surface tension.
Figure 3.
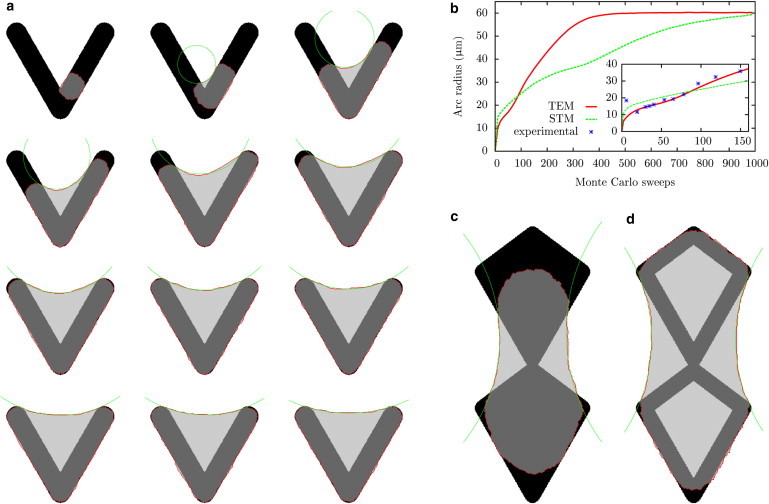
Cell shapes predicted by the CPM with surface tension σ = 0.6 nN/μm, simple tension λs = 10 nN, arc rigidity EA = 2000 nN, adhesive energy density W = 60 nN/μm, and cell target area A0 = 1700 μm2. (a) Cell spreading on a V-shaped pattern. The arms have an length of 46 μm and the final spanning distance and radius are d ≈ 33 μm, and R ≈ 61 nN/μm. A circle is fitted to the edge bundle. (b) Radius of the circle fitted to the edge as a function of Monte Carlo sweeps for cells described by the STM and TEM. The radius is averaged over 104 cells all starting to spread at the same position as in the previous figure. Here, each Monte Carlo sweep consists of 2 × 10⁴ attempts to invert one of the boundary lattice sites. For the simulation of the STM cells, a simple line tension of λs = 36.6 nN was used, resulting in the same final radius as for the TEM cells. (Inset) Initial spread phase and data taken from Théry et al. (6). (c) Final cell shape on an adhesive pattern that cannot be fully covered by the cell. Pattern has a width of 40 μm and a height of 96 μm. (d) Same as d, but with a hollow adhesive geometry. To see this figure in color, go online.
In contrast to elastic continuum models, the CPM also finds equilibrium shapes on adhesive islands that are too large to be fully covered by the cell. This is demonstrated in Fig. 3 c. Here, a tradeoff must be found between the adhesive energy gain, which favors a large cell, the line tension, which favors a small round cell, and circular arcs, which should be as flat as possible to minimize the energy. The result is a cell shape without sharp kinks and arcs ending as parallel as possible to the pattern contour with a large radius. In Fig. 3 d, the same adhesive shape is used as in Fig. 3 c, but with open diamond shapes. Now, the cell is able to cover the whole island because the reduction in adhesive surface leads to a less saturated adhesive energy gain in Eq. 2. In addition, arcs form inside the diamonds while the cell is spreading giving the cell an overall concave shape with reduced area, as compared to the partly convex cell on the solid diamond pattern in Fig. 3 c.
Prediction of elastic substrate displacements
Although our final aim is to predict traction force patterns for different micropatterns, we start our discussion of traction patterns with displacement fields, because these are the immediate outcome of experiments. Thus, we use the FEM to calculate from our simulated forces the displacement fields for an elastic substrate. We then compare these results to experimental data and fit our three main model parameters, namely, surface tension, σ, simple line tension, λs, and elastic line tension EA. In Fig. 4, we compare our results (upper row) to experimental data (lower row) (13). The parameters responsible for the adhesive energy gain, E0 and Aref, are found to be unimportant for the fit quality. Due to the small number of cells on the pacman pattern, we exclude it from the fit.
Figure 4.
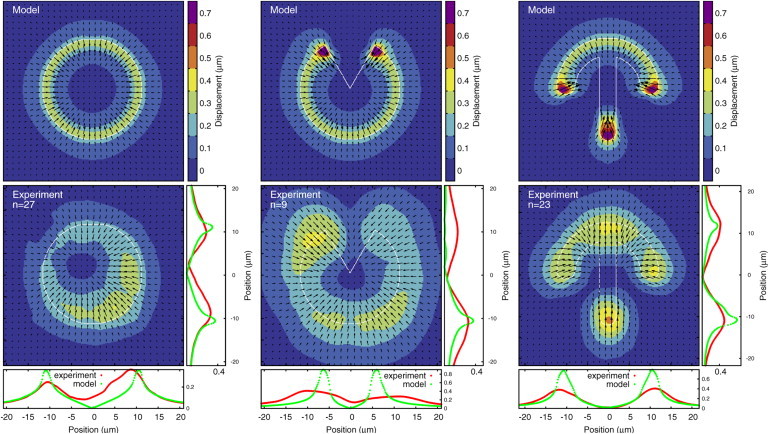
Calculated displacements (upper) and experimental displacements (lower) for MCF10A-cells on fibronectin patterns on a polyacrylamide substrate with a Young modulus of 5 kPa (13). Graphs below and to the right of the experimental displacements are vertical and horizontal one-dimensional slices of the displacement data. The slices always go through the center of the pattern except in the case of the pacman shape, where the horizontal slice goes through the tips. The number of averaged cells is indicated by n for each pattern. Experimental data were kindly provided by Martial Balland. To see this figure in color, go online.
Both the pacman and circular-disc patterns show the localization of displacements at the cell contour, as predicted by our model. For the circular disc, which only has continuously adhesive edges, the displacements are directed radially inward everywhere. This is different in the case of the pacman pattern, where in both the simulation and the experiment displacements deviate from the radial symmetry at the tips of the wedge. The displacements there point inward because of the actin edge bundle forming across the wedge. Cells described by the STM would have displacements pointing slightly away from the wedge because of the curvature of the cell contour there. The fit of our model parameters is dominated by the larger adhesive parts of the contour for those patterns. The STM and TEM predict similar magnitudes, which makes it difficult to distinguish between the two. Displacements for the crossbow are dominated more strongly by the two actin edge bundles and are largest at the extremities of the pattern due to the high curvature and bundles originating there. The experimental displacements in both arms of the crossbow are directed more upward than expected from the model. This might indicate the effect of internal actin fibers connecting from the tips to the top of the micropattern. On the other hand, displacements of the circular pattern and circular part of the crossbow pattern are very similar in magnitude and direction, indicating that polarized internal fibers only play a minor role in this case.
To quantify the quality of the fit we use the norm , which is the squared and normalized distance between the experimental and simulated displacement fields. For the STM, the fit yields a simple line tension of λs ≈ 5.53 nN, surface tension of σ ≈ 0.56 nN/μm and a L2 value of 0.16. For the TEM the fit yields λs ≈ 2.30 nN, σ ≈ 0.83 nN/μm, EA = 40 nN and a L2 value of 0.15. The TEM fits the data better, but the difference is small, since both the disc and crossbow are dominated by large convex parts where actin edge bundles are unimportant.
The TEM decreases the simple line tension while increasing the surface tension. As discussed above for spreading on the V-shaped pattern, the TEM allows the cell to pull its contour outward above nonadhesive parts of the substrate with a reduced simple tension. The increased surface tension in the TEM compensates for the reduced simple tension, but the contribution of the surface tension is curvature-independent. Thus, the TEM allows smaller forces in regions of high curvature while keeping forces in small-curvature regions the same as in the STM.
The overall agreement of our model with the experimental displacements demonstrated in Fig. 4 is quite good. However, the experimental displacements decay more slowly than the simulated ones, for several possible reasons. First, the 2-μm-wide stripe beneath the membrane where we apply forces to the substrate might be too narrow, and the size of the adhesions might vary with force (47,51). The agreement with the experimental data can be improved by increasing the stripe width to 4 μm, but this does not appear to be reasonable given the actual size of the adhesions and the feature size of the micropattern. It is therefore more likely that the disagreement arises from the limited resolution of bead tracking and from the registration and averaging procedures, both of which blur the displacement fields. Variations in the pattern shapes from manufacturing or by deformation from the cells also widen the force spots and make pattern registration more difficult. Because these experimental limitations might be improved in the future, for our theoretical predictions here we keep the 2 μm scale for the adhesion width.
Prediction of traction forces
Given the displacement data discussed above, one can now reconstruct traction forces that resemble those obtained from experimental data. For this purpose, we use FTTC with regularization (10,11). In the top row of Fig. 5, we show the traction force reconstructed from the simulations shown in Fig. 4. A comparison with the experimental data (Fig. 5, lower row) (13) shows that our procedure predicts most of the experimental features. The only exception seems to be the additional localization of experimental traction forces in the upper part of the crossbow pattern, which might be due to the occasional presence of internal stress fibers along the long side of this pattern.
Figure 5.
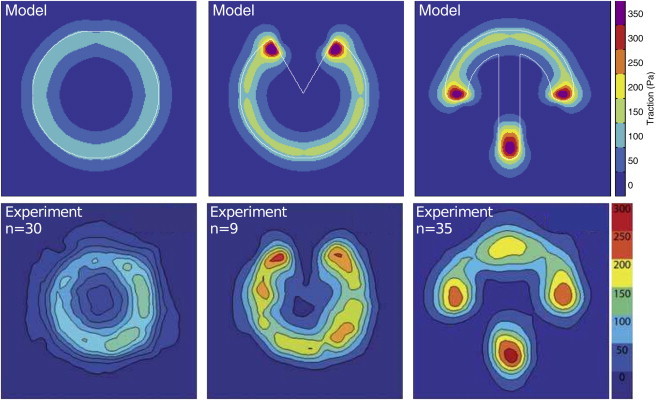
(Upper row) Reconstructed traction forces for the TEM with the best-fit parameters (λs = 2.30 nN, σ = 0.83 nN/μm, and EA = 40 nN). (Lower row) Traction forces reconstructed from experimental data for MCF10A-cells on fibronectin patterns on a polyacrylamide substrate. Experimental data are reproduced from Tseng et al. (13) with permission of The Royal Society of Chemistry. To see this figure in color, go online.
The influence of cell shape on force generation is best seen by gradually changing the adhesive geometry. Both curvature and spanning distance of the free arcs are varied in Fig. 6 as the T-shaped pattern is transformed into a crossbow for cells described by the TEM. For all shapes, the forces are localized to the extremities of the patterns, but increasing the curvature relocalizes them from the end points to the adhesive edge of the contour, and at the same time the force direction in the prominent force spots changes from being aligned with the edge bundles to a more radial orientation. Both observations, the force increase in the adhesive contour and the orientation change, have been observed for RPE1 cells (52). The increase of forces with higher curvature at the adhesive contour is a consequence of the simple line tension acting in the contour (compare Eq. 5). The prominent force spots in the extremities are due to the larger curvature and the edge bundles being anchored there. Changing the curvature of the top bar also decreases the spanning distance, and therefore the force in the bundles, from 7.75 nN in the T-shaped pattern to 4.33 nN in the final crossbow, which explains the decrease of forces in the prominent spots and also the directional change, since arc forces become less important. The force spot at the bottom of the T-shaped pattern is less localized compared to that in the final crossbow, because the edge bundles do not always attach to the outermost part of this pattern.
Figure 6.
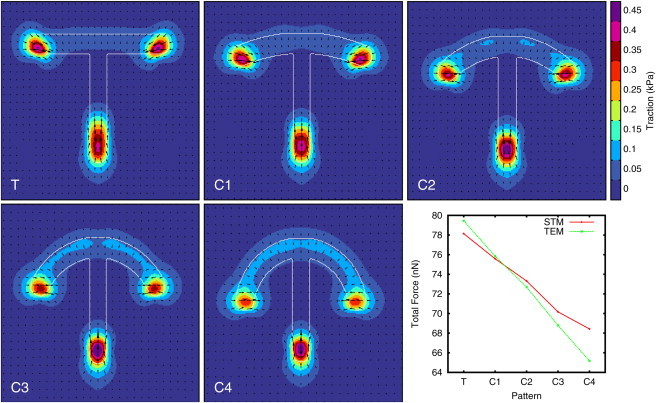
Reconstructed traction force for a T-shaped pattern, where the curvature of the top bar is changed into a crossbow-shaped pattern. Cells are modeled with the TEM with σ = 0.65 nN/μm, lf = 184 μm, and λs = 2.7 nN. The graph shows the total force for the different curvatures for both TEM and STM cells with σ = 0.65 nN/μm and λs = 6.5 nN. The pattern widths are T = 32 μm, C1 = 30.8 μm, C2 = 29.34 μm, C3 = 27.49 μm, and C4 = 25 μm and ensure the same cell area on all patterns. To see this figure in color, go online.
The STM yields similar results for the total force, but forces are always pointing radially inward. The decrease of the total force in the STM is a consequence of the rounder shape of the cells on the crossbow pattern as stated by Eq. 9 (the pattern dimensions are chosen to ensure the same cell area on all patterns, but their perimeter decreases linearly). For cells described by the TEM, the total force is also influenced by the decreased bundle tension, as reflected by the steeper slope in the lower right panel in Fig. 6, which shows the total force as a function of curvature. In Fig. 7, we show a gallery of additional shape and traction predictions for micropatterns for which no traction force fields have yet been reported in the experimental literature. Because these simulations are computationally very cheap, the CPM approach is a very helpful exploratory tool for quickly assessing the effect of a newly designed micropattern.
Figure 7.
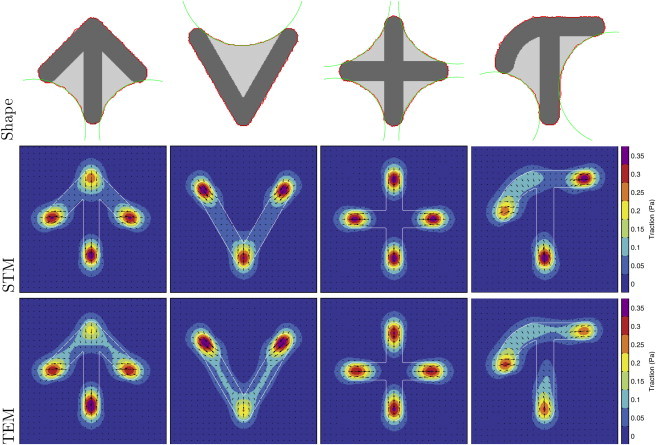
Predicted shapes and traction forces for further adhesive geometries for both STM and TEM. All patterns have a width of 25 μm. The parameters are taken from the best fit to the displacement data from Fig. 4. Parameters for STM are σ = 0.56 nN/μm, EA = 0, and λs = 5.53 nN, and those for TEM are σ = 0.83 nN/μm, EA = 40 nN, and λs = 2.3 nN. To see this figure in color, go online.
Discussion
In summary, the CPM is a versatile tool for robust prediction of cell shapes and forces on any micropattern of interest. The underlying reason is that it actually models the dynamic process of shape determination. Thus, it also makes predictions on spreading dynamics and does not require any a priori knowledge of the final shape. As shown above, all of our predictions agree quite well with published experimental data.
To adapt the CPM for the prediction of shapes and forces of single cells on two-dimensional micropatterns, we have made several modifications to the original formulation of the CPM model for cell shape in tissue. Despite its large contribution to the current understanding of cell sorting and cell shapes in tissue (35), the CPM has been used before only a few times to describe single cells (39,40). To further advance this approach, we have added two essential elements to the conventional CPM formulation. Motivated by the TEM, we have added an elastic line tension to describe the effect of contour reinforcement of edge bundles. Moreover, we have added an adhesion term to the energy functional that does not constrain cell area but acts like a reservoir for additional area that can be used if sufficient ligand is present. The good agreement of our model with experimental data, demonstrated here, confirms that our energy functional describes the main features of this system. One of the biggest advantages of our approach is that it is computationally inexpensive (typical runtime is on the subsecond timescale), thus making it an ideal exploratory tool for quickly establishing typical cell behavior on micropatterns without any a priori knowledge of the final shape.
Our model reveals that the TEM model allows for faster cell spreading within a reasonable parameter range and that elastic arcs act to relieve tension from adhesive parts of the contour while maintaining the same cell shape. The TEM makes spreading above nonadhesive parts easier and at the same time allows the cell to generate traction forces more by bulk than by contour tension. Our CPM assumes that spreading is limited mainly by the availability of adhesion receptors, thus leading to saturation in adhesive area. This approach neglects other potential limitations of spreading, most notably the effect of increased membrane tension (53). As shown in the Supporting Material, to first order the energy functional of Eq. 2 does not make a fundamental distinction between these two limitations for spreading. However, appropriately designed micropatterns might in fact be an appealing way to investigate these important questions in the future, both in experiments and in the framework of the CPM.
Combining the CPM with a contour model allowed us to interpret the energy terms in the CPM energy functional as tensions and provided an easy way to predict traction forces. The contour model also connects our three model parameters, namely, simple line tension, elastic line tension, and surface tension, to the cell geometry via the relation between spanning distance and arc radius (Eq. 1). For each cell type of interest, our model parameters can be fitted to the experimentally observed cell shape on a reference pattern and then used to predict cell shape and forces on other patterns. As more information becomes available for the detailed molecular structure of actin cortex and peripheral fibers, our model can be modified to include such information, e.g., by replacing the TEM term in the energy functional of Eq. 2 with a more detailed expression.
There are two important aspects of cell adhesion to micropatterns that are not addressed in this study. First, our model does not describe the effect of internal structures like nonperipheral stress fibers. We expect that this is a good approximation, as long as several cells are averaged to obtain a generic result that averages out individual inhomogeneities. Otherwise, more detailed models are required that also include internal stress fibers (54). Such extensions might profit from recent advances in our understanding of the internal structure and dynamics of different kinds of stress fibers (55,56). Second, our model does not explicitly describe the effect of the mechanical feedback between elastic substrate and cell adhesion, which allows the cell to sense the rigidity of its environment (1,2,57). To include this important aspect in our model, it had to be extended by models of the mechanosensitive organization of the adhesion structure and the actin cytoskeleton (58). At the current stage, the effect of stiffness is incorporated by fitting the model parameters to experimental reference data and calculating displacement fields with the correct rigidity values of the substrate.
Here, we have focused on spreading dynamics and steady-state properties of sessile cells. In this case, the Metropolis approach is expected to work well, because the cell is essentially relaxing to local mechanical equilibrium. When combined with a model for actin polymerization (40), our model can be extended in the future to study also persistent cell movement on single micropatterns or on networks of micropatterns.
Acknowledgments
We thank Jérôme Soiné and Christoph Brand for help with the FEM and optimization software, and Sebastien Degot, Yoran Margaron, and Michel Bornens for helpful discussions regarding cells on micropatterns. We thank Gintarė, Garbenčiūtė and Vytaute Starkuviene-Erfle, from Heidelberg, for providing the experimental images shown in Fig. 2 and Martial Balland, from Grenoble, for providing the experimental displacement data used in Fig. 4.
The authors acknowledge support by the European Union program MEHTRICS. U.S.S. is a member of the Heidelberg cluster of excellence CellNetworks.
Supporting Material
References
- 1.Geiger B., Spatz J.P., Bershadsky A.D. Environmental sensing through focal adhesions. Nat. Rev. Mol. Cell Biol. 2009;10:21–33. doi: 10.1038/nrm2593. [DOI] [PubMed] [Google Scholar]
- 2.Schwarz U.S., Gardel M.L. United we stand: integrating the actin cytoskeleton and cell-matrix adhesions in cellular mechanotransduction. J. Cell Sci. 2012;125:3051–3060. doi: 10.1242/jcs.093716. [DOI] [PMC free article] [PubMed] [Google Scholar]
- 3.Théry M., Racine V., Bornens M. Anisotropy of cell adhesive microenvironment governs cell internal organization and orientation of polarity. Proc. Natl. Acad. Sci. USA. 2006;103:19771–19776. doi: 10.1073/pnas.0609267103. [DOI] [PMC free article] [PubMed] [Google Scholar]
- 4.Vignaud T., Blanchoin L., Théry M. Directed cytoskeleton self-organization. Trends Cell Biol. 2012;22:671–682. doi: 10.1016/j.tcb.2012.08.012. [DOI] [PubMed] [Google Scholar]
- 5.Chen C.S., Mrksich M., Ingber D.E. Geometric control of cell life and death. Science. 1997;276:1425–1428. doi: 10.1126/science.276.5317.1425. [DOI] [PubMed] [Google Scholar]
- 6.Théry M., Pépin A., Bornens M. Cell distribution of stress fibres in response to the geometry of the adhesive environment. Cell Motil. Cytoskeleton. 2006;63:341–355. doi: 10.1002/cm.20126. [DOI] [PubMed] [Google Scholar]
- 7.Théry M., Jiménez-Dalmaroni A., Jülicher F. Experimental and theoretical study of mitotic spindle orientation. Nature. 2007;447:493–496. doi: 10.1038/nature05786. [DOI] [PubMed] [Google Scholar]
- 8.Schauer K., Duong T., Goud B. Probabilistic density maps to study global endomembrane organization. Nat. Methods. 2010;7:560–566. doi: 10.1038/nmeth.1462. [DOI] [PubMed] [Google Scholar]
- 9.Dembo M., Wang Y.-L. Stresses at the cell-to-substrate interface during locomotion of fibroblasts. Biophys. J. 1999;76:2307–2316. doi: 10.1016/S0006-3495(99)77386-8. [DOI] [PMC free article] [PubMed] [Google Scholar]
- 10.Butler J.P., Tolić-Nųrrelykke I.M., Fredberg J.J. Traction fields, moments, and strain energy that cells exert on their surroundings. Am. J. Physiol. Cell Physiol. 2002;282:C595–C605. doi: 10.1152/ajpcell.00270.2001. [DOI] [PubMed] [Google Scholar]
- 11.Sabass B., Gardel M.L., Schwarz U.S. High resolution traction force microscopy based on experimental and computational advances. Biophys. J. 2008;94:207–220. doi: 10.1529/biophysj.107.113670. [DOI] [PMC free article] [PubMed] [Google Scholar]
- 12.Rape A.D., Guo W.-H., Wang Y.-L. The regulation of traction force in relation to cell shape and focal adhesions. Biomaterials. 2011;32:2043–2051. doi: 10.1016/j.biomaterials.2010.11.044. [DOI] [PMC free article] [PubMed] [Google Scholar]
- 13.Tseng Q., Wang I., Balland M. A new micropatterning method of soft substrates reveals that different tumorigenic signals can promote or reduce cell contraction levels. Lab Chip. 2011;11:2231–2240. doi: 10.1039/c0lc00641f. [DOI] [PubMed] [Google Scholar]
- 14.Hampe N., Jonas T., Merkel R. Defined 2-D microtissues on soft elastomeric silicone rubber using lift-off epoxy-membranes for biomechanical analyses. Soft Matter. 2014;10:2431–2443. doi: 10.1039/c3sm53123f. [DOI] [PubMed] [Google Scholar]
- 15.Schwarz U.S., Safran S.A. Physics of adherent cells. Rev. Mod. Phys. 2013;85:1327–1381. [Google Scholar]
- 16.Zand M.S., Albrecht-Buehler G. What structures, besides adhesions, prevent spread cells from rounding up? Cell Motil. Cytoskeleton. 1989;13:195–211. doi: 10.1002/cm.970130307. [DOI] [PubMed] [Google Scholar]
- 17.Bar-Ziv R., Tlusty T., Bershadsky A.D. Pearling in cells: a clue to understanding cell shape. Proc. Natl. Acad. Sci. USA. 1999;96:10140–10145. doi: 10.1073/pnas.96.18.10140. [DOI] [PMC free article] [PubMed] [Google Scholar]
- 18.Bischofs I.B., Klein F., Schwarz U.S. Filamentous network mechanics and active contractility determine cell and tissue shape. Biophys. J. 2008;95:3488–3496. doi: 10.1529/biophysj.108.134296. [DOI] [PMC free article] [PubMed] [Google Scholar]
- 19.Bischofs I.B., Schmidt S.S., Schwarz U.S. Effect of adhesion geometry and rigidity on cellular force distributions. Phys. Rev. Lett. 2009;103:048101. doi: 10.1103/PhysRevLett.103.048101. [DOI] [PubMed] [Google Scholar]
- 20.Farsad M., Vernerey F.J. An XFEM-based numerical strategy to model mechanical interactions between biological cells and a deformable substrate. Int. J. Numer. Methods Eng. 2012;92:238–267. [Google Scholar]
- 21.Guthardt Torres P., Bischofs I.B., Schwarz U.S. Contractile network models for adherent cells. Phys. Rev. E Stat. Nonlin. Soft Matter Phys. 2012;85:011913. doi: 10.1103/PhysRevE.85.011913. [DOI] [PubMed] [Google Scholar]
- 22.Nelson C.M., Jean R.P., Chen C.S. Emergent patterns of growth controlled by multicellular form and mechanics. Proc. Natl. Acad. Sci. USA. 2005;102:11594–11599. doi: 10.1073/pnas.0502575102. [DOI] [PMC free article] [PubMed] [Google Scholar]
- 23.Edwards C.M., Schwarz U.S. Force localization in contracting cell layers. Phys. Rev. Lett. 2011;107:128101. doi: 10.1103/PhysRevLett.107.128101. [DOI] [PubMed] [Google Scholar]
- 24.Mertz A.F., Banerjee S., Dufresne E.R. Scaling of traction forces with the size of cohesive cell colonies. Phys. Rev. Lett. 2012;108:198101. doi: 10.1103/PhysRevLett.108.198101. [DOI] [PMC free article] [PubMed] [Google Scholar]
- 25.Banerjee S., Marchetti M.C. Controlling cellmatrix traction forces by extracellular geometry. New J. Phys. 2013;15:035015. [Google Scholar]
- 26.Deshpande V.S., McMeeking R.M., Evans A.G. A bio-chemo-mechanical model for cell contractility. Proc. Natl. Acad. Sci. USA. 2006;103:14015–14020. doi: 10.1073/pnas.0605837103. [DOI] [PMC free article] [PubMed] [Google Scholar]
- 27.Deshpande V.S., McMeeking R.M., Evans A.G. A model for the contractility of the cytoskeleton including the effects of stress-fibre formation and dissociation. Proc. R. Soc. Lond. A Math. Phys. Sci. 2007;463:787–815. [Google Scholar]
- 28.Pathak A., Deshpande V.S., Evans A.G. The simulation of stress fibre and focal adhesion development in cells on patterned substrates. J. R. Soc. Interface. 2008;5:507–524. doi: 10.1098/rsif.2007.1182. [DOI] [PMC free article] [PubMed] [Google Scholar]
- 29.McGarry J.P., Fu J., Deshpande V.S. Simulation of the contractile response of cells on an array of micro-posts. Philos. Trans. R. Soc. Lond. A. 2009;367:3477–3497. doi: 10.1098/rsta.2009.0097. [DOI] [PMC free article] [PubMed] [Google Scholar]
- 30.Coughlin M.F., Stamenović D. A prestressed cable network model of the adherent cell cytoskeleton. Biophys. J. 2003;84:1328–1336. doi: 10.1016/S0006-3495(03)74948-0. [DOI] [PMC free article] [PubMed] [Google Scholar]
- 31.Paul R., Heil P., Schwarz U.S. Propagation of mechanical stress through the actin cytoskeleton toward focal adhesions: model and experiment. Biophys. J. 2008;94:1470–1482. doi: 10.1529/biophysj.107.108688. [DOI] [PMC free article] [PubMed] [Google Scholar]
- 32.Shao D., Rappel W.-J., Levine H. Computational model for cell morphodynamics. Phys. Rev. Lett. 2010;105:108104. doi: 10.1103/PhysRevLett.105.108104. [DOI] [PMC free article] [PubMed] [Google Scholar]
- 33.Ziebert F., Swaminathan S., Aranson I.S. Model for self-polarization and motility of keratocyte fragments. J. R. Soc. Interface. 2012;9:1084–1092. doi: 10.1098/rsif.2011.0433. [DOI] [PMC free article] [PubMed] [Google Scholar]
- 34.Ziebert F., Aranson I.S. Effects of adhesion dynamics and substrate compliance on the shape and motility of crawling cells. PLoS ONE. 2013;8:e64511. doi: 10.1371/journal.pone.0064511. [DOI] [PMC free article] [PubMed] [Google Scholar]
- 35.Anderson A., Rejniak K., editors. Single-Cell-Based Models in Biology and Medicine. Birkhäuser; Basel: 2007. [Google Scholar]
- 36.Graner F., Glazier J.A. Simulation of biological cell sorting using a two-dimensional extended Potts model. Phys. Rev. Lett. 1992;69:2013–2016. doi: 10.1103/PhysRevLett.69.2013. [DOI] [PubMed] [Google Scholar]
- 37.Glazier J.A., Graner F. Simulation of the differential adhesion driven rearrangement of biological cells. Phys. Rev. E Stat. Phys. Plasmas Fluids Relat. Interdiscip. Topics. 1993;47:2128–2154. doi: 10.1103/physreve.47.2128. [DOI] [PubMed] [Google Scholar]
- 38.Käfer J., Hayashi T., Graner F. Cell adhesion and cortex contractility determine cell patterning in the Drosophila retina. Proc. Natl. Acad. Sci. USA. 2007;104:18549–18554. doi: 10.1073/pnas.0704235104. [DOI] [PMC free article] [PubMed] [Google Scholar]
- 39.Vianay B., Käfer J., Guillou H. Single cells spreading on a protein lattice adopt an energy minimizing shape. Phys. Rev. Lett. 2010;105:128101. doi: 10.1103/PhysRevLett.105.128101. [DOI] [PMC free article] [PubMed] [Google Scholar]
- 40.Marée A.F.M., Grieneisen V.A., Edelstein-Keshet L. How cells integrate complex stimuli: the effect of feedback from phosphoinositides and cell shape on cell polarization and motility. PLOS Comput. Biol. 2012;8:e1002402. doi: 10.1371/journal.pcbi.1002402. [DOI] [PMC free article] [PubMed] [Google Scholar]
- 41.Hufnagel L., Teleman A.A., Shraiman B.I. On the mechanism of wing size determination in fly development. Proc. Natl. Acad. Sci. USA. 2007;104:3835–3840. doi: 10.1073/pnas.0607134104. [DOI] [PMC free article] [PubMed] [Google Scholar]
- 42.Farhadifar R., Röper J.-C., Jülicher F. The influence of cell mechanics, cell-cell interactions, and proliferation on epithelial packing. Curr. Biol. 2007;17:2095–2104. doi: 10.1016/j.cub.2007.11.049. [DOI] [PubMed] [Google Scholar]
- 43.Aliee M., Röper J.-C., Dahmann C. Physical mechanisms shaping the Drosophila dorsoventral compartment boundary. Curr. Biol. 2012;22:967–976. doi: 10.1016/j.cub.2012.03.070. [DOI] [PubMed] [Google Scholar]
- 44.Lecuit T., Lenne P.-F. Cell surface mechanics and the control of cell shape, tissue patterns and morphogenesis. Nat. Rev. Mol. Cell Biol. 2007;8:633–644. doi: 10.1038/nrm2222. [DOI] [PubMed] [Google Scholar]
- 45.Dubin-Thaler B.J., Giannone G., Sheetz M.P. Nanometer analysis of cell spreading on matrix-coated surfaces reveals two distinct cell states and STEPs. Biophys. J. 2004;86:1794–1806. doi: 10.1016/S0006-3495(04)74246-0. [DOI] [PMC free article] [PubMed] [Google Scholar]
- 46.Cuvelier D., Théry M., Mahadevan L. The universal dynamics of cell spreading. Curr. Biol. 2007;17:694–699. doi: 10.1016/j.cub.2007.02.058. [DOI] [PubMed] [Google Scholar]
- 47.Balaban N.Q., Schwarz U.S., Geiger B. Force and focal adhesion assembly: a close relationship studied using elastic micropatterned substrates. Nat. Cell Biol. 2001;3:466–472. doi: 10.1038/35074532. [DOI] [PubMed] [Google Scholar]
- 48.Deguchi S., Ohashi T., Sato M. Tensile properties of single stress fibers isolated from cultured vascular smooth muscle cells. J. Biomech. 2006;39:2603–2610. doi: 10.1016/j.jbiomech.2005.08.026. [DOI] [PubMed] [Google Scholar]
- 49.Cohen M., Joester D., Addadi L. Spatial and temporal sequence of events in cell adhesion: from molecular recognition to focal adhesion assembly. ChemBioChem. 2004;5:1393–1399. doi: 10.1002/cbic.200400162. [DOI] [PubMed] [Google Scholar]
- 50.Kostic A., Lynch C.D., Sheetz M.P. Differential matrix rigidity response in breast cancer cell lines correlates with the tissue tropism. PLoS ONE. 2009;4:e6361. doi: 10.1371/journal.pone.0006361. [DOI] [PMC free article] [PubMed] [Google Scholar]
- 51.Trichet L., Le Digabel J., Ladoux B. Evidence of a large-scale mechanosensing mechanism for cellular adaptation to substrate stiffness. Proc. Natl. Acad. Sci. USA. 2012;109:6933–6938. doi: 10.1073/pnas.1117810109. [DOI] [PMC free article] [PubMed] [Google Scholar]
- 52.Vignaud, T. 2013. Force generation by the actin cytoskeleton: mechanisms and regulation by the micro-environment. PhD thesis. Joseph Fourier University, Grenoble, France.
- 53.Gauthier N.C., Fardin M.A., Sheetz M.P. Temporary increase in plasma membrane tension coordinates the activation of exocytosis and contraction during cell spreading. Proc. Natl. Acad. Sci. USA. 2011;108:14467–14472. doi: 10.1073/pnas.1105845108. [DOI] [PMC free article] [PubMed] [Google Scholar]
- 54.Loosli Y., Luginbuehl R., Snedeker J.G. Cytoskeleton reorganization of spreading cells on micro-patterned islands: a functional model. Philos. Trans. R. Soc. Lond. A. 2010;368:2629–2652. doi: 10.1098/rsta.2010.0069. [DOI] [PubMed] [Google Scholar]
- 55.Hotulainen P., Lappalainen P. Stress fibers are generated by two distinct actin assembly mechanisms in motile cells. J. Cell Biol. 2006;173:383–394. doi: 10.1083/jcb.200511093. [DOI] [PMC free article] [PubMed] [Google Scholar]
- 56.Tanner K., Boudreau A., Kumar S. Dissecting regional variations in stress fiber mechanics in living cells with laser nanosurgery. Biophys. J. 2010;99:2775–2783. doi: 10.1016/j.bpj.2010.08.071. [DOI] [PMC free article] [PubMed] [Google Scholar]
- 57.Guvendiren M., Burdick J.A. Stiffening hydrogels to probe short- and long-term cellular responses to dynamic mechanics. Nat. Commun. 2012;3:792. doi: 10.1038/ncomms1792. [DOI] [PubMed] [Google Scholar]
- 58.Shemesh T., Bershadsky A.D., Kozlov M.M. Physical model for self-organization of actin cytoskeleton and adhesion complexes at the cell front. Biophys. J. 2012;102:1746–1756. doi: 10.1016/j.bpj.2012.03.006. [DOI] [PMC free article] [PubMed] [Google Scholar]
- 59.Lorensen W., Cline H. Marching cubes: A high resolution 3D surface construction algorithm. ACM Siggraph Comput. Graph. 1987;21:163–169. [Google Scholar]
- 60.Mantz H., Jacobs K., Mecke K. Utilizing Minkowski functionals for image analysis: a marching square algorithm. J. Stat. Mech. Theory Exp. 2008;2008:P12015. [Google Scholar]
Associated Data
This section collects any data citations, data availability statements, or supplementary materials included in this article.