

Abstract
SMARTCyp is an in silico method that predicts the sites of cytochrome P450-mediated metabolism of druglike molecules. The method is foremost a reactivity model, and as such, it shows a preference for predicting sites that are metabolized by the cytochrome P450 3A4 isoform. SMARTCyp predicts the site of metabolism directly from the 2D structure of a molecule, without requiring calculation of electronic properties or generation of 3D structures. This is a major advantage, because it makes SMARTCyp very fast. Other advantages are that experimental data are not a prerequisite to create the model, and it can easily be integrated with other methods to create models for other cytochrome P450 isoforms. Benchmarking tests on a database of 394 3A4 substrates show that SMARTCyp successfully identifies at least one metabolic site in the top two ranked positions 76% of the time. SMARTCyp is available for download at http://www.farma.ku.dk/p450.
Keywords: Cytochromes P450, metabolism, DFT, density functional theory, heme
Today, the drug development process strives to not only optimize the activity of a drug candidate but also establish a relationship between the pharmacodynamics and the pharmacokinetics of the drug candidate. The kinetic profile of a compound is heavily dependent on phase I metabolism in which the cytochromes P450 (CYPs) plays a pivotal role.
CYPs form a ubiquitous protein family of heme−thiolate enzymes, which have 60 different isoforms in humans. They perform a number of different reactions such as aliphatic hydroxylation, N-, S-, and O-dealkylation, aromatic oxidation, epoxidation, and S- and N-oxidation. CYPs are also the cause of the majority of drug−drug interactions and metabolism-dependent toxicity issues.1 Thus, the prediction of site(s) of metabolism (SOM) is a crucial step in drug development.
During the past decade, a number of methods for predicting CYP metabolism have been developed that use quantitative structure−activity relationship, docking, pharmacophore modeling, statistical methods, and/or semiempirical calculations (reviewed several times1−3). Their accuracy and applicability vary significantly; some give isoform-specific results, whereas others only give results for CYP metabolism in general.
Most previously published methods for predicting CYP metabolism require experimental data to generate the models. Such data are incomplete, because they always include sites that are “false negatives” (reactive sites for which metabolites are not found because the metabolite is found for an even more reactive site)4 and often include compounds with metabolites missing, which leads to a great deal of noise in the training data.
Here, we present SMARTCyp, a novel method for prediction of CYP metabolism. SMARTCyp does not require 3D structures of a molecule, and while it is validated on experimental data, its development does not depend on it. The idea behind SMARTCyp is that activation energies of CYPs reacting with ligand fragments computed by quantum chemical methods are the best possible reference for the reactivity of a fragment. Reference data from quantum chemical calculations have a very high signal-to-noise ratio since there are no experimental errors or so-called false negatives in the data. The results are very easy to interpret as the lower the activation energies are, the more likely a site is to be metabolized.
SMARTCyp uses a very simple algorithm (see Figure 1), which involves a reactivity descriptor and an accessibility descriptor. The reactivity descriptor, E, which is an estimation of the energy required for a CYP to react at this position, is calculated for each atom by matching SMARTS patterns to a lookup table of energies in kJ/mol (Table S1 in the Supporting Information), which is similar to the approach used by Singh et al.5 Atoms not matching any pattern are not considered to be reactive. The accessibility descriptor, A, is the SPAN descriptor ratio as defined by Sheridan et al.6 It is defined as the longest bond path distance from a given atom divided by the longest bond path distance in the whole molecule (see the example in Figure 1). This is a measure of how far from the 2D center of the molecule an atom is positioned and is always a number between 0.5 and 1. Hence, it is not a measure of the accessible surface area, but it describes how atoms at the end of a molecule are more likely to end up close to the reactive heme group in the CYP active site. Finally, the score, S, is computed for each atom as S = E − 8A, where a lower score indicates a higher probability of being a SOM. The constant 8 has been chosen so that the accessibility may modify the score corresponding to at most an energy of 4 kJ/mol (which is slightly higher than the average standard deviation among the calculated energies in our rules, which is 3.2 kJ/mol). This allows slightly less reactive atoms to be ranked higher if their accessibility, A, is significantly larger.
Figure 1.
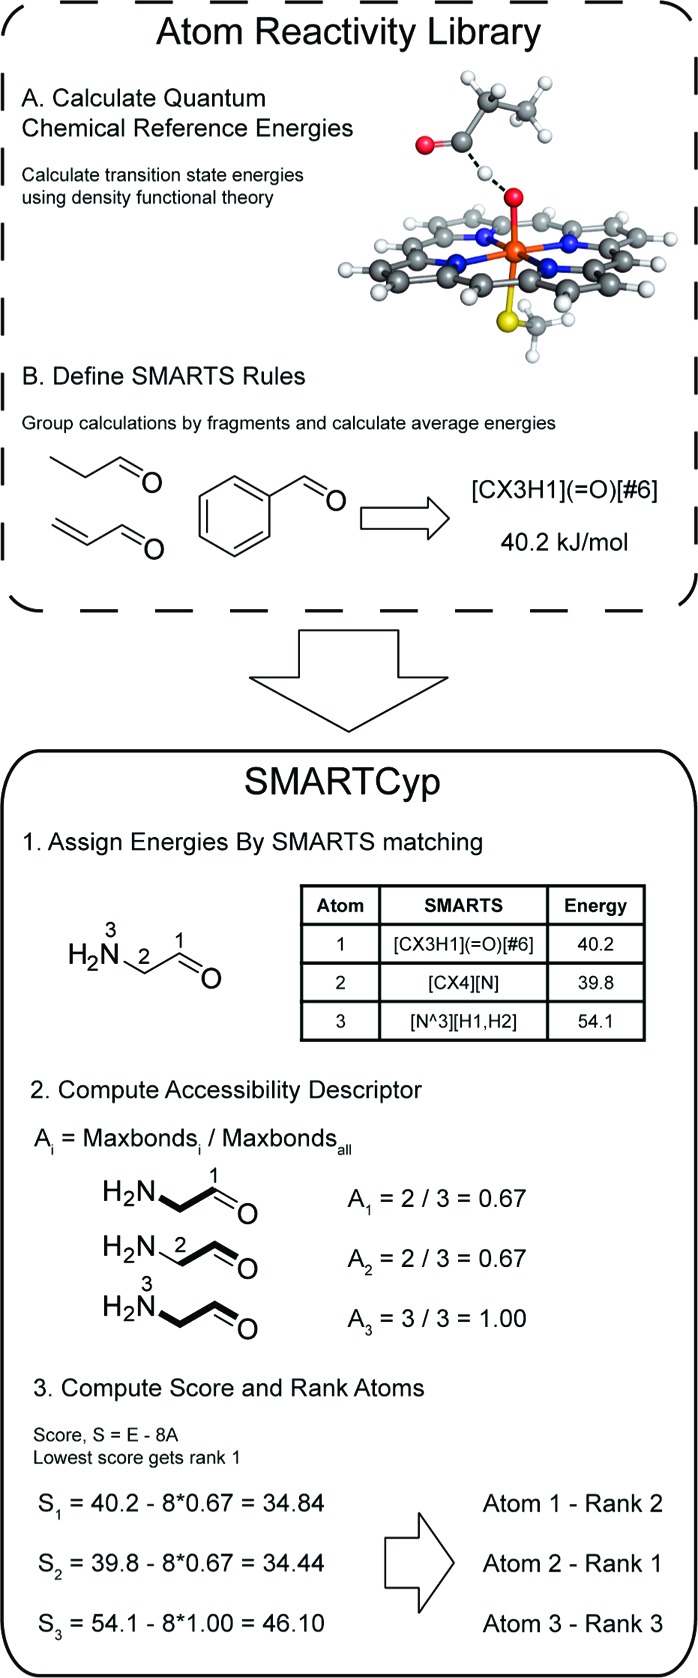
SMARTCyp algorithm and the generation of the atom reactivity library in the form of activation energies. The SMARTS rules in the figure are simplified.
In a previous study, 11 general rules for aliphatic, aromatic, and alkene carbon atoms were developed from calculations of activation energies for 50 carbon sites.7 Here, we extend and modify those rules using results from our previous studies8−10 and new data. In total, 139 transition states were computed as described in the Experimental Procedures. The different sites computed can be split into six different types that represent one or several types of P450 reactions (see Table 1). The distribution of activation energies varies quite a lot between the different types, with desulfurization of phosphorus and S-oxidations giving the lowest energies and N-oxidation and N-dealkylation of peptide groups giving the highest energies (see Figure 2). To obtain the activation energies, the reaction step with the highest activation energy in the respective reactions has been computed. For aliphatic hydroxylation, aldehyde hydroxylation, and dealkylation reactions, this is hydrogen abstraction from a carbon atom, whereas for the other reaction types, it is the attack of the oxygen on the respective atom. The number of calculations for the different types of metabolic sites and the corresponding number of rules are described in Table 1. Details about the results from these calculations as well as the actual SMARTS rules with corresponding energies are available in the Supporting Information (Tables S1 and S2).
Table 1. Summary of the Transition State Calculations and SMARTS Rules.
| atom type | reaction types | no. of calculations | no. of rules |
|---|---|---|---|
| sp3 carbon | aliphatic hydroxylation | 53 | 12 |
| N-dealkylation | |||
| O-dealkylation | |||
| S-dealkylation | |||
| sp2 carbon | epoxidation | 44 | 12 |
| aromatic | |||
| hydroxylation | |||
| aromatic oxidation | |||
| aldehyde sp2 carbon | hydroxylation | 3 | 1 |
| nitrogen | oxidation | 19 | 7 |
| sulfur | oxidation | 19 | 8 |
| phosphor | desulfurization | 1 | 1 |
| sum | 139 | 41 | |
Figure 2.
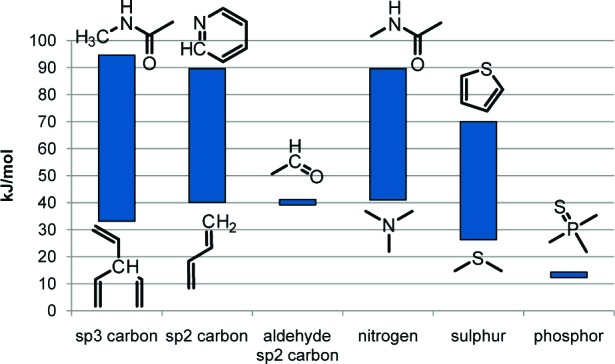
Energy ranges in the SMARTS rules for the various atom types. Example structures for the drug fragments giving the smallest and largest activation energies for each atom type are shown below and above the energy bars.
The method identifies the sites in a drug compound that are most reactive with regard to CYP-mediated reactions. Among the many CYP isoforms, 3A4 is known to have the largest active site and the most flexible structure.11 Because of this, it is the most promiscuous isoform with small restrictions on the size and shape of its substrates, and thus, reactivity is very important in determining the SOM in this isoform. Because SMARTCyp is foremost a reactivity model, it can be directly applied to 3A4 substrates, without need to integrate a docking/recognition component as in our earlier work on 1A2.7
The data set used to test SMARTCyp contains 394 compounds and is described in Table 2. It contains compounds where the SOMs have been determined by experiments with isolated CYP3A4 and/or microsomes using 3A4 inhibitors. The data set is available as an SDF file with annotated reactive positions, positions predicted by SMARTCyp, and references in the Supporting Information. Three hundred twenty-four of the compounds originate from the work of Sheridan et al.6 Additional compounds are primarily from the reviews by Brown12 and Rendic.13
Table 2. Description of the Data Set Used for Testing SMARTCyp.
| no. of compounds | 394 |
| no. of heavy atoms | 8218 |
| no. of metabolic sites | 685 |
| percentage metabolic sites | 8.3% |
| metabolic sites/compound | 1.73 |
| aliphatic hydroxylations | 242 (35%) |
| N-dealkylations | 172 (25%) |
| O-dealkylations | 54 (8%) |
| aromatic hydroxylations | 115 (17%) |
| double bond oxidations | 8 (1%) |
| N-oxidations | 34 (5%) |
| S-oxidations | 43 (6%) |
| others | 17 (2%) |
Interestingly, a metabolite was found as the top ranked position in 65% of all compounds and in the top three ranked positions in 81% of the compounds. This is in line with the fact that the binding site of CYP3A4 is not very restrictive and the most reactive parts of the substrates are likely to undergo metabolism. Comparing the results to StarDrop,14 a software that uses the 3D information of the substrates in the model, very similar performances are obtained (see Table 3).
Table 3. Results for the CYP3A4 Data Set and Comparison to StarDrop.
| SMARTCyp | StarDrop | |
|---|---|---|
| compounds with a metabolic position ranked highest (%) | 65 | 59 |
| compounds with a metabolic position ranked 1 or 2 (%) | 76 | 75 |
| compounds with a metabolic position ranked 1, 2, or 3 (%) | 81 | 84 |
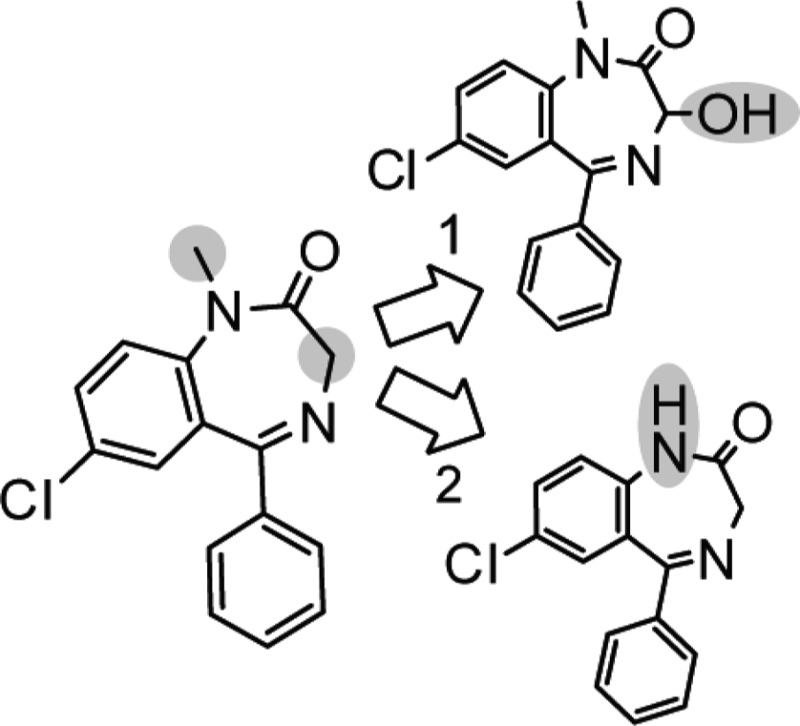
For 42% of the compounds, SMARTCyp has correctly identified all metabolites in the top ranked positions (no false positives; see ametryne, diazepam, and 7-pentoxycoumarin in Figure 3). However, most of these (34%) only have one metabolite. The result for seratrodast shown in Figure 3 illustrates one of the limitations of SMARTCyp, that highly reactive sites, which are not accessible in 3D space, are still ranked quite high. This is a problem that is hard to alleviate in a 2D-based method, but the error is systematic and thus easy to track.
Figure 3.

Experimental SOMs and SMARTCyp predictions for five compounds. The gray circles represent experimentally found SOMs. Arrows and numbers represent the top three predicted sites by SMARTCyp.
The predictions for valdecoxib (see Figure 3) show another issue of using a method based on fragment matching. When unusual groups are found (i.e., sulfonamide in valdecoxib), which have not been included among the fragments computed to generate the reactivity rules, the reactivity assigned to a position is assigned due to unrelated calculations (which could be right or wrong; this cannot be known until new reference calculations are performed). This can also be seen as a strength of the method. New calculations can be performed to validate or change the rules for such fragments, increasing the accuracy without the need to reparameterize the method.
The fact that SMARTCyp works quite well shows that reactivity is a main factor in CYP 3A4 metabolism and emphasizes the importance of using accurate methods to generate reactivity rules. It is encouraging to see that SMARTCyp is good at identifying compounds with a metabolic position ranked highest, in particular because it is a pure 2D method that gives an extremely fast prediction.
The two major advantages of the method are that the creation of the method gives physical meaning and the low signal-to-noise ratio in the input data. These both arise from the fact that the reactivity model is computed from high-level quantum chemical calculations of the activation energy for the oxidation reactions. Other methods often use a larger number of descriptors, which leads to significant amounts of noise in the input data, and the relative influence of the descriptors is often hard to understand.
Another advantage of the method is that it is easy to implement using any of the chemical programming libraries available, free or commercial, and can be integrated into workflows used by other software. The SMARTCyp reactivity parameter can also be complemented with additional descriptors and empirical knowledge to increase accuracy and create models for other CYP isoforms. The principle of combining a reactivity model with docking has already been shown to work well for the prediction of metabolic reactions occurring at carbon sites in the CYP1A2 isoform.7,15
Last, but not least, the method is very fast. The current implementation computes more than three compounds per second, and most of this time is spent creating the graphical output.
A limitation (which can be alleviated by additional computations) is that most reactivity rules are based on calculations where only a single substituent was allowed to modify the reactivity of a site. In a future study, a second generation of rules should be generated with multiple substituents affecting the reactivity at the same time to increase the accuracy of the method.
In summary, we have developed the SMARTCyp method for predicting the SOM for drug metabolism mediated by CYP3A4. The method uses only the 2D structure of a drug, from which the reactivity of a site is deduced by fragment matching and the accessibility is computed as the relative distance from the center of the molecule. SMARTCyp is able to rank an experimental SOM within the top two predicted positions 76% of the time. The uncomplicated implementation using SMARTS matching makes the reactivity model easy to implement in other programs and easy to combine with other methods and properties to create methods for predicting metabolism by other CYP isoforms.
Experimental Procedures
The matching of SMARTS patterns, computation of the topological bond path distances, and rendering of 2D structures in SMARTCyp are performed using the CDK and JChemPaint java libraries.16,17 For benchmarking and comparative studies, the 3A4 data set was also computed using the software StarDrop version 4.2.1.14
The atom reactivities, that is, the energies in the lookup table, are derived from activation energies of the oxidation reactions computed with density functional theory. These were calculated with the Turbomole18 software package. In the calculations, the compound I in the CYPs is modeled by a reduced heme model without side chains, iron porphine with SCH3− and O2− as axial ligands. We studied the transition states for all reactions and computed the activation energy defined as the transition state energy relative to the sum of the separate compound I and substrate energies.
For oxidations of sp2-hybridized carbon atoms and phosphorus atoms, both the doublet and the quartet spin states are computed, and the lowest energy is used; for oxidations of sp3-hybridized carbon atoms, only the quartet spin state is computed; for nitrogen and sulfur oxidations, only the doublet spin state is computed. A full frequency calculation was performed before the transition state was optimized using the default settings of the software. When a transition state could not be found, the geometry of the crossing point of scans from reactant to product and vice versa was used. The geometry optimizations and frequency calculations were performed using the B3LYP functional,19−21 together with the double-ζ basis set of Schäfer et al.,22 enhanced with a p function with the exponent 0.134915, on the iron atom, and the 6-31G(d) basis set23−25 was used for the other atoms. The final energies were determined by single-point calculations using the 6-311++G(2d,2p) basis set26,27 for all atoms, except iron for which we used the double-ζ basis set of Schäfer et al.,22 enhanced with s, p, d, and f functions (exponents of 0.01377232, 0.041843, 0.1244, 2.5, and 0.8; two f functions).28
In the quantum chemical calculations, some assumptions were made regarding reactive sites at, or next to, nitrogen atoms. We assumed that amines were not positively charged and that oxidation of the nitrogen atoms in amines always occurred by direct oxygen transfer from the heme iron atom to the nitrogen.
Supporting Information Available
Additional tables and the 3A4 data set. This material is available free of charge via the Internet at http://pubs.acs.org.
We thank the Benzon Foundation (support of P.R. and D.E.G.), the Danish medical research council (support of L.O.), NIH Grant 1P20HG003899-01 (RECCR) (support of C.B. and J.Z.), and the RPI Center for Biotechnology and Interdisciplinary Studies (support of C.B. and J.Z.).
Funding Statement
National Institutes of Health, United States
Supplementary Material
References
- Afzelius L.; Arnby C. H.; Broo A.; Carlsson L.; Isaksson C.; Jurva U.; Kjellander B.; Kolmodin K.; Nilsson K.; Raubacher F.; Weidolf L. State-of-the-art tools for computational site of metabolism predictions: Comparative analysis, mechanistical insights, and future applications. Drug Metab. Rev. 2007, 39, 61–86. [DOI] [PubMed] [Google Scholar]
- Crivori P.; Poggesi I. Computational approaches for predicting CYP-related metabolism properties in the screening of new drugs. Eur. J. Med. Chem. 2006, 41, 795–808. [DOI] [PubMed] [Google Scholar]
- Stjernschantz E.; Vermeulen N. P. E.; Oostenbrink C. Computational prediction of drug binding and rationalisation of selectivity towards cytochromes P450. Expert Opin. Drug Metab. Toxicol. 2008, 4, 513–527. [DOI] [PubMed] [Google Scholar]
- Hennemann M.; Friedl A.; Lobell M.; Keldenich J.; Hillisch A.; Clark T.; Göller A. H. CypScore: Quantitative Prediction of Reactivity toward Cytochromes P450 Based on Semiempirical Molecular Orbital Theory. ChemMedChem 2009, 4, 657–669. [DOI] [PubMed] [Google Scholar]
- Singh S. B.; Shen L. Q.; Walker M. J.; Sheridan R. P. A Model for Predicting Likely Sites of CYP3A4-Mediated Metabolism on Drug-like Molecules. J. Med. Chem. 2003, 46, 1330–1336. [DOI] [PubMed] [Google Scholar]
- Sheridan R. P.; Korzekwa K. R.; Torres R. A.; Walker M. J. Empirical Regioselectivity Models for Human Cytochromes p450 3A4, 2D6, and 2C9. J. Med. Chem. 2007, 50, 3173–3184. [DOI] [PMC free article] [PubMed] [Google Scholar]
- Rydberg P.; Vasanthanathan P.; Oostenbrink C.; Olsen L. Fast Prediction of Cytochrome P450 Mediated Drug Metabolism. ChemMedChem 2009, 4, 2070–2079. [DOI] [PubMed] [Google Scholar]
- Olsen L.; Rydberg P.; Rod T. H.; Ryde U. Prediction of Activation Energies for Hydrogen Abstraction by Cytochrome P450. J. Med. Chem. 2006, 49, 6489–6499. [DOI] [PubMed] [Google Scholar]
- Rydberg P.; Ryde U.; Olsen L. Sulfoxide, Sulfur, And Nitrogen Oxidation and Dealkylation by Cytochrome P450. J. Chem. Theory Comput. 2008, 4, 1369–1377. [DOI] [PubMed] [Google Scholar]
- Rydberg P.; Ryde U.; Olsen L. Prediction of Activation Energies for Aromatic Oxidation by Cytochrome P450. J. Phys. Chem. A 2008, 112, 13058–13065. [DOI] [PubMed] [Google Scholar]
- Ekroos M.; Sjogren T. Structural basis for ligand promiscuity in cytochrome P450 3A4. Proc. Natl. Acad. Sci. U.S.A. 2006, 103, 13682–13687. [DOI] [PMC free article] [PubMed] [Google Scholar]
- Brown C. M.; Reisfeld B.; Mayeno A. N. Cytochromes p450: A structure-based summary of biotransformations using representative substrates. Drug Metab. Rev. 2008, 40, 1–100. [DOI] [PubMed] [Google Scholar]
- Rendic S. Summary of information on human CYP enzymes: Human P450 metabolism data. Drug Metab. Rev. 2002, 34, 83–448. [DOI] [PubMed] [Google Scholar]
- StarDrop, version 4.2.1; Optibrium Ltd.: Cambridge, United Kingdom, 2009. [Google Scholar]
- Jung J.; Kim N. D.; Kim S. Y.; Choi I.; Cho K. H.; Oh W. S.; Kim D. N.; No K. T. Regioselectivity Prediction of CYP1A2-Mediated Phase I Metabolism. J. Chem. Inf. Model. 2008, 48, 1074–1080. [DOI] [PubMed] [Google Scholar]
- Steinbeck C.; Hoppe C.; Kuhn S.; Floris M.; Guha R.; Willighagen E. L. Recent developments of the Chemistry Development Kit (CDK) - An open-source Java library for chemo- and bioinformatics. Curr. Pharm. Des. 2006, 12, 2111–2120. [DOI] [PubMed] [Google Scholar]
- Steinbeck C.; Han Y. Q.; Kuhn S.; Horlacher O.; Luttmann E.; Willighagen E. The Chemistry Development Kit (CDK): An Open-Source Java Library for Chemo- and Bioinformatics. J. Chem. Inf. Comput. Sci. 2003, 43, 493–500. [DOI] [PMC free article] [PubMed] [Google Scholar]
- Ahlrichs R.; Bar M.; Haser M.; Horn H.; Kolmel C. Electronic-Structure Calculations on Workstation Computers—The Program System Turbomole. Chem. Phys. Lett. 1989, 162, 165–169. [Google Scholar]
- Becke A. D. Density-Functional Exchange-Energy Approximation with Correct Asymptotic-Behavior. Phys. Rev. A 1988, 38, 3098–3100. [DOI] [PubMed] [Google Scholar]
- Lee C. T.; Yang W. T.; Parr R. G. Development of the Colle-Salvetti Correlation-Energy Formula Into A Functional of the Electron-Density. Phys. Rev. B 1988, 37, 785–789. [DOI] [PubMed] [Google Scholar]
- Becke A. D. Density-Functional Thermochemistry. 3. The Role of Exact Exchange. J. Chem. Phys. 1993, 98, 5648–5652. [Google Scholar]
- Schafer A.; Horn H.; Ahlrichs R. Fully Optimized Contracted Gaussian-Basis Sets for Atoms Li to Kr. J. Chem. Phys. 1992, 97, 2571–2577. [Google Scholar]
- Hehre W. J.; Ditchfield R.; Pople J. A. Self-Consistent Molecular-Orbital Methods. 12. Further Extensions of Gaussian-Type Basis Sets for Use in Molecular-Orbital Studies of Organic-Molecules. J. Chem. Phys. 1972, 56, 2257–2261. [Google Scholar]
- Hariharan P. C.; Pople J. A. Influence of Polarization Functions on Molecular-Orbital Hydrogenation Energies. Theor. Chim. Acta 1973, 28, 213–222. [Google Scholar]
- Francl M. M.; Pietro W. J.; Hehre W. J.; Binkley J. S.; Gordon M. S.; Defrees D. J.; Pople J. A. Self-Consistent Molecular-Orbital Methods. 23. A Polarization-Type Basis Set for 2Nd-Row Elements. J. Chem. Phys. 1982, 77, 3654–3665. [Google Scholar]
- Mclean A. D.; Chandler G. S. Contracted Gaussian-Basis Sets for Molecular Calculations. 1. 2Nd Row Atoms, Z=11−18. J. Chem. Phys. 1980, 72, 5639–5648. [Google Scholar]
- Krishnan R.; Binkley J. S.; Seeger R.; Pople J. A. Self-Consistent Molecular-Orbital Methods. 20. Basis Set for Correlated Wave-Functions. J. Chem. Phys. 1980, 72, 650–654. [Google Scholar]
- Rulisek L.; Jensen K. P.; Lundgren K.; Ryde U. The reaction mechanism of iron and manganese superoxide dismutases studied by theoretical calculations. J. Comput. Chem. 2006, 27, 1398–1414. [DOI] [PubMed] [Google Scholar]
Associated Data
This section collects any data citations, data availability statements, or supplementary materials included in this article.