

Abstract
We use newly developed methods of measuring spatial segregation across a range of spatial scales to assess changes in racial residential segregation patterns in the 100 largest U.S. metropolitan areas from 1990 to 2000. Our results point to three notable trends in segregation from 1990 to 2000: 1) Hispanic-white and Asian-white segregation levels increased at both micro- and macro-scales; 2) black-white segregation declined at a micro-scale, but was unchanged at a macro-scale; and 3) for all three racial groups and for almost all metropolitan areas, macro-scale segregation accounted for more of the total metropolitan area segregation in 2000 than in 1990. Our examination of the variation in these trends among the metropolitan areas suggests that Hispanic-white and Asian-white segregation changes have been driven largely by increases in macro-scale segregation resulting from the rapid growth of the Hispanic and Asian populations in central cities. The changes in black-white segregation, in contrast, appear to be driven by the continuation of a 30-year trend in declining micro-segregation, coupled with persistent and largely stable patterns of macro-segregation.
Residential segregation between white and black individuals has been declining for decades, while white-Hispanic and white-Asian segregation have slowly increased, particularly in metropolitan areas with growing Hispanic and Asian populations, respectively. On this, evidence is generally clear. Less clear, however, is the extent to which the trends are due to changes in macro- and/or micro-scale residential patterns within metropolitan areas. It is not obvious, for example, whether the changes in segregation levels are due to changes in the extent of block-to-block variation in racial/ethnic composition or to changes in the size and homogeneity of relatively large ethnic enclaves and racially-identifiable regions of metropolitan areas.
In this paper, we use newly developed methods of measuring spatial segregation (Reardon et al., 2008; Reardon & O'Sullivan, 2004) to investigate how the geographic scale of racial residential segregation patterns in U.S. metropolitan areas has changed from 1990 to 2000. By geographic scale (or simply scale, for shorthand throughout the paper), we mean to refer to the dimensions of identifiable social or physical features of a landscape (Smith, 2000). With respect to residential segregation, racial patterning may be evident at geographic scales ranging from thousands of kilometers (think of the concentration of the U.S. black population in the Southeast) to less than a kilometer (block-to-block variation in racial composition). Because of this “inherently scalar nature” of segregation (Kaplan & Holoway, 2001, p. 61), there is no single geographical scale of segregation—no one ‘right’ scale at which to measure it (Reardon et al., 2008).
Moreover, the scale at which segregation is measured will determine the extent of segregation observed—a measure of the variation in racial composition among street blocks will not reveal the extent to which racial composition varies among regions of the country; likewise, a measure of the variation in racial composition among regions will not reveal the extent to which the average bock differs from the next. Because most (though not all) prior studies of patterns and trends in racial segregation have analyzed segregation measured at the scale of the census tract (or block group, in some cases), we have relatively little information regarding the extent of segregation at different geographic scales.
This paper proceeds as follows. In the first section, we briefly review existing research on the trends in racial segregation in U.S. metropolitan areas in recent decades. In the second section, we describe the methods and data we use to investigate trends in racial segregation at multiple scales. In the third section we report the average 1990 and 2000 segregation levels over a range of scales for the 100 largest metropolitan areas in the U.S. Given the trends evident from this analysis, we then investigate the extent to which these patterns can explained by changes in a set of demographic and structural characteristics. In the final section, we conclude with a discussion of our findings and their implications for future research.
1. Prior research on trends in racial residential segregation
A relatively large body of research has examined trends in residential racial/ethnic segregation patterns over the last few decades. This research varies in the units of analysis (metropolitan areas, cities, counties), the group comparisons of interest (e.g., black-white segregation vs. black-non-black segregation), and the dimensions of segregation (e.g., evenness or exposure) examined. We focus here on research that examines metropolitan area black-, Hispanic-, and Asian-white segregation, using measures of evenness.
A set of studies examining trends in black-white residential segregation from 1980 to 2000 has consistently found evidence of a two-decade (or longer) decline in segregation among census tracts, despite the fact that the studies rely on different samples of metropolitan areas and different measures of segregation (see, for example, Charles, 2003; Farley & Frey, 1994; Frey & Farley, 1996; Frey & Myers, 2005; Glaeser & Vigdor, 2001; Iceland, Weinberg, & Steinmetz, 2002; Logan, 2001; Logan, Stults, & Farley, 2004). Generally, these studies find black-white segregation declined at a moderate rate through the 1980s and 1990s, yet remains very high in many metropolitan areas. It is important to note, however, that although segregation declined, on average, in metropolitan areas during the 1980s and 1990s, changes were not uniform among metropolitan areas, many of which experienced only slight changes in segregation. Large metropolitan areas with substantial black populations remain highly segregated while metropolitan areas with smaller black populations have experienced increased integration.
With regard to Hispanic-white residential segregation, most studies report either no change or a small increase, on average, in segregation between 1980 and 2000 (Charles, 2003; Frey & Myers, 2005; Iceland, 2004; Iceland et al, 2002; Logan, 200l), though Hispanic-white segregation levels remain well below black-white segregation, on average. Nonetheless, there is considerable variation among metropolitan areas in trends in racial segregation. Several studies note that Hispanic-white segregation grew most rapidly from 1980 to 2000 in metropolitan areas with initially small, but rapidly growing, proportions of Hispanics, a pattern that presumably results from the formation and expansion of enclave communities (Frey & Myers, 2005; Iceland, 2004; Logan, 2001).
Most studies of Asian-white residential patterns find trends similar to those of Hispanic-white segregation: small or insignificant average changes in segregation from 1980 to 2000 (Iceland et al., 2002; Logan, 2001), though there are some differences among studies. Charles (2003) reports a modest average increase in Asian-white segregation from 1980-2000 in the 50 largest metropolitan areas. Likewise, Iceland (2004) finds that Asian segregation increased slowly from 1980 through 2000, but he measures Asian segregation from non-Asians, and so confounds Asian-white segregation with Asian-black and Asian-Hispanic segregation. In contrast, Frey and Myers (2005) find that Asian-white segregation at the bock-group level declined during the 1990s, on average, though these declines were less evident in large metropolitan areas and metros with the largest Asian populations, a finding that is relatively consistent with other work.
The slight discrepancies among studies regarding the direction and magnitude of trends in segregation, especially with regard to Hispanic-white and Asian-white segregation, are generally attributable to minor methodological differences among the studies. For example, studies examine different samples of metropolitan areas or use metropolitan area definitions from different census years. The samples used generally include either all metropolitan areas defined in a given year, only a group of the largest metropolitan areas, or a selection of metropolitan areas that meet some racial ethnic composition criteria. In addition, while most studies rely on census tract data, some rely on block group data (for example, Frey & Myers, 2005). Since segregation trends may differ by spatial scale, disagreements about trends in segregation may be partly due to the use of different levels of data aggregation. Finally, studies use different measures of segregation, such as the dissimilarity index or the information theory index.1 Nonetheless, there is a clear consensus in the literature that metropolitan area black-white segregation among census tracts declined from 1980 to 2000, while Hispanic-white and Asian-white segregation increased slightly, particularly in smaller metropolitan areas with rapidly growing proportions of Hispanics and Asians, respectively.
While national-level and large-sample averages provide broad generalizations about the direction of segregation trends, they tell us little about how these trends vary among metropolitan areas of different types. In the case of black-white segregation, levels tend to be highest in metropolitan areas with large populations and a high proportion of black residents (Farley & Frey, 1994). In addition, segregation is lower, on average, in areas where black income levels are closest to whites (Logan et al., 2004). The sharpest declines in segregation in the 1990s occurred in areas with significant overall population growth and also in places where the black population was either increasing or decreasing (Glaeser & Vigdor, 2001). In addition, multiethnic areas have lower average levels of black-white segregation (Farley & Frey, 1994) and experienced large declines in segregation over the 1990s, possibly because Asian and Hispanic populations provide “buffers” to historical patterns of black-white segregation (Iceland, 2004).
Some of the same metropolitan characteristics are associated with levels of Hispanic-white segregation, although there is far less research here. Segregation levels are higher in large metropolitan areas with a high proportion of Hispanic residents (Iceland et al., 2002). In the 1990s, increases in segregation were greatest in large urban areas experiencing rapid Hispanic population growth (Logan, 2001; Massey, 2001) and decreases were evident in cities where Hispanics had a higher relative income as compared to whites (Frey & Myers, 2005). The same studies observe nearly identical relationships for Asian-white segregation—areas experiencing rapid immigration and consequent growth in the Asian population exhibit increasing levels of Asian-white segregation. Paralleling black-white segregation, these factors might indicate either self-segregation of whites from a growing minority presence or, conversely, a heightened tendency for minority groups to settle in established racial/ethnic enclaves.
The Geographic Scale of Racial Segregation
Residential segregation is an inherently spatial phenomenon. While the extent of spatial proximity of members of different population groups does not alone determine patterns of social interaction and access to spatially-located social resources, it certainly serves as an important facilitator or constraint. Individuals who live far from one another are much less likely to have face-to-face interactions, utilize the same social institutions (schools, child care centers, parks, medical facilities, etc.), and encounter the same social and environmental conditions in their neighborhoods than are individuals who live near one another. Moreover, the likelihood and extent of social interaction and exposure to shared institutional and social conditions certainly increases with increasing spatial proximity. Thus, any understanding of the causes, patterns, and consequences of residential segregation must account for the extent of spatial proximity among members of different groups.
Proximity is, of course, a matter of degree, not a binary condition. Any description of one's local environment—and the opportunities and constraints it creates—depends on the choice of a relevant geographic scale. The racial or socioeconomic composition of the population within one's immediate neighborhood may be quite different than the composition of the population within a larger region around one's home. As a result, the segregation among micro-neighborhoods is typically much higher than the segregation among larger macro-neighborhoods (Cowgill & Cowgill, 1951; Duncan & Duncan, 1955; Iceland & Steinmetz, 2003; Taeuber & Taeuber, 1969; Van Valey & Roof, 1976; Wong, 2004). Implicitly, then, any effort to measure and describe patterns of segregation depends on the choice of a geographical scale. Likewise, attention to the geographic scale of segregation patterns is necessary to understand both the causes and consequences of residential segregation.2
Most prior studies investigate segregation among census tracts, block groups, or blocks, implicitly limiting their investigation of segregation to the (somewhat arbitrary) scale of census geography. Several recent studies, however, offer suggestive evidence that points to variation in the magnitude and direction of changes in segregation at different scales. Massey and Hajnal (1995) examine trends from 1900-1990 in black-white segregation at several geographic ‘scales’: between-tracts/wards, between-cities, and between-counties. They find that segregation between tracts/wards increased from 1900 to 1970, and then began declining after 1970; segregation between cities, in contrast, increased from 1950-1980 and then remained stable between 1980 and 1990. These long-term trends indicate that, since 1970, perhaps, segregation at the scale of the city has been an increasingly dominant component of black-white segregation. Likewise, Fischer and colleagues decompose segregation levels into components corresponding to different geographic scales, and find that the contribution of between-tract segregation to total segregation has declined over recent decades, while the contribution of between-place (cities and towns) segregation has remained relatively stable (for black-other segregation) or increased slightly (for Hispanic-other segregation) (Fischer et al., 2004). More recently, Farrell decomposes changes during the 1990s in metropolitan area multiracial segregation into components between and within cities and suburban municipalities. He finds that segregation within cities declined sharply, segregation within suburban municipalities declined slightly, segregation between cities and suburbs was unchanged, and segregation among suburban municipalities increased (Farrell, 2008). Finally, Reardon, Yun, and Eitle (2000) find that racial school segregation between school districts grew in the 1990s while segregation within districts declined. Each of these studies indicates the trend toward increasing dominance of macro-scale over micro-scale residential patterns in shaping segregation levels, though none uses explicitly spatial measures of segregation or uses consistent definitions of geographic scale (tracts, school districts, and cities vary widely in spatial size).3
The lack of detailed information on the patterns and trends in segregation at a range of geographic scales is due to the fact that most existing studies rely primarily on aspatial measures of segregation—measures that were developed prior to the availability of geographical information system (GIS) software and that consequently do not fully account for spatial distributions of race and poverty (for discussion and exceptions, see Dawkins, 2006; Grannis, 2002; Reardon & O'Sullivan, 2004; White, 1983; Wong, 1997, 1999, 2004). Reliance on aspatial measures has two principal drawbacks: first, it ignores the proximity of census tracts to one another; and second, it results in segregation measures that are sensitive only to segregation at the (arbitrary) geographic scale of census tracts (or blocks, etc).
The first limitation has been much remarked on, and a number of measures have teen proposed to address this problem (Jakubs, 1981; Massey & Denton, 1988; Morgan, 1983a, 1983b; Morrill, 1991; White, 1983; Wong, 1993, 2004). The second drawback—the fact that most methods of measuring segregation (and hence, of assessing its causes and effects) are insensitive to scale—means that they cannot detect patterns of segregation that occur at scales larger and/or smaller than census tracts or blocks. However, with the advent of better tools for spatial analysis, including GIS software, White (1983) and, more recently, Wu and Sui (2001), Jargowsky and Kim (2004), and Reardon and colleagues (Lee et al., 2008; Reardon et al., 2008; Reardon & O'Sullivan, 2004) have developed methodological approaches that yield scalable measures of residential segregation, although these measures have not yet been widely used. In particular, spatial segregation measures have not been used to investigate issues of geographic scale in segregation, despite the fact that some are tailor-made for such analyses.
2. Data and Methods
Several stylized examples illustrate our approach to investigating the geographic scale of segregation. Figure 1 provides stylized examples of spatial variation in racial composition in two hypothetical regions (space is compressed here to a single dimension on the x-axis for simplicity). In Region A, racial composition varies considerably over both large and small distances. This is described in the graph by large vertical changes over both small (for example, 2km) and large (for example, 32km) increments on the x-axis. Examples of metropolitan areas with patterns similar to this are New York, Baltimore, and Philadelphia, each of which is characterized by a concentration of the black population in large regions (for example, Queens, the Bronx, and much of Brooklyn in New York) and also by considerable bock-to-bock variation in racial composition within the region (think of the variation in racial composition among adjacent neighborhoods in Brooklyn, for example). In such metropolitan areas, variation among bocks in racial composition is the result of both large- and small-scale racial patterning.
Figure 1. Stylized Racial Distribution in Two Hypothetical Regions.
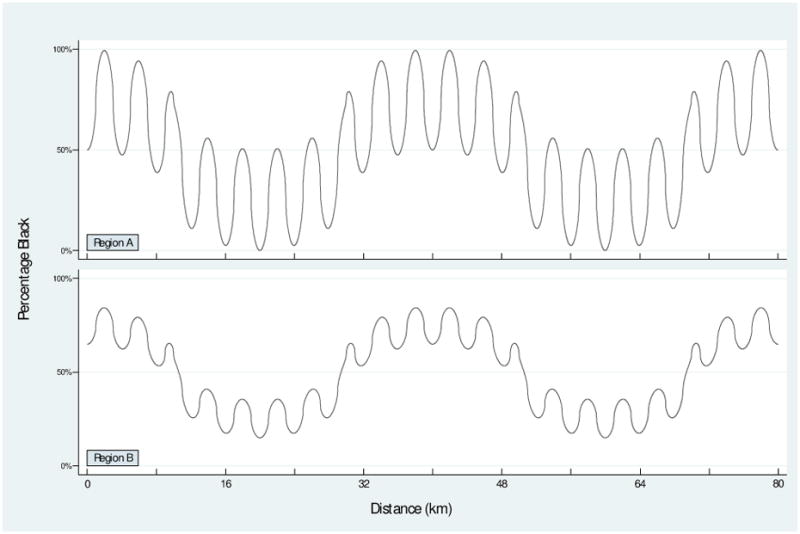
In Region B, racial composition varies over large distances to the same extent that it does in Region A, but varies much less over short distances, which is evidenced by smaller changes in percentage black over short increments on the x-axis. Los Angels, St. Louis, Chicago, and Atlanta are examples of this type of pattern. Just as in New York, each of these is characterized by the concentration of the black population within large regions. In contrast, however, these metropolitan areas have little variation in the racial composition of blocks over short distances (the black proportion of residents is generally uniformly high in the South and West sides of Chicago or in South Los Angeles, and is uniformly low elsewhere in each metropolitan area).
If we measured segregation among very small neighborhoods—say neighborhoods defined as 500m in radius—in both A and B, we would find that B is less segregated than A. If, however, we measured segregation among larger neighborhoods—say, neighborhoods of 4km radius or larger—we would find that segregation levels in A and B were similar. This is because defining neighborhoods as 4km in radius effectively smoothes out all variation in neighborhood racial composition at smaller geographic scales. Thus, segregation measured among 4km radius neighborhoods would only capture variation at that scale or larger, and A and B are similar in their patterns of large-scale variation in racial composition. These results are illustrated in Figure 2, which shows stylized “segregation profiles” (see Jargowsky & Kim, 2005; Reardon et al., 2008) for regions A and B. In these figures, segregation is plotted for a range of radii of neighborhoods. Segregation in B is lower than in A at radii less than in 4km, which reflects the fact that the difference between A and B is entirely due to segregation patterns at geographic scales smaller than 4km.
Figure 2. Stylized Segregation Profiles of Two Hypothetical Regions.
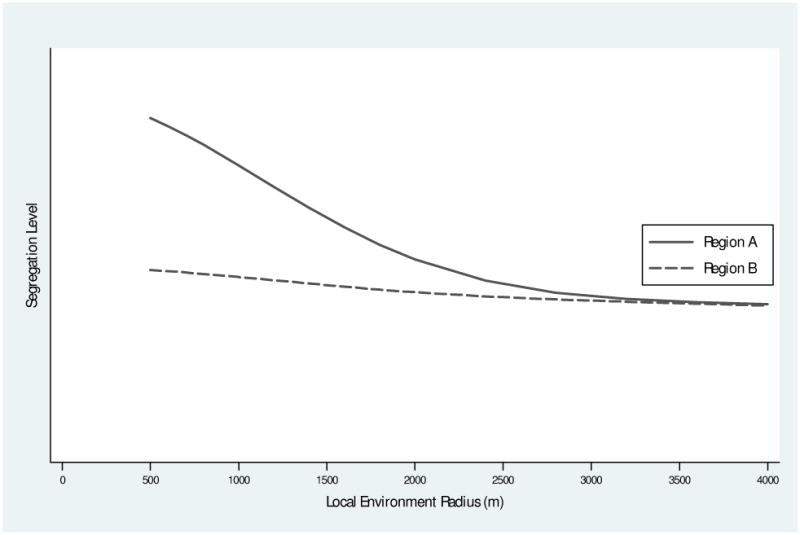
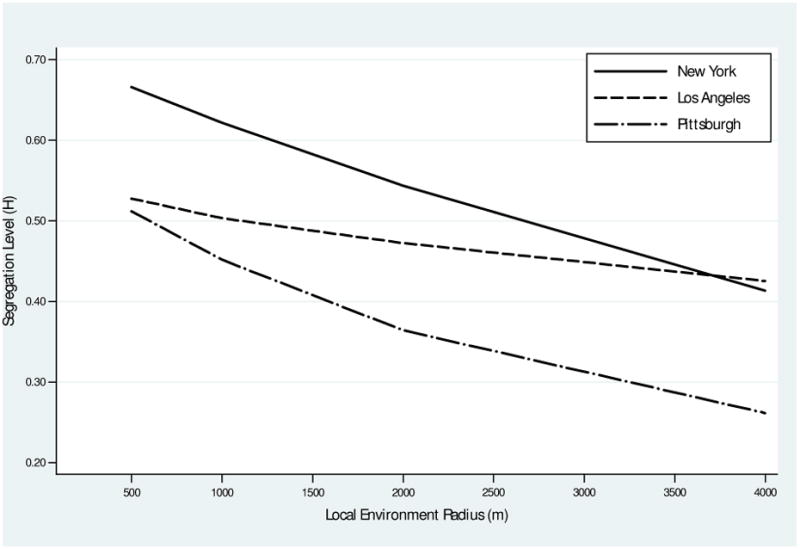
Figure 3 illustrates segregation profiles for three metropolitan areas—New York Los Angeles, and Pittsburgh—in order to make these stylized patterns described above more concrete. A comparison of the segregation profiles for New York and Los Angeles, for example, indicates a pattern similar to the comparison of regions A and B above. In New York, for example, segregation measured using a 500m radius definition of neighborhood yields a white-black segregation level of 0.67, while in Los Angeles the corresponding level is 0.53.4 Segregation measured using a 4km radius, however, yields similar levels in New York (0.41) and Los Angeles (0.43). In other words, both New York and Los Angeles are characterized by similarly high levels of macro-scale black-white spatial patterns, but New York has much more variation in racial composition over short distances than does Los Angeles.
Figure 3. Segregation Profiles, Selected Metropolitan Areas, 2000.
A second set of stylized examples, shown in Figure 4, illustrates a different set of patterns. Region A is the same as in Figure 1, but Region C represents a new pattern where racial composition varies less over long distances. Region C differs from Region A primarily in the extent of large-scale segregation patterns—racial composition in C varies less over long distances than in A, but the small-scale variation in C is similar to that in A. A good example of such a pattern is found in Pittsburgh, where there is considerable variation over short distances in the racial composition of neighborhoods, but little overall pattern of concentration of the black population in one area of the region. Because of these differences, if we measure segregation among very small neighborhoods (500m radius, for example), we would find that C is less segregated than A. We would find the same if we measure segregation using larger neighborhoods (4km radius, for example). Indeed, continuing with our example, Pittsburgh has a 500m white-black segregation level of 0.51, and a 4km level of 0.26, both much lower than the corresponding figures for New York (see Figure 3 above). In both New York and Pittsburgh, however, the contribution to segregation due to small scale variation in racial composition (i.e., the difference between segregation measured using 4000m vs. 500m radii neighborhoods) is the same (0.25); they differ only because New York has substantially more large-scale racial patterning than Pittsburgh. Figure 5 illustrates this, showing stylized segregation profiles for regions A and C. At any radius up to 4km, segregation in C is lower than in A, which reflects the fact that the difference between regions A and C is in the extent of macro-scale variation in racial composition. Put differently, all of the difference in micro-environment (500m radius) segregation between A and C (or between New York and Pittsburgh) is due to differences in macro-environment (4km radius) segregation.
Figure 4. Stylized Racial Distribution in Two Hypothetical Regions.
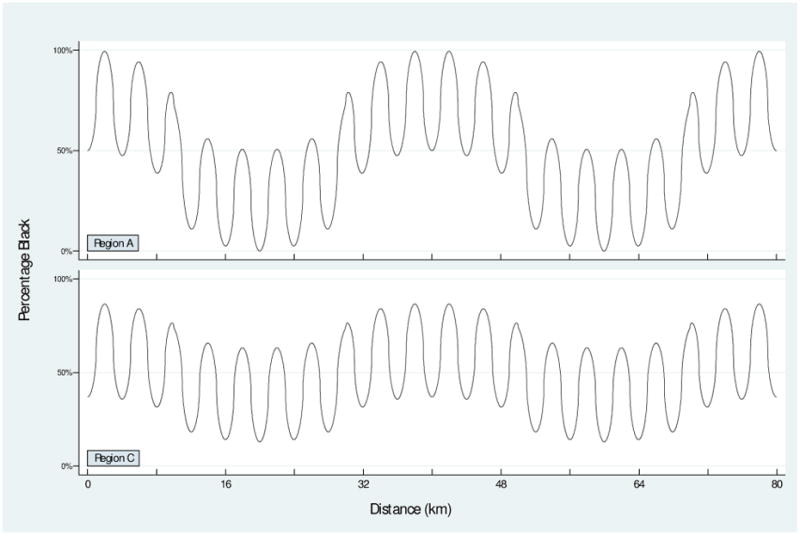
Figure 5. Stylized Segregation Profiles of Two Hypothetical Pegions.
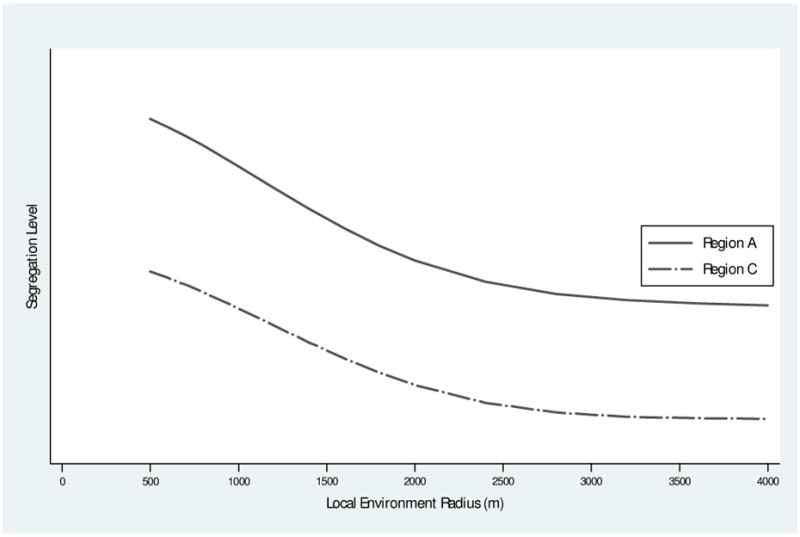
Figures 1-5 together illustrate that a difference between regions in segregation among small local environments may be due to micro- and/or macro-scale segregation differences. The recent declines in tract-level white-black segregation reported in prior research, for instance, may be due to declines in macro-scale black-white segregation (i.e., segregation patterns may have changed from resembling those in Region A to those in Region C in Figure 4) and/or to declines in micro-scale segregation (i.e., as in the difference from Region A to B in Figure 1). Likewise, increases in tract-level white-Hispanic segregation may result from a change like that from B to A (Figure 1) or from C to A (Figure 4).
Data
In this paper, we describe patterns of change in segregation for the 100 most populous metropolitan areas (as of the 2000 census) in the U.S.5 Data are derived from block-level race counts6 from Summary Tape File 1 and Summary File 1 of the 1990 and 2000 censuses, respectively. Metropolitan area definitions change with each Census, so to ensure that we are comparing segregation across constant regions from 1990 to 2000, we use the same metropolitan area boundaries for both years. Specifically, we use OMB 2003 metropolitan area definitions (which are the first set of metropolitan area definitions based on the 2000 census).7 In the 2003 metropolitan area definitions, 11 very large metropolitan areas are subdivided into multiple metropolitan area divisions; in these cases, we consider each metropolitan area division as a distinct metropolitan area.
We measure segregation using the spatial information theory index (Reardon et al., 2008; Reardon & O'Sullivan, 2004), a spatial analog of the Theil information theory index (Theil, 1972; Theil & Finezza, 1971). This index enables us to measure segregation at a range of spatial scales, and from this to construct a ‘segregation profile’ (like those shown in Figures 2, 3, & 5) that describes the relationship between spatial scale and segregation levels (Reardon et al., 2008).8 This approach enables us to distinguish residential segregation patterns that differ in scale as well as in level, as described above. More specifically, they enable us to determine how segregation patterns change over time at different spatial scales. Below we briefly describe the computation and interpretation of the spatial information theory index and the segregation profile; more detail is available in the Appendix and elsewhere (Reardon et al., 2008; Reardon & O'Sullivan, 2004).
The spatial information theory index
The spatial information theory index and related spatial segregation measures are based on the understanding that a racial segregation index is a measure of the extent to which the local environments of individuals differ in their racial composition (Reardon & O'Sullivan, 2004). We operationalize this approach by treating each individual as inhabiting a ‘local environment’ whose population is made up of the spatially-weighted average of the population at each location in the region of interest. Note that these ‘local environments’ are conceived as overlapping egocentric environments, rather than discrete spatially bounded neighborhoods (as defined by census tracts, for example). Typically, the population at nearby locations will contribute more to the local environment of an individual than will more distant locations (sometimes termed a ‘distance-decay’ effect). Given a particular spatial weighting function, we measure segregation by computing the spatially-weighted racial composition of the local environment of each person in the study region and then examining how similar, on average, are the racial compositions of all individuals' local environments to the overall composition of the study region.9 If each person's local environment is relatively similar in composition to the overall population, there is little spatial segregation; conversely, if there is considerable deviation from the overall composition, there is high spatial segregation. One key feature of this approach that makes it useful for investigating issues of scale is that the spatial weighting can accommodate any desired size of local environment, simply by altering the proximity metric used in the spatial weighting.10 A brief description of the computational algorithms we use is in the Appendix; more detail is available elsewhere (Reardon et al., 2008; Reardon & O'Sullivan, 2004).
Interpreting the spatial information theory index and the segregation profile
The spatial information theory index can be interpreted as a measure of the extent to which the racial diversity of individuals' local environments differs, on average, from the diversity of the region as a whole (for discussion of the interpretation of the information theory index, see James & Taeuber, 1985; Reardon & Fireaugh, 2002; Reardon & O'Sullivan, 2004; Theil, 1972; Theil & Finezza, 1971; Zoloth, 1976). The value of the index ranges between zero—indicating no segregation (each person's local environment has a racial composition identical to that of the region as a whole)—and one—indicating complete segregation (each person's local environment is monoracial). In the limiting case, as the size of the local environments among which segregation is measured is made arbitrarily small, the index will approach 1, the maximum possible segregation. To see this, consider that at an arbitrarily small size, the local environment of each location consists only of that location. If each location were a household, for example, then segregation at this minimal scale would be equal to the segregation among households, which would be very close to 1 in most regions of the U.S. (since most households are monoracial). At the other extreme, as the size of local environments among which segregation is measured becomes arbitrarily large, the index will approach zero. At an arbitrarily large size, the local environment of any location will include all other locations, and all points will be equally proximal to one another. In this case, the racial composition of all local environments will be the same, so segregation will be zero.
In between these two extremes, of course, segregation may take on any value, though it will, in general, be a non-increasing function of local environment size.11 The ‘segregation profile’ constructed by plotting segregation level against size describes both the absolute level of segregation at any scale and the rate of change of segregation level with scale. For each metropolitan area, we compute the level of segregation at each of four scales (using local environments with radii of 500m, 1000m, 2000m, and 4000m) and a measure of the slope of the profile—the ratio of segregation measured using a 4000m radius definition of the local environment to segregation measured at a 500m radius (H4000m/H500m). This ratio—which we term the macro-micro segregation ratio—describes the extent to which micro-environment segregation (segregation when we use a small radius to define local environments) is due to patterns of macro-environment segregation (Reardon et al., 2008). Macro-micro segregation ratios will range between zero and one, with ratios close to one indicating that most of the observed segregation among individuals' local micro-environments is due to large-scale patterns of segregation, and ratios close to zero indicating that little of the micro-segregation is due to macro-segregation.
Because the spatial information theory index uses a well-defined and consistent definition of the ‘local environment,’ measured segregation levels using it do not correspond exactly to levels obtained from an aspatial measure relying on census tracts, which are arbitrary in shape and vary widely in size. That said, previous work shows that segregation measured among census tracts corresponds roughly to spatial segregation measured using a biweight proximity function with radius of l000m (Lee et al, 2008). Thus, the range of scales we examine (500m-4000m) encompasses scales both smaller and larger than the typical census tract.
Our aims in this paper are primarily descriptive. Our first aim is to describe the overall trends from 1990-2000 in racial segregation at multiple geographic scales. Our focus is on the segregation of black, Hispanic, and Asian residents from non-Hispanic whites, as these are the dominant patterns of segregation in the U.S. Second, we examine trends in the macro-micro segregation ratio. Together, these two sets of results address the question of to what extent the trends in racial segregation described in much of the literature are due to changes in macro-segregation. Finally, we present a set of descriptive regression analyses designed to investigate the relationship between changes in the geographic scale of segregation and changes in a small set of metropolitan area structural characteristics that have been shown to be associated with residential segregation in past research.
3. Results
Changes in segregation levels. 1990-2000
Table 1 reports average levels of segregation in 1990 and 2000, measured at geographic scales ranging from 500m-4000m radii, for each of the three racial/ethnic groups (see also Figure 6). As expected, the downward slopes of the segregation profiles reveal that segregation is more acute among micro-scale environments than among macro-scale environments. Likewise, consistent with prior research, we observe that average segregation levels are highest between blacks and whites, and lowest between Asians and whites, regardless of geographic scale.
Table 1. Mean Segregation Levels, by Racial Group Combination and Geographic Scale, 1990-2000.
| 1990a | 2000a | Changeb | % Change | |
|---|---|---|---|---|
| Black-White Segregation | ||||
|
|
||||
| H500m | 0.483 | 0.447 | -0.036 ** | -7.5% |
| (0.151) | (0.141) | (0.004) | ||
| H1000m | 0.433 | 0.403 | -0.030 ** | -6.9% |
| (0.148) | (0.140) | (0.004) | ||
| H2000m | 0.367 | 0.349 | -0.017 ** | -4.6% |
| (0.138) | (0.132) | (0.004) | ||
| H4000m | 0.281 | 0.280 | -0.001 | -0.4% |
| (0.121) | (0.117) | (0.004) | ||
| H 4000m/H 500m | 0.567 | 0.611 | 0.043 ** | 7.6% |
| (0.118) | (0.100) | (0.005) | ||
| Hispanic-White Segregation | ||||
|
|
||||
| H500m | 0.248 | 0.282 | 0.034 ** | 13.7% |
| (0.094) | (0.086) | (0.005) | ||
| H1000m | 0.208 | 0.242 | 0.034 ** | 16.3% |
| (0.093) | (0.086) | (0.004) | ||
| H2000m | 0.167 | 0.200 | 0.033 ** | 19.8% |
| (0.086) | (0.082) | (0.004) | ||
| H4000m | 0.123 | 0.154 | 0.030 ** | 24.4% |
| (0.074) | (0.072) | (0.003) | ||
| H 4000m/H500m | 0.469 | 0.526 | 0.057 ** | 12.2% |
| (0.161) | (0.148) | (0.006) | ||
| Asian-White Segregation | ||||
|
|
||||
| H500m | 0.195 | 0.212 | 0.017 ** | 8.7% |
| (0.052) | (0.049) | (0.002) | ||
| H1000m | 0.149 | 0.168 | 0.019 ** | 12.8% |
| (0.048) | (0.047) | (0.002) | ||
| H2000m | 0.112 | 0.133 | 0.021 ** | 18.8% |
| (0.043) | (0.045) | (0.002) | ||
| H4000m | 0.081 | 0.103 | 0.022 ** | 27.2% |
| (0.038) | (0.041) | (0.002) | ||
| H4000m/H500m | 0.405 | 0.476 | 0.071 ** | 17.5% |
| (0.123) | (0.112) | (0.007) |
N=100 metropolitan areas. Standard deviations in parentheses.
p<.01; standard errors in parentheses.
Figure 6. Average Segregation Profiles, by Pace, Scale, and Year 100 Largest Metropolitan Areas, 1990-2000.
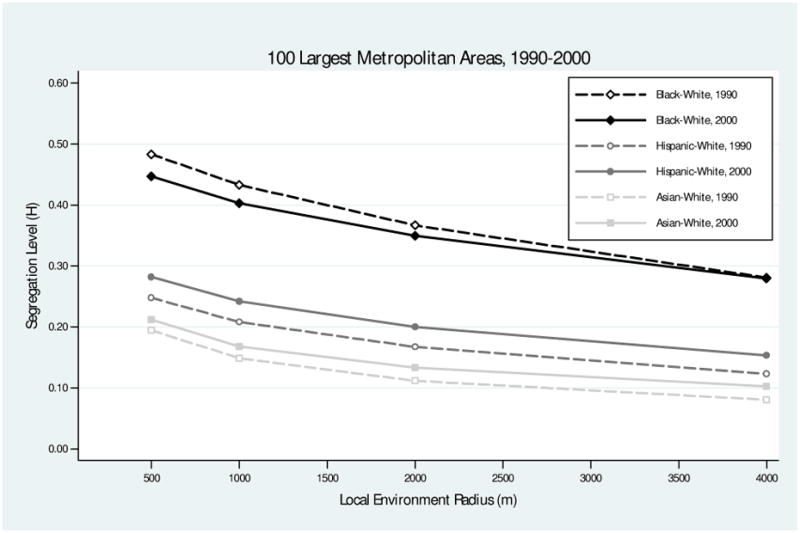
The trends in segregation from 1990 to 2000, however, differ substantially among the three race groups. Average black-white segregation, for example, declined at small geographic scales, but remained stable at the 4000m-radius scale. This implies a change in residential patterns similar to the stylized change from Region A to B above (see Figure 1). Hispanic-white and Asian-white segregation, in contrast, increased at both micro- and macro-environment scales, implying a change similar to that from Region C to A above (see Figure 4). The average changes in segregation were modest in size in absolute terms,12 but sizeable in comparison to the standard deviation of segregation levels in 1990. For example, the average decline in black-white segregation at the 500m scale (-.036) is equal to about one-quarter of the standard deviation of segregation levels in 1990 (s.d.=.15); the increases in Hispanic-white segregation at 500m and 4000m are each equal to roughly three-eighths of a standard deviation; and the increases in Asian-white segregation at 500m and 4000m are equal to roughly one-third and three-fifths of a standard deviation, respectively.
For all three groups, the average macro/micro segregation ratio increased substantially from 1990 to 2000. In the case of black-white segregation, the macro/micro ratio increased by an average of .043 (s.e.=.005, p<.001) points, from .567 to .611. Thus, by 2000, macro-level patterns accounted for over 60 percent of the black-white segregation observed at the micro-level. The average increases in Hispanic-white and Asian-white segregation were roughly constant in size across the range of scales, which means that the increase in segregation of these groups was driven largely or entirely by increases in macro-segregation. This pattern is evident in the increase in the macro/micro segregation ratio for Hispanic-white segregation—which increased by .057 (s.e.=.006, p<.001), from .469 to .526—and for Asian-white segregation—which increased by 0.071 (s.e.=.007, p<.001), from .405 to .476. For all three groups, a larger proportion of micro-scale segregation was due to macro-scale patterns of segregation in 2000 than in 1990.
Summary of Trends in the Scale of Segregation
As we noted above, prior research has generally found that Hispanic-white and Asian-white segregation were stable or slowly increasing during the 1990s. We find that both Hispanic-white and Asian-white segregation have increased modestly, on average, over the range of scales we examine. The increases in segregation that we observe are slightly larger, on average, than those reported by other studies. These disparities are likely due to differences between our sample and definitions of metropolitan areas and those used in prior research.13 Several prior studies find that the largest metropolitan areas with significant populations of Hispanics or Asians tended to experience small increases in segregation during the 1990s, or smaller declines than other metropolitan areas. This pattern is consistent with our finding of average increases in segregation among our sample of 100 large metropolitan areas.
We find that black-white segregation declined from 1990 to 2000 at small scales. Lee et al (2008) show that segregation at the census tract level corresponds roughly to segregation at a 1000m radius, so our results correspond to prior research showing a decline in tract-level black-white segregation. We also find, however, that black-white segregation at the 4000m macro-scale did not decline, on average, from 1990-2000. This indicates that the declines in black-white segregation observed in tract-level analyses are the result of local processes of residential integration (nearby neighborhoods became more racially similar to one another during the 1990s) rather than any large scale redistribution of black and white populations. This has potentially important implications for conclusions regarding the effects of reduced residential segregation, since the well-documented decline in black-white segregation is likely only to affect social processes and outcomes that depend on highly localized residential contexts.
The one pattern that is most consistent across black-, Hispanic-, and Asian-white segregation is the trend toward the increasing importance of macro-scale segregation. For all three groups, macro/micro segregation ratios increased substantially during the 1990s. Segregation patterns in these 100 largest metropolitan areas are becoming characterized more by large-scale racially-identified areas and less by patterns of variation in the racial composition over short distances. Moreover, this trend is almost universal in our sample of metropolitan areas: the black-, Hispanic-and Asian-white segregation ratios increased in 88, 88, and 87 of the 100 metropolitan areas in our sample, respectively.
The consistency of this trend raises an obvious question: why might we observe a trend toward the increasing importance of macro-scale segregation patterns in shaping local environments? While our primary goal in this paper is descriptive, we offer several suggestions for this trend.
Perhaps the most obvious possible explanation is that patterns of macro-scale racial segregation are harder to change than micro-segregation patterns, particularly in the absence of large-scale population changes. Given a stable population, segregation can only be changed by the movement of individuals within a metropolitan region. Because short-distance moves are both more common, particularly for low-income families, and are likely to affect micro- more than macro-segregation, we might expect more rapid changes in micro-segregation when population demographics are relatively stable. Likewise, processes such as neighborhood gentrification may create more integrated neighborhoods in transitional areas between regions with very different racial compositions, but may have little or no effect on more macro-scale residential patterns. When a population changes rapidly (e.g., because of extensive immigration of Hispanics into a metropolitan area), however, segregation patterns may change not only because of internal residential moves, but also because of where new residents settle. Thus, we might expect that macro-scale segregation patterns will change more when population demographics (population size, proportion of the minority group, and proportion of immigrants) change rapidly. In particular, we might expect that macro-scale segregation and the segregation ratio will increase as a result of increases in these factors.
Segregation patterns may also be affected by aggregate changes in the relative income of two groups. If large racially-identifiable “ghettos” are due to income differences between white and non-white households, then the growth of minority households' income relative to white household incomes may lead to a decline in macro-scale segregation levels as upwardly mobile minority households expand their housing options. In addition, the geographic scale of segregation may be affected by changes in suburbanization patterns. By definition, the more concentrated minorities are in central cities, the greater the extent of macro-scale segregation. As minority/white suburbanization ratios increase (i.e., as minorities become less disproportionately concentrated in central cities), we expect that macro-segregation will decline. Such a decline would typically be manifest in less sharp racial disparities among central cities, their inner-ring suburbs and their outlying suburban and exurban communities.
Together, these hypotheses suggest that we ought to observe the largest increases in macro-scale segregation in metropolitan areas with rapidly growing populations, increasing shares of the relevant minority group, declining relative incomes for minorities, and increasing concentrations of minority groups in central cities. Moreover, since each of these factors is likely to affect macro-scale segregation patterns rather than more localized patterns of variation in racial composition, we expect to observe the largest average increases in the macro/micro segregation ratio in such metropolitan areas as well.
Explaining Changes in Segregation, 1990-2000
In order to test the above hypotheses, and as a preliminary investigation of the extent to which changes in the geographic scale of residential segregation are associated with structural and demographic trends in metropolitan areas, we fit a set of simple descriptive regression models. Specifically, we regress 1990-2000 changes in segregation on corresponding changes in a set of demographic and structural covariates.14 These covariates include percentage changes in a metropolitan area's population size, group-specific population share (i.e., in models predicting changes in black-white segregation we include the percentage change in proportion black in the model), and in its foreign-born population share.15 Because suburbanization is likely to affect the geographic scale of segregation, we include the percentage change in suburbanization rate (the proportion of the population living outside each metropolitan area's principal cities), and the group-specific suburbanization ratio (the ratio of each group's suburban proportion to that of non-Hispanic whites). Finally, we include the percentage change in the group-specific per capita income ratio (the ratio of each group's per capita income to that of non-Hispanic whites).
Table 2 provides descriptive statistics for the metropolitan area covariates we use in the analysis. The 100 metropolitan areas, on average, experienced rapid growth of their Hispanic, Asian, and foreign-born population shares, compared to much more modest growth rates of their Black population shares. On average, there was a slight increase in the black-white income ratio during the 1990s in these 100 metropolitan areas, but a substantial decrease (-14 percentage points) in the Hispanic-white income ratio over the same period. Finally, black suburbanization increased faster than white suburbanization, on average, during the 1990s, while Hispanic suburbanization rates lagged those of whites.
Table 2. Mean Metropolitan Area Sample Characteristics, by Year.
| 1990 | 2000 | Change | % Change | |
|---|---|---|---|---|
| Metro Population (millions) | 1.172 | 1.339 | 0.168 ** | 14.3% |
| Percentage Non-Hispanic White | 0.747 | 0.676 | -0.071 ** | -9.5% |
| Percentage Non-Hispanic Black | 0.118 | 0.123 | 0.005 ** | 4.3% |
| Percentage Hispanic | 0.097 | 0.133 | 0.036 ** | 37.7% |
| Percentage Asian | 0.033 | 0.042 | 0.010 ** | 29.4% |
| Percentage Foreign-Born | 0.082 | 0.115 | 0.033 ** | 40.0% |
| Black/White Income Ratio | 0.542 | 0.557 | 0.015 ** | 2.8% |
| Hispanic/White Income Ratio | 0.544 | 0.468 | -0.076 ** | -14.0% |
| Asian/White Income Ratio | 0.784 | 0.780 | -0.004 | -0.5% |
| Percentage Suburban | 0.623 | 0.660 | 0.037** | 5.9% |
| Black/White Suburbanization Ratio | 0.536 | 0.566 | 0.030 ** | 5.7% |
| Hispanic/White Suburbanization Ratio | 0.777 | 0.750 | -0.027 * | -3.4% |
| Asian/White Suburbanization Ratio | 0.754 | 0.765 | 0.011 | 1.5% |
Notes: N=100. Means are unweighted.
p<.05.
p<.01.
Race/Ethnic percentages sum to less than 100% due to omission of other groups (and omission of multi-race individuals in 2000 census).
Table 3 presents estimates from three regression models for each of the three racial contrasts (Black-white, Hispanic-white, and Asian-white). In the first and second models for each racial contrast, the outcome variables are the measures of micro- (500m radius) and macro-environment (4km radius) segregation, respectively. In the third model, the outcome is the macro/micro segregation ratio.
Table 3. OLS Regression of Changes in Segregation on Changes in Metro Characteristics, 100 Largest Metropolitan Areas, 1990-2000.
| Black-White Segregation | Hispanic-White Segregation | Asian-White Segregation | |||||||
|---|---|---|---|---|---|---|---|---|---|
|
|
|
|
|||||||
| H500m | H4000m | H4000m/H500m | H500m | H4000m | H4000m/H500m | H500m | H4000m | H4000m/H500m | |
| Intercept (Secular Trend) | -0.016 ** | 0.004 | 0.026 ** | -0.016 ** | 0.006 | 0.024 * | 0.002 | 0.005 | 0.006 |
| (0.005) | (0.006) | (0.009) | (0.006) | (0.005) | (0.010) | (0.006) | (0.005) | (0.014) | |
| Log10(Metro Population) | -0.156 ** | -0.093 | 0.130 | 0.121 | 0.143 * | 0.517 ** | 0.145 * | 0.155 ** | 0.714 ** |
| (0.057) | (0.063) | (0.096) | (0.077) | (0.065) | (0.138) | (0.056) | (0.045) | (0.140) | |
| Log10(Group Percentage) | -0.035 | 0.114* | 0.288 ** | 0.094 ** | 0.083 ** | 0.261 ** | 0.094 ** | 0.065 * | 0.186 * |
| (0.041) | (0.045) | (0.069) | (0.035) | (0.029) | (0.062) | (0.032) | (0.025) | (0.079) | |
| Log10(Percentage Foreign-Born) | 0.141** | 0.047 | -0.177 * | -0.011 | 0.015 | 0.058 | |||
| (0.049) | (0.042) | (0.088) | (0.025) | (0.020) | (0.063) | ||||
| Log10(Income Ratio) | -0.563 ** | -0.496 ** | -0.578 ** | -0.095 | 0.055 | 0.286 * | -0.049 | -0.042 | -0.178 |
| (0.058) | (0.064) | (0.098) | (0.073) | (0.062) | (0.130) | (0.047) | (0.037) | (0.117) | |
| Log10(Percentage Suburban) | -0.146 ∼ | 0.015 | 0.150 | -0.423 ** | -0.356 ** | -0.408 * | -0.192 * | -0.180 ** | -0.595 ** |
| (0.087) | (0.096) | (0.146) | (0.097) | (0.083) | (0.175) | (0.075) | (0.060) | (0.188) | |
| Log10 (Suburbanization Ratio) | -0.018 | -0.011 | 0.029 | -0.147 ** | -0.114 ** | -0.142 ∼ | -0.077 ∼ | -0.015 | 0.060 |
| (0.032) | (0.035) | (0.053) | (0.046) | (0.039) | (0.083) | (0.040) | (0.032) | (0.101) | |
|
| |||||||||
| Adjusted R-squared | 0.522 | 0.450 | 0.421 | 0.654 | 0.462 | 0.272 | 0.195 | 0.254 | 0.359 |
Notes:
p<.01;
p<.05;
p<. 10.
Standard errors in parentheses.
Secular Trends in the Geographic Scale of Segregation, 1990-2000
Before examining the coefficients on the covariates in the models in Table 3, it is useful to look at the extent to which the models explain the observed trends in segregation levels and ratios (reported in Table 1). The intercept in these models can be interpreted as the secular trend in segregation levels—it indicates the predicted change in the outcome variable for a metropolitan area in which each of the covariates is unchanged from 1990 to 2000.
Table 3 indicates that the models fully explain the observed trends in macro-environment (4000m radius) segregation. Net of the model covariates, the secular trends in macro-environment segregation are not statistically distinguishable from 0 for any of the three race groups (compare to Table 1, where the Hispanic-white and Asian-white trends in H4000m were both large and significant). The models are also relatively effective at explaining secular trends in the macro/micro segregation ratio. Changes in the demographic and structural characteristics account for all of the observed trend in Asian-white segregation ratios; most (60%) of the trend in Hispanic-white segregation ratios; and 40% of the trend in Black-white segregation ratios. The models are less effective at explaining the observed trends in micro-environment (500m radius) segregation (at least for black-and Hispanic-white segregation) however. Given that we included each of the covariates on the basis of hypotheses about their relationship to macro-scale segregation, this is not surprising.
Correlates of Changes in Segregation
Table 3 indicates that the data from our sample are consistent with many, but not all, of our hypotheses regarding the relationships among changes in demographic characteristics and changes in segregation patterns. First, changes in the population of metropolitan areas are positively corelated with changes in the extent to which Hispanic- and Asian-white segregation are due to macro-scale residential patterns (as metropolitan areas grow, an increasing proportion of segregation is due to macro-environment segregation). For Black-white segregation, however, change in population size is negatively correlated with change in micro-scale segregation, but not significantly correlated with change in macro-scale segregation or the segregation ratio.
Of more interest are the associations between changes in the population share of a group and that group's segregation from whites. For all three groups, increases in group population share are positively associated with increases in macro-scale segregation and in the proportion of segregation due to macro-scale segregation. Moreover, although changes in group proportions are also positively associated with Hispanic- and Asian-white micro-segregation, additional analyses (not shown) indicate that this is entirely due to their association with macro-segregation. Changes in group proportions are uncorrelated with the component of change in micro-segregation that is not due to macro-segregation.16
Net of changes in the Hispanic population share, increases in the percentage of foreign-born residents in a metropolitan area are associated with increases in Hispanic-white micro-environment segregation, but not macro-environment segregation. This leads to a decrease in the proportion of segregation that is due to macro-scale segregation. San Francisco, for example, experienced larger than average increases in the percent foreign-born from 1990 to 2000, and experienced larger increases in Hispanic-white micro-scale segregation (H500) than macro-scale segregation (H4000), and thus small declines in the Hispanic-white macro-micro segregation ratio. These patterns are consistent with an immigration-driven increase in the presence of small, localized ‘enclave’ neighborhoods of Hispanics. There is no such pattern evident for Asian-white segregation, though it is important to note that our measure of the foreign-born percent of the population does not distinguish among Hispanic and Asian immigrants. Given the larger number of Hispanic than Asian immigrants in many areas, any Asian immigrant effect may be masked by the confounding of immigrant groups.
One pattern that does not fully match our hypotheses is the relationship between changes in income ratios and changes in segregation patterns. Recall that we hypothesized that changes in income ratios would be negatively correlated with changes in macro-scale segregation (as minority groups' income grows, segregation due to large-scale ‘ghettos’ declines, and vice versa). This hypothesis appears valid for black-white segregation, where increases in Black-white income ratios are associated with decreases in macro-scale segregation and corresponding decreases in the Black-white macro/micro segregation ratio. For Hispanic-white segregation, however, declines in Hispanic incomes are associated with decreases in Hispanic-white macro/micro segregation ratios, suggesting that lower Hispanic incomes (recall from Table 2 that Hispanic-white income ratios declined sharply on average in the 1990s) lead to an increase in the formation of small, localized Hispanic enclave neighborhoods. Although more investigation is needed to fully explain these patterns, they suggest on their face that low-income Black households are concentrated in large, racially-identifiable ghettos, while low-income Hispanic households tend to be concentrated in smaller ethnic enclaves.
The final set of covariates in the models address the relationship between suburbanization patterns and segregation. Here we find that changes in the Hispanic-white suburbanization ratio are negatively correlated with changes in both micro- and macro-segregation. Since Hispanic-white suburbanization ratios generally declined in the 1990s (because Hispanic suburbanization generally grew more slowly than white suburbanization), this implies that Hispanic-white macro -segregation grew faster in metropolitan areas with the sharpest declines in the relative suburbanization of their Hispanic populations. Moreover, the increasing concentration of Hispanics in central cities is associated with larger macro/micro segregation ratios—Hispanic-white segregation is increasingly due to macro-scale patterns as the suburbanization ratio for Hispanics declines.
We find, however, no association between changes in suburbanization ratios and black-white or Asian-white segregation. Asian-white suburbanization ratios changed little in the 1990s, which likely explains the lack of a significant association between the two in the Asian-white models. Blacks, however, were the least suburbanized of the three minority groups in 1990 and experienced the largest increases in relative suburbanization rates (Table 2). The absence of an association between changes in black-white suburbanization and segregation suggests that black suburbanization is concentrated in inner-ring suburbs near large black central city population concentrations.
4. Discussion
Our results indicate that the most consistent trend in segregation patterns during the 1990s is the increasing dominance of macro-scale segregation patterns for all three racial contrasts we examined. This pattern is evident in nearly 90% of the metropolitan areas and racial contrasts in our sample. Equally important, however, is the evidence that the explanations for this common pattern appears to differ for black-white segregation from Hispanic- and Asian-white segregation.
The increases in Hispanic-white and Asian-white segregation are driven primarily by increases in macro-scale segregation. In terms of our earlier examples, Hispanic- and Asian-white segregation trends correspond to changes from patterns like those in region C to those in region A (e.g., less like black-white patterns in Pittsburgh and more like those in New York). These changes result from an increase in the concentration of Hispanic and Asian populations in large subregions of metropolitan areas. Moreover, our regression results suggest that macro-scale segregation grew most rapidly in metropolitan areas with rapidly growing Hispanic or Asian populations, and where suburbanization rates grew more slowly than average. Together, these findings suggest that the recent patterns of Asian-white and Hispanic-white segregation are driven largely by the rapid growth of Hispanic and Asian populations in central cities.
Much of the growth of the Hispanic and Asian populations, of course, is driven by immigration. In addition, we find a significant positive association between changes in the proportion of immigrants in a metropolitan area and micro-scale Hispanic-white segregation patterns, net of the association between growth in the Hispanic and Asian population and segregation. Rapid growth of immigrant populations appears to lead to increasing micro-scale segregation, likely through the formation and expansion of small, localized ethnic enclave communities. These results are consistent with chain migration. If Hispanic immigrants are drawn to enclaves based upon familial ties, cultural preferences, and labor networks, then it stands to reason this would result in increasing micro-segregation. In this sense, immigrant settlement is spatially selective. Our results suggest that, all else unchanged, metropolitan areas with high rates of foreign immigration have stable patterns of macro-scale segregation but increases in micro-scale segregation (similar to a change from the pattern in Region B to that in Region A in Figure 1), a trend very different from the observed average trend in Hispanic-white segregation (Table 1).
In contrast to the trends in Hispanic- and Asian segregation, black-white segregation declined at the micro-scale but not at the macro scale. To return to our earlier examples, this suggests that white-black segregation has come to resemble the Los Angeles pattern more than the New York pattern (segregation patterns increasingly resemble stylized region B rather than A, in terms of Figures 1 and 2). Declines in black-white segregation observed in tract-level analyses have resulted from local processes of residential integration (nearby neighborhoods became more racially similar to one another during the 1990s) rather than from any large scale redistribution of black and white populations. Moreover, our results confirm the existence of trends suggested in other research documenting the decline in black-white tract-level (micro-) segregation since the l970s coupled with the persistence of larger-scale segregation (Fischer et al., 2004; Massey & Hajnal, 1995). Our definitions of scale, however, are more precisely defined than in this prior work, since they do not depend on municipal or tract boundaries, and our sample of metropolitan areas is much larger.
Our regression results indicate that the declines in black-white micro-scale segregation are driven largely by the combination of increasing black population shares (which leads to greater macro-scale, but not micro-scale segregation) and increasing black-white income parity (which leads to declining macro- and micro-scale segregation). These effects offset each other, on average, for macro-scale segregation, but not for micro-scale segregation. Moreover, there is a secular trend toward declining micro-scale black-white segregation that is not fully accounted for by our model. While there are a variety of potential explanations for this trend—changes in residential and neighbor preferences, changes in real estate and lending practices—they are beyond the scope of this paper to investigate.
The Implications of Changes in Segregation for Social Outcomes
Our goal in this paper has been to describe the patterns of change in the geographic scale of racial segregation. Issues of scale are important not merely in describing patterns of segregation, however, but in understanding both the causes and consequences of segregation. The causes of large-scale segregation may be quite different from those of small-scale segregation. For example, factors such as the spatial location of public amenities that draw primarily on pedestrian traffic and local residents (e.g., elementary schools, playgrounds, storefront shopping areas, etc.), and the nature of street networks (Grannis, 1998) may play a role in shaping small-scale segregation patterns. Likewise families' racial composition preferences for their immediate and more distant neighbours may affect residential patterns at a range of scales. Farley and colleagues document increasing preferences for racial heterogeneity among one's immediate neighbors (micro-neighborhood preferences) in a study conducted in Detroit in 1976 and 1992. Such changes might account for some of the secular trend in micro-segregation patterns not explained by our models, though it is not clear whether this increase is general to all race groups and all metropolitan areas; nor is it clear whether the trend has continued through the 1990s (Farley et al., l994).
In contrast, large-scale segregation patterns, such as those observed in cities like Chicago, Detroit, and Atlanta, might be caused more by structural and demographic characteristics (as we discuss above), labor markets and other economic features of regions, jurisdictional structures (e.g., municipalities, school districts, service districts), racial income inequality, housing segregation (Yinger, 1995), and residual historical settlement patterns (Massey & Denton, 1993). Institutional factors, such as housing and lending markets, may also play a role in shaping both macro- and micro-scale segregation. A study by HUD found that although black and Hispanic applicants were treated differently, on average, by real estate agents than were white applicants, such discriminatory practices declined from 1989 to 2000, at least with regard to black and Hispanic home seekers (Ross & Turner, 2005). Hispanic renters, however, continued to face discrimination in the rental market. Such constraints on Hispanic access to rental units could help maintain or exacerbate Hispanic macro-segregation in areas experiencing high levels of Hispanic growth. Moreover, the reduction in housing discrimination for home seekers might differentially affect micro- and macro-segregation if, for example, it meant that real estate agents were more likely in 2000 than in 1990 to show homes to their clients (of any race) in transitional or border neighborhoods, but were no more likely to show homes whose surrounding macro-environments were racially dissimilar from their clients.
Just as the causes of segregation may differ by geographic scale, so too may the consequences of segregation depend on the scale of segregation patterns. Local segregation is likely to affect pedestrian contact patterns, for example. Large-scale segregation, however, may be more likely to affect the spatial distribution of economic, institutional, and political resources. Moreover, some recent research suggests that the effects of racial composition on crime and social disorder vary with geographic scale (Hipp, 2007). Likewise, Firebaugh and Schroeder (2007), in a study of the associations between neighborhood income distribution and individuals' self-rated happiness, find that happiness is greatest for individuals living in wealthy neighborhoods (block groups in their study) in low-income regions (counties). This finding supports our contention that there is no single ‘right’ geographic scale at which to measure context and segregation, and that the effects of context/neighborhood may depend on geographic scale.
One area where the geographic scale of segregation is likely to matter considerably is in the relationship between residential and school segregation. In the presence of high levels of macro-scale residential segregation, school districts (and courts) are likely to be much more limited in their ability to ameliorate residential segregation patterns (through school assignment policies, strategic delineation of attendance zone boundaries, or school choice policies) than when residential segregation patterns are due primarily to variation in racial composition over short distances. This will be particularly true when macro-scale residential segregation patterns are associated with segregation between school districts, since individual school district policies cannot affect between-district school segregation patterns (at least in the short term).
In addition, the consequences of segregation may depend differently on scale for different populations. For young children, who might stay relatively close to home in the course of a day (attending local child care, preschool, or elementary schools), patterns of local segregation are likely to be most influential. For adults, in contrast, who are more mobile, large-scale segregation patterns linked to employment opportunities and social and institutional resources may be more relevant. Thus, the increasing role of macro-scale segregation patterns in shaping micro-scale patterns has potentially important implications for the effects of reductions in residential segregation.
Acknowledgments
This work was supported by the National Science Foundation [grants SES-0520400 (Reardon) and SES-0520405 (Matthews)] and the William T. Grant Foundation (Reardon). We thank Barry Lee for helpful comments and Steve Graham and Yosef Bodovski for writing the code to compute the spatial segregation measures used here. All errors remain our own.
Appendix: Computation of Spatial Segregation Indices
This approach to measuring spatial segregation requires two types of information: 1) an estimate of the population density of each group at each point in space; and 2) a measure of the spatial proximity between all pairs of points in a region R.17 In practice, we base our calculations here on estimates of race-specific population densities in a finite grid of 50-by-50 meter cells. In order to estimate the population density of each racial group at each grid point in a region, we proceed as follows. We superimpose a grid of 50-by-50 meter cells on the census block map. We then estimate population counts by race group for each cell in the grid by calculating population densities per unit area for each race group in each block, and assigning an estimated population count for each race group to each 50-by-50 meter cell. We assign estimated population counts to cells on the boundaries of blocks based on the population densities of the block in which the greater part of the cell falls. These steps yield a grid of population counts by race group but with abrupt changes in the counts at block boundaries.
Next, to arrive at a more realistic representation of the population distribution, we smooth the population grid using pycnophylactic (‘mass preserving’) smoothing (Tobler, 1979). This procedure iteratively re-estimates the counts in each grid cell by assigning to each cell the average population count of the cell and its eight neighbors, while readjusting the population counts in cells so that the known total counts in bocks are honored. The smoothing procedure is repeated until the average change in the populations assigned to cells changes between successive iterations by no more than 0.01% of the variance in the cell population counts. We apply the smoothing procedure to grid cell counts for each race group separately so that race group counts as well as total population counts within bocks are preserved. The result of this procedure is an estimate of the population count and density for each race group in each grid cell in the region. These density estimates form the basis for the calculations of the spatial information theory index.18
Given the estimated population density surface, computing segregation levels requires that we define a spatial proximity function. Following White's (1983) suggestion, we rely on a distance-decay proximity function that weights nearby locations more heavily than distant ones in computing the composition of each local environment, as this plausibly corresponds to the effect of proximity on patterns of social interaction. Specifically, we use a two-dimensional biweight kernel proximity function, which is similar in shape to a Gaussian function, but is bounded by a finite radius in order to reduce computational requirements. We then compute segregation levels using the biweight kernel proximity function with radii of 500m, 1000m, 2000m, and 4000m. These radii correspond roughly to local environments ranging from ‘pedestrian’ in size (500m radius) to those that are considerably larger—perhaps the size of a large high-school attendance zone (4000m radius). At each of these radii, we compute three segregation measures—white-black segregation, white-Hispanic segregation, and white-Asian segregation.
Footnotes
In addition, some studies use measures of exposure, such as the isolation index, and/or measures of clustering, centralization, and concentration, but we do not include these in our review here.
Hipp (2007) provides an example illustrating that the association between neighborhood racial composition and crime depends on the geographic scale at which composition is measured.
It is worth noting that the trend toward the increasing dominance of macro- over micro-scale racial segregation is not mirrored in trends in income segregation, where the long-term trends suggest the increasing dominance of micro- over macro-scale segregation (Massey & Fischer, 2003).
We describe the details of measuring segregation using different radii below.
These 100 metropolitan areas together were home to 173 million residents in 2000, 62% of the U.S. total population, including 70% of non-Hispanic Blacks (23.6 million); 78% of Hispanics (27.6 million), and 89% of Asians (9 million).The metropolitan areas range in population from 11.3 million (New York-white Plains, NY-NJ) to 561,000 (Scranton--Wilkes-Barre, PA).
We use four mutually-exclusive race/ethnic groups for the analyses reported here: white, not Hispanic; Black, not Hispanic; Asian, not Hispanic; and Hispanic, any race. We drop all other categories, including those reporting more than one race (in 2000). Note that because we use total population counts by race/ethnic group from Summary File 1, our counts include both institutionalized and non-institutionalized populations. Restricting our analyses to non-institutionalized populations would require using the population counts from Summary File 3, which are not available at geographies lower than the block group level. Block-level population counts and block boundaries/shape files are obtained from GeoLytics (GeoLytics, 2003a, 2003b).
Obtained at http://www.census.gov/population/estimates/metro-city/03msa.txt. Population counts for metropolitan areas and divisions are obtained at http://www.census.gov/population/www/cen2000/phc-t29.html (Table 3a).
We use the spatial information theory index for several reasons. First, it is a measure of spatial evenness (unlike, for example, the so-called spectral segregation index of Echenique & Fryer, 2005). Second, it does not rely on contiguity patterns among arbitrarily-shaped census areal units for its computation, unlike some other spatial measures (Echenique & Fryer, 2005; Jargowsky & Kim, 2005; Wong, 1993, 2002, 2003, 2004; Wu & Sui, 2001). And third, among the set of proximity-based spatial measures described by Reardon & O'Sullivan, it has the most desirable set of mathematical properties (Reardon & O'Sullivan, 2004).
As in other studies of segregation between two population groups, we consider only the population counts of the two groups in computing the racial composition of local environments and the study region. In computing black-white segregation, for example, we ignore racial groups other than black and white.
In this paper, we rely on a spatial proximity function defined by Euclidean distance between two locations. More generally, however, one could define proximity as some (empirically- or theoretically-derived) function of distance, intervening population density, transportation time, physical barriers, etc. A comparison of segregation levels computed among local environments defined by these different metrics might be very useful for understanding the social processes that produce segregation and its consequences. At present, however, the computation of segregation measures using metrics other than simple distance are much more computationally demanding than current software enables.
Reardon and O'Sullivan (2004) note that it is mathematically possible that measured segregation could increase with scale, but only under conditions that are theoretically unreasonable and empirically unlikely. Likewise, it is mathematically possible that measured segregation can take on a value less than zero, in the case of “hyper-integration,” but, again, the conditions for this are not empirically observed.
Reardon and Yun (2001) suggest that a change in the information theory index of .05 should be considered a sizeable change.
In additional analyses (not shown), we estimated the average change in the aspatial (between-tract) Hispanic-white and Asian-white segregation from 1990 to 2000 for our sample of metropolitan areas, and found similar patterns of average modest increases in segregation to those we report using the spatial measure, regardless of whether we used the aspatial information theory index or the dissimilarity index. This suggests that the differences between our conclusion that Asian-white segregation is increasing slightly and the conclusion of some prior research indicating that Asian-white segregation has been relatively stable is not driven by our use of the spatial information theory index rather than the more commonly-used aspatial dissimilarity index.
The estimates from these models regressing changes in segregation on changes in covariates are identical to those we would obtain from fixed-effects models that include both 1990 and 2000 observations for each metro and a set of metropolitan area fixed effects. We prefer this formulation because it makes clear we are interested in estimating the relationships among changes in segregation and changes in metropolitan area characteristics.
We would prefer to include a measure of group-specific foreign born population share (e.g., proportion of Hispanics who are foreign-born in the Hispanic-white models), but this measure is unavailable in the 1990 STF3 Census files. We do not include foreign-born population share in the black-white segregation models for parsimony, since we have no theoretical expectation that it affects black-white segregation. Nonetheless, models including foreign-born population share (not shown) yield substantively identical results as those presented here.
Specifically, in additional analyses, we decompose H500m into a component due to macro-scale segregation (H4000m) and a residual component due only to the extent of variation in racial composition over short distances (H500m- H4000m). When we fit regression models like those in Table 3 using this latter component as the outcome, the coefficients on the proportion Hispanic and Asian variables are small (0.011 and 0.029, respectively) and non-significant. See Lee et al (2008) for a similar analytic approach.
All analyses—including estimation of the population densities and computation of segregation levels—are based on a macro written in Visual Basic for Applications (VBA) and run within ArcGIS 9.1 (Environmental Systems Research Institute, 2005). The ArcGIS macro (SpatialSeg) is available for download from our project website at http://www.pop.psu.edu/mss/.
Note that the estimation method we use requires some parameter choices—specifically, we choose a grid cell size of 50m2; we use block level data; we use pycnophylactic smoothing—these may affect segregation levels. However, a series of sensitivity analyses (available from authors upon request) indicate that our estimates are insensitive to the grid cell size choice (up to grid cells of 100m2), and suggest that the smoothing increases the estimated segregation very slightly (as we would expect, since it allows for within-block unevenness in racial patterns). Since any biases in the method are generally stable across years, on average, they are unlikely to affect our substantive results regarding trends.
Publisher's Disclaimer: This is a PDF file of an unedited manuscript that has been accepted for publication. As a service to our customers we are providing this early version of the manuscript. The manuscript will undergo copyediting, typesetting, and review of the resulting proof before it is published in its final citable form. Please note that during the production process errors may be discovered which could affect the content, and all legal disclaimers that apply to the journal pertain.
Contributor Information
Sean F. Reardon, Stanford University
Chad R. Farrell, University of Alaska at Anchorage
Stephen A. Matthews, Pennsylvania State University
David O'Sullivan, University of Auckland.
Kendra Bischoff, Stanford University.
Glenn Firebaugh, Pennsylvania State University.
References
- Charles CZ. The dynamics of racial residential segregation. Annual Review of Sociology. 2003;29:167–207. [Google Scholar]
- Cowgill DO, Cowgill MS. An index of segregation based on block statistics. American Sociological Review. 1951;16(6):825–831. [Google Scholar]
- Dawkins CJ. Spatial changes in income segregation during the 1990s; Paper presented at the annual meeting of the Association of American Geographers; Chicago, IL. 2006. [Google Scholar]
- Duncan OD, Duncan B. A methodological analysis of segregation indexes. American Sociological Review. 1955 Apr;20(2):210–217. [Google Scholar]
- Echemque F, Fryer RG. On the measurement of segregation 2005 [Google Scholar]
- Environmental Systems Research Institute. ArcGIS: Release 9.1. Redlands, CA: Environmental Systems Research Institute; 2005. [Google Scholar]
- Farley R, Frey WH. Changes in the segregation of whites from blacks during the 1980s: Small steps toward a more integrated society. American Sociological Review. 1994 Feb;59:23–45. [Google Scholar]
- Farley R, Steeh C, Krysan M, Jackson T, Reeves K. Stereotypes and segregation: Neighborhoods in the Detroit area. American Journal of Sociology. 1994;100:750–780. [Google Scholar]
- Farrell CR. Bifurcation, Fragmentation, or Integration? The Racial and Geographic Structure of Metropolitan Segregation, 1990-2000. Urban Studies. 2008;45(3):467–499. [Google Scholar]
- Firebaugh G, Schroeder MB. Does your neighbor's income affect your happiness? 2007 doi: 10.1086/603534. mimeo. [DOI] [PMC free article] [PubMed] [Google Scholar]
- Fischer CS, Stockmayer G, Stiles J, Hout M. Distinguishing the geographic levels and social dimensions of U.S. metropolitan segregation, 1960-2000. Demography. 2004;41(1):37–59. doi: 10.1353/dem.2004.0002. [DOI] [PubMed] [Google Scholar]
- Frey WH, Farley R. Latino, Asian, and Black segregation in U.S. metropolitan areas: Are multiethnic metros different? Demography. 1996;33(1):35–50. [PubMed] [Google Scholar]
- Frey WH, Myers D. Racial Segregation in US Metropolitan Areas and Cities, 1990–2000: Patterns, Trends, and Explanations. Population Studies Center: University of Michigan; 2005. Population Studies Center Research Report No. 05-573. [Google Scholar]
- GeoLytics. Census 1990 Blocks. East Brunswick, NJ: GeoLytics, Inc; 2003a. [Google Scholar]
- GeoLytics. Census 2000 Short Form Blocks. East Brunswick, NJ: GeoLytics, Inc; 2003b. [Google Scholar]
- Glaeser EL, Vigdor JL. Racial Segregation in the 2000 Census: Promising News. Washington, DC: Brookings Institution Center on Urban and Metropolitan Policy; 2001. [Google Scholar]
- Grannis R. The importance of trivial streets: Residential streets and residential segregation. American Journal of Sociology. 1998;103(6):1530–1564. [Google Scholar]
- Grannis R. Discussion: Segregation indices and their functional inputs. Sociological Methodology. 2002;32:69–84. [Google Scholar]
- Hipp JR. Block, Tract, and Levels of Aggregation: Neighborhood Structure and Crime & Disorder as a Case in Point. American Sociological Review. 2007;72(5):659–680. [Google Scholar]
- Iceland J. Beyond Black and White Metropolitan residential segregation in multi-ethnic America. Social Science Research. 2004;33(2):248–271. [Google Scholar]
- Iceland J, Steinmetz E. The Effects of Using Census Block Groups Instead of Census Tracts When Examining Residential Housing Patterns. Washington, DC: U.S. Census Bureau; 2003. [Google Scholar]
- Iceland J, Weinberg DH, Steinmetz E. Racial and ethnic segregation in the United States: 1980-2000. Washington, DC: U.S. Census Bureau; 2002. [Google Scholar]
- Jakubs JF. A distance-based segregation index. Journal of Socio-economic Planning Sciences. 1981;15:129–136. [Google Scholar]
- James DR, Taeuber KE. Measures of segregation. Sociological Methodology. 1985;14:1–32. [Google Scholar]
- Jargowsky PA, Kim J. A measure of spatial segregation: The generalised Neighborhood Sorting Index 2004 [Google Scholar]
- Jargowsky PA, Kim J. A measure of spatial segregation: The generalized neighborhood sorting index. Ann Arbor, MI: National Poverty Center, University of Michigan; 2005. NPC Working paper No. 05-3. [Google Scholar]
- Kaplan DH, Holoway SR. Scaling ethnic segregation: Causal processes and contingent outcomes in Chinese residential patterns. Geojournal. 2001;53:59–70. [Google Scholar]
- Lee BA, Reardon SF, Firebaugh G, Farrell CR, Matthews SA, O'Sullivan D. Beyond the Census Tract: Patterns and Determinants of Racial Residential Segregation at Multiple Geographic Scales. American Sociological Review. 2008;73:766–791. doi: 10.1177/000312240807300504. [DOI] [PMC free article] [PubMed] [Google Scholar]
- Logan JR. Ethnic diversity grows; Neighborhood integration lags. Albany, NY: Lewis Mumford Center, SUNY Albany; 2001. [Google Scholar]
- Logan JR, Stults BJ, Farley R. Segregation of minorities in the metropolis: Two decades of change. Demography. 2004;41(1):1–22. doi: 10.1353/dem.2004.0007. [DOI] [PubMed] [Google Scholar]
- Massey DS. Residential Segregation and Neighborhood Conditions in U.S. Metropolitan Areas. In: Smelser NJ, Wilson WJ, Mitchell F, editors. America Becoming: Racial Trends and Their Consequences. Vol. 1. Washington, DC: National Academies Press; 2001. pp. 391–434. [Google Scholar]
- Massey DS, Denton NA. The dimensions of residential segregation. Social Forces. 1988;67(2):281–315. [Google Scholar]
- Massey DS, Denton NA. American apartheid: segregation and the making of the underclass. Cambridge, MA: Harvard University Press; 1993. [Google Scholar]
- Massey DS, Fischer MJ. The geography of inequality in the United States, 1950-2000. Brookings-Wharton Tapers on Urban Affairs. 2003;(4):1–40. [Google Scholar]
- Massey DS, Hajnal ZL. The changing geographic structure of Black-White segregation in the United States. Social Science Quarterly. 1995;76(3):527–542. [Google Scholar]
- Morgan BS. An alternate approach to the development of a distance-based measure of racial segregation. American Journal of Sociology. 1983a;88(6):1237–1249. [Google Scholar]
- Morgan BS. A distance-decay interaction index to measure residential segregation. Area. 1983b;15:211–216. [Google Scholar]
- Morrill RL. On the measure of spatial segregation. Geography Research Forum. 1991;11:25–36. [Google Scholar]
- Reardon SF, Firebaugh G. Measures of multi-group segregation. Sociological Methodology. 2002;32:33–67. [Google Scholar]
- Reardon SF, Matthews SA, O'Sullivan D, Lee BA, Firebaugh G, Farrell CR, et al. The geographic scale of metropolitan racial segregation. Demography. 2008;45:489–514. doi: 10.1353/dem.0.0019. [DOI] [PMC free article] [PubMed] [Google Scholar]
- Reardon SF, O'Sullivan D. Measures of spatial segregation. Sociological Methodology. 2004;34:121–162. [Google Scholar]
- Reardon SF, Yun JT. Suburban racial change and suburban school segregation, 1987-1995. Sociology of Education. 2001;74(2):79–101. [Google Scholar]
- Reardon SF, Yun JT, Eitle TM. The changing structure of school segregation: Measurement and evidence of multi-racial metropolitan area school segregation, 1989-1995. Demography. 2000;37(3):351–364. [PubMed] [Google Scholar]
- Ross SL, Turner MA. Housing Discrimination in Metropolitan America: Explaining Changes Between 1989 and 2000. Social Problems. 2005;52:152–180. [Google Scholar]
- Smith N. Scale. In: Johnston RJ, Gregory D, Pratt G, Watts M, editors. The dictionary of human geography. 4th. Oxford, UK: Blackwell; 2000. pp. 724–727. [Google Scholar]
- Taeuber KE, Taeuber AF. Negroes in cities: Residential segregation and neighborhood change. Chicago, IL: Atheneum; 1969. [Google Scholar]
- Theil H. Statistical decomposition analysis. Vol. 14. Amsterdam: North-Holland Publishing Company; 1972. [Google Scholar]
- Theil H, Finezza AJ. A note on the measurement of racial integration of schools by means of informational concepts. Journal of Mathematical Sociology. 1971;1:187–194. [Google Scholar]
- Tobler WR. Smooth pycnophylactic interpolation for geographical regions. Journal of the American Statistical Association. 1979;74:519–529. doi: 10.1080/01621459.1979.10481647. [DOI] [PubMed] [Google Scholar]
- Van Valey TL, Roof WC. Measuring Residential Segregation in American Cities: Problems of Intercity Comparison. Urban Affairs Quarterly. 1976;11:453–468. [Google Scholar]
- White MJ. The measurement of spatial segregation. American Journal of Sociology. 1983;88(5):1008–1018. [Google Scholar]
- Wong DWS. Spatial indices of segregation. Urban Studies. 1993;30(3):559–572. [Google Scholar]
- Wong DWS. Spatial dependency of segregation indices. The Canadian Geographer. 1997;41(2):128–136. [Google Scholar]
- Wong DWS. Geostatistics as measures of spatial segregation. Urban Geography. 1999;20(7):635–647. [Google Scholar]
- Wong DWS. Spatial measures of segregation and GIS. Urban Geography. 2002;23(1):85–92. [Google Scholar]
- Wong DWS. Implementing measures of spatial segregation in GIS. Computers, Environment and Urban Systems. 2003;27(1):53–70. [Google Scholar]
- Wong DWS. Comparing traditional and spatial segregation measures: A spatial scale perspective. Urban Geography. 2004;25(1):66–82. [Google Scholar]
- Wu XB, Sui DZ. An initial exploration of a lacunarity-based segregation measure. Environment and Planning B: Planning and Design. 2001;28:433–446. [Google Scholar]
- Yinger J. Closed Doors, Opportunities Lost: The Continuing Costs of Housing Discrimination. New York: Russell Sage Foundation; 1995. [Google Scholar]
- Zoloth BS. Alternative measures of school segregation. Land Economics. 1976;52(3):278–298. [Google Scholar]