

Abstract
The objective of this study was to identify pathways that regulate the cytotoxicity induced by free fatty acids (FFAs) in human hepatoblastoma cells (HepG2/C3A). Gene expression profiles of HepG2/C3A cells were obtained at three time points, after 24, 48, and 72 h of exposure to different types of FFA. Saturated fatty acid (palmitate) was found to be cytotoxic. The pathways activated by the different FFAs at the different time points were identified using global gene module map analysis. Unsaturated FFAs exerted transcriptional regulation mainly within the first 24 h, whereas saturated FFA, palmitate, regulated energy production pathways, such as the electron transport chain (ETC) and tricarboxylic acid cycle, within the first 24 h. In the next 24 h, palmitate up-regulated 36 cell death relevant pathways and down-regulated several protective pathways, such as the pentose phosphate pathway and glutathione-related pathways. In the final 24 h, the FFAs did not induce significant transcriptional regulation. We hypothesized that palmitate induced cytotoxicity by first perturbing metabolic pathways in the initial 24 h, resulting in changes to factors, such as metabolites or signaling molecules, which subsequently triggered cell death relevant pathways in the next 24 h. The uptake and release of 27 metabolites were measured to further elucidate the metabolic changes in the first 24 h. It was determined that ketone bodies such as β-hydroxybutyrate and acetoacetate were important in separating the toxic from the nontoxic phenotypes. A regression model was used to identify the genes relevant to these metabolites. Some of the genes identified to be important were experimentally validated. It was found that ETC genes such as NADH dehydrogenase and succinate dehydrogenase were involved in palmitate induced cytotoxicity.
Introduction
Drug-induced liver toxicity is the leading cause of acute liver failure in the United States, exceeding all other causes combined (1). When a drug is found to induce toxicity, it is usually recalled, resulting in huge financial losses for the pharmaceutical company. Drug-induced toxicity may result from different mechanisms, for example, through the disruption of the cellular membrane, alteration of mitochondrial function or drug metabolism pathways, nonspecific covalent binding of the drug to the cell’s proteins, or through the activation of apoptotic signaling pathways such as the tumor necrosis factor (TNF) and Fas pathways (1). In addition, liver toxicity can also be induced by nutrients, e.g., a high-fat diet. Elevated free fatty acid (FFA) levels have been found to be associated with the development of many liver-related diseases such as fatty liver disease and insulin resistance (2–5). Elevated FFA levels increase the accumulation of triglycerides (TGs) in liver cells (steatosis) and enhance the risk of developing non-alcoholic steatohepatitis (NASH), which is characterized by extensive cell death and inflammation (2). Identifying the pathways that contribute to the development of liver toxicity by drugs or diet may provide insights into minimizing or preventing the toxicity.
Elevated levels of FFAs have been implicated in the pathogenesis of many obesity-related metabolic disorders (2–5), such as fatty liver disease and steatohepatitis. Exposure to elevated fatty acid levels is associated with lipotoxicity. Dietary fatty acids produce a variety of metabolic and genetic effects on liver cells. Fatty acids compete with glucose for oxidation at the tricarboxylic acid (TCA) cycle (6). Fatty acids also cause changes in the enzyme makeup of the cells by regulating the transcription of many key metabolic enzymes (7). We studied the cytotoxic effects of different types of FFAs. Saturated fatty acid palmitate was found to induce significantly higher toxicity. To elucidate the underlying pathways that induced the observed toxicity, herein denoted toxicity pathways, global gene expression profiles were measured after 24, 48, and 72 h of treatments. These time points were chosen to capture the effects of sustained elevation of FFAs as in conditions of non-alcoholic fatty liver disease (8). FFA exerts short-term and long-term effects. Whereas the short-term effects (on the order of minutes and seconds) are mediated through changes in the metabolic and signaling pathways, the long-term effects are usually mediated through changes in the genomic profile of the cells as well. Because the toxicity developed over a period of hours, we hypothesize that the long-term genomic changes play an important role in the cytotoxic effects of FFAs.
The gene regulatory network may change over time, e.g., gene expression is regulated by different pathways during the different phases of the cell cycle in Saccharomyces cerevisiae (9). A single time point expression profile does not allow us to infer the sequence of regulatory events. Therefore, time series experiments are required to obtain a better understanding of the evolving regulatory interactions. A variety of approaches such as differential equations (10), dynamic Bayesian networks (11), and singular value decomposition (12) have been applied to infer the regulatory interactions from time series data. However, these methods are data driven and do not explicitly incorporate pathway information of the known gene regulatory network. In addition, they typically do not use all of the microarray gene data in the analysis, thus making the capture of global gene regulatory patterns difficult. Therefore, in this study we applied global gene module mapping analysis (13) to integrate whole genome time series expression data with pathway information to detect global transcriptional regulatory changes over time. The analysis identified that palmitate altered energy production pathways, such as the electron transport chain (ETC) and TCA cycle, within the first 24 h. In the next 24 h, palmitate up-regulated 36 cell death relevant signaling pathways and down-regulated several protective pathways, such as the pentose phosphate pathway (PPP) and glutathione-related pathways. In the final 24 h of exposure, the FFAs did not induce significant transcriptional regulation. On the basis of the module map analysis results, we hypothesized that palmitate induced cytotoxicity by first perturbing the metabolic pathways that resulted in changes in the levels of factors such as metabolites or signaling molecules, which subsequently triggered cell death relevant signaling pathways in the next 24 h. If this hypothesis holds, then if we remove the palmitate stimuli after being applied, the toxicity response would still remain. To help elucidate the toxicity pathways, the uptake and release of 27 metabolites were measured. Important metabolites that separated the toxic and nontoxic phenotypes were identified using discriminant analysis. A partial least-squares analysis (PLS) model was used to identify the genes relevant to these metabolites. Some of the genes identified to be important were experimentally validated.
Materials and Methods
Cell Culture
One million HepG2/C3A cells were seeded into each well of a 6-well culture plate. The cells were cultured in 2 mL of medium containing DMEM (Invitrogen, Carlsbad, CA) supplemented with 10% fetal bovine serum (FBS) (Tissue Culture Biologicals, CA) and 2% penicillin-streptomycin (P/S) (Invitrogen, Carlsbad, CA). This medium is henceforth referred to as the control medium (or Ctrl). Cells were incubated at 37 °C and in 10% CO2 atmosphere. After the cells reached confluence, the medium was replaced with 2 mL of the chosen medium, either the control medium or the FFA medium containing 0.7 mM palmitate, oleate, or linoleate (all FFA from Sigma Aldrich Chemical Co., St. Louis, MO). The fatty acids chosen are the most prevalent in the class of saturated (palmitate), monounsaturated (oleate), and polyunsaturated (linoleate) fatty acids in plasma. The concentration of fatty acids chosen (0.7 mM) is commonly found in conditions of obesity. The FFAs were dissolved in 4% fatty-acid-free BSA (US Biological, Swampscott, MA). Therefore, in addition to the control medium control, 4% fatty-acid-free BSA in control medium was used as another control.
Toxicity and Gene Expression Measurement
The cyto-toxicity of the treatments was measured as the fraction of lactate dehydrogenase (LDH) released into the medium. LDH is a cytosolic enzyme that leaks out into the medium when the cell membrane is compromised, such as on exposure to toxic chemicals (14). Thus, the fraction of LDH released into the medium provides an accurate estimate of the cytotoxicity. For the LDH measurements, the cells were cultured in different media and the supernatant was collected. Cells were washed with phosphate buffered saline (PBS) and kept in 1% Triton-X-100 in PBS for another 24 h at 37 °C. Cell lysates were then collected, vortexed for 15 s, and centrifuged at 7000 rpm for 5 min. A cytotoxicity detection kit (Roche Applied Science, Indianapolis, IN) was used to measure the LDH release. LDH released was normalized to the total LDH (released + lyzed).
The gene expression profiles were obtained with the cDNA microarrays. Cells were cultured in 10 cm tissue culture plates until confluence and then exposed to different treatments. RNA was isolated with the Trizol reagent. The microarray analyses were conducted at the Van Andel Institute, Grand Rapids, MI. The protocols are available online at (http://www.vai.org/Research/Services/LMT/Protocols.aspx). There were two biological replicates for each condition, and each replicate was measured with the Cy3 and Cy5 dyes (i.e., there were two technical replicates for each biological replicate).
Metabolite Measurements
The uptake and production of the primary metabolites were measured to identify the changes in the major metabolic pathways. Particularly, the uptake of glucose, production of lactate, uptake of the FFAs, production of ketone bodies and accumulation of triglycerides, uptake or production of all the amino acids were obtained. In all, 27 metabolites were measured. These metabolites were selected as they represent the pathways central to cellular metabolism and have been known to be affected by exposure to FFAs. The measurements also identified the differences in metabolism of the different types of FFAs. Detailed analysis methods are described in ref 15. Briefly, the uptake/production of glucose, lactate, FFA, triglyceride, glycerol, acetoacetate (ACAC), and β-hydroxybutyrate (BOH) were measured using commercially available enzymatic assays, while all the amino acids were measured using HPLC and employing a commercial protocol (AccQTag amino acid method, Waters Corporation, Milford, MA). Cysteine uptake was measured using HPLC (16).
Gene Module Map Analysis
To identify the underlying pathways, module map analysis (13) was used to identify the important genes. A total of 350 biologically meaningful gene sets were first defined on the basis of their functional category or pathways defined in the MsigDB database (17). The functional gene modules were extracted from the 350 gene sets based upon the expression profile using Genomica (available at http://genie.weizmann.ac.il). This was accomplished by separating the gene sets into clusters and identifying the genes with similar profiles in the cluster and placing them in a functional module. The algorithm used in Genomica was the bottoms-up hierarchical clustering method (13). The functional modules reflect the specific biological process captured by the genes in the module. The toxic and nontoxic phenotypes were characterized by the modules that were found induced or repressed for each phenotype. This methodology was used to formulate a module map to characterize the relation between the modules and treatments. The module maps at different time points were compared to identify the dynamics of the modules that are important to the cytotoxic phenotype.
Fisher’s Discriminant Analysis (FDA)
FDA was applied to identify the measured metabolite uptake/release that contributed to the separation of the different phenotypes (toxic versus nontoxic). FDA was applied to 15 samples belonging to 5 groups with 27 metabolite measurements for each sample. FDA identifies the projection axis that maximizes the ratio of the between-group and the within-group variations. Details on the FDA algorithm can be found in ref 18. Two axes T1 and T2 were extracted; each is a linear combination of the 27 metabolite uptake/release.
| (1) |
Wi provides the contribution of each metabolic flux in separating the phenotypes in the T1 and T2 directions.
Regression Model
Partial least-squares analysis (PLS) (19) is a regression model that can handle problems where the number of variables is larger than the number of observations. It reduces the number of variables by projecting the data onto a few independent latent variables. These latent variables simplify the complex and diverse relationships by capturing the variable interactions contained in the original data into a new set of fewer unobserved/latent variables. We used this approach to map the levels of gene expression (X) to a metabolite (Y) to identify the genes that are relevant to a metabolic function. The PLS algorithm determines, based upon a nonlinear iterative partial least-squares (NIPALS) approach, a set of orthogonal projection axes W, henceforth called PLS-weights, and sample projections T. For direct projection of the samples, W*= (W(PT*W)−1) is used:
| (2) |
Then, regression coefficients β in eq 3 are obtained by regressing Y onto the sample projections T:
| (3) |
With a PLS factors, the PLS model is
| (4) |
| (5) |
Inhibitor Experiments
Confluent cells grown on 24-well plates were treated with palmitate in the presence or absence of various concentrations of inhibitors of complex I, rotenone, and complex-II, sodium malonate dihydrate (Mal), and carboxin (Cbxn). While malonate was directly dissolved in palmitate medium, a 500 mM stock solution of carboxin and 10 mM stock solution of rotenone was first prepared in dimethyl sulfoxide (DMSO) and then diluted to the desired final concentration. The concentration of DMSO was, therefore, not greater than 0.1%. At this concentration, DMSO does not affect the toxicity or ketone body release by palmitate. For each inhibitor, we tested whether it caused any toxic effect in the control medium. At the concentrations applied, no toxic effects were observed.
Results and Discussion
Gene Module Mapping Analysis
Human hepatoblastoma cells (HepG2/C3A) were used to study the toxic effects of FFAs. The cells were exposed to three different types of FFAs, e.g., saturated palmitate, unsaturated oleate, and polyunsaturated linoleate. The toxicity and gene expression data of the HepG2/C3A cells at three time points (24, 48, and 72 h) were obtained. Palmitate induced significantly higher toxicity as compared to the control, oleate, and linoleate cultures. Thus, the goal of this study was to determine when and how palmitate induced toxicity in the cultured cells. We first identified the pathways that were induced or repressed at each of the three time points using global gene module mapping analysis (13), which integrated gene expression data and functional pathway information. A total of 350 functional gene sets were defined on the basis of known metabolic, signaling, and gene regulatory pathways obtained from databases, such as BioCarta [http://www.biocarta.com/genes/index.asp] and GENMAPP (20).
Module mapping analysis was applied to identify gene functional pathways activated by the different FFAs and TNF-α. Oleate and linoleate were found to have transcriptional regulation patterns very different from those of palmitate. Oleate activated 52 pathways (module map and expression data available in Supporting Information file 1) in the first 24 h and only 4 pathways in the next 24 h (Supporting Information file 2). Linoleate was similar to oleate with 29 pathways (Supporting Information file 3) activated in the first 24 h and 9 pathways in the next 24 h (Supporting Information file 4). Fourteen pathways such as Akt, Bcl2, cell death, Fas, P53, TNFR1, etc. were affected by both oleate and linoleate in the first 24 h. This suggests that similar cell death regulation and survival pathways may be activated by oleate and linoleate, which could have contributed to the lower toxicity observed in both the unsaturated fatty acids. No significant transcription activation or regulation was observed for oleate and linoleate in the final 24 h of exposure.
In contrast, palmitate altered only 6 functional pathways in the first 24 h, which included up-regulating the cytokine and NO pathways and down-regulating ETC, TCA, eIF2-α, and malate metabolic pathways in the first 24 h. A module map of these pathways is available in Supporting Information file 5. In the next 24 h, palmitate altered 39 functional pathways (module map and expression data of the genes in each module are available in Supporting Information file 6). The 39 pathways included 36 cell death related pathways, such as caspase, which was up-regulated, and the PPP and glutathione pathways, which were down-regulated. In the last 24 h, palmitate did not induce significant transcriptional regulation. These results suggest that the transcriptional effects of the FFAs were primarily exerted within a day or two and depended on the degree of saturation of the FFAs.
Based upon the global transcriptional regulation pattern uncovered with module mapping analysis, we found that the transcriptional effects were mainly exerted within the second 24 h of palmitate exposure. This coincided with a significant increase in the LDH release and toxicity observed on day 2 (more than 35%) as compared to day 1 (around 5%), shown in Figure 1. Therefore, we hypothesized that the toxicity pathways activated during the second 24 h were due to factors that were produced from metabolic or signaling perturbations induced by palmitate during the first 24 h. These factors subsequently triggered cell death related pathways that manifested in the elevated toxicity levels observed on day 2. It is likely that the accumulation of certain metabolites, in conjunction with the genomic changes in the metabolic enzymes, during the initial 24 h produced the changes that led to the development of the toxicity. To test this hypothesis, the HepG2 cells were exposed to palmitate for 24 h followed by exposure to the culture medium without palmitate for the next 24 h. As shown in Table 1, the exposure to palmitate on day 2 did not contribute to increasing the toxicity observed on day 2. This suggested that the events induced by palmitate during the first 24 h contributed to the toxicity increase observed on day 2. To determine what these unknown factors were, we first analyzed the functional gene groups altered by palmitate in the first 24 h. Among the 6 functional pathways, ETC, TCA, and malate pathways are involved in energy production in the mitochondria. NADH is produced by the TCA cycle and malate pathways. Electrons derived from NADH are fed into the ETC through complex I or II and eventually passed to molecular oxygen to form H2O at complex IV. Alteration of the ETC and TCA cycle may cause changes in the energy status. The palmitate treatment may affect pathways related to energy production, and a change in the energy status could alter the phosphorylation of eIF-2 (21). The cytokine and NO pathway are signaling pathways that likely are activated due to the exposure to palmitate and TNF-α during the first 24 h.
Figure 1.

Cytotoxicity of the treatments at three time points. Confluent HepG2 cells were treated with saturated (palmitate), monounsaturated (oleate), and polyunsaturated (linoleate) free fatty acid at 0.7 mM. Cytotoxicity was measured as % LDH released. Data presented as average ± SD of n = 9 from three independent experiments. a, significantly greater than control.
Table 1.
Effect of Duration of Exposure to Palmitate on Toxicity on Day 2a
| LDH release on day 2 (%) | |
|---|---|
| D1 Palm, Day 2 Palm | 36 ± 4 |
| D1 Palm, D2 Control | 33 ± 5 |
Data presented as average ± SD of n = 9 from three independent experiments.
Free fatty acid oxidation is known to be an important source of energy production. FFAs may alter the energy status of the cells by altering the mitochondrial potential (22), the driving force for the synthesis of ATP. FFAs affect the uptake and metabolism of glucose and amino acids and thus may affect the energy status of the cells through those pathways. In order to investigate the changes in metabolite uptake/production rates that could be associated with the toxicity, we analyzed the metabolite profiles in response to FFA. Therefore, we further analyzed the metabolite profiles to help uncover the possible toxicity pathways.
Metabolites Relevant to Toxicity
To obtain a more in-depth analysis of the toxicity pathways, we measured 27 metabolites to identify which metabolites contributed to separating the toxic from the nontoxic phenotype. FDA was applied to identify the metabolites that were responsible for separating the phenotypes (toxic versus nontoxic as defined by their level of LDH release) on day 1. The palmitate cultures separated from the other treatment in the two-dimensional space defined by the FDA projections T1 and T2 (Figure 2a). In the case of the metabolites, analyzing metabolite coefficients in the FDA projections, T1 and T2, (Figure 2b) indicated that BOH, acetoacetate, intracellular TG accumulation, and amino acids such as aspartate, alanine, and ornithine were the important metabolites separating the cytotoxic (palmitate) and nontoxic (control, unsaturated fatty acids) phenotypes. Intracellular TG, ornithine, and aspartate had the highest coefficients in separating palmitate from the other conditions in the T2 direction, whereas BOH, acetoacetate, and alanine separated the two groups in the T1 direction. This analysis suggested that the differences in the metabolic state captured by TG, BOH, and acetoacetate contributed significantly to the separation of the two phenotypes. Acetoacetate and BOH are produced from acetyl-CoA, a metabolic intermediate of fatty acid oxidation. Increased fatty acid oxidation increases oxidative stress, which may lead to cell death (23, 24). In contrast, TG accumulation has been found to protect cells from palmitate-induced lipoxicity (25). Ornithine and aspartate may affect fatty acid metabolism through the TCA cycle. Ornithine has been shown to reduce the cytotoxic response of spleen cells to cytotoxic T cell lymphocytes (26), and aspartate has been shown to protect against oxidative death in astrocytes (27). Thus, the FDA analysis identified metabolites that may contribute to the palmitate-induced cytotoxicity.
Figure 2.

FDA analysis of metabolite profile on day 1. (a) FDA projection score plot of the samples. Palmiate samples (P) were separated from the rest including control (H), BSA samples (fatty acid free) (B), oleate samples (O), and linoleate samples (L). (b) Loading plot of the coefficients of metabolites. Ketone bodies such as BOH and ACAC were found to be most important in separating the palmitate cultures from the rest in the T1 direction.
Genes Relevant to the Ketone Bodies and Literature Validation
To identify the genes that regulated the functions closely associated with the cytotoxicity on day 1, a PLS regression model was applied to map the expression data of the genes in the 6 functional gene sets activated by palmitate to the metabolites such as BOH identified in the previous section. Day 1 was chosen because the module map analysis suggested that during the first 24 h palmitate induced perturbation of certain functions which activated toxicity pathways during the second 24 h. The genes were selected by evaluating the regression coefficients of the individual genes.
A full list of the regression coefficients can be found in Supporting Information file 7 for the PLS model to predict BOH. Genes involved in ETC and TCA cycle such as succinate dehydrogenase (SucDH) and NADH dehydrogenase had highly positive regression coefficients, suggesting a positive role in cytotoxicity. Different substrates enter the ETC through different complexes. The SucDH complex or complex II is an enzyme complex involved at the crossroads of ETC and TCA and transfers electrons from succinate to ubiquinol. Substrates such as malate or glutamate produce NADH and NADH enters the ETC through complex I. The NADH dehydrogenase complex, or complex I of the ETC, is a major site of superoxide production (28), as illustrated in Figure 3. These results suggested that the process of energy production through the ETC is closely related to ketone body production and in turn cytotoxicity, possibly through the production of reactive oxygen species (ROS). Increased β-oxidation could increase acetyl-CoA and mitochondrial NADH levels, which could increase the production of ketone bodies as well as the production of ROS through oxidation at the mitochondrial complex I. The list with the top ranked genes is shown in Table 2. Other important genes in Table 2 include metabolic genes such as pyruvate carboxylase and isocitrate dehydrogenase. Pyruvate carboxylase is involved in gluconeogenesis, and isocitrate dehydrogenase is involved in the TCA cycle. Thus genes encoding enzymes involved in glucose metabolism and TCA cycle may also be important in regulating saturated fatty acid induced toxicity, perhaps through the regulation of membrane fatty acid composition (29). In addition, cell signaling related genes such as vascular endothelial growth factor (VEGF) and tumor necrosis factor receptor (TNF) superfamily were also identified. The TNF signaling pathway has been shown extensively to regulate cell death. VEGF has also been shown to modulate cell death in response to many stimuli, e.g., by activating cytoprotective pathways such as extracellular signal-regulated protein kinases (ERK1/2) (30). It is likely that alteration of these pathways could also modulate FFA toxicity.
Figure 3.
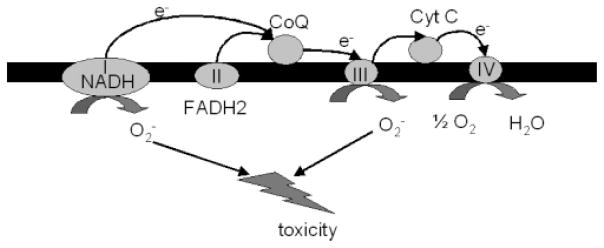
Electron transport chain and ROS production. The SucDH complex or complex II is an enzyme complex involved at the crossroads of ETC and TCA and transfers electrons from succinate to ubiquinol. Substrates such as malate or glutamate produces NADH and NADH enters the ETC through complex I. The NADH dehydrogenase complex, or complex I of the ETC, is a main site of superoxide production.
Table 2.
Genes Selected by PLS Model
| namea | absolute (regression coeff) |
|---|---|
| succinate dehydrogenase complex, subunit D, integral membrane protein (SDHD), nuclear gene encoding mitochondrial protein, mRNA. (AA035384,NM_003002,Hs.168289) | 9.02E-02 |
| vascular endothelial growth factor (VEGF), mRNA. (R45059,NM_003376,Hs.73793) | 8.47E-02 |
| fms-related tyrosine kinase 1 (vascular endothelial growth factor/vascular permeability factor receptor) (FLT1), mRNA. (AA058828,NM_002019,Hs.381093) | 7.72E-02 |
| phosphoenolpyruvate carboxykinase 1 (soluble) (PCK1), mRNA. (AA405731,NM_002591,Hs.1872) | 7.17E-02 |
| spectrin, alpha, erythrocytic 1 (elliptocytosis 2) (SPTA1), mRNA. (R07151,NM_003126,Hs.1985) | 6.86E-02 |
| interleukin 1, beta (IL1B), mRNA. (AA150507,NM_000576,Hs.126256) | 6.33E-02 |
| transforming growth factor, beta 2 (TGFB2), mRNA. (AA233738,NM_003238,Hs.169300) | 5.59E-02 |
| NADH dehydrogenase (ubiquinone) 1 alpha subcomplex, 4, 9kDa (NDUFA4), mRNA. (AA680322,NM_002489,Hs.50098) | 5.41E-02 |
| eukaryotic translation initiation factor 2, subunit 1 alpha, 35kDa (EIF2S1), mRNA. (AA669452,NM_004094,Hs.151777) | 5.35E-02 |
| CD44 antigen (homing function and Indian blood group system) (CD44), mRNA. (W45275,NM_000610,Hs.169610) | 5.27E-02 |
| pyruvate carboxylase (PC), nuclear gene encoding mitochondrial protein, transcript variant 2, mRNA. (T77729,NM_022172,Hs.89890) | 5.17E-02 |
| spectrin, alpha, erythrocytic 1 (elliptocytosis 2) (SPTA1), mRNA. (AA001897,NM_003126,Hs.1985) | 5.12E-02 |
| mucin 1, transmembrane (MUC1), mRNA. (AA488073,NM_002456,Hs.89603) | 5.05E-02 |
| talin 1 (TLN1), mRNA. (AA678226,NM_006289,Hs.375001) | 4.98E-02 |
| colony stimulating factor 1 receptor, formerly McDonough feline sarcoma viral (v-fms) oncogene homolog (CSF1R), mRNA. (AA284954,NM_005211,Hs.174142) | 4.89E-02 |
| MCF.2 cell line derived transforming sequence (MCF2), mRNA. (H05800,NM_005369,Hs.89543) | 4.84E-02 |
| NADH dehydrogenase (ubiquinone) 1, alpha/beta subcomplex, 1, 8kDa (NDUFAB1), mRNA. (AA447569,NM_005003,Hs.5556) | 4.78E-02 |
| NADH dehydrogenase (ubiquinone) 1 alpha subcomplex, 3, 9kDa (NDUFA3), mRNA. (AA405901,NM_004542,Hs.198269) | 4.66E-02 |
| tumor necrosis factor receptor superfamily, member 1B (TNFRSF1B), mRNA. (AA150416,NM_001066,Hs.256278) | 4.64E-02 |
| colony stimulating factor 1 (macrophage) (CSF1), mRNA. (T55558,NM_000757,Hs.173894) | 4.56E-02 |
| NADH dehydrogenase (ubiquinone) 1 beta subcomplex, 10, 22kDa (NDUFB10), mRNA. (AA620565,NM_004548,Hs.198274) | 4.54E-02 |
| isocitrate dehydrogenase 3 (NAD+) gamma (IDH3G), mRNA. (AA459380,NM_004135,Hs.75253) | 4.42E-02 |
| NADH dehydrogenase (ubiquinone) Fe-S protein 1,75kDa (NADH-coenzyme Q reductase) (NDUFS1), mRNA. (AA406536,NM_005006,Hs.8248) | 4.31E-02 |
Bold highlighted genes were discussed in the paper and experimentally tested.
Experimental Validation of the Identified Important Genes
We experimentally evaluated the involvement of several of the genes identified by the regression model relevant to palmitate-induced cytotoxicity. Upon analyzing the regression coefficients, we found that 5 NADH dehydrogenase genes were deemed highly important to BOH (Table 2). Experimentally, we inhibited NADH dehydrogenase in palmitate-treated cells and found that LDH release was significantly decreased, as shown in Figure 4. Therefore, this suggests that NADH dehydrogenase is an important factor in regulating the toxicity, corroborating with the model prediction. Mitochondria ETC is known to be a major site of ROS generation and NADH dehydrognease or complex I is one of the sites in the ETC that generates ROS.
Figure 4.

Effects of NADH dehydrogenase inhibitor on LDH release in palmitate culture cells. Inhibiting NADH dehydrogenase with 0.5 μM rotenone significantly reduced LDH release in palmitate cultured cells. Data presented as average ± SD of 9 replicates from three independent experiments. * denotes significance with p < 0.01 with Student’s t-test.
Ketone bodies are synthesized from acetyl-CoA as a result of oxidation of FFAs in the mitochondria. Oxidation of FFAs is associated with the production of NADH and FADH2, the two energy-rich molecules used to catalyze ATP synthesis by the mitochondria. The NADH generated is oxidized at the complex I (NADH dehydrogenase), which ultimately leads to formation of ATP. Acetyl-CoA, the fatty acid oxidation product, can also enter the TCA cycle to produce NADH, which is fed to the ETC to produce energy. Increased fatty acid oxidation increases oxidative stress, which may lead to cell death (23,24).
To investigate whether the reduction in toxicity by the NADH dehydrogenase inhibitor is due to ROS, we measured the level of ROS generated in the first 24 h in the palmitate cultured cells. ROS was found to accumulate in the first 24 h (Figure 5a), which reduced significantly upon inhibiting NADH dehydrogenase in the palmitate cultured cells (Figure 5b). Furthermore, supplementation with ROS scavengers prevented the palmitate-induced toxicity (22). Taken together, these results suggest that NADH dehydrogenase is an important factor that contributes to the cytotoxicity, through the generation of ROS.
Figure 5.

Involvement of ROS and NADH dehydrogenase in FFA induced toxicity. (A) Time course profile of ROS level in palmitate cultured cells. ROS was detected using fluorescence dye H2-DCFDA. ROS was found to accumulate within the first 24 h in the palmitate cultured cells. (B) Effects of NADH dehydrogenase inhibitor on ROS in palmitate culture cells. Inhibiting NADH dehydrogenase by pre-treating with 0.5 μM rotenone significantly reduced ROS level in palmitate cultured cells on day 1. Data presented as average ± SD of 9 replicates from three independent experiments. * denotes significance with p < 0.01 with Student’s t-test.
Inhibiting NADH dehydrogenase, however, did not reduce the toxicity to basal level, indicating that it is not the only factor involved. Since SucDH was identified as another gene with a high regression coefficient, we also evaluated the effect of inhibiting the enzyme this gene encodes on the cytotoxicity and ROS production. Inhibition of SucDH by malonate as well as by carboxin caused a significant reduction in the cytotoxicity (Figure 6a). Additionally, malonate reduced the release of BOH in the palmitate-treated cells to basal levels (Figure 6b), while carboxin treatment reduced the BOH release slightly (but statistically significantly). Indeed malonate has been shown to inhibit H2O2 generation in isolated rat brain mitochondria (31).
Figure 6.

Effect of inhibition of SucDH. Sodium malonate dihydrate (Mal, 5–50 mM) and carboxin (Cbxn, 50–500 uM) were used for inhibitors. (a) On cytotoxicity. LDH release was reduced significantly in palmitate (Palm, P) cultured cells by both inhibitors on day 1. (b) On the release of B–OH by the cells. Carboxin reduced BOH significantly and malonate reduced BOH to basal level in palmitate cultured cells on day 1. Data presented as average ± SD of 6 replicates from two independent experiments. * denotes significance with p < 0.01 with Student’s t-test.
As mentioned above, the analysis found that in the next 24 h, i.e., day 2, the PPP- and glutathione-related pathways were repressed in the palmitate-cultured cells. It is well-known that these two pathways are related to ROS through the cofactor, NADPH (32) (Figure 7). NADPH, which is produced by the PPP pathway, is required to generate reduced glutathione (GSH) from oxidized glutathione (GSSG). GSH, our body’s natural antioxidant, plays an important role in quenching ROS. We measured the total GSH level and found that the cells exposed to palmitate had reduced GSH levels as compared to the control and unsaturated FFA cultured cells (Table 3). Indeed, the addition of antioxidants, such as N-acetyl cysteine (NAC), significantly reduced palmitate-induced toxicity (not shown).
Figure 7.
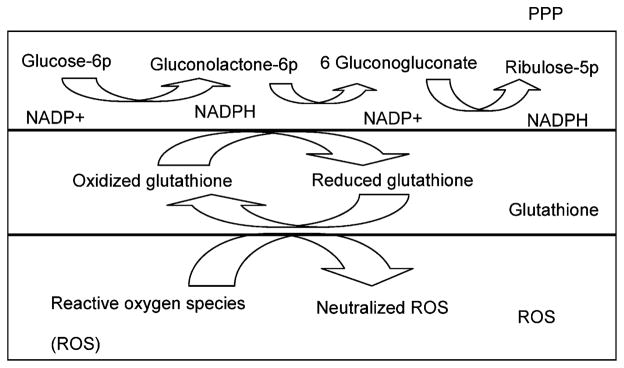
Schematic of PPP pathway and glutathione pathways in ROS production through NADPH. PPP and glutathione production pathways are related to ROS through the cofactor, NADPH. NADPH, which is produced by the PPP pathway, is required to generate reduced glutathione (GSH) from oxidized glutathione (GSSG). GSH plays an important role in quenching ROS.
Table 3.
Glutathione Measurement (nmoles/mg Protein)a
| day 1 | day 2 | day 3 | |
|---|---|---|---|
| BSA | 4.39 ± 0.48 | 4.56 ± 0.67 | 4.59 ± 0.68 |
| Palm | 3.39 ± 0.43* | 2.58 ± 0.26* | 3.09 ± 0.25* |
| Ole | 4.35 ± 0.97 | 5.16 ± 0.61 | 4.25 ± 0.18 |
Data presented as average ± s.d. of n = 9 from three independent experiments.
significantly lower than control and oleate with p < 0.01 by Student’s t-test.
It may be useful, in future experiments, to obtain a window of action of palmitate on cell death, e.g., what is the minimum duration of exposure to palmitate that results in overt toxicity and what are the related genomic changes before and after that time range? Such a study will provide additional insights into the evolving genetic networks that regulate the cell’s decision to survive or die.
In summary, dynamic module map analysis was applied to uncover the transcriptional regulation exerted by palmitate and suggested that the causal factors that triggered the toxicity pathways were produced during the first 24 h. We further integrated gene expression and metabolites profiles with discriminant analysis and PLS regression model to identify these casual factors. Important metabolites, such as BOH, were identified and ETC relevant pathways such as NADH dehydrogenase and SucDH were further found to be relevant to these metabolites. Notably, ketone bodies, such as BOH, are related to fatty acid oxidation and energy production through acetyl-CoA and the cofactor NADH. Inhibiting NADH dehydrogeanse decreased the toxicity significantly by inhibiting ROS production. Inhibiting SucDH decreased both BOH and toxicity significantly. Therefore, this framework identified when the toxicity was induced and suggested some of the major pathways associated with FFA toxicity, some of which were experimentally validated as proof-of-concept.
Conclusion
An approach based upon gene module map analysis was applied to dynamic gene expression profiles to identify patterns of transcriptional regulation in hepatoma cells exposed to various types of FFA. Gene targets were identified by integrating the gene expression and metabolic profiles using a PLS regression model. Several of the gene targets were validated experimentally. The analysis revealed potential mechanisms by which saturated FFA induced hepatocellular toxicity and identified potential targets that could alleviate the toxicity. This approach may be easily applied to other systems and conditions.
Acknowledgments
The research was supported by the funding from National Science Foundation (BES 0331297, BES 0425821 and SBIR 0610784), Environmental Protection Agency (RD83184701), National Institute of Health (1R01GM079688-01 and 1 R21 CA126136-01) and the Whitaker foundation. The microarray data is deposited at the GEO website http://www.ncbi.nlm.ni-h.gov/geo, with a query number of GSE5441.
Footnotes
Supporting Information Available:
Gene modules activated by oleate on day 1 and day 2; gene modules activated by linoleate on day 1 and day 2; gene modules activated by palmitate on day 1 and day 2; regression coefficients for BOH. This material is available free of charge via the Internet at http://pubs.acs.org.
References and Notes
- 1.Navarro VJ, Senior JR. Drug-related hepatoxicity. NEJM. 2006;354:731–739. doi: 10.1056/NEJMra052270. [DOI] [PubMed] [Google Scholar]
- 2.Felber JP, Golay A. Pathways from obesity to diabetes. Int J Obesity. 2002;26(Suppl 2):S39–S45. doi: 10.1038/sj.ijo.0802126. [DOI] [PubMed] [Google Scholar]
- 3.Kobayashi M. Molecular mechanism of insulin resistance. Saishin Igaku. 1998;53(6):1210–1216. [Google Scholar]
- 4.Tilg H. Cytokines and liver diseases. Can J Gastroenterol. 2001;15(10):661–668. doi: 10.1155/2001/746736. [DOI] [PubMed] [Google Scholar]
- 5.Watada H, Kawamori R. Insulin resistance and NASH. BIO Clin. 2003;18(10):874–879. [Google Scholar]
- 6.Randle PJ, Garland PB, Newsholme EA, Hales CN. The glucose fatty acid cycle in obesity and maturity onset diabetes mellitus. Ann N Y Acad Sci. 1965;131(1):324–333. doi: 10.1111/j.1749-6632.1965.tb34800.x. [DOI] [PubMed] [Google Scholar]
- 7.Jump DB. Fatty acid regulation of gene transcription. Crit Rev Clin Lab Sci. 2004;41(1):41–78. doi: 10.1080/10408360490278341. [DOI] [PubMed] [Google Scholar]
- 8.Angulo P. Nonalcoholic fatty liver disease. New Engl J Med. 2002;346:1221–1231. doi: 10.1056/NEJMra011775. [DOI] [PubMed] [Google Scholar]
- 9.Lee TI, Rinaldi NJ, Robert F, Odom DT, Bar-Joseph Z, Gerber GK, Hannett NM, Harbison CT, Thompson CM, Simon I, Zeitlinger J, Jennings EG, Murray HL, Gordon DB, Ren B, Wyrick JJ, Tagne JB, Volkert TL, Fraenkel E, Gifford DK, Young RA. Transcriptional regulatory networks in Saccharomyces cerevisiae. Science. 2002;298(5594):799–804. doi: 10.1126/science.1075090. [DOI] [PubMed] [Google Scholar]
- 10.Chen T, He HL, Church GM. Modeling gene expression with differential equations. Pac Symp Biocomput. 1999;4:29–40. [PubMed] [Google Scholar]
- 11.Kim SY, Imoto S, Miyano S. Inferring gene networks from time series microarray data using dynamic Bayesian networks. Brief Bioinform. 2003;4:228–235. doi: 10.1093/bib/4.3.228. [DOI] [PubMed] [Google Scholar]
- 12.Holter NS, Maritan A, Ciepak M, Fedoroff NV, Banavar J. Dynamic modeling of gene expression data. Proc Natl Acad Sci US A. 2001;98:1693–1698. doi: 10.1073/pnas.98.4.1693. [DOI] [PMC free article] [PubMed] [Google Scholar]
- 13.Segal E, Friedman N, Koller D, Regev A. A module map showing conditional activity of expression modules in caner. Nat Genet. 2004;36(10):1090–1098. doi: 10.1038/ng1434. [DOI] [PubMed] [Google Scholar]
- 14.Riss TL, Moravec RA. Use of multiple assay endpoints to investigate the effects of incubation time, dose of toxin, and plating density in cell-based cytotoxicity assays. Assay Drug Dev Technol. 2004 Feb 2;(1):51–62. doi: 10.1089/154065804322966315. [DOI] [PubMed] [Google Scholar]
- 15.Srivastava S, Chan C. Application of metabolic flux analysis to identify the mechanisms of free fatty acid toxicity to human hepatoma cell line. Biotechnol Bioeng. 2007 doi: 10.1002/bit.21568. in press. [DOI] [PMC free article] [PubMed] [Google Scholar]
- 16.Fiskerstrand T, Refsum H, Kvalheim G, Ueland PM. Homocysteine and other thiols in plasma and urine: automated determination and sample stability. Clin Chem. 1993;39(2):263–271. [PubMed] [Google Scholar]
- 17.Subramanian A, Tamayo P, Mootha VK, Mukherjee S, Ebert BL, Gillette MA, Paulovich A, Pomeroy SL, Golub TR, Lander ES, Mesirov JP. Gene set enrichment analysis: a knowledge-based approach for interpreting genome-wide expression profiles. Proc Natl Acad Sci USA. 2005;102(43):15545–15550. doi: 10.1073/pnas.0506580102. [DOI] [PMC free article] [PubMed] [Google Scholar]
- 18.Chan C, Hwang D, Stephanopoulos GN, Yarmush ML, Stephanopoulos G. Application of multivariate analysis to optimize function of cultured hepatocytes. Biotechnol Prog. 2003;19(2):580–598. doi: 10.1021/bp025660h. [DOI] [PubMed] [Google Scholar]
- 19.Hwang DH, Stephanopoulos G, Chan C. Inverse modeling using multi-block PLS to determine the environmental conditions that provide optimal cellular function. Bioinformatics. 2004;20:487–499. doi: 10.1093/bioinformatics/btg433. [DOI] [PubMed] [Google Scholar]
- 20.Dahlquist KD, Salomonis N, Vranizan K, Lawlor SC, Conklin BR. GenMAPP, a new tool for viewing and analyzing microarray data on biological pathways. Nat Genet. 2002;31(1):19–20. doi: 10.1038/ng0502-19. [DOI] [PubMed] [Google Scholar]
- 21.Gill H, Wu G. Non-alcoholic fatty liver disease and the metabolic syndrome: Effects of weight loss and a review of popular diets. Are low carbohydrate diets the answer? World J Gastroenterol. 2007;12(3):345–353. doi: 10.3748/wjg.v12.i3.345. [DOI] [PMC free article] [PubMed] [Google Scholar]
- 22.Srivastava S, Chan C. Hydrogen peroxide and hydroxyl radicals mediate palmitate-induced cytotoxicity to hepatoma cells: relation to mitochondrial permeability transition. Free Radical Res. 2007;41(1):38–49. doi: 10.1080/10715760600943900. [DOI] [PubMed] [Google Scholar]
- 23.Miller RR, Jr, Burum AL, Leithart ME, Hart JD. Hyperglycemia-induced changes in hepatic membrane fatty acid composition correlate with increased caspase-3 activities and reduced chick embryo viability. Comp Biochem Physiol, Part B: Biochem Mol Biol. 2005 Jul;141(3):323–30. doi: 10.1016/j.cbpc.2005.04.008. [DOI] [PubMed] [Google Scholar]
- 24.Sanyal AJ, Campbell-Sargent C, Mirshahi F, Rizzo WB, Contos MJ, Sterling RK, Luketic VA, Shiffman ML, Clore JN. Nonalcoholic steatohepatitis: association of insulin resistance and mitochondrial abnormalities. Gastroenterology. 2001;120(5):1183–1192. doi: 10.1053/gast.2001.23256. [DOI] [PubMed] [Google Scholar]
- 25.Listenberger LL, Han X, Lewis SE, Cases S, Farese RV, Jr, Ory DS, Schaffer JE. Triglyceride accumulation protects against fatty acid-induced lipotoxicity. Proc Natl Acad Sci US A. 2003;100(6):3077–3082. doi: 10.1073/pnas.0630588100. [DOI] [PMC free article] [PubMed] [Google Scholar]
- 26.Janicke R, Droge W. Effect of L-ornithine on proliferative and cytotoxic T-cell responses in allogeneic and syngeneic mixed leukocyte cultures. Cell Immunol. 1985;92(2):359–365. doi: 10.1016/0008-8749(85)90017-6. [DOI] [PubMed] [Google Scholar]
- 27.Re DB, Nafia I, Melon C, Shimamoto K, Goff LK, Had-Aissouni L. Glutamate leakage from a compartmentalized intracellular metabolic pool and activation of the lipoxygenase pathway mediate oxidative astrocyte death by reversed glutamate transport. Glia. 2006;54(1):47–57. doi: 10.1002/glia.20353. [DOI] [PubMed] [Google Scholar]
- 28.Moller IM. Plant mitochondria and oxidative stress: Electron Transport, NADPH turnover, and metabolism of reactive oxygen species. Annu Rev Plant Physiol Plant Mol Biol. 2001;52:561–591. doi: 10.1146/annurev.arplant.52.1.561. [DOI] [PubMed] [Google Scholar]
- 29.Miller RR, Jr, Burum AL, Leithart ME, Hart JD. Hyperglycemia-induced changes in hepatic membrane fatty acid composition correlate with increased caspase-3 activities and reduced chick embryo viability. Comp Biochem Physiol, Part B: Biochem Mol Biol. 2005;141(3):323–330. doi: 10.1016/j.cbpc.2005.04.008. [DOI] [PubMed] [Google Scholar]
- 30.Gomes E, Papa L, Hao T, Rockwell P. The VEGFR2 and PKA pathways converge at MEK/ERK1/2 to promote survival in serum deprived neuronal cells. Mol Cell Biochem. 2007;305(1–2):179–190. doi: 10.1007/s11010-007-9542-2. [DOI] [PubMed] [Google Scholar]
- 31.Liu Y, Fiskum G, Schubert D. Generation of reactive oxygen species by the mitochondrial electron transport chain. J Neurochem. 2002;80(5):780–787. doi: 10.1046/j.0022-3042.2002.00744.x. [DOI] [PubMed] [Google Scholar]
- 32.Harvey AJ, Kind KL, Thompson JG. REDOX regulation of early embryo development. Reproduction. 2002;123:479–486. doi: 10.1530/rep.0.1230479. [DOI] [PubMed] [Google Scholar]