

SUMMARY
MicroRNA regulation clearly impacts animal development, but the extent to which development—with its resulting diversity of cellular contexts—impacts miRNA regulation has not been explored. Here, we compare cohorts of genes repressed by the same miRNAs in different cell lines and tissues, and find that target repertoires were largely unaffected, with secondary effects explaining most of the differential responses detected. Outliers resulting from differential direct targeting were often attributable to alternative 3'UTR isoform usage that modulated the presence of miRNA sites. More inclusive examination of alternative 3'UTR isoforms revealed that they influence ~10% of predicted targets when comparing any two cell types. Indeed, considering alternative 3'UTR isoform usage improved prediction of targeting efficacy significantly beyond the improvements observed when considering constitutive isoform usage. Thus, although miRNA targeting is remarkably consistent in different cell types, considering the 3'UTR landscape helps predict targeting efficacy and explain differential regulation that is observed.
INTRODUCTION
The control of gene output can be complex, with opportunities for regulation at each step of mRNA production, processing, localization, translation and turnover. A widespread type of post-transcriptional control is that mediated by microRNAs (miRNAs) (Bartel, 2009). By base-pairing with complementary sites in their targets, miRNAs direct the repression of mRNAs, primarily through mRNA destabilization (Baek et al., 2008; Guo et al., 2010; Hendrickson et al., 2009). With each family of miRNAs capable of targeting messages from hundreds of genes, and over half of the human transcriptome containing preferentially conserved miRNA sites (Friedman et al., 2009), miRNAs are expected to impact essentially every mammalian developmental process and human disease.
Central for understanding this pervasive mode of genetic control is understanding miRNA–target interactions. One factor affecting the efficacy of miRNA–target interactions is the miRNA site type. Site types are primarily classified based on the extent to which they match the 5' region of the miRNA. 6mer sites perfectly pair to only the miRNA seed (nucleotides 2–7 of the miRNA) and typically confer marginal repression, at best. Seed pairing can be augmented with an adenosine opposite miRNA nucleotide 1 or a Watson–Crick pair with miRNA nucleotide 8, giving a 7mer-A1 or 7mer-m8 site, respectively; sites augmented with both the adenosine and the match to nucleotide 8 are 8mer sites (Grimson et al., 2007; Lewis et al., 2005). On average, 8mer sites are more efficacious than 7mer-m8 sites, which are more efficacious than 7mer-A1 sites, with supplemental pairing to the 3' region of the miRNA marginally increasing efficacy of each site type (Grimson et al., 2007). Two other site types are effective but so rare that they together they are thought to constitute less than 1% of all targeting; these are 3'-compensatory sites (Bartel, 2009) and centered sites (Shin et al., 2010). Shifted-6mer sites and each of the more recently proposed site types (Betel et al., 2010; Chi et al., 2012; Helwak et al., 2013; Khorshid et al., 2013; Loeb et al., 2012; Majoros et al., 2013) are either not effective or less effective than 6mer sites (Friedman et al., 2009) (Agarwal & Bartel, in preparation).
Early target predictions considered only the number and type of sites to rank predictions, and thus had to rely on site conservation to refine the rankings (Bartel, 2009). However, the same site can be much more effective in the context of one mRNA than it is in the context of another; identifying and considering these context features surrounding the miRNA site can improve target predictions (Grimson et al., 2007; Gu et al., 2009; Kertesz et al., 2007; Nielsen et al., 2007). As part of the context model, three context features were originally used to improve the TargetScan algorithm: 1) the local AU content of the sequence surrounding the site (presumably a measure of occlusive secondary structure), 2) the distance between the site and the closest 3'UTR end, and 3) whether or not the site lies in the path of the ribosome (Grimson et al., 2007). With these features of UTR context in the model, effective sites could be predicted above the false positives without considering the evolutionary conservation of the site (Baek et al., 2008; Grimson et al., 2007). Additional improvements came with development of the context+ model, which incorporated two features of the miRNA seed region: 1) the predicted stability of matches to the seed region, which correlated with efficacy, and 2) the number of matches to the seed region within the 3'UTRs of the transcriptome, which inversely correlated with efficacy (Garcia et al., 2011).
Despite the advances of the past decade that have come from defining the site types and building models of miRNA targeting efficacy that consider 1) the influences of site type and number, 2) the 3'UTR context of the site and 3) certain miRNA properties, the accuracy of miRNA–target predictions still has substantial room for improvement. One consideration currently ignored in miRNA targeting models is the potential influence of different biological and cellular contexts. Although predictions for miRNAs or mRNAs that are not present in the cell can be easily disregarded, other influences of cellular context are undoubtedly exerting effects in ways that compromise prediction utility.
One way that cellular context can exert its effect is through differential expression of mRNA-binding proteins, which can either increase or decrease the efficacy of miRNA sites. For instance, binding of Pumilio increases miRNA-mediated repression in the 3'UTRs of the p27 and E2F3 mRNAs (Kedde et al., 2010; Miles et al., 2012), whereas Dnd1 binding occludes miRNA target sites to relieve miRNA-mediated repression of nanos and tdrd7 mRNAs (Kedde et al., 2007). These examples could represent just the tip of the iceberg, as the extent to which differential expression of such trans-factors affects miRNA targeting in different cell types has not been investigated across the transcriptome.
Another consideration largely ignored in miRNA target predictions is the impact of alternative 3'UTR isoforms, which are generated through alternative cleavage and polyadenylation (APA). For example, mRNAs with the same open reading frame (ORF) often have tandem UTR isoforms, in which APA at proximal or distal poly(A) sites generates shorter or longer 3'UTRs, respectively (Miyamoto et al., 1996; Tian et al., 2005). Regulatory elements, such as miRNA sites, in the commonly included (or “constant”) region are present in both short and long isoforms, but those in the alternatively included (or “variable”) region are present only in the long isoform, and thus a cell-type-specific shift in APA results in a corresponding shift in isoforms responding to the regulation (Ji et al., 2009; 2011; Mayr and Bartel, 2009; Sandberg et al., 2008; Ulitsky et al., 2012). Development of high-throughput poly(A)-site mapping techniques, such as 3P-seq (Jan et al., 2011), has allowed quantitative and precise detection of alternative 3'UTR usage within a sample as well as differences over the course of development (Derti et al., 2012; Hoque et al., 2013; Jan et al., 2011; Lianoglou et al., 2013; Shepard et al., 2011; Ulitsky et al., 2012) (Spies et al., 2013). Efforts to predict miRNA targets are only beginning to incorporate this information. For example, when predicting mammalian targets, the most recent version of TargetScan still considers only the longest annotated 3'UTR isoform of each gene. When predicting nematode and zebrafish targets, TargetScan predicts the targeting of each 3P-seq-annotated UTR isoform but does not consider the relative abundance of each isoform when ranking these predictions.
The studied examples of differential expression of RNA-binding proteins and differential usage of 3'UTR isoforms imply that these or perhaps other phenomena might broadly influence the impact of miRNAs, causing the targets of a miRNA to substantially differ in two different cellular contexts, even when only considering mRNAs expressed in both cell types. Genome-wide studies of transcription-factor binding show that cell type can influence transcriptional regulation (Cooper et al., 2007; Farnham, 2009), but global effects of cellular context on miRNA regulation or other forms of post-transcriptional regulation have not been reported. Understanding the frequency and magnitude of these effects is important for understanding the degree to which miRNA-regulation itself is regulated. Knowing the extent to which experimental observations from one cell type can be extrapolated to another also has practical value for placing miRNAs into gene-regulatory networks. For example, the heterologous reporter assay (in which the 3'UTR of a suspected target is appended to a reporter gene and tested for its response to the miRNA, with and without mutation of the putative miRNA-binding sites) is a workhorse for testing the plausibility of proposed miRNA–target interactions, but its utility would be diminished if the sites that mediate repression in one cell type do not reliably do so in other cell types.
To begin to explore the frequency and magnitude of cell-type–specific effects on miRNA-mediated repression, we introduced the same miRNAs into three different human cell lines and monitored mRNA changes by RNA-seq. We also analyzed the effects of miRNA loss in different mouse and zebrafish tissues and stages. Most predicted targets responded similarly in different cellular contexts, and for those that did differ, these differences often resulted from secondary effects, not direct differences in miRNA-mediated targeting. When direct differences in targeting were detected, these differences often resulted from alternative 3'UTR isoform usage. Experimental profiling of poly(A) sites showed that APA affects ~10% of predicted targets when comparing any pair of cell types. With this in mind, we incorporated 3'UTR isoform usage as a parameter in miRNA target prediction and found that it significantly improved performance.
RESULTS
Most miRNA–target interactions are not detectably affected by cell type
To determine the extent to which cell type influences miRNA targeting, we transfected two different miRNA duplexes (miR-124 and miR-155) into three different cell lines (HeLa, HEK293 and Huh7 cells) and monitored mRNA changes using mRNA-seq. These cell lines were chosen for two reasons: (1) they had large differences in their expression of endogenous miRNAs (Landgraf et al., 2007; Mayr and Bartel, 2009), and (2) they could be transfected at high efficiency. For each miRNA–cell-line combination we examined two biological replicates, comparing the effects of the miRNA transfection relative to those of the mock-treated controls. Each of these transfection datasets exhibited the expected global targeting effects, as determined by analysis of fold changes for site-containing mRNAs (Figure S1A) and by unbiased analysis using the Sylamer tool (Figure S1B) (van Dongen et al., 2008).
After the data were globally normalized to correct for general cell-type differences, as well as for experimental and technical biases, we investigated if the observed difference of log-fold changes between the cell-types was significant, given the variance between replicate experiments. To do so, an expected difference was estimated using a permutation test for each target mRNA (Tusher et al., 2001). Then, a delta value (Δ)—the difference between these observed and expected values—was calculated. This Δ value thus combines both the magnitude of the difference between the cell lines and variability associated with each measurement (Figure S1C), and so as it increases, the statistical confidence in differential regulation also increases. Importantly, for all pairs of cell lines that we investigated, on average, 1.1% (12) and 5.8% (57) of predicted targets (with a log2 change < −0.3 in either sample) were differentially repressed with a Δ ≥ 0.2 for miR-124 and miR-155, respectively (Figures 1A–F; Figure S1D; Table S1). In contrast, on average, 0.1% and 0.3% of genes with control sites were affected differentially by miR-124 and miR-155, respectively (Figure 1G–L). The lower fraction of significantly differential targets for miR-124 targeting is partly due to a higher variance between replicates observed with miR-124 targeting (Figure S1E). In some miR-124 comparisons, hardly any predicted targets were differentially repressed at these cutoffs. For example, when comparing the effects of miR-124 in HeLa and HEK293 cells, only four of 1169 co-expressed predicted targets (with log2 change < −0.3 in either sample) were significantly differentially repressed (FDR = 0.267, Figure 1A). In the miR-155 pairwise comparisons, more, but still only a minority, of predicted targets were differentially affected. For instance, when comparing effects of miR-155 in HeLa and HEK293 cells, 137 of the 991 co-expressed targets differentially regulated (Δ ≥ 0.2, FDR = 0.335, Figure 1D). Similar results were obtained when we examined the effect of miR-124 in IMR90 cells, a normal diploid fibroblast cell line (Figure S1F). Together, these data suggest that, although the repression of some targets differs between cell lines, the miRNA-mediated repression of most targets is not detectably affected by the cellular environment.
Figure 1. Most miRNA-target interactions are unaffected by cell type.

(A–F) Pairwise comparisons of mRNA changes after transfecting the same miRNA into different cell lines. Shown are changes for genes with at least one 7mer 3'UTR site for the indicated miRNA, plotting the results for genes expressed in both cell lines. The region corresponding to a log2 change > −0.3 is shaded (grey); n, number of genes outside the grey region. Genes significantly differentially repressed are highlighted (blue) and tallied (number in parentheses). In some cases, not all of the differentially repressed genes fit within the plots.
(G–L) As in A–F, but for control genes. For the miR-124 transfections, mRNA changes are plotted for genes with miR-155 sites (excluding any that contained sites to both miRNAs), and vice versa.
3'UTR isoforms in different cell types and tissues
Because APA can affect the inclusion of regulatory sites in the 3'UTR, we reasoned that some of the observed differential repression was due to differential use of alternative 3'UTRs. To identify these cases, 3P-seq was used to quantify poly(A)-site usage in the three human cell lines (HeLa, HEK293 and Huh7), as illustrated for LRRC1 (Figure 2A). The accuracy of 3P-seq for quantifying alternative isoforms, previously inferred by its high accuracy in quantifying mRNA levels (Spies et al., 2013; Ulitsky et al., 2012), was further confirmed by comparison to the results of 3'-seq (Lianoglou et al., 2013), which has been extensively validated with RNA blots (Figure S2A–D). Although human 3'UTRs are relatively well-annotated, our analysis improved these annotations: of the mRNAs with poly(A) sites supported by at least ten 3P tags, ~30% had major 3'UTR isoforms that were shorter than the RefSeq annotation, and ~10% had major isoforms that were longer (Table S2C). Moreover, similar to previous studies (Derti et al., 2012; Hoque et al., 2013; Smibert et al., 2012; Ulitsky et al., 2012), we found that in each cell type over half (51–63%) of the genes with 3P-seq-supported poly(A) sites had multiple tandem isoforms that were each supported by at least 1% of the tags (Figure S2E), and 10,701 (70.1%) mRNAs displayed APA in at least one cell type.
Figure 2. The 3'UTR landscape affects miRNA targeting.

(A) Different AIRs for miR-124 sites the LRCC1 gene in different cell types. Shown is the RefSeq annotation track of LRCC1 (dark blue), with the associated 3P tags from the three cell lines assayed (above) and the corresponding AIRs (below).
(B, C) Extent to which APA affects miRNA site inclusion. Shown are the number and percentage of sites for which AIRs for miR-124 (B) or miR-155 (C) change by at least 0.3 in each pairwise cell-type comparison. The arrows point to the cell line with the higher AIR, and the width is proportional to the number of sites with differential AIR.
(D–G) Relationship between AIR and miRNA-mediated repression. For each site type [8mer (D), 7mer-m8 (E), 7mer-A1 (F) and a representative pair of control sites (G)], predicted targets were binned by their AIR. For each bin, the mean fold-change mediated by either miR-124 or miR-155 for each transfection of the various cell lines (HEK293, HeLa and Huh7) is plotted. The red line is the least-squares best fit to the data (Pearson r2, F-test)..
To confirm that this isoform heterogeneity resembled that found in other vertebrates, we used our pipeline to analyze 3P-seq datasets from two mouse cell lines [mouse embryonic stem cells (mESCs) and NIH-3T3 cells; Tables S2D, F], and published datasets from zebrafish tissues (brain, ovary and testes) and developmental stages [2, 6, 24 and 72 hours post fertilization (hpf) and adult] (Ulitsky et al., 2012). As with human poly(A)-site usage, these datasets allowed further refinement of 3'UTR ends from those currently annotated in RefSeq (~30% and 40% in mouse and zebrafish, respectively, Tables S2G–I). Overall, the fraction of mRNAs with multiple tandem 3'UTR isoforms was similar when comparing different cell lines, tissues and vertebrate animals (Figure S2E–G).
Alternative cleavage and polyadenylation affects miRNA targeting
By quantitatively measuring poly(A) site usage, the 3P-seq datasets allow examination of how APA varies in different cellular contexts (Ulitsky et al., 2012). When comparing the four human cell lines, 1,708 (11.2%) of the mRNAs had different dominant 3'UTR ends (Figure S2H), and when comparing weighted 3'UTR lengths, each cell type had a unique 3'UTR length distribution (Figures S2I–K). Among the human cell lines examined, Huh7 cells tended to have the shortest 3'UTRs, and HEK293 cells, the longest. Moreover, although the percentage of genes with multiple UTR isoforms was relatively constant between cell types, the identities of these genes and the poly(A) sites used were more variable. Indeed, of the 7,563 mRNAs with multiple poly(A) sites in all four human cell lines, 51.2% had weighted 3'UTR lengths that changed by more than 100 nt (Figure S2L). As reported previously (Ulitsky et al., 2012), weighted 3'UTR length differences were especially apparent during zebrafish development and in two mouse cell lines (Figures S2M and N). Taken together, these results confirmed that many transcripts have alternative 3'UTR isoforms and that 3′ UTR lengths change across different vertebrate cell-types and developmental stages.
To determine the extent to which APA affects miRNA targeting, we developed a metric called the affected isoform ratio (AIR), which indicates for each miRNA target site the fraction of mRNA transcripts containing that site (Figure 2A). To calculate AIRs, we first estimated the fraction of each tandem isoform based on the fraction of 3P tags at its poly(A) site relative to all the tags that mapped to the poly(A) sites contained within that exon (Figure 2A). These isoform fractions were then used to compute the 3'UTR isoform ratio for different UTR regions, in which each constant region (present in all the tandem isoforms) had an isoform ratio of 1.0, whereas each variable region had an isoform ratio corresponding to the sum of the isoform fractions spanning that region (Figure 2A). For each miRNA site, the AIR was simply the isoform ratio at the region of the UTR containing the site. Consistent with Huh7 cells generally expressing shorter 3'UTR isoforms, of 3' UTR sites for miR-124, 154 and 191 had lower AIRs (AIR difference ≥ 0.3) in Huh7 cell lines than in HeLa and HEK293 cells, respectively, but only 67 and 41 sites had higher AIRs (Figure 2B). A similar result was observed with miR-155 sites (Figure 2C).
To compare how miRNA targeting efficacy was affected by APA within a cell type, genes with multiple 3'UTR isoforms were first partitioned by their site type; for genes containing multiple sites, the best site type was chosen (with 8mer > 7mer-m8 > 7mer-A1). Within each site-type partition, genes were binned by their AIRs, and the efficacies of sites within each bin were compared. For each of the three site types, mean repression correlated with AIR, such that sites with higher AIRs were more repressed than those with lower AIRs (Figures 2D–G). Indeed, genes with sites having an AIR less than 0.25 were barely repressed by the corresponding miRNA. Similar results were obtained with a large precompiled microarray dataset of miRNA/siRNA transfections (Garcia et al., 2011) (Figure S2O). When the analysis was repeated 100 times, each time with a different negative-control cohort, in which genes lacking any target sites (including 6mers) were selected and partitioned based on a randomly selected pseudo-site (e.g., Figure 2G), repression and AIR never significantly correlated.
Sites near the middle of long 3'UTRs mediate less repression than those at the ends (Grimson et al., 2007). The distance between the site and the nearest end of the 3'UTR (referred to as the “minimum distance”) is a feature incorporated into the model of site efficacy used by TargetScan to rank target predictions (Garcia et al., 2011; Grimson et al., 2007). Because this minimum-distance feature depends on the poly(A) site, we reasoned that APA might change this feature for some miRNA sites, with a corresponding effect on site efficacy. When examining transcripts with sites with minimum distances 25 nt shorter in HEK293 cells than in HeLa cells, more repression was observed in HEK293 cells than in HeLa cells (Figure S2Q); importantly, these differences were not attributable to differential target-site inclusion because the AIRs for these sites were unchanged (<0.01). Correspondingly, genes with minimum distances that were longer in HEK293 cells were more repressed in HeLa cells, whereas genes not predicted to be targets were unaffected (Figure S2Q). Together, these results indicate that APA, by shortening and lengthening 3'UTRs, affects both the inclusion and the efficacy of miRNA sites.
Incorporating poly(A)-site usage improves miRNA target prediction
With the insights gained on the effects of APA on miRNA targeting (Figure S3A), we developed a revised prediction model, called the `weighted context+' or `wContext+' model. This model produced a cell-type–specific score for each site by calculating its context+ score using TargetScan linear regression models for each of its context and miRNA features (Garcia et al., 2011) and then weighting this score by the AIR of the site in each cell type (Figure 3A). For each miRNA, the wContext+ scores of multiple sites were summed (disregarding positive scores) to generate the total wContext+ score for each gene, in which the scores with lower negative values indicated greater predicted repression. To assess the advantage of weighting the scores based on the AIRs and thereby considering the isoform heterogeneity of each cell type, we compared the performance of the wContext+ model with those of the current context+ model (Garcia et al., 2011) applied to a single 3'UTR isoform for each gene, choosing either (1) the longest isoform annotated by RefSeq, (2) the longest isoform determined by 3P-seq, or (3) the major 3'UTR isoform determined by 3P-seq. On average, the wContext+ model outperformed the previous model by ~50%, and although some of this improvement was attributable to more accurate identification of the major 3'UTR isoforms, most was attributable to utilizing AIRs (Figure 3B). The wContext+ model also displayed better sensitivity and specificity when evaluating area under the curve in receiver operating characteristic (ROC) plots (Figure S3B).
Figure 3. The weighted context+ model improves target prediction.

(A) Calculation of wContext+ scores. For each site, the context+ score, calculated using the TargetScan linear regression model, is weighted by a cell-type–specific AIR. For genes with multiple sites, the scores for each individual site are added to yield the total wContext+ score.
(B) Improved performance of the wContext+ model. Plotted are r2 values calculated from the correlation (Pearson r) between score and observed change in the indicated transfection dataset. For the previous model (context+), three different 3'UTR annotations were used: the RefSeq annotation (dark blue); the longest isoform, as determined by 3P-seq (light blue); the major isoform, as determined by 3P-seq (purple).
Alternative cleavage and polyadenylation is a major cause of differential miRNA targeting
We next examined the extent to which differential poly(A)-site usage caused differential miRNA targeting. Between any pair of the human cell lines, the AIRs of 7–10% of miR-124 sites and 7–12% of miR-155 sites changed by > 30% (Figures 2B and C). Similarly, 5–9% of predicted miR-124 targets and 5–10% of predicted miR155 targets had wContext+ scores differing by ≥ 0.1 (Figures S4A and B; Table S3). When we repeated this analysis in mouse (with predicted miR-155 and miR-223 sites in mESCs and NIH-3T3 cells) and for zebrafish (with predicted miR-430 sites across the four developmental stages), similar ranges were observed, indicating that in diverse vertebrate species APA affects ~10% of predicted miRNA target sites when comparing two cell types (Figures S4C and D).
Of the 126 predicted targets that were differentially repressed by miR-155, 11.1% had wContext+ scores with differences ≥ 0.03, a significant enrichment compared to that in non-differential miRNA targets (P = 0.004, hypergeometric test; Figure 4A). For example, the CHURC1 gene had one 8mer and two 7mer-m8 sites for miR-155, but these sites were in only the longer of its two major isoforms (Figure 4B). Because the longer isoform was more prevalent in HeLa cells, 66% of CHURC1 transcripts contained miR-155 target sites in HeLa cells, whereas only 3% contained the sites in HEK293 cells (Figure 4B). The consequently large difference in wContext+ scores explained why this gene was repressed more strongly in HeLa than HEK293 cells (Figure 4C). Reciprocally, the longer isoforms of the ATAD2B gene contained one 8mer and one 7mer-m8 site and was predominately expressed in HEK293 cells, whereas the short isoform that lacked these regulatory sites was expressed in HeLa cells (Figure 4D), and this gene was repressed more strongly in HEK293 cells than in HeLa cells (Figure 4E). Similar examples illustrating cases in which APA explained differential miRNA targeting were found in all pairs of cell types examined (Figure 4F–I and Figures S4E–Q).
Figure 4. Differential miRNA-mediated repression is often due to alternative 3'UTR isoform usage.

(A) Genes with differential AIRs are enriched in genes that are differentially repressed. As in Figure 1D, but highlighting genes with significantly different repression that also have wContext+ score differences ≥ 0.03 (orange).
(B) Higher AIR of CHURC1 miR-155 sites in HeLa compared to HEK293 cells. Otherwise, as in Figure 2A.
(C) Greater miR-155 repression of CHURC1 in HeLa cells. Plotted are the wContext+ and expression change for CHURC1 in HeLa (pink) and HEK293 (blue) cells.
(D, E) As in (B, C), except for ATAD2B, a gene with higher AIR and greater miR-155 repression in HEK293 cells.
(F) As in (A), except comparing changes mediated by miR-124 in HeLa and HEK293 cells.
(G) As in (C), except for ANTXR2, a gene with higher AIR and greater miR-124 repression in HeLa cells.
(H) As in (A), except comparing changes mediated by miR-124 in HEK293 and HeLa cells.
(I) As in (C), except for CLDN1, a gene with higher AIR and greater miR-124 repression in HeLa cells
(J) Direct measurements of miR-155-mediated repression of 3'UTR segments from nine genes initially classified as differentially regulated despite having similar AIRs. Renilla luciferase reporters followed by 3'UTR segments (with either wild-type or mutated miR-155 sites) from the indicated genes were transfected into either HeLa or HEK293 cells in the presence of the cognate (miR-155) or a non-cognate (miR-1) miRNA. Five genes were repressed more in HeLa cells in the genome-wide analyses (highlighted in pink), and four were repressed more in HEK293 cells (highlighted in blue). Plotted are the normalized repression values, with error bars representing the third largest and third smallest values. Significance was calculated with the Mann-Whitney U-test (*, P < 0.05, **, P < 0.01, *** P < 0.001).
APA, however, did not explain most differentially repressed predicted targets (with Δ > 0.3; Table S3; Figure 4). These mRNAs might have responded differently because other cell-type–specific factors, such as RNA-binding proteins, differentially modulated site efficacy in the two cell types. Alternatively, these mRNAs might have had similar direct response to the miRNA and only appeared to be differentially repressed because of differential secondary effects of transfecting the miRNA. For example, in one cell type, the miRNA might have repressed a transcriptional repressor, causing increased transcription of the predicted target. Indeed, we observed that for many of these cases, mRNAs were in fact up-regulated in one of the two cell lines (Figure S4P), supporting the idea that the differences were mediated by secondary effects rather than differential site efficacy. To distinguish between these possibilities, we used reporter assays to determine the extent to which the miRNA sites themselves mediated differential repression. For nine candidates, we placed either wild-type or mutated sites, embedded in ~500 nucleotides of the surrounding 3'UTR, downstream of Renilla luciferase and compared the repression mediated by miR-155 in HEK293 and HeLa cells. Although six were significantly repressed by miR-155 in both cell lines, only two (LPIN1 and LMBRD2) were significantly differentially repressed (Figure 4J; P = 0.0004 and 1.11 × 10⁻⁵, respectively, Mann-Whitney U-Test). Both were more repressed in HEK293 cells than in HeLa cells, consistent with the RNA-seq results. Although these two mRNAs are good candidates for APA-independent differential repression, the paucity of such candidates suggests that most instances of apparent differential repression are due to differential secondary effects rather than to modulations of miRNA targeting efficacy.
AIR correlates with site efficacy for targets of endogenous miRNAs
To extend our results to the effects of miRNAs in their endogenous contexts, we profiled both mRNA changes (by microarray) and poly(A) site usage (by 3P-seq) in six different tissues [heart, kidney, liver, lung, muscle and white adipose tissue (WAT)] from wild-type and miR-22 knockout mice (Table S4) (Gurha et al., 2012). As expected, predicted miR-22 targets were generally up-regulated in the knock-out tissues (Figure S5A). Although modest, this effect was significant in five of the six tissues (muscle, heart, kidney, liver and WAT) and most pronounced for mRNAs with 8mer sites (Figure S5A).
Using the 3P-seq datasets, we generated tissue-specific 3'UTR annotations. Interestingly, lung tissue had 1.5–2 times more poly(A) sites than did the other tissues and mouse cell lines (NIH-3T3 and mESCs), perhaps because of the more heterogeneous nature of this tissue. As observed with exogenously delivered miRNAs, miRNA-mediated repression significantly correlated with the AIR for 8mer and 7mer-m8 sites but not for negative-control sites (Figure 5A; P = 0.00056, 0.0012, and 0.880, respectively). An insignificant correlation for 7mer-A1 sites (P = 0.487) was attributed to the weak de-repression observed overall in the miR-22 datasets, which made it difficult for a signal from this weaker site type to appear.
Figure 5. Alternative 3'UTR isoform usage affects targeting by endogenous miRNAs.
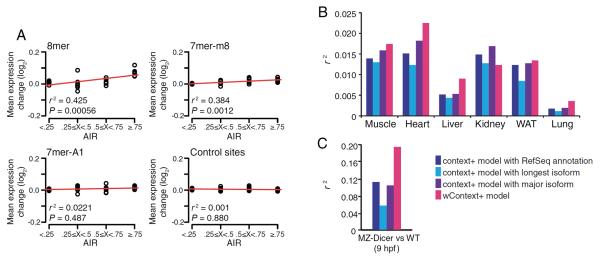
(A) Relationship between AIR and endogenous repression by miR-22. As in Figure 2D–G, but comparing mRNA changes in mouse tissues (muscle, heart, liver, kidney, white adipose tissue (WAT) and lung) with and without miR-22.
(B) Improved performance of the wContext+ model for predicting endogenous miR-22 targeting in mice. Otherwise, as in Figure 3B.
(C) Improved performance of the wContext+ model for predicting endogenous miR-430 targeting in zebrafish embryos. As in Figure 3B, except analyzing predicted miR-430 targets in wild-type embryos and embryos that lack miR-430 (MZ-Dicer) at 9 hours post fertilization (hpf).
With these tissue-specific 3'UTR annotations in mouse and published ones from zebrafish, we developed and evaluated wContext+ models for miR-22 targeting in mice and miR-430 targeting in zebrafish embryos. Although the overall repression differed in magnitude from that observed for the exogenous miRNAs in human cells, with the magnitude of endogenous miR-22 repression being much lower and that of endogenous miR-430 being much higher, the results resembled those observed for targeting by exogenous miRNAs, with the wContext+ model outperforming the context+ model for all tissues except the kidney (Figure 5B). The greatest difference was observed in the zebrafish embryo, where the wContext+ model outperformed the context+ model by more than 70% (Figure 5C, r2 = 0.194 and 0.112, respectively). As in human cell lines, some of this improvement was attributable to more accurate identification of the major 3'UTR isoforms, but most was attributable to considering the AIRs, which capture the heterogeneity of the 3'UTR landscape.
Alternative cleavage and polyadenylation causes differential repression by endogenous miRNAs
To determine the extent to which repression by miRNAs in their endogenous contexts varies between different tissues, we applied the Δ-value score to the miR-22 datasets, focusing on the five tissues with significant repression. Although fold-change signals were more variable and weaker than those observed in the human cell lines, as judged by a higher Δ-value cut-off, a similar fraction of predicted targets showed differential repression in any pairwise comparison (~7.7%, on average; Figure S5B–F and Table S5). For instance, in comparing repression mediated by miR-22 in liver and heart cells (Figure S5C), 74 of 545 genes with 7mers or 8mers in their 3'UTRs were differentially repressed (13.6%).
For each pair of cell types, APA affected a significant fraction of differentially repressed predicted targets (Figure S5G–K, P = 1.0 × 10⁻¹⁶ to 0.027). For instance, when comparing muscle and heart cells, APA explained 12.3% of differentially repressed targets (Figure S5G, P = 0.027). Mycbp, an example of such a target, was effectively targeted in muscle cells, where its longer isoform was more expressed, but not in the heart, where a shorter isoform predominated (Figure S5G). Reciprocally, Ctnnal1 was more effectively targeted in heart cells, where its longer isoform was more expressed, than in the muscle (Figure S5G). Thus, as with exogenously delivered miRNAs, APA explained some of the observed differential repression.
3'UTR heterogeneity measured in one cell type improves the targeting model for other cell types
Despite clear examples of cell-type–specific 3'UTR heterogeneity (Figures 2 and 4), AIRs were often similar in diverse cells or tissues, suggesting that for cells in which AIRs cannot be calculated (due to the lack of 3P-seq data), AIRs from other cell types of the same species might still improve the targeting model. To test this idea, we evaluated wContext+ models that were based on non-cognate human and mouse cell types with expression changes by miRNAs observed in the cognate cells. Importantly, wContext+ models based on the other cell types still outperformed the previous model (Figure 6A and B), presumably because the advantage of considering constitutive isoform ratios more than offset any disadvantage of training on non-cognate alternative ratios.
Figure 6. Considering isoform ratios improves the model of miRNA targeting in non-cognate cell types.

(A) The performance of non-cell-type–specific wContext+ models for exogenous miRNAs. A comparison of performance of the original context+ model (dark blue), the cell-type–specific wContext+ model (pink) and the wContext+ model based on 3P-seq from other cell types (grey; error bars, standard deviation). Otherwise, as in Figure 3B.
(B) As in (A), but for endogenous targeting by murine miR-22.
(C) Non-cell-type–specific wContext+ model improves prediction of endogenous targeting mediated by miR-223 in neutrophils and miR-155 in B and Th1 cells. Otherwise, as in (A).
We then developed a murine wContext+ model, using AIRs calculated from 3P-seq analysis of mESCs and NIH-3T3 cells, and evaluated this model using data reporting mRNA changes after deleting either miR-223 or miR-155 (Guo et al., 2010; Johnnidis et al., 2008; Rodriguez et al., 2007). As observed for cognate cells, AIR and targeting efficacy were correlated, such that sites with higher AIRs in mESC/3T3 cells were more de-repressed in the knockout datasets (data not shown). Moreover, despite being based on non-cognate AIRs from mESCs and NIH-3T3 cells, the wContext+ model outperformed context+ models for miR-155 and miR-223 targeting in different cell types (Figure 6C). These results extended our conclusions to additional instances of endogenous miRNA targeting. More importantly, they extended the practical utility of considering isoform heterogeneity, showing that by exploiting similarities of isoform ratios between different cell types this approach can improve predictions of targeting efficacy even in cell types for which detailed information on isoform heterogeneity have not yet been acquired (which is the vast majority of cell types).
This being said, wContext+ models performed best when tested on the cell type for which the isoform data had been acquired (Figure 6A and B), presumably because extrapolation of isoform information from one cell type to another fails to capture key instances in which differential APA causes cell-type–specific targeting. Indeed, when we repeated this comparison, but this time excluding all genes initially classified as differential targets, the cognate model still outperformed that based on other cell types (Figure S6). Thus, differential APA broadly underlies cell-type–specific targeting, affecting even those genes that were not identified in our initial analysis as being differentially regulated because the differences did not exceed our threshold for statistical significance.
miRNA targeting can affect the 3'UTR landscape
Having found that alternative isoform usage influenced miRNA targeting, we tested whether the reciprocal relationship could also be detected: does miRNA-mediated repression influence isoform usage? To examine the effects of miR-22 on the 3'UTR landscape, we compared 3P-seq datasets generated from wild-type and miR-22Δ mice for the five tissues in which significant miR-22 repression was observed (heart, kidney, liver, muscle and WAT). For all of these tissues, predicted targets with sites in the variable region had longer weighted 3'UTRs in the miR-22Δ mice. This lengthening was significant in comparison with control sites (Figure 7; P = 0.0001 to 0.0096), consistent with a model whereby the longer isoform(s) are specifically targeted and repressed in wild-type, but not mutant, cells. We obtained similar results when using 3P tags to quantify the preferential targeting of the longer isoform of genes containing a site in their variable region (Figure S7A and B).
Figure 7. Repression by miR-22 shapes the 3'UTR landscape.

(A–E) Influence of miR-22 targeting on 3'UTR isoform usage. Weighted 3'UTR lengths were determined using 3P-seq data from heart (A), liver (B), muscle (C), kidney (D) and WAT (E). Plotted are the cumulative distributions of the differences in lengths (subtracting that of the wild-type tissue from that of the miR-22Δ tissue) for genes with control sites in the variable region (grey) and those with miR-22 sites in the variable region (red). Significance was determined using the Kolmogorov-Smirnov test.
We also examined the effects of miR-430 in zebrafish embryos, which robustly represses its targets during the maternal-to-zygotic transition (Giraldez et al., 2006). Similar to that observed with murine miR-22, the 3'UTR landscape was shaped by miR-430 (Figure S7C–E). Consistent with a model in which isoform usage has already been shaped by miR-430 repression by 6 hpf, wContext+ scores calculated with 2-hpf 3P-seq data were more predictive of miRNA-dependent expression changes than those calculated with 6-hpf 3P-seq data (Figure S7F). Together, these results demonstrate that repression by miRNAs in the cytoplasm helps shape the relative expression of UTR isoforms and highlights the interplay between these two processes.
DISCUSSION
Differential expression of miRNAs and their mRNA targets clearly provides an important mechanism to influence the target repertoire of the miRNAs. Less clear has been the extent to which different cellular contexts additionally influence the targeting of co-expressed mRNAs by co-expressed miRNAs. For both endogenously and exogenously expressed miRNAs, we found relatively few site-containing, co-expressed genes with detectable cell-type–specific differences in their responses. When identifying a target as responding differently in two cellular contexts, we considered the variance as well as the magnitude of the difference in repression. One implication of this approach is that as the number or accuracy of those measurements increases, the lowered experimental uncertainty will enable additional differential targets to be identified. However, our result of an overall uniformity of target repression will not change, as most magnitudes of the newly detected differences will be smaller than those currently detected.
For those targets that responded differentially, one important mechanistic explanation is differential 3'UTR isoform usage that influences either the inclusion of sites or their placement within more or less favorable contexts. Site-containing genes that were affected by differential 3'UTR isoform usage were significantly enriched in the differentially repressed set. Furthermore, differential isoform usage presumably affects many additional genes that have differences too modest to be confidently identified in our initial analysis of differentially expressed genes. Indeed, when comparing 3'UTR isoforms observed in any two cell types, approximately 10% of predicted targets are likely to be affected by differential usage. Moreover, cognate wContext+ models outperformed models that considered constitutive isoform ratios but not the cognate cell-type–specific ratios, which demonstrated the importance of cell-type–specific APA events on miRNA targeting, even for targets that were not originally identified as responding differentially (Figure S6).
More generally, despite known inter- and intra-cellular heterogeneity in the 3'UTR landscape and the corresponding effects on regulatory site inclusion (Derti et al., 2012; Hoque et al., 2013; Mayr and Bartel, 2009; Sandberg et al., 2008; Smibert et al., 2012; Ulitsky et al., 2012), miRNA–target prediction has, until this study, largely ignored the effects of alternative isoform usage. With transcriptome-wide cell-type–specific 3'UTR annotation becoming more common, wContext+ models might eventually be generated for each tissue or cell line of interest. In the meantime, for the many cell types for which such annotations are not yet available, predicting targets using isoform data from a non-cognate cell types still improves performance over previous algorithms because it enables consideration of constitutive isoform ratios. Accordingly, the next version of TargetScan will implement a non-cell-type–specific wContext+ model for human, mouse, and fish predictions.
Studies to understand the mechanisms underlying the definition of the 3'UTR landscape have focused primarily on nuclear events—i.e., cleavage and polyadenylation—since these are the prime contributors in determining 3'UTR isoform usage (Berg et al., 2012; Bhattacharjee and Bag, 2012; Lee et al., 2007). Nevertheless, we show that cytoplasmic events also shape this landscape by differentially modulating the stability of short and long isoforms. Repression mediated by miR-22 had statistically significant effects on the 3'UTR landscape in somatic tissues, but the effect of miRNA targeting was most apparent in zebrafish embryos, where targeting by miR-430 is especially robust. Perhaps the interplay between miRNA targeting and 3'UTR isoform usage has greatest biological impact during tightly regulated spatio-temporal processes, such as early embryonic development.
The other mechanisms that might account for cell-type–specific effects of the miRNA can be grouped into two categories, those involving actual differences in targeting itself and those mediated through secondary effects of introducing the miRNA. To distinguish between these two possibilities, we used luciferase assays to isolate miRNA-mediated repression from secondary effects, focusing on nine predicted targets that responded differently to the miRNA despite uniform AIRs in the two cell types. Only two of the nine retained differential targeting in the luciferase assay, suggesting that most differential effects not explained by alternative isoform ratios were the result of secondary effects. These two genes, LPIN1 and LMBRD2, are interesting candidates for future work in understanding, at the molecular level, how differences in cellular context mediate differences in miRNA–target interactions. Nonetheless, our observation of so few instances in which differential targeting explained differential effects suggests that miRNA targeting is remarkably uniform between cell types, and that a miRNA–target interaction identified in one cellular context will generally hold in another contexts in which the target sites are present (i.e., have a high AIR) and the miRNA is expressed at a level sufficient to guide repression.
Perhaps some miRNAs have target repertoires more substantially affected by different cellular contexts, but we were unable to identify any in our study, although we examined exogenously and endogenously expressed miRNAs in a variety of tissues in three different vertebrates. Indeed, in light of our results, the initial example of differential targeting—that of Dnd1 modulating miR-430 repression (Kedde et al., 2010)—is now all the more striking as it appears to represent the exception rather than the rule. Perhaps cellular contexts affect other types of post-transcriptional pathways to a greater extent. Are other regulatory programs (such as that mediated by AU-rich elements) primarily modulated by APA, or are these primarily influenced by the expression of other 3'UTR-binding proteins? These remain important and unanswered questions for our understanding—and prediction—of post-transcriptional regulation.
MATERIALS AND METHODS
Cell culture
293 (ATCC), HeLa (ATCC) and Huh7 (Healt Science Research Resource Bank) cells were cultured as recommended by the manufacturer, in DMEM supplemented with 10% fetal bovine serum (Clontech) and penicillin/streptomycin.
Plasmids
Plasmids were constructed as described (Supplemental Information).
miRNA transfections
Cells were transfected with Lipofectamine 2000 (Invitrogen) and 100 nM miRNA duplex or pUC19, as recommended by the manufacturer. After 24 hours, cells were harvested, and RNA was extracted using TRI-reagent (Life Technologies).
RNA-Seq library preparation
After RNA isolation, poly(A)+ RNA was selected using oligo(dT) beads (Invitrogen). Strand-specific RNA-seq libraries were prepared as previously described (Guo et al., 2010) or using a dUTP-based approach (Bioo Scientific), according the manufacturer's directions.
3P-seq sample preparation
RNA from wild-type and miR-22Δ (Gurha et al., 2012) mouse tissues was isolated by adding a steel bead and 1 mL TRI Reagent to tissues and then vortexing for two minutes in a TissueLyser II (Qiagen) at 30 Hz, twice. The homogenate was centrifuged for 8 min at 12,000g, and the supernatant was purified according to manufacturer's protocol with an additional phenol/chloroform extraction after phase separation. 3P-seq libraries were prepared from 75 μg isolated RNA (mouse tissues, mESC, NIH3T3, HeLa, HEK293, Huh7, IMR90 cells) as described previously (Jan et al., 2011) with modifications (see Supplemental Information).
Luciferase assays
HEK293 and HeLa cells were plated in 24-well plates 24 hours prior to transfection. Cells were transfected using Lipofectamine 2000 and Opti-Mem with 100 ng Renilla luciferase reporter plasmid and 20 ng firefly luciferase control reporter plasmid pIS0 (Grimson et al., 2007) per well. Cells were harvested after 24 hours. Luciferase activities were measured using dual-luciferase assays, as described by the manufacturer (Promega). Three or four biological replicates, each with three technical replicates (i.e. three different wells transfected on the same day), were performed. Renilla activity was first normalized to firefly activity to control for transfection efficiency. As described previously (Grimson et al., 2007), repression of the reporter with wild-types sites was then additionally normalized to that of a reporter in which the sites were mutated. Fold-repression was calculated relative to that of the non-cognate miRNA.
Mice
The mice harboring the null miR-22 mutant allele were described previously (Gurha et al., 2012). All animal procedures were approved by the Baylor College of Medicine Institutional Animal Care and Use Committee (Animal Protocol 4930). Microarrays were carried out using Illumina Mouse WG-6 v1.1 Whole-Genome Expression BeadChips on 9-week-old miR-22 null and wild-type mice as described previously (Gurha et al. 2012).
Accession numbers
The NCBI GEO accession number for the RNA-seq and 3P-seq data sets is GSE52531. The NCBI GEO accession number for the microarray data from wild-type and miR-155 knockout B cells is GSE52940. Transcript profiling by microarray for wild-type and miR-22 knockout mouse tissues is deposited in EBI ArrayExpress as E-MTAB-2038.
Supplementary Material
HIGHLIGHTS
Cellular context does not detectably affect the majority of miRNA targets;
Differential 3'UTR isoforms explain cell-type–specific targeting that is observed;
Considering the 3'UTR landscape improves prediction of targeting efficacy;
miRNA-mediated repression shapes the 3'UTR landscape.
ACKNOWLEDGEMENTS
We thank the WI genome technology core for sequencing, and members of the Bartel and Nam labs for helpful comments and discussions. We also thank C. Shin and D. Baek for providing B cell microarray data. This work was supported by the KRIBB Research Initiative Program and the Basic Science Research Program through N.R.F., funded by the Ministry of Science, ICT & Future Planning, awarded to J.W.N. (NRF-2013R1A1A1010185), grants from the NIH to D.P.B. and O.S.R. (R01 GM067031 and K99 GM102319), and an NSF Graduate Research Fellowship to V.A. DPB is an investigator of the Howard Hughes Medical Institute.
Footnotes
Publisher's Disclaimer: This is a PDF file of an unedited manuscript that has been accepted for publication. As a service to our customers we are providing this early version of the manuscript. The manuscript will undergo copyediting, typesetting, and review of the resulting proof before it is published in its final citable form. Please note that during the production process errors may be discovered which could affect the content, and all legal disclaimers that apply to the journal pertain.
REFERENCES
- Baek D, Villén J, Shin C, Camargo FD, Gygi SP, Bartel DP. The impact of microRNAs on protein output. Nature. 2008;455:64–71. doi: 10.1038/nature07242. [DOI] [PMC free article] [PubMed] [Google Scholar]
- Bartel DP. MicroRNAs: target recognition and regulatory functions. Cell. 2009;136:215–233. doi: 10.1016/j.cell.2009.01.002. [DOI] [PMC free article] [PubMed] [Google Scholar]
- Berg MG, Singh LN, Younis I, Liu Q, Pinto AM, Kaida D, Zhang Z, Cho S, Sherrill-Mix S, Wan L, et al. U1 snRNP determines mRNA length and regulates isoform expression. Cell. 2012;150:53–64. doi: 10.1016/j.cell.2012.05.029. [DOI] [PMC free article] [PubMed] [Google Scholar]
- Betel D, Koppal A, Agius P, Sander C, Leslie C. Comprehensive modeling of microRNA targets predicts functional non-conserved and non-canonical sites. Genome Biol. 2010;11:R90. doi: 10.1186/gb-2010-11-8-r90. [DOI] [PMC free article] [PubMed] [Google Scholar]
- Bhattacharjee RB, Bag J. Depletion of nuclear poly(A) binding protein PABPN1 produces a compensatory response by cytoplasmic PABP4 and PABP5 in cultured human cells. PLoS ONE. 2012;7:e53036. doi: 10.1371/journal.pone.0053036. [DOI] [PMC free article] [PubMed] [Google Scholar]
- Chi SW, Hannon GJ, Darnell RB. An alternative mode of microRNA target recognition. Nat. Struct. Mol. Biol. 2012;19:321–327. doi: 10.1038/nsmb.2230. [DOI] [PMC free article] [PubMed] [Google Scholar]
- Cooper SJ, Trinklein ND, Nguyen L, Myers RM. Serum response factor binding sites differ in three human cell types. Genome Res. 2007;17:136–144. doi: 10.1101/gr.5875007. [DOI] [PMC free article] [PubMed] [Google Scholar]
- Derti A, Garrett-Engele P, Macisaac KD, Stevens RC, Sriram S, Chen R, Rohl CA, Johnson JM, Babak T. A quantitative atlas of polyadenylation in five mammals. Genome Res. 2012;22:1173–1183. doi: 10.1101/gr.132563.111. [DOI] [PMC free article] [PubMed] [Google Scholar]
- Farnham PJ. Insights from genomic profiling of transcription factors. Nat. Rev. Genet. 2009;10:605–616. doi: 10.1038/nrg2636. [DOI] [PMC free article] [PubMed] [Google Scholar]
- Friedman RC, Farh KK-H, Burge CB, Bartel DP. Most mammalian mRNAs are conserved targets of microRNAs. Genome Res. 2009;19:92–105. doi: 10.1101/gr.082701.108. [DOI] [PMC free article] [PubMed] [Google Scholar]
- Garcia DM, Baek D, Shin C, Bell GW, Grimson A, Bartel DP. Weak seed-pairing stability and high target-site abundance decrease the proficiency of lsy-6 and other microRNAs. Nat. Struct. Mol. Biol. 2011;18:1139–1146. doi: 10.1038/nsmb.2115. [DOI] [PMC free article] [PubMed] [Google Scholar]
- Giraldez AJ, Mishima Y, Rihel J, Grocock RJ, van Dongen S, Inoue K, Enright AJ, Schier AF. Zebrafish MiR-430 promotes deadenylation and clearance of maternal mRNAs. Science. 2006;312:75–79. doi: 10.1126/science.1122689. [DOI] [PubMed] [Google Scholar]
- Grimson A, Farh KK-H, Johnston WK, Garrett-Engele P, Lim LP, Bartel DP. MicroRNA targeting specificity in mammals: determinants beyond seed pairing. Mol. Cell. 2007;27:91–105. doi: 10.1016/j.molcel.2007.06.017. [DOI] [PMC free article] [PubMed] [Google Scholar]
- Gu S, Jin L, Zhang F, Sarnow P, Kay MA. Biological basis for restriction of microRNA targets to the 3' untranslated region in mammalian mRNAs. Nat. Struct. Mol. Biol. 2009;16:144–150. doi: 10.1038/nsmb.1552. [DOI] [PMC free article] [PubMed] [Google Scholar]
- Guo H, Ingolia NT, Weissman JS, Bartel DP. Mammalian microRNAs predominantly act to decrease target mRNA levels. Nature. 2010;466:835–840. doi: 10.1038/nature09267. [DOI] [PMC free article] [PubMed] [Google Scholar]
- Gurha P, Abreu-Goodger C, Wang T, Ramirez MO, Drumond AL, van Dongen S, Chen Y, Bartonicek N, Enright AJ, Lee B, et al. Targeted deletion of microRNA-22 promotes stress-induced cardiac dilation and contractile dysfunction. Circulation. 2012;125:2751–2761. doi: 10.1161/CIRCULATIONAHA.111.044354. [DOI] [PMC free article] [PubMed] [Google Scholar]
- Helwak A, Kudla G, Dudnakova T, Tollervey D. Mapping the human miRNA interactome by CLASH reveals frequent noncanonical binding. Cell. 2013;153:654–665. doi: 10.1016/j.cell.2013.03.043. [DOI] [PMC free article] [PubMed] [Google Scholar]
- Hendrickson DG, Hogan DJ, McCullough HL, Myers JW, Herschlag D, Ferrell JE, Brown PO. Concordant regulation of translation and mRNA abundance for hundreds of targets of a human microRNA. PLoS Biol. 2009;7:e1000238. doi: 10.1371/journal.pbio.1000238. [DOI] [PMC free article] [PubMed] [Google Scholar]
- Hoque M, Ji Z, Zheng D, Luo W, Li W, You B, Park JY, Yehia G, Tian B. Analysis of alternative cleavage and polyadenylation by 3' region extraction and deep sequencing. Nat Meth. 2013;10:133–139. doi: 10.1038/nmeth.2288. [DOI] [PMC free article] [PubMed] [Google Scholar]
- Jan CH, Friedman RC, Ruby JG, Bartel DP. Formation, regulation and evolution of Caenorhabditis elegans 3'UTRs. Nature. 2011;469:97–101. doi: 10.1038/nature09616. [DOI] [PMC free article] [PubMed] [Google Scholar]
- Ji Z, Lee JY, Pan Z, Jiang B, Tian B. Progressive lengthening of 3' untranslated regions of mRNAs by alternative polyadenylation during mouse embryonic development. Proc. Natl. Acad. Sci. U.S.a. 2009;106:7028–7033. doi: 10.1073/pnas.0900028106. [DOI] [PMC free article] [PubMed] [Google Scholar]
- Ji Z, Luo W, Li W, Hoque M, Pan Z, Zhao Y, Tian B. Transcriptional activity regulates alternative cleavage and polyadenylation. Mol. Syst. Biol. 2011;7:534. doi: 10.1038/msb.2011.69. [DOI] [PMC free article] [PubMed] [Google Scholar]
- Johnnidis JB, Harris MH, Wheeler RT, Stehling-Sun S, Lam MH, Kirak O, Brummelkamp TR, Fleming MD, Camargo FD. Regulation of progenitor cell proliferation and granulocyte function by microRNA-223. Nature. 2008;451:1125–1129. doi: 10.1038/nature06607. [DOI] [PubMed] [Google Scholar]
- Kedde M, Strasser MJ, Boldajipour B, Oude Vrielink JAF, Slanchev K, le Sage C, Nagel R, Voorhoeve PM, van Duijse J, Ørom UA, et al. RNA-binding protein Dnd1 inhibits microRNA access to target mRNA. Cell. 2007;131:1273–1286. doi: 10.1016/j.cell.2007.11.034. [DOI] [PubMed] [Google Scholar]
- Kedde M, van Kouwenhove M, Zwart W, Oude Vrielink JAF, Elkon R, Agami R. A Pumilio-induced RNA structure switch in p27-3' UTR controls miR-221 and miR-222 accessibility. Nat. Cell Biol. 2010;12:1014–1020. doi: 10.1038/ncb2105. [DOI] [PubMed] [Google Scholar]
- Kertesz M, Iovino N, Unnerstall U, Gaul U, Segal E. The role of site accessibility in microRNA target recognition. Nat. Genet. 2007;39:1278–1284. doi: 10.1038/ng2135. [DOI] [PubMed] [Google Scholar]
- Khorshid M, Hausser J, Zavolan M, van Nimwegen E. A biophysical miRNA-mRNA interaction model infers canonical and noncanonical targets. Nat Meth. 2013;10:253–255. doi: 10.1038/nmeth.2341. [DOI] [PubMed] [Google Scholar]
- Landgraf P, Rusu M, Sheridan R, Sewer A, Iovino N, Aravin A, Pfeffer S, Rice A, Kamphorst AO, Landthaler M, et al. A mammalian microRNA expression atlas based on small RNA library sequencing. Cell. 2007;129:1401–1414. doi: 10.1016/j.cell.2007.04.040. [DOI] [PMC free article] [PubMed] [Google Scholar]
- Lee JY, Yeh I, Park JY, Tian B. PolyA_DB 2: mRNA polyadenylation sites in vertebrate genes. Nucleic Acids Res. 2007;35:D165–D168. doi: 10.1093/nar/gkl870. [DOI] [PMC free article] [PubMed] [Google Scholar]
- Lewis BP, Burge CB, Bartel DP. Conserved seed pairing, often flanked by adenosines, indicates that thousands of human genes are microRNA targets. Cell. 2005;120:15–20. doi: 10.1016/j.cell.2004.12.035. [DOI] [PubMed] [Google Scholar]
- Lianoglou S, Garg V, Yang JL, Leslie CS, Mayr C. Ubiquitously transcribed genes use alternative polyadenylation to achieve tissue-specific expression. Genes Dev. 2013;27:2380–2396. doi: 10.1101/gad.229328.113. [DOI] [PMC free article] [PubMed] [Google Scholar]
- Loeb GB, Khan AA, Canner D, Hiatt JB, Shendure J, Darnell RB, Leslie CS, Rudensky AY. Transcriptome-wide miR-155 binding map reveals widespread noncanonical microRNA targeting. Mol. Cell. 2012;48:760–770. doi: 10.1016/j.molcel.2012.10.002. [DOI] [PMC free article] [PubMed] [Google Scholar]
- Majoros WH, Lekprasert P, Mukherjee N, Skalsky RL, Corcoran DL, Cullen BR, Ohler U. MicroRNA target site identification by integrating sequence and binding information. Nat Meth. 2013 doi: 10.1038/nmeth.2489. [DOI] [PMC free article] [PubMed] [Google Scholar]
- Mayr C, Bartel DP. Widespread shortening of 3'UTRs by alternative cleavage and polyadenylation activates oncogenes in cancer cells. Cell. 2009;138:673–684. doi: 10.1016/j.cell.2009.06.016. [DOI] [PMC free article] [PubMed] [Google Scholar]
- Miles WO, Tschöp K, Herr A, Ji J-Y, Dyson NJ. Pumilio facilitates miRNA regulation of the E2F3 oncogene. Genes Dev. 2012;26:356–368. doi: 10.1101/gad.182568.111. [DOI] [PMC free article] [PubMed] [Google Scholar]
- Miyamoto S, Chiorini JA, Urcelay E, Safer B. Regulation of gene expression for translation initiation factor eIF-2 alpha: importance of the 3' untranslated region. Biochem. J. 1996;315(Pt 3):791–798. doi: 10.1042/bj3150791. [DOI] [PMC free article] [PubMed] [Google Scholar]
- Nielsen CB, Shomron N, Sandberg R, Hornstein E, Kitzman J, Burge CB. Determinants of targeting by endogenous and exogenous microRNAs and siRNAs. Rna. 2007;13:1894–1910. doi: 10.1261/rna.768207. [DOI] [PMC free article] [PubMed] [Google Scholar]
- Rodriguez A, Vigorito E, Clare S, Warren MV, Couttet P, Soond DR, van Dongen S, Grocock RJ, Das PP, Miska EA, et al. Requirement of bic/microRNA-155 for normal immune function. Science. 2007;316:608–611. doi: 10.1126/science.1139253. [DOI] [PMC free article] [PubMed] [Google Scholar]
- Sandberg R, Neilson JR, Sarma A, Sharp PA, Burge CB. Proliferating cells express mRNAs with shortened 3' untranslated regions and fewer microRNA target sites. Science. 2008;320:1643–1647. doi: 10.1126/science.1155390. [DOI] [PMC free article] [PubMed] [Google Scholar]
- Shepard PJ, Choi E-A, Lu J, Flanagan LA, Hertel KJ, Shi Y. Complex and dynamic landscape of RNA polyadenylation revealed by PAS-Seq. Rna. 2011;17:761–772. doi: 10.1261/rna.2581711. [DOI] [PMC free article] [PubMed] [Google Scholar]
- Shin C, Nam J-W, Farh KK-H, Chiang HR, Shkumatava A, Bartel DP. Expanding the microRNA targeting code: functional sites with centered pairing. Mol. Cell. 2010;38:789–802. doi: 10.1016/j.molcel.2010.06.005. [DOI] [PMC free article] [PubMed] [Google Scholar]
- Smibert P, Miura P, Westholm JO, Shenker S, May G, Duff MO, Zhang D, Eads BD, Carlson J, Brown JB, et al. Global patterns of tissue-specific alternative polyadenylation in Drosophila. Cell Rep. 2012;1:277–289. doi: 10.1016/j.celrep.2012.01.001. [DOI] [PMC free article] [PubMed] [Google Scholar]
- Spies N, Burge CB, Bartel DP. 3' UTR-isoform choice has limited influence on the stability and translational efficiency of most mRNAs in mouse fibroblasts. Genome Res. 2013;23:2078–2090. doi: 10.1101/gr.156919.113. [DOI] [PMC free article] [PubMed] [Google Scholar]
- Tian B, Hu J, Zhang H, Lutz CS. A large-scale analysis of mRNA polyadenylation of human and mouse genes. Nucleic Acids Res. 2005;33:201–212. doi: 10.1093/nar/gki158. [DOI] [PMC free article] [PubMed] [Google Scholar]
- Tusher VG, Tibshirani R, Chu G. Significance analysis of microarrays applied to the ionizing radiation response. Proc. Natl. Acad. Sci. U.S.a. 2001;98:5116–5121. doi: 10.1073/pnas.091062498. [DOI] [PMC free article] [PubMed] [Google Scholar]
- Ulitsky I, Shkumatava A, Jan CH, Subtelny AO, Koppstein D, Bell GW, Sive H, Bartel DP. Extensive alternative polyadenylation during zebrafish development. Genome Res. 2012;22:2054–2066. doi: 10.1101/gr.139733.112. [DOI] [PMC free article] [PubMed] [Google Scholar]
- van Dongen S, Abreu-Goodger C, Enright AJ. Detecting microRNA binding and siRNA off-target effects from expression data. Nat Meth. 2008;5:1023–1025. doi: 10.1038/nmeth.1267. [DOI] [PMC free article] [PubMed] [Google Scholar]
Associated Data
This section collects any data citations, data availability statements, or supplementary materials included in this article.