

Abstract
Background/Objectives
The extent to which alterations in energy expenditure (EE) in response to sleep restriction contribute to the short sleep-obesity relationship is not clearly defined. Short sleep may induce changes in resting metabolic rate (RMR), thermic effect of food (TEF), and postprandial substrate oxidation.
Subjects/Methods
Ten females (age and BMI: 22-43 y and 23.4-28 kg/m2) completed a randomized, crossover study assessing the effects of short (4 h/night) and habitual (8 h/night) sleep duration on fasting and postprandial RMR and respiratory quotient (RQ). Measurements were taken after 3 nights using whole-room indirect calorimetry. The TEF was assessed over a 6-h period following consumption of a high-fat liquid meal.
Results
Short vs. habitual sleep did not affect RMR (1.01 ± 0.05 and 0.97 ± 0.04 kcal/min; p=0.23). Fasting RQ was significantly lower after short vs. habitual sleep (0.84 ± 0.01 and 0.88 ± 0.01; p=0.028). Postprandial EE (short: 1.13 ± 0.04 and habitual: 1.10 ± 0.04, p=0.09) and RQ (short: 0.88 ± 0.01 and habitual: 0.88 ± 0.01, p=0.50) after the high-fat meal were not different between conditions. TEF was similar between conditions (0.24 ± 0.02 kcal/min in both; p=0.98), as was the ~6-h incremental area under the curve (1.16 ± 0.10 and 1.17 ± 0.09 kcal/min x 356 min after short and habitual sleep, respectively; p=0.92).
Conclusions
Current findings observed in non-obese healthy premenopausal women do not support the hypothesis that alterations in TEF and postprandial substrate oxidation are major contributors to the higher rate of obesity observed in short sleepers. In exploring a role of sleep duration on EE, research should focus on potential alterations in physical activity to explain the increased obesity risk in short sleepers.
Keywords: sleep restriction, energy expenditure, respiratory quotient, obesity
INTRODUCTION
It has been postulated that a central physiological role of sleep is the conservation of energy (ref. 1), and that the energy costs associated with sleep restriction may lead to a compensatory decline in next-day resting metabolic rate (RMR) (ref. 2). This was demonstrated in a study which reported that compared to a night of habitual sleep, a night of total sleep deprivation resulted in reduced next-day RMR (0745-0815 h), that was not accompanied by reduced core body temperature during this time (ref. 2). This observation is important since RMR is the biggest contributor to overall energy expenditure (EE), and decreases in this component, especially in conjunction with increased food intake, can contribute to positive energy balance and weight gain. Indeed, increased food intake after experimental sleep restriction is frequently reported (ref. 3, 4, 5, 6, 7). Furthermore, it was recently found that a night of acute sleep deprivation compared to habitual sleep is associated with purchasing significantly more calories and grams of food in an in-lab mock supermarket scenario (ref. 8). The hyperphagia observed in response to sleep restriction may be a physiological adaptation to ensure sufficient energy supplies in light of the increased energy demands associated with extended wakefulness (ref. 6).
Despite the suggestion of a reduction in RMR as a physiological adaptation to insufficient sleep (ref. 9), most studies have demonstrated that restricting sleep duration to 4-5.5 h/night does not alter RMR (ref. 4, 5, 10, 11, 12). In these studies, laboratory measures of RMR were typically done using ventilated-hood indirect calorimetry (ref. 4, 5, 10, 12). To our knowledge, only one study, conducted exclusively in adolescent males, examined RMR using whole-room indirect calorimetry (ref. 11). Measures of respiratory gas exchange via indirect calorimetry allow for the assessment of respiratory quotient (RQ, the ratio of carbon dioxide produced to oxygen consumed) and substrate utilization. RQ indicates nutrient utilization, such that a higher RQ corresponds to greater reliance on carbohydrates as the primary energy source whereas a lower RQ indicates greater fat oxidation. With a few exceptions (ref. 4, 11), RQ under fasting conditions in response to sleep curtailment has not been reported. Another aspect of EE which has not been extensively studied in response to experimental sleep restriction is the thermic effect of food (TEF). Contributing approximately 10% to overall EE, TEF is the EE associated with the digestion, absorption, metabolism, and storage of food. In prior studies, partial sleep restriction was found to have no effect on overall TEF (ref. 5) or reduce the TEF area under the curve (AUC) (ref. 11). Measures in the former study, however, may have been influenced by the ad libitum access to food during the 14-d sleep restriction period (ref. 5). The Klingenberg et al. study was conducted exclusively in adolescent males (ref. 11), and may not be applicable to adults or females. Moreover, to our knowledge, postprandial RQ in response to sleep restriction under a controlled weight-maintenance diet has never been examined.
The aim of the current study was to investigate the effects of short sleep (4 h time in bed [TIB]) compared to habitual sleep (8 h TIB) on fasting RMR and TEF using whole-room indirect calorimetry in a group of healthy women. Whole-room calorimetry may be preferable to the ventilated-hood method as it reduces participant discomfort and stress allowing for prolonged measurement periods. Furthermore, this investigation of TEF and substrate oxidation in response to a high-fat test meal, as opposed to a standard meal, is innovative and highly relevant since women in particular were found to increase their intakes of fat in response to sleep restriction (ref. 4).
SUBJECTS AND METHODS
Participants
Twelve healthy female participants, age 21-45 y and body mass index (BMI) 22-29.9 kg/m2, were enrolled in the study. Prior to entry into the study, participants confirmed a history of habitual sleep duration between 7-9 h/night via wrist-worn actigraphy (Actiwatch, Actilife LLC, Pensacola, FL) and sleep diary for a 2-wk period. Inclusion in this study required a mean sleep duration during the 2-wk screening period of 7-9 h/night, ≥10 nights of sleep with a duration ≥7 h and less than 4 nights of sleep with a duration <6 h. Exclusion criteria included the presence of type 1 or 2 diabetes (assessed by medical history), cigarette smoking, history of alcohol or substance abuse, excessive daily caffeine intake (>300 mg/d), night shift work, trans-meridian travel within the last 4 wk, and extreme morning or evening chronotype (ref. 13). Pregnant women and women <1 year postpartum were also excluded from participation. None of the participants in the study were currently taking hormonal contraceptives. Other exclusion criteria included the presence of any eating, sleeping, or neurological disorder and use of anti-depressant medications. While we did not exclude based on physical activity, all participants had sedentary or light habitual physical activity according to the 2-wk actigraphic screening (ref. 14). All experimental procedures were approved by the Institutional Review Board of St. Luke's-Roosevelt Hospital Center (New York, NY). Participants were given the opportunity to ask questions about the study protocol prior to providing informed consent.
Experimental Design
The overall study design, including participant enrollment and characteristics, has been previously reported (ref. 14). Briefly, this was a two-phase laboratory-based randomized, crossover study. Experimental phases included a short (4 h/night; 0100-0500 h) and a habitual (8 h/night; 2300-0700 h) sleep duration condition (Figure 1). Experimental phases lasted 4 d, and were scheduled to start approximately 4 wk apart. This washout period was included to limit carry-over effects of sleep restriction, and also to study women during a similar menstrual phase in both sleep conditions. Women reported the timing of their last menstrual period before phase 1; phase 2 was scheduled at the same relative time in the next menstrual cycle. During the first 3 d of each experimental phase, participants consumed a weight-maintenance diet with fixed meal times. The macronutrient composition of the diet was 55% of energy from carbohydrate, 30% from fat, and 15% from protein. Throughout the study, daytime naps were prohibited. Study personnel were instructed to monitor participants to ensure wakefulness throughout all scheduled wake episodes. Participants were prohibited from engaging in exercise or strenuous physical activity for the duration of the study. During day 2 of the experiment, participants were allowed to leave the laboratory under research personnel supervision. All of day 3 was spent inside the larger metabolic chamber (dimensions 330 × 279 × 241 cm) of the New York Obesity Nutrition Research Center, which limited physical activity levels (ref. 14). On day 3, participants engaged in two 15-min bouts of stationary bicycle riding at 50 W to induce some light physical activity while restricted to the confines of the metabolic chamber. During days 2 and 3, participants spent most of their waking episodes watching movies, using the computer, or talking on the telephone. Physical activity throughout the entire experimental period was monitored with wrist-actigraphy. As described previously (ref. 14), in-lab actigraphy data were lost due to technical issues for 3 participants in the short sleep condition and 1 participant in the habitual sleep condition. Analysis of metabolic equivalents (METs) indicated that all participants were in sedentary physical activity (i.e. 1-1.5 METs) during the laboratory protocol in the short and habitual sleep conditions (mean ± SEM: 1.24 ± 0.03 METs for both).
Figure 1.
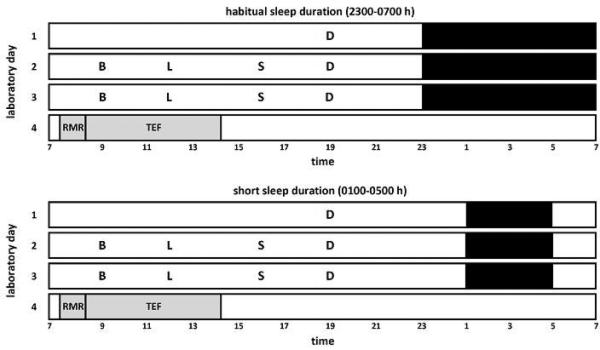
Illustration of the 4-d randomized, crossover research design. In-lab sleep conditions included short sleep duration (4 h/night time in bed, from 0100-0500 h) and habitual sleep duration (8 h/night time in bed, from 2300-0700 h) and. Black bars represent sleep opportunities. Grey bars represent time spent in the small, whole-room indirect calorimeter for measures of energy expenditure in a semi-recumbent position. RMR, resting metabolic rate as measured in the fasting state from 0730-0815 h. TEF, thermic effect of food from 0815-1420 h, as calculated by subtracting RMR from values of postprandial energy expenditure following a high-fat breakfast shake served at 0815 h. B, breakfast; L, lunch; S, snack; D, dinner.
At 0715 h on day 4, participants entered a small whole-room indirect calorimeter with a cooler bag containing the test breakfast. This room is distinct from the better known larger metabolic chamber at the New York Obesity Nutrition Research Center (ref. 14) in that it is designed specifically for the measurement of RMR and TEF. This small whole-room indirect calorimetry chamber is an air-tight, climate-controlled room, with an internal volume of 4,597 liters (dimensions 198 × 122 × 241 cm). The room is equipped with a standard size hospital bed (91 × 203 × 20 cm) and a small stereo for music entertainment. There is a large window and an intercom system to allow investigators to observe and communicate with the participant during study measurements. This chamber eliminates the need for the ventilated hood/canopy of the metabolic cart, making the measurements of RMR and TEF more comfortable for participants, especially for the extended measurement periods required to capture the full TEF.
Participants remained in this room in a semi-recumbent position from 0730-1420 h (Figure 1). RMR was measured in the fasting state from 0730-0815 h. At 0815 h, participants consumed a high-fat test breakfast shake in ≤ 5 min (325 mL Original Rich Chocolate BOOST nutritional drink [Nestle USA, Glendale, CA] to which 19.5 g Bertolli Extra Light Tasting Olive Oil [Bertolli, Unilever, USA] was added). The breakfast shake provided 500 kcal with 50% of energy from fat. Postprandial EE and RQ were recorded continuously for 6 h after breakfast consumption. Trained research personnel ensured that participants did not fall asleep during the entire time spent in the small whole-room calorimetry chamber for measurements of RMR and postprandial EE, by regular visual inspection of participants through the chamber window and also with communication with the participant via an intercom system. Throughout the recording period, participants were instructed to minimize all physical activity and body movements, and spent most of their time listening to music, reading, or watching movies on a laptop computer.
Measures
Details of the metabolic chamber recording procedures have been previously reported (ref. 14). Briefly, the Promethion (model GA-6 and FG-1) Whole-Room Indirect Calorimeter system (Sable Systems Intl, Las Vegas, NV) was used to measure air mass flow, as well as oxygen and carbon dioxide concentrations 1x/sec. Prior to metabolic calculations, these data were corrected for the presence of water vapor pressure in kilopascals to standard-pressure dry conditions (ref. 15). Corrected data were amortized per minute, and the Weir Equation was used to calculate EE (ref. 16). The ratio of the corrected ventilation rates of carbon dioxide production to oxygen consumption was used to calculate RQ, as an indicator of nutrient utilization (ref. 17). The accuracy and precision of the whole-room indirect calorimetry chamber has been validated in the larger metabolic chamber (ref. 18). The same recording system was utilized for both the large metabolic chamber and the smaller whole-room calorimetry chamber used in the current study. A valve is switched to open air flow to either of the two chambers.
Statistical analyses
The first 15 min of the fasting RMR measurement taken from 0730-0815 h were considered the equilibration period and were removed from analyses. To calculate TEF, the mean RMR during the 30 min prior to consumption of the test shake (i.e. 0745-0815 h) was averaged and utilized as the baseline. TEF was then calculated by taking the difference between minute-by-minute postprandial EE and mean RMR. This included all data above baseline from the time after breakfast consumption until the end of the recording. Some participants had missing data from the final few minutes of the 6-h postprandial assessment. In order to have all participants contribute fully to postprandial and TEF assessments, analyses were done on postprandial data collected from 0815-1410 h. TEF throughout the 0815-1410 h period was also expressed as incremental AUC (iAUC), calculated using the trapezoidal rule.
Paired-sample t-tests were used to compare mean EE and RQ during the fasting (0745-0815 h) and postprandial (0815-1410 h) states, as well as mean calculated TEF during the 0815-1410 h span and iAUC of TEF, between short and habitual sleep conditions. Two-way within subjects ANOVA for repeated measures (factors: sleep condition x time) was used to compare minute-by-minute measures of EE and RQ throughout the last 30 min of the fasting period (0745-0815 h) and 1-h binned measures of TEF throughout the postprandial period (0815-1410 h) between short and habitual sleep conditions. Significant interactions were further analyzed by simple main effects tests. Statistical analyses were carried out with the statistical software program DATASIM (version 1.1, Drake Bradley, Bates College, Lewiston, ME) (ref. 19). Data are expressed as mean ± SEM.
RESULTS
Participant characteristics
A total of 12 women were initially enrolled in the study. One participant studied first during the short sleep phase failed to return for the second visit (habitual sleep) for unknown reasons. A second participant studied first during the habitual sleep phase failed to return for the subsequent short sleep because of a scheduling conflict. Ten women completed both phases of the study. After randomization, half of the participants underwent the habitual sleep duration condition first, whereas the other half underwent the short sleep duration first. The mean age and BMI for the ten complete participants were 28.0 ± 2.3 y (range: 22-43 y) and 26.0 ± 0.47 kg/m2 (range: 23.4-28 kg/m2) (ref. 14). Five of the women studied were Black and five were White. Based on wrist-actigraphy worn during the laboratory sleep episodes, the total amount of sleep obtained during the habitual sleep condition was 7.35 ± 0.09 h and the total amount of sleep obtained during the short sleep condition was 3.73 ± 0.04 h (ref. 14). Mean in-lab sleep efficiency (i.e. total sleep duration / total time in bed) was >90% for both sleep phase conditions (ref. 14).
Fasting energy expenditure and respiratory quotient
Mean values of RMR after 3 nights of short compared to habitual sleep duration did not differ between conditions (Table 1). Specifically, mean RMR from 0745-0815 h was 1.01 ± 0.05 kcal/min and 0.97 ± 0.04 kcal/min in the short and habitual sleep conditions, respectively (t9=1.285, p=0.23). When EE was examined minute-by-minute throughout the fasting period, a significant sleep condition x time interaction (F29,261=1.61, p=0.03) was observed, with significantly increased EE found in the short sleep condition compared to the habitual sleep condition at 0753-0756 h (p<0.03, by simple main effects tests) (Figure 2). No main effect of sleep condition (F1,9=1.65, p=0.23) or time (F29,261=0.57, p=0.96) was seen for EE (Figure 2). Mean fasting RQ was 0.84 ± 0.01 and 0.88 ± 0.01 in the short and habitual sleep conditions, respectively (t9=-2.625, p=0.028) (Table 1). When RQ was examined minute-by-minute throughout the fasting period, a significant main effect of sleep condition (F1,9=6.89, p=0.03) was observed, but no main effect of time (F29,261=0.25, p=1.00) and no sleep condition x time interaction (F29,261=0.80, p=0.76) was observed (Figure 2).
Table 1.
Effect of 3 nights of habitual (8 h/night) and short (4 h/night) sleep duration on fasting and postprandial energy expenditure, respiratory quotient, and thermic effect of food measured with whole-room indirect calorimetry.
| Habitual sleep | Short sleep | P-value | |
|---|---|---|---|
| Resting metabolic rate, kcal/min | 0.97 ± 0.04 | 1.01 ± 0.05 | 0.23 |
| Postprandial energy expenditure, kcal/min | 1.10 ± 0.04 | 1.13 ± 0.04 | 0.09 |
| Fasting respiratory quotient | 0.88 ± 0.01 | 0.84 ± 0.01 | 0.03 |
| Postprandial respiratory quotient | 0.88 ± 0.01 | 0.88 ± 0.01 | 0.50 |
| Mean thermic effect of food, kcal/min | 0.24 ± 0.02 | 0.24 ± 0.02 | 0.98 |
| iAUC for thermic effect of food, kcal/min × 356 min | 1.17 ± 0.09 | 1.16 ± 0.10 | 0.92 |
Fasting values were obtained from 0730-0815 h; Postprandial denotes mean values from 0815-1410 h following consumption of a high-fat shake at 0815 h. iAUC is the incremental area under the curve of the thermic effect of food. Data were analyzed using paired-samples t-tests and are expressed as means ± SEM. n = 10.
Figure 2.
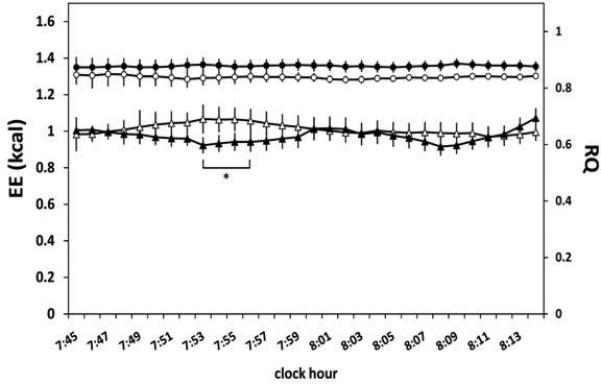
Energy expenditure (EE) and respiratory quotient (RQ) in the fasting state from 0745-0815 h after 3 nights of habitual (8 h/night) and short (4 h/night) sleep duration measured with whole-room indirect calorimetry. Two-way ANOVA for repeated measures demonstrated that EE (illustrated with triangles) showed a significant sleep condition x time interaction (p=0.03), but no main effect of sleep condition (p=0.23) or time (p=0.96) was seen. Two-way ANOVA for repeated measures demonstrated that RQ (illustrated with circles) showed a significant main effect of sleep condition (p=0.03), but no main effect of time (p=1.00) and no sleep condition x time interaction (p=0.76) was seen. Open symbols represent the short sleep condition and filled symbols represent the habitual sleep condition. * denotes significant difference between short and habitual sleep duration conditions. Plotted values are mean ± SEM. n = 10.
Postprandial energy expenditure and respiratory quotient
Postprandial EE and RQ in response to a high-fat breakfast after 3 nights of short vs. habitual sleep did not differ significantly between sleep conditions (Table 1). Mean postprandial EE from 0815-1410 h was 1.13 ± 0.04 kcal/min in short sleep and 1.10 ± 0.04 kcal/min in habitual sleep (t9=1.87, p=0.09). Mean postprandial RQ from 0815-1410 h was 0.88 ± 0.01 kcal/min in both short and habitual sleep (t9=-0.70, p=0.50).
Thermic effect of food
Mean TEF throughout the ~6-h postprandial period was not different between short and habitual sleep (t9=-0.03, p=0.98) (Table 1). Incremental AUC of the ~6-h TEF was 1.16 ± 0.10 kcal/min x 356 min in short sleep and 1.17 ± 0.09 kcal/min x 356 min in habitual sleep (t9=-0.11, p=0.92). When TEF was examined at hourly intervals throughout the postprandial period, a significant main effect of time was seen (F5,45=8.54, p<0.01), although a main effect of sleep condition (F1,9=0.00, p=0.96) and a time x sleep condition interaction effect (F5,45=0.62, p=0.68) were not observed (Figure 3).
Figure 3.
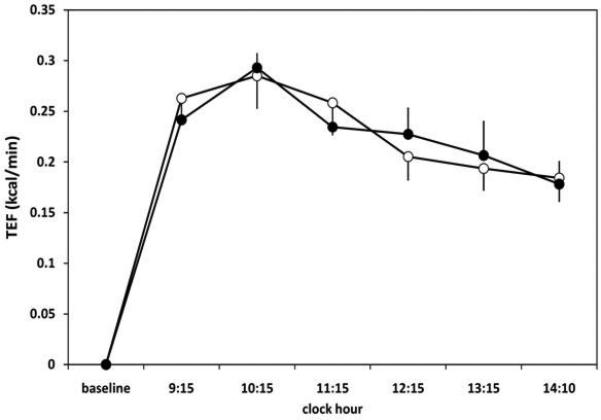
Thermic effect of food (TEF) in response to a high-fat breakfast shake after 3 nights of habitual (8 h/night) and short (4 h/night) sleep duration measured with whole-room indirect calorimetry. TEF showed a significant main effect of time (p<0.01), but no effect of sleep condition (p=0.96) and no significant time x condition interaction effect (p=0.68). Open circles represent short sleep condition and filled circles represent habitual sleep condition. Plotted values are mean TEF ± SEM over the preceding hour shown on the x-axis. n = 10.
DISCUSSION
The current study did not find an effect of three nights of sleep restriction on components of EE, including mean RMR, as well as TEF and substrate utilization in response to a high-fat meal, in a group of healthy young women. These findings are consistent with various prior ventilated-hood indirect calorimetry studies (ref. 4, 5, 10, 12), as well as the single study in a metabolic chamber (ref. 11) which reported that partial sleep restriction has no effect on subsequent RMR. However, our relatively small sample size, combined with the obtained p-value of 0.23 for sleep condition difference in RMR, could be interpreted as indicative of a possible type 2 error. To increase sample size, we combined data from the present study with data from women who underwent a separate study which tested the effects of sleep restriction on energy balance. Specifically, in the prior study, RMR was measured via ventilated-hood in 12 women after 4 d of short (4 h TIB) and habitual (9 h TIB) sleep in a randomized crossover design. Of relevance is that although TIB was 9 h in the previous study, versus 8 h in the present study, average sleep duration during the habitual sleep phase was similar between studies. When we combined the two datasets (n=22), the lack of effect of sleep duration on mean RMR remained (short: 0.98 ± 0.03 and habitual: 0.97 ± 0.02 kcal/min; p=0.64). Although this expanded sample includes whole-room and ventilated-hood calorimetry, data were obtained in the context of a within-subject design for both and were similar between studies.
In the current study, EE was increased in short vs. habitual sleep for 4 consecutive minutes during the 30-min RMR period. This is unlikely to represent a meaningful physiological change associated with sleep restriction, and these marginal increases did not result in an overall increase in mean RMR. Taken together, accumulating evidence suggests that changes in RMR after sleep curtailment are not likely to contribute to the increased obesity and weight gain associated with short sleep. Moreover, despite some inconsistent findings in the literature (ref. 20), early studies have not found low RMR to be a major predisposing factor to subsequent weight gain (ref. 21, 22).
Interestingly, similar to present findings, a study in adolescent males described a lower fasting RQ after short vs. habitual sleep (ref. 11). The authors suggested that the prolonged wakefulness in the short sleep condition induced a temporal difference in energy balance, which would account for the between-condition RQ effect and suggest that this does not represent a change in substrate use after sleep restriction (ref. 11). We agree with their interpretation that the difference in fasting RQ between sleep conditions in the current study likely arises from the increased hours spent awake in a fasted state and therefore does not reflect an inherent difference in substrate utilization induced by sleep restriction. Fasting RQ in response to sleep restriction is not commonly reported, but a prior randomized crossover study from our laboratory found no difference between short or habitual sleep duration when measured in the morning with ventilated-hood calorimetry (ref. 4).
We observed that TEF after a high-fat test meal was not affected by sleep duration. In the Klingenberg et al. study, TEF over 3 h after a standard meal was not different between short and habitual sleep (ref. 11). However, when expressed as iAUC, TEF was significantly lower after short vs. habitual sleep (ref. 11). Our results are consistent with a study by Nedeltcheva and colleagues which found no difference in overall 4-h TEF after a standard breakfast when subjecting adult men and women to 5.5 h TIB or 8.5 h TIB for 14 d (ref. 5).
Our use of a high-fat test meal for measures of TEF is innovative and pertinent since intake of fat is selectively increased after short vs. habitual sleep under ad libitum eating conditions (ref. 3, 4, 23). Furthermore, investigating these effects in women is relevant since, compared to men, women were particularly likely to increase fat intake in response to sleep curtailment (ref. 4). Since women may be at higher risk for both sleep disruption (ref. 24) and obesity (ref. 25) than men, there is a need for intervention studies on the sleep-obesity relationship in females.
Some limitations within the study are worth noting. We did not restrict our intervention to a single phase of the menstrual cycle and did not measure sex hormones. This may be relevant since a menstrual cycle variation has been observed for RMR (ref. 26), RQ (ref. 27), and TEF (ref. 28), although null findings for RMR (ref. 28), RQ (ref. 29), and TEF (ref. 29) have also been reported. This was minimized by testing on the same post-menstruation day for both phases for each participant. Thus, utilizing a crossover design while studying each participant in the same relative menstrual cycle phase for each visit should reduce confounding associated with menstrual cycle factors. The 3-d sleep curtailment exposure may be considered too short to produce meaningful changes in outcomes. However, results are consistent with another study which restricted sleep for 14 d (ref. 5). It is possible that even more prolonged exposure to restricted sleep, as would be expected in real-life conditions in chronic short sleepers, is necessary to induce pronounced metabolic effects not generated in shorter term interventions.
Another limitation is the lack of polysomnographic (PSG) sleep recordings. While we did track sleep with wrist-actigraphy, allowing for objective measures of sleep duration and efficiency, we are unable to describe sleep architecture. This is important, since recent findings from our laboratory (ref. 30) described how changes in sleep architecture in the context of experimental sleep curtailment can influence energy balance parameters. Specifically, we observed that in a similarly designed sleep curtailment protocol (short sleep episode from 0100-0500 h and habitual sleep episode from 2200-0700 h), reductions in slow wave sleep (SWS) and rapid eye movement (REM) sleep were associated with increased intake of fat and carbohydrate. Moreover, duration of stage 2 sleep was positively associated with next day RMR (ref. 30). Interestingly, it was reported that whereas the duration of nocturnal SWS is conserved during recurrent partial sleep deprivation, the amount of slow-wave activity (i.e. power within the 0.5-4.5 Hz range as determined by a spectral analysis of the EEG signal) is elevated in response to this type of sleep manipulation (ref. 31). It will therefore be important to determine how both polysomnographically defined sleep macrostructure and more subtle changes in quantitative sleep EEG are related to other components of EE, including TEF.
Finally, since the current observations were made in healthy non-obese, premenopausal women, the findings may not necessarily be generalized to other unique populations. Both lean (n=3) and overweight (n=7) women were included in the study. However, a comparison of EE values from the habitual sleep condition between the lean and overweight women indicates that none of the EE values differed between sub-groups. A relatively large age range was included in the study, however all but one participant were between 22-36 y (n=9). Since aging is known to influence sleep duration, quality, and architecture (ref. 32), it is possible that the age range influenced the observed effects of short sleep on EE parameters (ref. 33). However, all women in the study were premenopausal which may reduce this possibility.
Whereas most prior studies utilized a metabolic cart, the current study measured RMR and TEF using whole-room indirect calorimetry. To our knowledge, no sleep restriction study measured TEF with whole-room calorimetry. We believe current methods are preferable to the ventilated-hood, which may cause claustrophobia, discomfort, and stress during prolonged use. We were able to obtain continuous recordings for 6 h, whereas prior sleep restriction studies obtained 3-4 h of postprandial EE recordings, usually in segments of 20-25 min of active measurement per hour of testing (ref. 2, 11).
In conclusion, this laboratory-based intervention study quantified the effects of restricting sleep duration to 4 h/night on fasting and postprandial measures of EE and RQ, as well as TEF, using whole-room indirect calorimetry. We observed that experimental sleep curtailment was not associated with substantial changes in RMR, substrate utilization, or dietary-induced thermogenesis in response to a high-fat meal. Our findings, together with prior studies which have consistently documented increased energy consumption after experimental sleep restriction (ref. 3, 4, 5, 6), lend support to the hypothesis that the major contributor to the increased prevalence of obesity in individuals experiencing short sleep is most likely greater food intake, as opposed to physiological alterations in energy metabolism and substrate utilization. However, additional work is necessary to clarify the role of sleep duration on other components of EE, such as physical activity level or non-exercise activity thermogenesis, which were not assessed in the context of this inpatient study.
Acknowledgements
We thank Majella O’Keeffe Ph.D. and also the staff of the Bionutrition Unit at the Irving Institute for Clinical and Translational Research for their help in conducting the study, and also our research participants.
Grant support: This study was supported by the National Institutes of Health grants R01 HL091352 (St-Onge), T32 DK007559 (Shechter), and P30 DK26687 (NYONRC); St. Luke's/Roosevelt Pilot & Feasibility grant (St-Onge). This publication was supported by the National Center for Advancing Translational Sciences, National Institutes of Health, through Grant Number UL1 TR000040, formerly the National Center for Research Resources, Grant Number UL1 RR024156. The content is solely the responsibility of the authors and does not necessarily represent the official views of the NIH.
Abbreviations
- RMR
resting metabolic rate
- EE
energy expenditure
- RQ
respiratory quotient
- TEF
thermic effect of food
- AUC
area under the curve
- TIB
time in bed
Footnotes
Author Contributions: MPSO designed the research; AS, RR, and SW conducted the research; AS, RR, SW, JBA, and MPSO collected the data; AS, RR, and MPSO analyzed the data; AS and MPSO wrote the manuscript. MPSO had primary responsibility for final content; all authors read and approved the final manuscript.
Clinical Trial Registration: Trial registration on http://www.clinicaltrials.gov: # NCT01751581
Disclosure of Conflict of Interest: None of the authors have any conflict of interest to disclose.
REFERENCES
- 1.Jung CM, Melanson EL, Frydendall EJ, Perreault L, Eckel RH, Wright KP. Energy expenditure during sleep, sleep deprivation and sleep following sleep deprivation in adult humans. J Physiol. 2011;589:235–244. doi: 10.1113/jphysiol.2010.197517. [DOI] [PMC free article] [PubMed] [Google Scholar]
- 2.Benedict C, Hallschmid M, Lassen A, Mahnke C, Schultes B, Schioth HB, et al. Acute sleep deprivation reduces energy expenditure in healthy men. Am J Clin Nutr. 2011;93:1229–1236. doi: 10.3945/ajcn.110.006460. [DOI] [PubMed] [Google Scholar]
- 3.Brondel L, Romer MA, Nougues PM, Touyarou P, Davenne D. Acute partial sleep deprivation increases food intake in healthy men. Am J Clin Nutr. 2010;91:1550–1559. doi: 10.3945/ajcn.2009.28523. [DOI] [PubMed] [Google Scholar]
- 4.St-Onge MP, Roberts AL, Chen J, Kelleman M, O'Keeffe M, RoyChoudhury A, et al. Short sleep duration increases energy intakes but does not change energy expenditure in normal-weight individuals. Am J Clin Nutr. 2011;94:410–416. doi: 10.3945/ajcn.111.013904. [DOI] [PMC free article] [PubMed] [Google Scholar]
- 5.Nedeltcheva AV, Kilkus JM, Imperial J, Kasza K, Schoeller DA, Penev PD. Sleep curtailment is accompanied by increased intake of calories from snacks. Am J Clin Nutr. 2009;89:126–133. doi: 10.3945/ajcn.2008.26574. [DOI] [PMC free article] [PubMed] [Google Scholar]
- 6.Markwald RR, Melanson EL, Smith MR, Higgins J, Perreault L, Eckel RH, et al. Impact of insufficient sleep on total daily energy expenditure, food intake, and weight gain. Proc Natl Acad Sci U S A. 2013;110:5695–5700. doi: 10.1073/pnas.1216951110. [DOI] [PMC free article] [PubMed] [Google Scholar]
- 7.Hogenkamp PS, Nilsson E, Nilsson VC, Chapman CD, Vogel H, Lundberg LS, et al. Acute sleep deprivation increases portion size and affects food choice in young men. Psychoneuroendocrinology. 2013;38:1668–1674. doi: 10.1016/j.psyneuen.2013.01.012. [DOI] [PubMed] [Google Scholar]
- 8.Chapman CD, Nilsson EK, Nilsson VC, Cedernaes J, Rangtell FH, Vogel H, et al. Acute sleep deprivation increases food purchasing in men. Obesity (Silver Spring) 2013 doi: 10.1002/oby.20579. [DOI] [PubMed] [Google Scholar]
- 9.Penev PD. Update on energy homeostasis and insufficient sleep. J Clin Endocrinol Metab. 2012;97:1792–1801. doi: 10.1210/jc.2012-1067. [DOI] [PMC free article] [PubMed] [Google Scholar]
- 10.Buxton OM, Pavlova M, Reid EW, Wang W, Simonson DC, Adler GK. Sleep restriction for 1 week reduces insulin sensitivity in healthy men. Diabetes. 2010;59:2126–2133. doi: 10.2337/db09-0699. [DOI] [PMC free article] [PubMed] [Google Scholar]
- 11.Klingenberg L, Chaput JP, Holmback U, Jennum P, Astrup A, Sjodin A. Sleep restriction is not associated with a positive energy balance in adolescent boys. Am J Clin Nutr. 2012;96:240–248. doi: 10.3945/ajcn.112.038638. [DOI] [PubMed] [Google Scholar]
- 12.Bosy-Westphal A, Hinrichs S, Jauch-Chara K, Hitze B, Later W, Wilms B, et al. Influence of partial sleep deprivation on energy balance and insulin sensitivity in healthy women. Obes Facts. 2008;1:266–273. doi: 10.1159/000158874. [DOI] [PMC free article] [PubMed] [Google Scholar]
- 13.Horne JA, Ostberg O. A self-assessment questionnaire to determine morningness eveningness in human circadian rhythms. Int J Chronobiol. 1976;4:97–110. [PubMed] [Google Scholar]
- 14.Shechter A, Rising R, Albu JB, St-Onge MP. Experimental sleep curtailment causes wake-dependent increases in 24-hour energy expenditure as measured by whole-room indirect calorimetry. Am J Clin Nutr. 2013 doi: 10.3945/ajcn.113.069427. In press. [DOI] [PMC free article] [PubMed] [Google Scholar]
- 15.Melanson EL, Ingebrigtsen JP, Bergouignan A, Ohkawara K, Kohrt WM, Lighton JR. A new approach for flow-through respirometry measurements in humans. Am J Physiol Regul Integr Comp Physiol. 2010;298:R1571–1579. doi: 10.1152/ajpregu.00055.2010. [DOI] [PMC free article] [PubMed] [Google Scholar]
- 16.Weir JB. New methods for calculating metabolic rate with special reference to protein metabolism. J Physiol. 1949;109:1–9. doi: 10.1113/jphysiol.1949.sp004363. [DOI] [PMC free article] [PubMed] [Google Scholar]
- 17.Lusk G. The elements of the science of nutrition. W.B. Saunders Company; Philadelphia: 1928. [Google Scholar]
- 18.Whyte KJ, Rising R, Albu JB, Pi-Sunyer X. Evaluation of a new whole room indirect calorimeter for measurement of resting metabolic rate. The FASEB Journal. 2013;27:854–859. [Google Scholar]
- 19.Bradley DL. Computer simulation with DATASIM. Behavior Research Methods, Instruments, & Computers. 1989;21:99–112. [Google Scholar]
- 20.Ravussin E, Lillioja S, Knowler WC, Christin L, Freymond D, Abbott WG, et al. Reduced rate of energy expenditure as a risk factor for body-weight gain. N Engl J Med. 1988;318:467–472. doi: 10.1056/NEJM198802253180802. [DOI] [PubMed] [Google Scholar]
- 21.Weinsier RL, Nelson KM, Hensrud DD, Darnell BE, Hunter GR, Schutz Y. Metabolic predictors of obesity. Contribution of resting energy expenditure, thermic effect of food, and fuel utilization to four-year weight gain of post-obese and never-obese women. J Clin Invest. 1995;95:980–985. doi: 10.1172/JCI117807. [DOI] [PMC free article] [PubMed] [Google Scholar]
- 22.Seidell JC, Muller DC, Sorkin JD, Andres R. Fasting respiratory exchange ratio and resting metabolic rate as predictors of weight gain: the Baltimore Longitudinal Study on Aging. Int J Obes Relat Metab Disord. 1992;16:667–674. [PubMed] [Google Scholar]
- 23.Schmid SM, Hallschmid M, Jauch-Chara K, Wilms B, Benedict C, Lehnert H, et al. Short-term sleep loss decreases physical activity under free-living conditions but does not increase food intake under time-deprived laboratory conditions in healthy men. Am J Clin Nutr. 2009;90:1476–1482. doi: 10.3945/ajcn.2009.27984. [DOI] [PubMed] [Google Scholar]
- 24.Soares CN. Insomnia in women: an overlooked epidemic? Arch Womens Ment Health. 2005;8:205–213. doi: 10.1007/s00737-005-0100-1. [DOI] [PubMed] [Google Scholar]
- 25.Paeratakul S, White MA, Williamson DA, Ryan DH, Bray GA. Sex, race/ethnicity, socioeconomic status, and BMI in relation to self-perception of overweight. Obes Res. 2002;10:345–350. doi: 10.1038/oby.2002.48. [DOI] [PubMed] [Google Scholar]
- 26.Solomon SJ, Kurzer MS, Calloway DH. Menstrual cycle and basal metabolic rate in women. Am J Clin Nutr. 1982;36:611–616. doi: 10.1093/ajcn/36.4.611. [DOI] [PubMed] [Google Scholar]
- 27.Isacco L, Duche P, Boisseau N. Influence of hormonal status on substrate utilization at rest and during exercise in the female population. Sports Med. 2012;42:327–342. doi: 10.2165/11598900-000000000-00000. [DOI] [PubMed] [Google Scholar]
- 28.Piers LS, Diggavi SN, Rijskamp J, van Raaij JM, Shetty PS, Hautvast JG. Resting metabolic rate and thermic effect of a meal in the follicular and luteal phases of the menstrual cycle in well-nourished Indian women. Am J Clin Nutr. 1995;61:296–302. doi: 10.1093/ajcn/61.2.296. [DOI] [PubMed] [Google Scholar]
- 29.Melanson KJ, Saltzman E, Russell R, Roberts SB. Postabsorptive and postprandial energy expenditure and substrate oxidation do not change during the menstrual cycle in young women. J Nutr. 1996;126:2531–2538. doi: 10.1093/jn/126.10.2531. [DOI] [PubMed] [Google Scholar]
- 30.Shechter A, O'Keeffe M, Roberts AL, Zammit GK, RoyChoudhury A, St-Onge MP. Alterations in sleep architecture in response to experimental sleep curtailment are associated with signs of positive energy balance. Am J Physiol Regul Integr Comp Physiol. 2012;303:R883–889. doi: 10.1152/ajpregu.00222.2012. [DOI] [PMC free article] [PubMed] [Google Scholar]
- 31.Van Dongen HP, Maislin G, Mullington JM, Dinges DF. The cumulative cost of additional wakefulness: dose-response effects on neurobehavioral functions and sleep physiology from chronic sleep restriction and total sleep deprivation. Sleep. 2003;26:117–126. doi: 10.1093/sleep/26.2.117. [DOI] [PubMed] [Google Scholar]
- 32.Ohayon MM, Carskadon MA, Guilleminault C, Vitiello MV. Meta-analysis of quantitative sleep parameters from childhood to old age in healthy individuals: developing normative sleep values across the human lifespan. Sleep. 2004;27:1255–1273. doi: 10.1093/sleep/27.7.1255. [DOI] [PubMed] [Google Scholar]
- 33.Benedict C. Link between short sleep and obesity in humans: a matter of age? Chest. 2013;144:711. doi: 10.1378/chest.13-0327. [DOI] [PubMed] [Google Scholar]