

Abstract
Age-related loss of skeletal muscle mass and function is implicated in the development of disease and physical disability. However, little is known about how age affects skeletal muscle structure at the cellular and ultrastructural levels or how such alterations impact function. Thus we examined skeletal muscle structure at the tissue, cellular, and myofibrillar levels in young (21–35 yr) and older (65–75 yr) male and female volunteers, matched for habitual physical activity level. Older adults had smaller whole muscle tissue cross-sectional areas (CSAs) and mass. At the cellular level, older adults had reduced CSAs in myosin heavy chain II (MHC II) fibers, with no differences in MHC I fibers. In MHC II fibers, older men tended to have fewer fibers with large CSAs, while older women showed reduced fiber size across the CSA range. Older adults showed a decrease in intermyofibrillar mitochondrial size; however, the age effect was driven primarily by women (i.e., age by sex interaction effect). Mitochondrial size was inversely and directly related to isometric tension and myosin-actin cross-bridge kinetics, respectively. Notably, there were no intermyofibrillar or subsarcolemmal mitochondrial fractional content or myofilament ultrastructural differences in the activity-matched young and older adults. Collectively, our results indicate age-related reductions in whole muscle size do not vary by sex. However, age-related structural alterations at the cellular and subcellular levels are different between the sexes and may contribute to different functional phenotypes in ways that modulate sex-specific reductions in physical capacity with age.
Keywords: aging, mitochondria, muscle ultrastructure, sarcopenia
age-related changes in skeletal muscle function underlie declines in functional capacity that lead to physical disability. While the loss of muscle mass plays a role in this functional decline [i.e., changes in muscle quantity (13, 21)], diminished whole muscle dynamic force production may persist after controlling for age-related muscle atrophy (21). Multiple studies report age-related reductions in whole muscle torque generation that exceed changes in muscle size (37), although this is not always the case (5, 37, 40, 42). When present, decrements in muscle quality (contractile performance per unit size) may be caused by changes in molecular and cellular level function. Indeed, multiple reports suggest single-fiber (28, 32, 71) and myosin-actin cross-bridge function (10, 19, 42, 48, 49) are diminished with age. Some of these adaptations may be explained, in part, by alterations in molecular and/or cellular muscle structure. Our understanding of how aging affects skeletal muscle structure at the molecular and cellular level in humans, and how these structural alterations relate to whole tissue and functional declines, however, is limited.
Aging alters human muscle structure at the tissue level, causing decreases in muscle performance. The most notable is the gross loss in muscle mass (31), but other structural alterations, such as a decrease in muscle pennation angle and fascicle length (46, 65), could contribute. These architectural changes, however, explain only a portion of the age-related decrease in whole muscle performance (65) and would not explain altered single-fiber contractile performance (28, 32, 71). Studies suggest that an age-related loss of myosin protein contributes to decreased single-fiber isometric tension (10), which may present structurally as a shorter thick-filament length and/or an altered thick-to-thin-filament stoichiometry. Moreover, our laboratory's previous data (43) from a model system (Drosophila melanogaster) shows age-related changes in myofilament ultrastructure that may have functional consequences. To our knowledge, however, no quantitative measurements of myofilament ultrastructure have been compared between muscles of young and older humans, nor have they been evaluated for their relationship to cellular- or tissue-level functional phenotypes.
Dysregulation of cellular metabolic processes has long been suggested as an impetus for aging (16). Recent studies have suggested that mitochondrial dysfunction may contribute to muscle atrophy [reviewed in Powers et al. (55)] and alterations in cellular-level muscle structure (7, 17, 74). For instance, age-related accumulation of mitochondrial deletions has been implicated in region-specific atrophy of skeletal muscle fibers in animal systems (7). With the linking of such changes to diminished muscle performance, studies suggest that altered mitochondrial function and morphology promote intracellular oxidative stress, which can interfere with myofilament function via oxidative modification of proteins or disruptions in myofilament protein metabolism (6). The relationship of alterations in mitochondrial biology to muscle fiber/myofilament structural and functional alterations with aging in humans, however, has not been systematically examined.
The present study was designed to investigate age-related changes in skeletal muscle structure at the tissue, cellular, and myofibrillar levels, including mitochondrial morphological adaptations, and to relate these parameters to skeletal muscle functional performance across the same anatomic levels. To accomplish this objective, we recruited healthy young and older men and women to have similar levels of habitual physical activity. Care was taken to account for age-related alterations in physical activity, as muscle use/disuse can impact whole muscle (14, 22) and single-fiber performance (10, 11), as well as mitochondrial function (3, 20, 25, 27, 29, 36). This consideration represents an advance on prior work in this area, as physical activity is not routinely objectively quantified in human aging studies. Thus some of the presumed age-related changes in skeletal muscle structure and function may be the result of reduced physical activity that frequently accompanies old age (38, 72).
METHODS
Participants.
Twelve young (5 men) and twelve older (5 men) participants were enrolled in the present study. Self-reported physical activity was minimally active (≤2 sessions of ≥30 min of exercise/wk) for the young volunteers and moderately active (3–5 sessions of ≥30 min of exercise/wk) for the older volunteers. None were engaged in a structured exercise program, and self-described exercise consisted primarily of walking. These recruitment criteria were used to correct for differences in self-efficacy and lifestyle differences across age groups (39, 72) and produced young and older groups that had similar habitual physical activity levels. To confirm achievement of this goal, daily physical activity was quantified using uniaxial accelerometers, as previously described (69), worn by each participant for 9.2 ± 0.3 days (Caltrac, Hemokinetics). All volunteers were healthy, with no symptoms or signs of heart disease, hypertension, or diabetes; normal resting electrocardiogram and response to an exercise stress test; and normal thyroid function and blood cell counts and blood biochemistry values. Volunteers were not eligible to participate in the study if they had participated in a weight loss or exercise training program in the past year; a history of smoking (within 1 yr); unintentional weight loss of >2.5 kg during the last 3 mo; a body mass index > 30; hospitalization longer than 3 days in the past 5 yr; active cancer, or history of cancer within the past 5 yr; or were taking/had taken hormone replacement therapy (combined estrogen/progestin for elderly women and testosterone for elderly men). None of the participants were taking 3-hydroxy-3-methylglutaryl-CoA reductase inhibitors (statins) or oral corticosteroids. Young women taking oral contraceptives were included (n = 4), and all elderly women were postmenopausal (cessation of menses >1 yr). All participants signed an informed consent document before participation. The study's protocol was approved by the Committees on Human Research at the University of Vermont. Data on clinical characteristics (age, height, body and whole muscle mass, as well as physical activity level), whole muscle function, single-fiber tension, myosin-actin cross-bridge kinetics, and myosin heavy chain (MHC) isoform distribution from the volunteers in this study have been reported previously (42). The present study examines muscle structure at multiple anatomical levels with these clinical and functional characteristics.
Experimental protocol.
Eligibility was determined during screening visits, which also included whole muscle strength testing, a treadmill test, and resting and exercising electrocardiograms. At least 1 wk later, participants arrived fasted for body composition assessment, and muscle tissue was obtained via percutaneous biopsy of the right vastus lateralis, as described (68). The majority of tissue was immediately placed into cold (4°C) dissecting solution, dissected into bundles, tied to glass rods at 4°C, processed for single-fiber mechanical and morphological assessment, and stored at −20°C, as described (44). The remaining tissue was prepared for electron microscopy (EM) measurements, as described (45), or immunohistochemical assessment after fixation in paraformaldehyde. The remainder was frozen in liquid nitrogen and stored at −80°C until analysis.
Whole body and tissue morphology.
Body mass was measured on a digital scale (ScaleTronix, Wheaton, IL), and total and regional body composition was assessed by dual-energy X-ray absorptiometry (DEXA) using a GE Lunar Prodigy densitometer (GE Lunar, Madison, WI). Muscle mass was estimated using the leg fat-free mass (FFM) from DEXA, as described previously (18). Quadriceps femoris muscle cross-sectional area (CSA) of the right thigh was measured using computerized tomography. Participants lay supine on the exam table, and slice location was determined using a radiopaque bead placed at the midpoint of the thigh (halfway between the anterior superior iliac crest and the most proximal aspect of the patella). Data were analyzed using freely available software (Image J V1.44, National Institutes of Health, Bethesda, MD). A region of interest (ROI) was traced around the quadriceps muscle group, and all voxels outside this ROI were eliminated. Voxels within the ROI were then differentiated between muscle and fat based on radiodensity, measured in Hounsfield units (0 to 100 for muscle and −190 to −30 for fat). The sum of pixels corresponding to each tissue type was used to quantify their CSA. The average radiodensity of pixels within the specified region corresponding to lean muscle was used to indicate overall attenuation and used as a proxy for intramyocellular lipid content (26).
Single-muscle fiber morphology.
Muscle fiber CSA was assessed using immunohistochemistry (IHC), as previously described (66) using a polyclonal rabbit anti-laminin antibody (1:100, ab11575 Abcam) and a mouse anti-MHC I antibody (1:250, A4.951-c Developmental Studies Hybridoma Bank, University of Iowa) in 1% BSA in PBS. Visualization and imaging were performed using an Olympus BX50 microscope. CSA measurements were performed using image analysis software (Metamorph version 7.7.9.0, Molecular Devices, Sunnyvale, CA). This approach does not allow for the detection of MHC isoform coexpression in individual fibers and only distinguishes between fibers expressing MHC I and those that do not. However, in our hands (45) and others (10), fibers coexpressing both MHC I and various isoforms of MHC II are relatively rare (6% in present sample). Thus the average CSA of muscle fibers measured with this approach are referred to as MHC I and MHC II. Due to lack of tissue, IHC was not performed on two older men and one younger woman, meaning this analysis was performed on a total of 11 younger (5 men), and 9 older (3 men) adults.
Ultrastructural measurements.
EM measurements were conducted on intact (i.e., unskinned) skeletal muscle fiber bundles to assess myofibrillar ultrastructure. These measures were not obtained in one younger woman due to lack of tissue, meaning this analysis was performed on a total of 11 younger (5 men), and 12 older (5 men) adults. These measures included myofibrillar fractional area, thick-to-thin-filament ratio (measured in cross sections at the A-band with full overlap of thick and thin filaments), A-band and sarcomere lengths, as well as intermyofibrillar and subsarcolemmal mitochondrial fractional area, average area, and number. Our intermyofibrillar mitochondrial measurements were largely similar to those described previously (45, 68) with minor modifications, including that four images (each ∼152 μm2 with no evidence of structural damage) at ×3,000 magnification were measured for each subject, and mitochondria were highlighted using an Intuos Graphics Pad (Wacom, Vancouver, WA). These techniques have been shown to produce similar results to conventional stereological methods (24, 77) and afforded the opportunity to further interrogate additional mitochondrial morphological characteristics. A similar approach was used for assessment of mitochondria in the subsarcolemmal space. This space was defined as the region between the sarcolemma and the first layer of myofibrils. Images were taken in random locations along the sarcolemma, where mitochondrial density was greatest, typically with nuclei or blood vessels, where mitochondria tend to colocalize. This approach was used to ensure consistency with more recent, relevant publications (9, 47, 53). Subsarcolemmal mitochondrial abundance was quantified in two ways. First, the sum of CSAs for visible mitochondria was divided by the total area of the image, or field of view, similar to intermyofibrillar measures. This was referred to as mitochondrial fractional area and expressed as a percent. The sum of subsarcolemmal mitochondrial CSA was also expressed relative to the length of sarcolemma visible in the image (47), as well as the area of the total subsarcolemmal region, to account for differences due to orientation of the sarcomere, or irregularity in the shape of the sarcolemma. Finally, Z-band width was measured as a proxy of fiber type (64), as described (68).
Mitochondrial and nuclear DNA copy number.
DNA extraction was performed with 10–20 mg of muscle tissue per sample, and genomic DNA concentration was measured according to the manufacturer's instructions (QIAGEN QIAamp, Hilden, Germany). Plasmid DNA controls for human beta globin and cytochrome b were used, as described previously (73). These samples were kindly provided by Dr. Phillip Nagley (Monash University, Australia).
Whole muscle and single-fiber contractile function.
Whole muscle strength was assessed using an isokinetic dynamometer (Cybex, Computer Sports Medicine, Stoughton, MA), as described previously (69), with the change that peak torque was defined as the single repetition with the maximal value. Peak voluntary knee extensor torque was measured with the knee joint positioned in 70° of flexion (180° = full extension) and was corrected for differences in tissue size by covarying for leg FFM during statistical assessment. Measures of contractile function in single-muscle fibers were characterized by measuring maximally Ca2+-activated (pCa 4.5) tension and single-fiber mechanics, as described previously (44). Single-fiber mechanics was used to estimate specific steps of the myosin-action cross-bridge cycle, as previously described (44), including the rate of myosin force production, or the rate of transition between weakly and strongly bound states (78), and myosin attachment time (ton) (52).
Statistics.
Data are presented as means ± SE. All variables of interest were assessed for normality and statistical outliers (values 2 SDs from the inclusive mean). Using this approach, no data were excluded as outliers. Two-way analysis of variance (age × sex) was used to compare measured values for age and age × sex interaction effects. In cases where multiple observations were used to characterize a single participant (e.g., single-fiber CSA), a linear mixed model was used, including a random effect to account for clustering of observations within individuals. For all analyses, if a main or interaction effect was noted (age or age by sex), post hoc contrasts were performed to identify pairwise differences. Associations between measures were determined using linear regression analysis. Statistical analyses were considered significant at P ≤ 0.05 and were performed using IBM SPSS Statistics (version 20.0, IBM, Armonk, NY) and SAS (version 9.3, SAS Institute, Cary, NC).
RESULTS
Participants.
Subject characteristics are listed in Table 1. There was a trend for young adults to be taller than older adults (P = 0.07), and young and older participants had similar body (P = 0.19) and FFM (P = 0.96). Physical activity as determined by accelerometry was similar between age groups (P = 0.71). For comparison, sedentary to minimally active older adults produce between 200 and 300 kcal/day using identical measurement techniques (44, 67), showing that, as expected, the walking activity in our moderately active older adults increased the physical activity values from sedentary levels. When statistically corrected for differences in muscle size, voluntary knee extension strength was not different between young and older participants (P = 0.12).
Table 1.
Subject characteristics
| Men |
Women |
||||
|---|---|---|---|---|---|
| Young | Older | Young | Older | Difference | |
| n | 5 | 5 | 7 | 7 | |
| Age, yr | 25.0 ± 1.4 | 69.5 ± 1.8 | 23.6 ± 1.5 | 68.4 ± 1.0 | Age* |
| Height, cm | 180.9 ± 2.0 | 178.4 ± 1.5 | 166.1 ± 2.9 | 158.0 ± 3.1 | NS |
| Body mass, kg | 72.8 ± 3.0 | 87.6 ± 4.6 | 60.9 ± 5.1 | 59.1 ± 3.9 | NS |
| Fat-free mass, % | 74.6 ± 5.2 | 69.6 ± 2.3 | 66.2 ± 2.6 | 60.6 ± 2.3 | NS |
| Physical activity, kcal/day | 385 ± 55 | 432 ± 91 | 448 ± 38 | 357 ± 45 | NS |
| Isometric torque, Nm | 209.2 ± 16.9 | 194.1 ± 19.1 | 164.4 ± 11.2 | 140.5 ± 15.6 | NS |
Values are means ± SE; n, no. of subjects. NS, nonsignificant. No differences were found between young and older groups for measures apart from age, including isometric torque after statistical correction for leg lean tissue mass.
P ≤ 0.01.
Whole body morphology.
Reduced quadriceps CSA (P < 0.01, Fig. 1A) and muscle attenuation (P < 0.01, Fig. 1B) was found in older vs. young cohorts using computerized tomography. When expressed as a percentage of body mass to adjust for the variation in body size [i.e., to account for any compensatory hypertrophy related to the reduced fractional contribution of fat-free tissue to body weight with age (Table 1)], leg FFM from DEXA was reduced in older vs. young groups (P < 0.05, Fig. 1D), similar to quadriceps CSA (Fig. 1A). However, expressed in absolute terms (kg), leg FFM was not different between young and older groups (Fig. 1C).
Fig. 1.

Whole muscle morphology was characterized using computerized tomography (CT; A and B) and dual-energy X-ray absorptiometry (DEXA; C and D). A: quadriceps cross-sectional area (CSA). B: attenuation in Hounsfield units (HU). C and D: leg fat-free mass in kg (C) and %body weight (%BW; D). Values are means ± SE. Text indicates significant difference (+P ≤ 0.05 or ++P < 0.01) between young and older groups (Age).
Single-muscle fiber morphology.
CSA results from single-muscle fibers measured using IHC are presented in Fig. 2. The CSAs from MHC I fibers were not different between groups (P = 0.56, Fig. 2A), while older adults had reduced CSAs in MHC II fibers (P = 0.04, Fig. 2B) compared with young adults. The CSA histograms for MHC II fibers in men (Fig. 2C) and women (Fig. 2D) illustrate the age-related differences between the sexes in their fiber-size distribution. Older men tend to have a loss of fibers with large CSAs (>2,500 μm2) compared with young men, while older women show a leftward shift to smaller fibers across the entire range of values compared with young women.
Fig. 2.

Single-fiber CSA from myosin heavy chain (MHC) I (A) and MHC II (B) fiber types determined using immunohistochemical analysis. Text indicates significant difference (+P < 0.05) between young and older groups (Age). Nos. in bars in A and B indicate the no. of measured fibers. Values are means ± SE. The relative frequency of muscle fiber CSA in MHC II fibers is presented for men (C) and women (D).
Ultrastructural measurements.
Subcellular measures of skeletal muscle structure revealed no differences in our cohort of young and older men and women (Fig. 3). Cross-sectional EM measures found no difference in myofibrillar fractional area (Fig. 3A) or thick-to-thin-filament ratio (Fig. 3C) between groups. Analysis of longitudinal EM showed A-band length (Fig. 3B), or thick-filament length, was similar between groups.
Fig. 3.

Myofibrillar fractional area (A), A-band length (B), and thick-to-thin-filament ratio (C) were assessed using transmission electron microscopy (EM). These indexes of muscle ultrastructure were not different between young and older men and women. Example images from a young woman are presented to the right of the corresponding data.
There was no age-related difference found in the average number of intermyofibrillar mitochondria observed in our samples (Fig. 4A). However, the average size of intermyofibrillar mitochondria decreased with age (P < 0.01, Fig. 4B), and there was a trend for an age × sex interaction (P = 0.08). Pairwise comparisons showed the smaller mitochondrial size with age was significant in women (P < 0.01), but not in men (P = 0.43). Fractional area of intermyofibrillar mitochondria (Fig. 4C) was not different with age. These findings were recapitulated by the assessment of mitochondrial and nuclear DNA copy number (Fig. 4D). Analyses of the images used to measure intermyofibrillar mitochondrial morphology showed a uniform distribution and no differences between groups for Z-band width, indicating no fiber-type differences between groups. Furthermore, no associations were found between Z-band width and other measures of myofibrillar or mitochondrial morphology.
Fig. 4.

Intermyofibrillar mitochondrial fractional area and morphology were assessed using transmission EM. Representative EM images (top) are shown with contrasted versions of the same image below, which were used to identify mitochondrial number (n·μm−2; A), average mitochondrial CSA (μm2; B), and mitochondrial density or fractional area (%field of view; C). D: relative mitochondrial DNA (mtDNA) copy number. Values are means ± SE. Text indicates significant difference (++P < 0.01) between young and older groups (Age) and a trend between age and sex (Age by Sex). **Significant pairwise differences (P < 0.01) between young and older women.
Mitochondria in the subsarcolemmal region were not morphologically different (number or size) between groups. Mitochondrial density in this region was also not different between groups, regardless of whether the sum of mitochondrial area was normalized to the total field of view (Fig. 5C) or the length of visible sarcolemma (Fig. 5D).
Fig. 5.

Subsarcolemmal mitochondrial fractional area and morphology were assessed using transmission EM, similar to the intermyofibrillar mitochondria (Fig. 4). Top: a representative EM image is shown with an image of its contrasted mitochondria, used to identify morphological characteristics. Subsarcolemmal mitochondria were those between myofibrils and the sarcolemma (indicated by dashed lines). The nucleus in the subsarcolemmal region is indicated in gray and was not included in the area analysis of the subsarcolemmal space. A: mitochondrial number. B: average mitochondrial area. C: mitochondrial fractional area. D: mitochondrial density. Values are means ± SE.
As changes in mitochondrial structure and/or function may be linked to alterations in single-fiber structure (58, 74), we examined the relationship between the intermyofibrillar mitochondria CSA and indexes of fiber structure and function (Fig. 6). The average CSA of mitochondria in the intermyofibrillar space was not correlated to single-fiber CSA in MHC I (P = 0.16) or IIA fibers (P = 0.11). However, average intermyofibrillar mitochondria CSA was inversely related to isometric tension in MHC I (R2 = 0.21, P = 0.03) and IIA fibers (R2 = 0.33, P < 0.01; Fig. 6A), as well as myosin attachment time in MHC IIA fibers (R2 = 0.28, P = 0.02), and directly related to rate of myosin force production (R2 = 0.32, P < 0.01; Fig. 6B) in MHC IIA fibers. Although these coefficient of determination (R2) values are moderate to low, these results show that the average intermyofibrillar mitochondrial CSA explains 28–33% of the variation in isometric tension and cross-bridge kinetics in MHC IIA fibers, a potentially relevant finding considering the variety of ways tension and cross-bridge kinetics can be modified. The coefficient of determination values were lower in MHC I fibers, explaining only 21% of the variation in tension. Exploring these relationships in the sexes independently, most remained significant in women, but not in men, suggesting these correlations were primarily driven by the women. Specifically, average mitochondrial CSA was inversely associated with MHC I (R2 = 0.32, P = 0.05) and MHC IIA tension (R2 = 0.43, P = 0.02) in women, but not in men (P = 0.57 and 0.21, respectively). Average intermyofibrillar mitochondria CSA was directly related to MHC IIA rate of myosin force production in men (R2 = 0.53, P = 0.04), while a trend for this relationship was observed in women (R2 = 0.31, P = 0.06). Myosin attachment time in MHC IIA fibers was negatively associated with average mitochondrial CSA in women (R2 = 0.36, P = 0.04) but not men (P = 0.39). No significant associations were found between these measures and the morphology of subsarcolemmal mitochondria. To explore the potential that enhanced mitochondrial volume leads to reduced tension via reduced myofibrillar density, we examined the relationship between mitochondrial fractional area and measures of myofibrillar density and single-fiber tension. Mitochondrial fractional area was inversely correlated to myofibrillar fractional areas (R2 = 0.21, P = 0.03), but no such relationship existed between mitochondrial fractional area and tension in MHC I or MHC IIA fibers (P = 0.69–0.88).
Fig. 6.
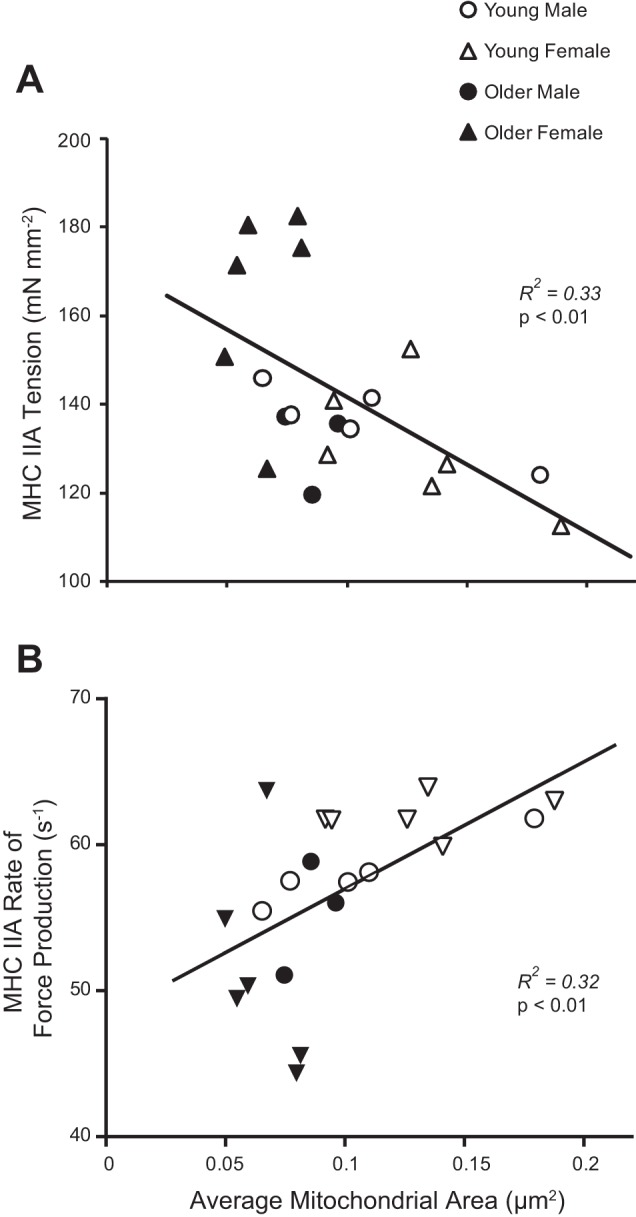
Mitochondrial morphology (average mitochondrial CSA) was significantly correlated with average single-fiber Ca2+ activated tension (A) and rate of force development (B) in MHC IIA fibers.
DISCUSSION
Aging human skeletal muscle is typically characterized by reductions in size and alterations in contractile performance from the tissue to the single-fiber level. While reports in the literature describe these measures in older humans (61), we are not aware of any studies that have comprehensively evaluated the role of age-related changes in cellular or subcellular (i.e., myofilament) structure. Furthermore, although studies have long considered a link between mitochondrial biology and sarcopenia, only a few studies have investigated the effects of age on mitochondrial morphology in humans (9, 47, 51, 54), and none has sought to relate mitochondrial adaptations to age-related changes in single-fiber function. Although our sample size was relatively modest, it is fairly comparable with the range in previous investigations, which studied between 10 (47) and 56 adults (51). In contrast, none of the aforementioned studies have controlled for habitual physical activity, health status, and medication use, as we have in the present study, to attempt to define primary aging effects and minimize the significant variability in physical activity observed across the human lifespan (38, 72). Our results show no effects of age on myofilament ultrastructure. However, we did observe that older adults had smaller CSAs in MHC II fibers, and, in women, aging reduced the size of intermyofibrillar mitochondria. Smaller mitochondrial size was related to increased isometric tension and reduced myosin-actin cross-bridge kinetics, contractile measures that were also altered primarily in older women (42). Collectively, these results highlight unique age-related structural adaptations in skeletal muscle that may partially contribute to sex-specific adaptations in muscle performance with age.
The effects of gross changes in skeletal muscle tissue mass or CSA with age to reduce functional capacity is well-accepted (33), but we know little about how other alterations in muscle structure at the subcellular and molecular level may contribute because few studies have performed such assessments, and we know of no study that has assessed muscle size/structure at all of these anatomic levels in the same cohort. To our knowledge, this is the first study to unambiguously assess the effects of age on myofilament ultrastructure in human skeletal muscle. Unlike variability noted at the cellular level, however, we found no effect of age on myofilament quantity or structure. Specifically, thick-filament length (A-band length), thick-to-thin-filament ratio, and myofibrillar fractional area were not different between young and older men and women, in contrast to our laboratory's previous findings in a model system (43). Parenthetically, this discrepancy between an animal model of aging and human aging should be a cautionary note for extrapolation of results about muscle morphometry across species. Our findings suggest maintenance of structural proteins within the myofilament lattice and are supported by our finding of no age effect on MHC protein content (42). Our data in healthy, older adults suggest alterations in skeletal muscle myofilament content/architecture do not play a role in the atrophy process beyond an assumed overall loss of parallel sarcomeres due to reduced CSA, nor do they appear to mediate age-related differences in contractile function. This is in contrast with some reports (10), but apparent conflict in these results may be explained by physical activity between groups (11), a caveat that we attempted to control in the present study.
The mitochondrial morphological data reported here are generally in agreement with previous studies that describe reductions in the average size of skeletal muscle mitochondria with age (51, 54). However, this observation is not universal (9, 47) and appears to be at least somewhat dependent on cellular localization (intermyofibrillar vs. subsarcolemmal) (9, 47) and sex, as we found alterations only in older women. Our findings are most appropriately compared with those of Crane et al. (9), who report maintenance of intermyofibrillar mitochondrial size, but decreased fractional area, in healthy older adults compared with young. However, the participants described in Crane et al. (9) were significantly more active than our relatively sedentary population, with their participants engaged in alternate modes of physical activity; young performed primarily aerobic exercise, while older adults had just completed a twice weekly strength training intervention. Although we recently reported that resistance training does not alter mitochondrial content/morphology (68), aerobic exercise is a well-known modulator of mitochondrial biology (4), suggesting differences in the type of activity of the populations may explain the discrepancy with our findings. Of further interest is the apparent greater durability of subsarcolemmal mitochondria across age groups in our study. Building on previous work describing greater responsiveness of subsarcolemmal mitochondria to acute disuse in young and older men (47), these results collectively suggest intermyofibrillar mitochondrial morphology are more sensitive to the overall effects of age, whereas subsarcolemmal mitochondria may respond more dramatically to changes in physical activity. However, it should be noted that recent evidence suggests greater interaction between these mitochondrial subfractions than previously thought (53). Indeed, the mitochondria are increasingly appreciated as a dynamic reticulum, and it is possible that morphological changes in the subsarcolemmal fraction may be obscured by the relatively fewer physical constraints placed on those mitochondria compared with the effects of the ultrastructure of the contractile machinery on intermyofibrillar mitochondria.
Although controversial, mitochondria are frequently identified as causal agents in the process of cellular aging (16, 63). Multiple investigations have suggested or implied causal relationships between mitochondrial dynamics and atrophic processes in skeletal muscle (58, 59, 76). A recent animal study suggests mitochondrial fractionation occurs as a primary consequence of healthy aging in rats (23), and others have suggested this may be the case in humans (2). Potential relationships between mitochondrial dynamics and atrophic processes are supported by studies that demonstrate a reduction in muscle atrophy (58) or protection of ischemia-reperfusion injury (50) by blocking mitochondrial fractionation. In the present study, older women had reduced individual intermyofibrillar mitochondrial size, which correlated with increased tension and slower myosin-actin cross-bridge kinetics, measures that were also primarily altered in older women (42). We observed age-related alterations in mitochondrial morphology that are linked, either directly or as an epiphenomenon, with age-related changes in skeletal muscle function, perhaps via signaling pathways involving peroxisome proliferator-activated receptor-α/β coactivator-1 (60). Here again, we are cautious not to imply cause-effect from our cross-sectional associations, but they are nonetheless compelling in supporting a long-held link between mitochondrial biology and age-related alterations in skeletal muscle. It is tempting to speculate that mitochondrial fractionation, as evidenced by reduced mitochondrial size, contributes to an intracellular environment characterized by enhanced reactive oxygen species (76) that may alter contractile function via posttranslational modification of myofilament proteins (56).
We have also identified morphological distinctions at the whole tissue level of young and older adults. We found age-related muscle atrophy, evidenced by reduced quadriceps CSA (cm2) and leg FFM (%body weight). However, absolute leg FFM (kg) was not different between young and older groups, despite similar height, weight, and %FFM in young and older individuals. Clearly, our cohort did not fit a clinical definition of sarcopenia, consistent with our efforts to ensure the older cohort in this study was well-matched to the young in health and physical activity. Despite this, we still found tissue and cellular level evidence for age-related morphological adaptations consistent with sarcopenia. The implication of this finding being that the phenotypes we have identified were robust enough to be detectable in an aged cohort that does not show manifestation of clinically apparent muscle wasting. However, we acknowledge that whole tissue imaging techniques may suffer from imprecision related to the measurement itself and confounding factors inherent to a between-subject design in human subjects (8). In contrast, muscle atrophy was apparent at the single-fiber level. Specifically, age-related atrophy was found in MHC II fibers, consistent with other reports in the literature showing age-related muscle atrophy is typically more prominent in MHC II fibers (34, 35). On closer examination, the age-related atrophy appears different between the sexes, as the distribution of fiber sizes was largely similar in young and older men, with younger men simply having slightly more very large (CSA > 2,850 μm2) fibers. In contrast, older women had a noticeable shift in fiber size distribution with a skew toward smaller fiber sizes. Together, these findings highlight the overall loss of muscle in cross section with age and suggest a greater contribution of MHC II fibers to that loss, with the most dramatic differences observed in older women. We also observed sex specificity in associations between intermyofibrillar mitochondrial size and indexes of single-fiber function (Fig. 6), wherein significant associations observed in the entire cohort persisted when assessed in women alone, but trended or were not significant in men. These sex-specific associations are consistent with observations in this cohort of age-related differences in skeletal muscle morphology being more pronounced in women then men. A few important caveats to our interpretation of the data presented here are warranted. Worth noting is the potential effect of oral contraceptives on physiological outcomes in the younger women in this study (taken by 4 of the 7 volunteers). While some studies performed in animals (41) and humans (1) demonstrate a net anabolic effect of estrogen, evidence that hormone replacement/supplementation increases muscle size and strength in younger adult women is limited (12). At least one study has shown decreased myofibrillar synthesis rates in young women taking oral contraceptives (15), while studies in postmenopausal women by our laboratory and others suggest no effect of hormone replacement therapy on skeletal muscle size and function (70, 75). Regarding physical activity assessment, our measures relied on a single summary value that was relatively insensitive to variations in the intensity of physical activity performed by our participants. However, our participants were not engaged in strenuous exercise by self-report and referred to walking as their primary form of physical activity, minimizing the potential effects of variations in intensity between age groups. Finally, we acknowledge the inherent limitations associated with performing correlation analyses with small sample sizes in a cross-sectional study. These types of analyses are prone to type I statistical error and, despite our careful matching for health status and habitual physical activity levels in study volunteers, it is possible, as with any correlation analysis, that we have uncovered false-positive associations. Nonetheless, the variables used in the present correlation analyses were chosen based on prior evidence and classical physiological relationships between muscle protein structure and function. While these data are perhaps not definitive, they provide compelling support for future research involving larger cohorts.
Conclusions.
Our findings illustrate the complexity of physiological properties inherent in the age-related phenotype of skeletal muscle and the potential sex-specific nature of these adaptations at the cellular and subcellular levels. Despite the atrophic effects of age and sex at the cellular level, subcellular myofilament ultrastructure (thick-filament length, thick-to-thin-filament ratio, and myofibrillar fractional area) remained unchanged. In addition, mitochondrial fractional area and number were maintained, regardless of cellular location, suggesting maintenance of oxidative capacity across age groups (62) with similar physical activity levels (27). However, here again, sex specificity in the aging response was noted in average intermyofibrillar mitochondrial size, with greater reductions in older women. In these healthy adults, matched for physical activity level, it is unlikely that overall oxidative capacity was different between groups (3, 25, 27, 29, 30, 57), but associations between mitochondrial morphology and muscle function at the fiber level suggest coordination between cellular metabolism and single-fiber function. Future studies should be directed at characterizing the functional metabolic consequences of altered mitochondrial morphology with age and sex, and specific perturbations to contractile proteins that might be responsible for the structural and functional phenotypes observed.
GRANTS
This work was supported by the National Institutes of Health [grants T32-HL-007647 (D. M. Callahan), K01-AG-031303 (M. S. Miller), R01-AG-033547 (M. J. Toth), M01 RR-000109].
DISCLOSURES
No conflicts of interest, financial or otherwise, are declared by the author(s).
AUTHOR CONTRIBUTIONS
Author contributions: D.M.C., N.G.B., M.S., J.B., M.J.T., and M.S.M. analyzed data; D.M.C., P.A.A., M.J.T., and M.S.M. interpreted results of experiments; D.M.C. and M.S.M. prepared figures; D.M.C., M.J.T., and M.S.M. drafted manuscript; D.M.C., M.J.T., and M.S.M. edited and revised manuscript; D.M.C., N.G.B., M.S., J.B., P.A.A., M.J.T., and M.S.M. approved final version of manuscript; N.G.B., M.S., J.B., and M.S.M. performed experiments; P.A.A., M.J.T., and M.S.M. conception and design of research.
ACKNOWLEDGMENTS
We gratefully acknowledge the time and efforts of volunteers who participated in this research. We also appreciate the gift of plasmids for quantification of mitochondrial and nuclear DNA from Dr. Philip Nagley, Professor Emeritus at Monash University.
REFERENCES
- 1.Ahtiainen M, Pollanen E, Ronkainen PH, Alen M, Puolakka J, Kaprio J, Sipila S, Kovanen V. Age and estrogen-based hormone therapy affect systemic and local IL-6 and IGF-1 pathways in women. Age (Dordr) 34: 1249–1260, 2012 [DOI] [PMC free article] [PubMed] [Google Scholar]
- 2.Bertoni-Freddari C, Fattoretti P, Caselli U, Giorgetti B, Albanelli S, Torelli F, Felzani G, Vecchiet J. A morphometric study on human muscle mitochondria in aging. J Am Aging Assoc 25: 101–105, 2002 [DOI] [PMC free article] [PubMed] [Google Scholar]
- 3.Brierly EJ, Johnson MA, Bowman A, Ford GA, Subhan F, Reed JW, James OF, Turnbull DM. Mitochondrial function in muscle from elderly athletes. Ann Neurol 41: 114–116, 1997 [DOI] [PubMed] [Google Scholar]
- 4.Broskey NT, Greggio C, Boss A, Boutant M, Dwyer A, Schlueter L, Hans D, Gremion G, Kreis R, Boesch C, Canto C, Amati F. Skeletal muscle mitochondria in the elderly: effects of physical fitness and exercise training. J Clin Endocrinol Metab 99: 1852–1861, 2014 [DOI] [PubMed] [Google Scholar]
- 5.Callahan DM, Kent-Braun JA. Effect of old age on human skeletal muscle force-velocity and fatigue properties. J Appl Physiol 111: 1345–1352, 2011 [DOI] [PMC free article] [PubMed] [Google Scholar]
- 6.Calvani R, Joseph AM, Adhihetty PJ, Miccheli A, Bossola M, Leeuwenburgh C, Bernabei R, Marzetti E. Mitochondrial pathways in sarcopenia of aging and disuse muscle atrophy. Biol Chem 394: 393–414, 2013 [DOI] [PMC free article] [PubMed] [Google Scholar]
- 7.Cao Z, Wanagat J, McKiernan SH, Aiken JM. Mitochondrial DNA deletion mutations are concomitant with ragged red regions of individual, aged muscle fibers: analysis by laser-capture microdissection. Nucleic Acids Res 29: 4502–4508, 2001 [DOI] [PMC free article] [PubMed] [Google Scholar]
- 8.Cerniglia LM, Delmonico MJ, Lindle R, Hurley BF, Rogers MA. Effects of acute supine rest on mid-thigh cross-sectional area as measured by computed tomography. Clin Physiol Funct Imaging 27: 249–253, 2007 [DOI] [PubMed] [Google Scholar]
- 9.Crane JD, Devries MC, Safdar A, Hamadeh MJ, Tarnopolsky MA. The effect of aging on human skeletal muscle mitochondrial and intramyocellular lipid ultrastructure. J Gerontol A Biol Sci Med Sci 65: 119–128, 2010 [DOI] [PubMed] [Google Scholar]
- 10.D'Antona G, Pellegrino MA, Adami R, Rossi R, Carlizzi CN, Canepari M, Saltin B, Bottinelli R. The effect of ageing and immobilization on structure and function of human skeletal muscle fibres. J Physiol 552: 499–511, 2003 [DOI] [PMC free article] [PubMed] [Google Scholar]
- 11.D'Antona G, Pellegrino MA, Carlizzi CN, Bottinelli R. Deterioration of contractile properties of muscle fibres in elderly subjects is modulated by the level of physical activity. Eur J Appl Physiol 100: 603–611, 2007 [DOI] [PubMed] [Google Scholar]
- 12.Elliott KJ, Cable NT, Reilly T. Does oral contraceptive use affect maximum force production in women? Br J Sports Med 39: 15–19, 2005 [DOI] [PMC free article] [PubMed] [Google Scholar]
- 13.Frontera WR, Hughes VA, Lutz KJ, Evans WJ. A cross-sectional study of muscle strength and mass in 45- to 78-yr-old men and women. J Appl Physiol 71: 644–650, 1991 [DOI] [PubMed] [Google Scholar]
- 14.Goodpaster BH, Chomentowski P, Ward BK, Rossi A, Glynn NW, Delmonico MJ, Kritchevsky SB, Pahor M, Newman AB. Effects of physical activity on strength and skeletal muscle fat infiltration in older adults: a randomized controlled trial. J Appl Physiol 105: 1498–1503, 2008 [DOI] [PMC free article] [PubMed] [Google Scholar]
- 15.Hansen M, Langberg H, Holm L, Miller BF, Petersen SG, Doessing S, Skovgaard D, Trappe T, Kjaer M. Effect of administration of oral contraceptives on the synthesis and breakdown of myofibrillar proteins in young women. Scand J Med Sci Sports 21: 62–72, 2011 [DOI] [PubMed] [Google Scholar]
- 16.Harman D. The biologic clock: the mitochondria? J Am Geriatr Soc 20: 145–147, 1972 [DOI] [PubMed] [Google Scholar]
- 17.Herbst A, Pak JW, McKenzie D, Bua E, Bassiouni M, Aiken JM. Accumulation of mitochondrial DNA deletion mutations in aged muscle fibers: evidence for a causal role in muscle fiber loss. J Gerontol A Biol Sci Med Sci 62: 235–245, 2007 [DOI] [PMC free article] [PubMed] [Google Scholar]
- 18.Heymsfield SB, Smith R, Aulet M, Bensen B, Lichtman S, Wang J, Pierson RN., Jr Appendicular skeletal muscle mass: measurement by dual-photon absorptiometry. Am J Clin Nutr 52: 214–218, 1990 [DOI] [PubMed] [Google Scholar]
- 19.Hook P, Sriramoju V, Larsson L. Effects of aging on actin sliding speed on myosin from single skeletal muscle cells of mice, rats, and humans. Am J Physiol Cell Physiol 280: C782–C788, 2001 [DOI] [PubMed] [Google Scholar]
- 20.Houmard JA, Weidner ML, Gavigan KE, Tyndall GL, Hickey MS, Alshami A. Fiber type and citrate synthase activity in the human gastrocnemius and vastus lateralis with aging. J Appl Physiol 85: 1337–1341, 1998 [DOI] [PubMed] [Google Scholar]
- 21.Hughes VA, Frontera WR, Wood M, Evans WJ, Dallal GE, Roubenoff R, Fiatarone Singh MA. Longitudinal muscle strength changes in older adults: influence of muscle mass, physical activity, and health. J Gerontol A Biol Sci Med Sci 56: B209–B217, 2001 [DOI] [PubMed] [Google Scholar]
- 22.Hunter SK, Thompson MW, Adams RD. Relationships among age-associated strength changes and physical activity level, limb dominance, and muscle group in women. J Gerontol A Biol Sci Med Sci 55: B264–B273, 2000 [DOI] [PubMed] [Google Scholar]
- 23.Iqbal S, Ostojic O, Singh K, Joseph AM, Hood DA. Expression of mitochondrial fission and fusion regulatory proteins in skeletal muscle during chronic use and disuse. Muscle Nerve 48: 963–970, 2013 [DOI] [PubMed] [Google Scholar]
- 24.Jorgen H, Gundersen G, Boysen M, Reith A. Comparison of semiautomatic digitizer-tablet and simple point counting performance in morphometry. Virchows Arch B Cell Pathol Incl Mol Pathol 37: 317–325, 1981 [DOI] [PubMed] [Google Scholar]
- 25.Joseph AM, Adhihetty PJ, Buford TW, Wohlgemuth SE, Lees HA, Nguyen LM, Aranda JM, Sandesara BD, Pahor M, Manini TM, Marzetti E, Leeuwenburgh C. The impact of aging on mitochondrial function and biogenesis pathways in skeletal muscle of sedentary high- and low-functioning elderly individuals. Aging Cell 11: 801–809, 2012 [DOI] [PMC free article] [PubMed] [Google Scholar]
- 26.Kelley DE, Slasky BS, Janosky J. Skeletal muscle density: effects of obesity and non-insulin-dependent diabetes mellitus. Am J Clin Nutr 54: 509–515, 1991 [DOI] [PubMed] [Google Scholar]
- 27.Kent-Braun JA, Ng AV. Skeletal muscle oxidative capacity in young and older women and men. J Appl Physiol 89: 1072–1078, 2000 [DOI] [PubMed] [Google Scholar]
- 28.Krivickas LS, Suh D, Wilkins J, Hughes VA, Roubenoff R, Frontera WR. Age- and gender-related differences in maximum shortening velocity of skeletal muscle fibers. Am J Phys Med Rehabil 80: 447–455; quiz 456–447, 2001 [DOI] [PubMed] [Google Scholar]
- 29.Lanza IR, Short DK, Short KR, Raghavakaimal S, Basu R, Joyner MJ, McConnell JP, Nair KS. Endurance exercise as a countermeasure for aging. Diabetes 57: 2933–2942, 2008 [DOI] [PMC free article] [PubMed] [Google Scholar]
- 30.Larsen RG, Callahan DM, Foulis SA, Kent-Braun JA. Age-related changes in oxidative capacity differ between locomotory muscles and are associated with physical activity behavior. Appl Physiol Nutr Metab 37: 88–99, 2012 [DOI] [PMC free article] [PubMed] [Google Scholar]
- 31.Larsson L. Morphological and functional characteristics of the ageing skeletal muscle in man. A cross-sectional study. Acta Physiol Scand Suppl 457: 1–36, 1978 [PubMed] [Google Scholar]
- 32.Larsson L, Yu F, Hook P, Ramamurthy B, Marx JO, Pircher P. Effects of aging on regulation of muscle contraction at the motor unit, muscle cell, and molecular levels. Int J Sport Nutr Exerc Metab 11, Suppl: S28–S43, 2001 [DOI] [PubMed] [Google Scholar]
- 33.Lauretani F, Russo CR, Bandinelli S, Bartali B, Cavazzini C, Di Iorio A, Corsi AM, Rantanen T, Guralnik JM, Ferrucci L. Age-associated changes in skeletal muscles and their effect on mobility: an operational diagnosis of sarcopenia. J Appl Physiol 95: 1851–1860, 2003 [DOI] [PubMed] [Google Scholar]
- 34.Lexell J, Henriksson-Larsen K, Winblad B, Sjostrom M. Distribution of different fiber types in human skeletal muscles: effects of aging studied in whole muscle cross sections. Muscle Nerve 6: 588–595, 1983 [DOI] [PubMed] [Google Scholar]
- 35.Lexell J, Taylor CC. Variability in muscle fibre areas in whole human quadriceps muscle: effects of increasing age. J Anat 174: 239–249, 1991 [PMC free article] [PubMed] [Google Scholar]
- 36.Little JP, Safdar A, Benton CR, Wright DC. Skeletal muscle and beyond: the role of exercise as a mediator of systemic mitochondrial biogenesis. Appl Physiol Nutr Metab 36: 598–607, 2011 [DOI] [PubMed] [Google Scholar]
- 37.Lynch NA, Metter EJ, Lindle RS, Fozard JL, Tobin JD, Roy TA, Fleg JL, Hurley BF. Muscle quality. I. Age-associated differences between arm and leg muscle groups. J Appl Physiol (1985) 86: 188–194, 1999 [DOI] [PubMed] [Google Scholar]
- 38.Macera CA, Ham SA, Yore MM, Jones DA, Ainsworth BE, Kimsey CD, Kohl HW., 3rd Prevalence of physical activity in the United States: Behavioral Risk Factor Surveillance System, 2001. Prev Chronic Dis 2: A17, 2005 [PMC free article] [PubMed] [Google Scholar]
- 39.Macera CA. Obesity, physical activity, and the risk of decline in health and mobility. Clin J Sport Med 15: 200–201, 2005 [DOI] [PubMed] [Google Scholar]
- 40.Mademli L, Arampatzis A. Effect of voluntary activation on age-related muscle fatigue resistance. J Biomech 41: 1229–1235, 2008 [DOI] [PubMed] [Google Scholar]
- 41.McClung JM, Davis JM, Wilson MA, Goldsmith EC, Carson JA. Estrogen status and skeletal muscle recovery from disuse atrophy. J Appl Physiol 100: 2012–2023, 2006 [DOI] [PubMed] [Google Scholar]
- 42.Miller MS, Bedrin NG, Callahan DM, Previs MJ, Jennings ME, 2nd, Ades PA, Maughan DW, Palmer BM, Toth MJ. Age-related slowing of myosin actin cross-bridge kinetics is sex specific and predicts decrements in whole skeletal muscle performance in humans. J Appl Physiol (1985) 115: 1004–1014, 2013 [DOI] [PMC free article] [PubMed] [Google Scholar]
- 43.Miller MS, Lekkas P, Braddock JM, Farman GP, Ballif BA, Irving TC, Maughan DW, Vigoreaux JO. Aging enhances indirect flight muscle fiber performance yet decreases flight ability in Drosophila. Biophys J 95: 2391–2401, 2008 [DOI] [PMC free article] [PubMed] [Google Scholar]
- 44.Miller MS, VanBuren P, LeWinter MM, Braddock JM, Ades PA, Maughan DW, Palmer BM, Toth MJ. Chronic heart failure decreases cross-bridge kinetics in single skeletal muscle fibres from humans. J Physiol 588: 4039–4053, 2010 [DOI] [PMC free article] [PubMed] [Google Scholar]
- 45.Miller MS, Vanburen P, Lewinter MM, Lecker SH, Selby DE, Palmer BM, Maughan DW, Ades PA, Toth MJ. Mechanisms underlying skeletal muscle weakness in human heart failure: alterations in single fiber myosin protein content and function. Circ Heart Fail 2: 700–706, 2009 [DOI] [PMC free article] [PubMed] [Google Scholar]
- 46.Narici MV, Maganaris CN, Reeves ND, Capodaglio P. Effect of aging on human muscle architecture. J Appl Physiol 95: 2229–2234, 2003 [DOI] [PubMed] [Google Scholar]
- 47.Nielsen J, Suetta C, Hvid LG, Schroder HD, Aagaard P, Ortenblad N. Subcellular localization-dependent decrements in skeletal muscle glycogen and mitochondria content following short-term disuse in young and old men. Am J Physiol Endocrinol Metab 299: E1053–E1060, 2010 [DOI] [PubMed] [Google Scholar]
- 48.Ochala J, Dorer DJ, Frontera WR, Krivickas LS. Single skeletal muscle fiber behavior after a quick stretch in young and older men: a possible explanation of the relative preservation of eccentric force in old age. Pflügers Arch 452: 464–470, 2006 [DOI] [PubMed] [Google Scholar]
- 49.Ochala J, Lambertz D, Van Hoecke J, Pousson M. Changes in muscle and joint elasticity following long-term strength training in old age. Eur J Appl Physiol 100: 491–498, 2007 [DOI] [PubMed] [Google Scholar]
- 50.Ong SB, Subrayan S, Lim SY, Yellon DM, Davidson SM, Hausenloy DJ. Inhibiting mitochondrial fission protects the heart against ischemia/reperfusion injury. Circulation 121: 2012–2022, 2010 [DOI] [PubMed] [Google Scholar]
- 51.Orlander J, Kiessling KH, Larsson L, Karlsson J, Aniansson A. Skeletal muscle metabolism and ultrastructure in relation to age in sedentary men. Acta Physiol Scand 104: 249–261, 1978 [DOI] [PubMed] [Google Scholar]
- 52.Palmer BM, Suzuki T, Wang Y, Barnes WD, Miller MS, Maughan DW. Two-state model of acto-myosin attachment-detachment predicts C-process of sinusoidal analysis. Biophys J 93: 760–769, 2007 [DOI] [PMC free article] [PubMed] [Google Scholar]
- 53.Picard M, White K, Turnbull DM. Mitochondrial morphology, topology, and membrane interactions in skeletal muscle: a quantitative three-dimensional electron microscopy study. J Appl Physiol (1985) 114: 161–171, 2013 [DOI] [PMC free article] [PubMed] [Google Scholar]
- 54.Poggi P, Marchetti C, Scelsi R. Automatic morphometric analysis of skeletal muscle fibers in the aging man. Anat Rec 217: 30–34, 1987 [DOI] [PubMed] [Google Scholar]
- 55.Powers SK, Wiggs MP, Duarte JA, Zergeroglu AM, Demirel HA. Mitochondrial signaling contributes to disuse muscle atrophy. Am J Physiol Endocrinol Metab 303: E31–E39, 2012 [DOI] [PMC free article] [PubMed] [Google Scholar]
- 56.Ramamurthy B, Larsson L. Detection of an aging-related increase in advanced glycation end products in fast- and slow-twitch skeletal muscles in the rat. Biogerontology 14: 293–301, 2013 [DOI] [PubMed] [Google Scholar]
- 57.Rasmussen UF, Krustrup P, Kjaer M, Rasmussen HN. Human skeletal muscle mitochondrial metabolism in youth and senescence: no signs of functional changes in ATP formation and mitochondrial oxidative capacity. Pflügers Arch 446: 270–278, 2003 [DOI] [PubMed] [Google Scholar]
- 58.Romanello V, Guadagnin E, Gomes L, Roder I, Sandri C, Petersen Y, Milan G, Masiero E, Del Piccolo P, Foretz M, Scorrano L, Rudolf R, Sandri M. Mitochondrial fission and remodelling contributes to muscle atrophy. EMBO J 29: 1774–1785, 2010 [DOI] [PMC free article] [PubMed] [Google Scholar]
- 59.Romanello V, Sandri M. Mitochondrial biogenesis and fragmentation as regulators of muscle protein degradation. Curr Hypertens Rep 12: 433–439, 2010 [DOI] [PubMed] [Google Scholar]
- 60.Ruas JL, White JP, Rao RR, Kleiner S, Brannan KT, Harrison BC, Greene NP, Wu J, Estall JL, Irving BA, Lanza IR, Rasbach KA, Okutsu M, Nair KS, Yan Z, Leinwand LA, Spiegelman BM. A PGC-1alpha isoform induced by resistance training regulates skeletal muscle hypertrophy. Cell 151: 1319–1331, 2012 [DOI] [PMC free article] [PubMed] [Google Scholar]
- 61.Scelsi R, Marchetti C, Poggi P. Histochemical and ultrastructural aspects of m. vastus lateralis in sedentary old people (age 65–89 years). Acta Neuropathol (Berl) 51: 99–105, 1980 [DOI] [PubMed] [Google Scholar]
- 62.Schwerzmann K, Hoppeler H, Kayar SR, Weibel ER. Oxidative capacity of muscle and mitochondria: correlation of physiological, biochemical, and morphometric characteristics. Proc Natl Acad Sci U S A 86: 1583–1587, 1989 [DOI] [PMC free article] [PubMed] [Google Scholar]
- 63.Short KR, Bigelow ML, Kahl J, Singh R, Coenen-Schimke J, Raghavakaimal S, Nair KS. Decline in skeletal muscle mitochondrial function with aging in humans. Proc Natl Acad Sci U S A 102: 5618–5623, 2005 [DOI] [PMC free article] [PubMed] [Google Scholar]
- 64.Sjostrom M, Kidman S, Larsen KH, Angquist KA. Z- and M-band appearance in different histochemically defined types of human skeletal muscle fibers. J Histochem Cytochem 30: 1–11, 1982 [DOI] [PubMed] [Google Scholar]
- 65.Thom JM, Morse CI, Birch KM, Narici MV. Influence of muscle architecture on the torque and power-velocity characteristics of young and elderly men. Eur J Appl Physiol 100: 613–619, 2007 [DOI] [PubMed] [Google Scholar]
- 66.Toth MJ, Miller MS, Callahan DM, Sweeny AP, Nunez I, Grunberg SM, Der-Torossian H, Couch ME, Dittus K. Molecular mechanisms underlying skeletal muscle weakness in human cancer: reduced myosin-actin cross-bridge formation and kinetics. J Appl Physiol 114: 858–868, 2013 [DOI] [PMC free article] [PubMed] [Google Scholar]
- 67.Toth MJ, Miller MS, VanBuren P, Bedrin NG, LeWinter MM, Ades PA, Palmer BM. Resistance training alters skeletal muscle structure and function in human heart failure: effects at the tissue, cellular and molecular levels. J Physiol 590: 1243–1259, 2012 [DOI] [PMC free article] [PubMed] [Google Scholar]
- 68.Toth MJ, Miller MS, Ward KA, Ades PA. Skeletal muscle mitochondrial density, gene expression, and enzyme activities in human heart failure: minimal effects of the disease and resistance training. J Appl Physiol 112: 1864–1874, 2012 [DOI] [PMC free article] [PubMed] [Google Scholar]
- 69.Toth MJ, Shaw AO, Miller MS, VanBuren P, LeWinter MM, Maughan DW, Ades PA. Reduced knee extensor function in heart failure is not explained by inactivity. Int J Cardiol 143: 276–282, 2010 [DOI] [PMC free article] [PubMed] [Google Scholar]
- 70.Toth MJ, Sites CK, Matthews DE. Role of ovarian hormones in the regulation of protein metabolism in women: effects of menopausal status and hormone replacement therapy. Am J Physiol Endocrinol Metab 291: E639–E646, 2006 [DOI] [PubMed] [Google Scholar]
- 71.Trappe S, Gallagher P, Harber M, Carrithers J, Fluckey J, Trappe T. Single muscle fibre contractile properties in young and old men and women. J Physiol 552: 47–58, 2003 [DOI] [PMC free article] [PubMed] [Google Scholar]
- 72.Troiano RP, Berrigan D, Dodd KW, Masse LC, Tilert T, McDowell M. Physical activity in the United States measured by accelerometer. Med Sci Sports Exerc 40: 181–188, 2008 [DOI] [PubMed] [Google Scholar]
- 73.Vaillant F, Nagley P. Human cell mutants with very low mitochondrial DNA copy number (rho d). Hum Mol Genet 4: 903–914, 1995 [DOI] [PubMed] [Google Scholar]
- 74.Wanagat J, Cao Z, Pathare P, Aiken JM. Mitochondrial DNA deletion mutations colocalize with segmental electron transport system abnormalities, muscle fiber atrophy, fiber splitting, and oxidative damage in sarcopenia. FASEB J 15: 322–332, 2001 [DOI] [PubMed] [Google Scholar]
- 75.Widrick JJ, Maddalozzo GF, Lewis D, Valentine BA, Garner DP, Stelzer JE, Shoepe TC, Snow CM. Morphological and functional characteristics of skeletal muscle fibers from hormone-replaced and nonreplaced postmenopausal women. J Gerontol A Biol Sci Med Sci 58: 3–10, 2003 [DOI] [PubMed] [Google Scholar]
- 76.Youle RJ, Karbowski M. Mitochondrial fission in apoptosis. Nat Rev Mol Cell Biol 6: 657–663, 2005 [DOI] [PubMed] [Google Scholar]
- 77.Zacharova G, Kubinova L. Stereological methods based on point counting and unbiased counting frames for two-dimensional measurements in muscles: comparison with manual and image analysis methods. J Muscle Res Cell Motil 16: 295–302, 1995 [DOI] [PubMed] [Google Scholar]
- 78.Zhao Y, Kawai M. The effect of the lattice spacing change on cross-bridge kinetics in chemically skinned rabbit psoas muscle fibers. II. Elementary steps affected by the spacing change. Biophys J 64: 197–210, 1993 [DOI] [PMC free article] [PubMed] [Google Scholar]