

Abstract
The canonical function of Plasminogen activator inhibitor-1 (PAI-1/SERPINE1) is as an inhibitor of uPA for blood clot maintenance, but it is now also considered a pleiotropic factor that can exert diverse cellular and tumorigenic effects. However, the mechanism controlling its pleiotropic effects is far from being understood. To elucidate the tumorigenic role of PAI-1, we tested the effects of PAI-1 after manipulation of its expression or through the use of a small molecule inhibitor, tiplaxtinin. Down-regulation of PAI-1 significantly reduced cellular proliferation through an inability to progress from the G0/G1-phase of the cell cycle. Accordingly, overexpression of PAI-1 augmented proliferation by encouraging S-phase entry. Biochemically, cell cycle arrest was associated with the depletion of the G1-phase transition complexes, Cyclin D3/CDK4/6 and Cyclin E/CDK2, in parallel with the up-regulation of the cell cycle inhibitors p53, p21Cip1/Waf1 and p27Kip1. PAI-1 depletion significantly decreased the tumor size of urothelial T24 and UM-UC-14 xenografts and overexpression of PAI-1 substantially increased the tumor size of HeLa xenografts. Lastly, immunohistochemical analysis of human bladder and cervical tumor tissue microarrays revealed increased expression of PAI-1 in cancerous tissue, specifically in aggressive tumors, supporting the relevance of this molecule in human tumor biology.
Keywords: cancer, cell cycle arrest, cyclin D3, plasminogen activator inhibitor -1, p21/27
INTRODUCTION
PAI-1 is an endogenous inhibitor of urokinase-type plasminogen activator. Specifically, PAI-1 normally functions as part of the plasminogen activation (PA) system, which includes the serine protease urokinase-type plasminogen activator (uPA), its receptor uPA-R, tissue plasminogen activator (tPA) and inhibitors PAI-1 and PAI-2 (1-3). PAI-1 expression is regulated by many intrinsic factors (e.g., cytokines and growth factors) and extrinsic factors (e.g., cellular stress) (4). Although the canonical function of PAI-1 has been known as an inhibitor of uPA to maintain clot formation, it is now regarded as a pleiotropic factor exerting diverse cellular effects, many potentially related to tumorigenesis, including cell migration, invasion, adhesion and angiogenesis.
Some reports suggest that PAI-1 influences tumor progression indirectly, through effects on the extracellular matrix that perturb migration, invasion, and angiogenesis (5, 6), but other reports claim that PAI-1 itself promotes tumor growth directly (7). For example, high levels of PAI-1 in human and murine cancer cells were associated with the retardation of tumor growth and invasion in a rodent model (8, 9). Thus, PAI-1's role in tumorigenesis and growth is complicated, varying with experimental design and its cellular origin, so more preclinical and mechanistic studies are required to elucidate the role of PAI-1 in human cancers.
Dysregulation of cellular proliferation is a hallmark of cancer (10-13). The cell cycle is a highly controlled process that involves tight regulation of key molecules that allow cells to progress between phases of the cell cycle. In an attempt to investigate the effect of PAI-1 on cell proliferation and cell cycle progression, we created stable knock-down clones of PAI-1 in the urothelial T24 and UM-UC-14 cells and overexpressing PAI-1 clones in the cervical tumor cell HeLa. Next, we also inhibited PAI-1 activity with the small molecule antagonist of PAI-1, tiplaxtinin (PAI-039) (14, 15). Silencing of PAI-1 in T24 and UM-UC-14 cells via shRNA or tiplaxtinin treatment was associated with a marked inhibition of cellular proliferation causing a cell cycle arrest in G1 to S phase. The silencing of PAI-1 by either genetic or pharmacologic techniques conferred depletion of the G1/S transition molecules, cyclin D3/cdk4/6 and cyclin E/cdk2 with a concomitant increase in the cell cycle inhibitors p21Cip1/Waf1 and p27kip1. In addition, in vitro results were corroborated in a xenograft model in which silencing of PAI-1 led to a reduction in tumorigenicity with decreased levels of cyclin D3, and increased expression of p21Cip1/Waf1 and p27kip1, while overexpression of PAI-1 in HeLa xenografts led to an enhancement in tumor growth, which was associated with increased cyclin D3 expression along with a decrease expression of p21Cip1/Waf1 and p27kip1. Finally, immunohistochemical analysis of bladder and cervical tissues revealed that PAI-1 levels were increased in both human urothelial and cervical cancer patient tissue samples, and higher expression was correlated with more aggressive tumors.
MATERIALS AND METHODS
Immunohistochemical (IHC) staining of human tumors for PAI-1
With IRB approval from MD Anderson Cancer Center Orlando, four-micron tissue sections from 163 bladder cancer patient specimens and commercially available tissue microarrays (TMA) BNC12011 (US Biomax, Inc., Rockville, MD) consisting of 37 benign bladder controls as well as CR805 (US Biomax, Inc., Rockville, MD) consisting of 70 cervical cancers and 10 benign cervical tissues were examined by immunohistochemical staining. Protocol and antibody details are available in Supplementary Material.
Cell culture and reagents
The human urothelial cell lines T24, UM-UC-14, RT4 (ATCC, Manassas, VA) and UROtsa, derived from benign urothelial tissue (a generous gift from Dr. Donald Sens at the University of North Dakota School of Medicine, Grand Forks, ND) as well as the human cervical cancer cell line, HeLa (ATCC, Manassas, VA), were used for these studies and maintained in media as previous1y described (16, 17). T24, UM-UC-14, and HeLa cells were cultured in RPMI 1640 (ATCC, Manassas, VA) medium supplemented with 10% fetal bovine serum (FBS), 50 units/ml penicillin and 50 mg/ml streptomycin. RT4 cells were cultured in McCoy's medium supplemented with 10% FBS, 50 units/ml penicillin and 50 mg/ml streptomycin (Invitrogen Corp., Carlsbad, CA). Due to the difficulty in culturing RT4 cells, they were used in limited experimental assays. UROtsa cells were cultured in DMEM with low glucose (Invitrogen Corp.) supplemented with 1 mg/ml of glucose, 10% FBS, 50 units/ml penicillin and 50 mg/ml streptomycin. All cells were maintained in a standard humidified incubator at 37°C in 5% CO2. PAI-1 inhibitor, tiplaxtinin (PAI-039) (Axon MedChem, Groningen, Netherlands) was dissolved in dimethyl sulfoxide at a stock concentration of 10 mM and stored at −20°C.
Generation of PAI-1 knockdown/overexpression stable cell lines
Stable cells containing a functional null knockdown of PAI-1 in T24 (T24-PAI-1KD) and UMUC-14 (UM-UC-14-PAI-1KD) were generated using a plasmid with PAI-1 shRNA cloned within a pGFP-V-RS vector (Origene Technologies, Rockville, MD) and transfected into T24 and UMUC-14 cells at 80% confluency in a 6-well plate using Fugene HD transfection reagent (Roche Diagnostics, Indianapolis, IN). A plasmid with a scrambled (Scr) non-effective shRNA construct in pGFP-V-RS was concomitantly produced as a negative control (T24Scr and UM-UC-14Scr). The cells were selected in medium containing 1 mg/ml of puromycin (Life Technologies, Carlsbad, CA) for 14 days and subcloned by limiting dilution in 96-well plates. Pilot dose-response studies were performed to determine the lowest dose of G418 or puromycin that can kill all the untransfected cells. PAI-1 shRNA sequences are available in Supplementary Material. Next, HeLa cells stably overexpressing a functionally active PAI-1 (HeLa-PAI-1OE) were produced using a plasmid containing a sequence verified human PAI-1 cDNA cloned into a pCMV6-Entry vector and transfected into HeLa cells at 80% confluency in a 6-well plate using Fugene HD transfection reagent. A plasmid with vector alone was transfected as an empty control (HeLaEmpty). The cells were selected in medium containing 1 200 mg/ml of G418 (Life Technologies, Inc.) for 14 days and subcloned by limiting dilution in 96-well plates. All generated stable cell lines were maintained in media containing 0.25 μg/ml of puromycin for T24 clones (T24-PAI-1KD and T24Scr) and UM-UC-14 clones (UM-UC-14-PAI-1KD and UM-UC-14Scr) and in media containing 500 μg/ml of G418 for HeLa clones (HeLe-PAI-1OE and HeLaEmpty).
Immunoblotting
Cell lysate and immunoblotting were performed using standard protocols as previously described (16). Antibody details are available in Supplementary Material.
Real-time reverse transcription PCR (RTPCR)
RNA was extracted from cells using RNeasy mini kit (Qiagen) as per manufacturer's instructions. Conversion to cDNA was achieved through High Capacity cDNA Reverse Transcription kit (Life Technologies). Quantitative reverse transcriptase (RT)-PCR was carried out using ABI 7300 Real-Time PCR System (Life Technologies) in a 20 μl reaction volume containing 1 μl of the first-strand cDNA, 1 μl of gene-specific TaqMan primer and probe mix. Primer sets can be found in Supplementary Material. The fold change in mRNA expression levels was calculated by 2-ddCt method (18).
Measurement of secreted PAI-1 by ELISA
Parental tumor cells (T24, UM-UC-14, and HeLa) and PAI-1 clones (T24Scr, T24-PAI-1KD, UMUC-14Scr, UM-UC-14-PAI-1KD, HeLaEmpty, HeLa-PAI-1OE) were plated onto 6-well plate at a density of 2 × 10⁵ cells in 2 ml of growth media per well. After incubation for 48 hrs, the cultured supernatant was collected and centrifuged at 1 000 rpm for 5 min to remove any dead cells. The concentration of secreted PAI-1 in the culture supernatant was determined by using a Plasminogen Activator Inhibitor 1 (PAI-1) Human ELISA Kit (ab99970; Abcam, Cambridge, MA).
PAI-1 zymography
Thirty micrograms of total cell lysate from PAI-1 clones (T24Scr, T24-PAI-1KD, UM-UC-14Scr, UM-UC-14-PAI-1KD, HeLaEmpty, HeLa-PAI-1OE) and parental tumor cells (T24, UM-UC-14, and HeLa treated in the presence or absence of tiplaxtinin) were electrophoresed on 10% SDS-polyacrylamide gels containing 1 mg/ml casein (Sigma, St. Louis, MO), 10 μg/ml plasminogen (Sigma, St. Louis, MO) and 0.5 mU/ml uPA under non-reducing conditions. After electrophoresis, SDS removal and PAI-1 renaturation were achieved by washing the gel for 1 hr in buffer containing 2.5% Triton-X 100, 50 mM tris pH 7.4, 5 mM CaCl2, and 1 μM ZnCl2. The gel was then incubated in a reaction buffer containing 50 mM Tris pH 7.4, 5 mM CaCl2, 1 μM ZnCl2 and 0.02% NaN3 pH 8.0) for 18 hr at 37°C, followed by staining with Coomassie blue. PAI-1 activity was indicated as lytic zones of plasmin generation. Gel was photographed using the KODAK Gel Logic 200 Imaging System with Carestream Molecular Imaging Software Standard Edition v5.0.7.24 (Carestream Health, Rochester, NY) when opaque bands appeared on a clear background.
Proliferation and viability assay
PAI-1 clones (T24Scr, T24-PAI-1KD, UM-UC-14Scr, UM-UC-14-PAI-1KD, HeLaEmpty, HeLa-PAI-1OE) and parental tumor cells (T24, UM-UC-14, and HeLa) were plated in white-walled 96-well dishes in triplicate (103 cells/well) and treated with or without tiplaxtinin at the indicated concentrations. Cell proliferation was determined by CellTiter-Glo Luminescent cell viability/proliferation assay (Promega, Madison, WI) according to manufacturer's instructions at 24, 48 and 72 hrs after seeding. Samples were incubated in an orbital shaker for 2 min to facilitate cell lysis followed by additional 10 min incubation at room temperature, and luminescence was measured using a FLUOstar Optima Reader (BMG LABTECH, Ortenberg, Germany). IC50 of tiplaxtinin was determined in Graphpad Prism (GraphPad Software, Inc., La Jolla, CA) for each cell line. At least three independent experiments consisting of each condition tested in triplicate wells was used to calculate mean ± SD values.
Cell Synchronization and Cell Cycle Distribution
For cell cycle analysis, propidium iodide staining and fluorescence activated cell sorting were performed in PAI-1 clones (T24Scr, T24-PAI-1KD, UM-UC-14Scr, UM-UC-14-PAI-1KD, HeLaEmpty, HeLa-PAI-1OE) and parental tumor cell lines (T24, UM-UC-14, and HeLa) treated with or without tiplaxtinin. Briefly, cells were trypsinized, fixed in ethanol for 1 hr at 4°C, stained with propidium iodide (PI) solution (10 μg/mL) with RNase A (250 μg/mL), incubated at 37°C for 30 min, and analyzed using the BD FACScaliber with Cell Quest Pro Software (BD Biosciences, San Jose, California) and ModFit LT™ (Verity Software House, Topsham, ME). Next to obtain populations of cells in G1-phase, the above cells were arrested by double thymidine block (19). Briefly, cells were blocked for 18 hr with 2.5 mM thymidine, released for 8 hr by washing out the thymidine, and then arrested again with another 2.5 mM thymidine for 18 hr. The cells were then released from the thymidine block with two washes of fresh medium and allowed to progress through G1-phase and into S-phase, then the cell cycle position of the cells was determined at 0, 3, 6, and 12 hr by PI staining.
Subsequently, the progression into and through the S-phase was assessed in the above cells using the Click-iT® EdU Alexa Fluor® 647 Flow Cytometry Assay Kit (Life Technologies, Carlsbad, CA). EdU (5-ethynyl-2′-deoxyuridine) is a thymidine analog that becomes incorporated into DNA during active cellular DNA synthesis. Detection is determined via a copper catalyzed covalent reaction between an azide (conjugated to Alexa Fluor 647) and an alkyne. Briefly, PAI-1 clones were seeded at 105 cells per well in a 6-well plate and subsequently treated with 10 μM of EdU for 24 hrs prior to harvesting. Cells were trypsinized, fixed in 4% formaldehyde, and EdU incorporation was determined with the Click-iT EdU Alexa Fluor 647 flow cytometry assay kit (Molecular Probes) according to the manufacturer's instructions. Cell cycle distribution and DNA synthesis of synchronized cells were also assessed by flow cytometry using the BD FACScaliber with Cell Quest Pro Software (BD Biosciences, San Jose, California) and ModFit LT™ (Verity Software House, Topsham, ME) or FlowJo (TreeStar Inc., Ashland, OR).
In vivo tumorigenicity
The importance of PAI-1 expression in regards to tumorigenicity was assessed in an in vivo mouse model. Athymic BALB/c (nu/nu) mice, 6 to 8 weeks old, were obtained from Harlan Laboratories (Indianapolis, IN). Animal care was in compliance with the recommendations of The Guide for Care and Use of Laboratory Animals (National Research Council) and approved by the Institutional Animal Care and Use Committee (IACUC). Tumor growth of the T24 PAI-1 knockdown clone, T24-PAI-1KD-19, was compared to the T24Scr control, the UM-UC-14 PAI-1 knockdown clone, UM-UC-14-PAI-1KD-4, was compared to the UM-UC-14Scr control, and lastly the HeLa PAI-1 overexpression clone, HeLa-PAI-1OE-12, was compared to the HeLaEmpty control. Cells were harvested and re-suspended in a 1:1 mixture of serum-free RPMI and Matrigel (BD Bioscience, San Jose, California). T24 and UM-UC-14 cells (2 × 10⁶) and HeLa cells (106) in 100 μl of RPMI1640 were mixed with 100 μl of Matrigel and injected subcutaneously utilizing a 27-gauge needle into the rear flank of the mice as described previously (20). Tumor volumes were measured and recorded weekly with digital calipers and calculated by volume (mm3) = length × (width)2 × 0.5236. Statistical analysis of tumor volume was performed in GraphPad Prism (GraphPad Software, Inc., La Jolla, CA). After 4 wks, mice were sacrificed and tumors resected for analysis.
Immunohistochemical (IHC) analysis of xenograft tumors
Immunohistochemistry was conducted as described in ref. 20. Details and antibodies listed in Supplementary Material.
Statistics
Experimental data were expressed as mean with standard deviation. All statistical analyses were conducted using Student's t test, Mann-Whitney non-parametric U test, or one-way ANOVA and compared to the control(s). The comparison between PAI-1 expression in human tumors, based on disease status, tumor grade and tumor stage, was calculated using Fisher's exact test. A p < 0.05 was considered significant. All statistical analyses and figures were carried out using GraphPad Prism software 5.0 (GraphPad Software, Inc., La Jolla, CA).
RESULTS
PAI-1 expression is upregulated in aggressive human cancers
In biomarker discovery studies, our group previously profiled the transcriptome of exfoliated urothelia obtained from urine samples from a cohort of 92 patients with known bladder disease status. We identified PAI-1 as a valuable biomarker for the detection of bladder cancer (21). The PAI-1 expression correlation was validated in an independent cohort of 81 subjects using quantitative real-time PCR (22), and in two independent studies comprised of 435 subjects using ELISA assays (23, 24). In the present study, we assessed PAI-1 expression in human tissue specimens by immunostaining. Immunohistochemical staining of 37 benign bladder tissues and 163 bladder tumor tissues revealed significantly higher expression of PAI-1 predominantly within the epithelial component of bladder cancer tissues than in benign tissue (p < 0.0001, Fig. 1A-1E). However, some immunoreactivity was noted in the stroma, mostly associated with vasculature. Furthermore, a correlation between PAI-1 expression status and clinicopathologic features of bladder cancer revealed a significant association of PAI-1 expression in muscle invasive bladder cancer (MIBC) compared to non-muscle invasive bladder cancer (NMIBC) (p = 0.0172, Fig. 1F). No association with tumor grade (p = 0.6021) was identified (Fig. 1G).
Figure 1. PAI-1 overexpression in human bladder cancer.
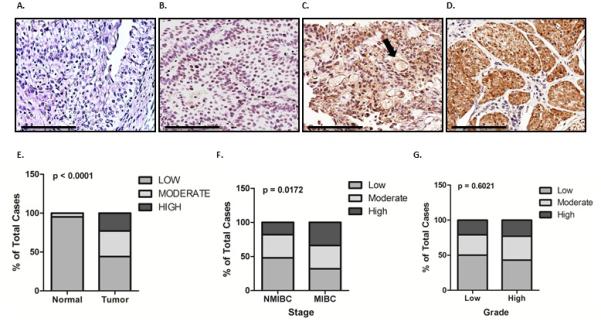
PAI-1 levels were measured by immunohistochemical analysis of 37 benign bladder and 163 bladder tumor tissues. Representative PAI-1 expression levels are shown in benign (A) and bladder cancer tissue samples with absent (B), weak (C), and strong (D) staining. Scale bars, 100 μm. Arrows depict stromal tissue. Correlation was assessed between PAI-1 expression among benign vs. cancer tissue (E) non-muscle invasive bladder cancer (NMIBC) vs. muscle invasive bladder cancer (MIBC) (F) and high-grade vs. low-grade (G).
Next, we expanded our investigation to cancer of another organ, the cervix. A TMA consisting of 10 normal and 70 cervical cancers was analyzed for PAI-1 expression. PAI-1 was absent in benign cervical tissue, but significant (p < 0.0001) expression was observed in cancerous tissue (Supplemental Fig. 1). PAI-1 expression in cervical cancer specimens was located in the tumor cells predominantly, but was also associated with the vasculature in the tumor-adjacent stroma. Unlike in human bladder cancer, PAI-1 expression was not associated with higher stage cervical cancer (p = 0.3147), however, expression was correlated with high-grade cervical cancer (p = 0.0303) (Supplemental Fig. 1). The data provide evidence that increased PAI-1 levels are associated with aggressive cancers in bladder and cervical lesions.
Down-regulation of PAI-1 leads to inhibition of cellular proliferation
The baseline expression of PAI-1 was explored in a panel of cell lines; UROtsa, RT4, T24, UMUC-14 and HeLa (Supplemental Fig. 2). Western blot analysis revealed that PAI-1 is differentially expressed in the panel, with increased expression apparent in T24 and UM-UC-14 cells. These results were confirmed at the mRNA level and by evaluation of secreted PAI-1 protein by ELISA. Given the progressive upregulation of PAI-1 in human bladder and cervical cancers, we investigated how PAI-1 influences key cell processes by genetically manipulating the expression of PAI-1 in T24, UM-UC-14 and HeLa cells. Briefly, we selected two stably transfected PAI-1 knockdown clones of urothelial T24 (T24-PAI-1KD-19 and T24-PAI-1KD-22) and UM-UC-14 cells (UM-UC-14-PAI-1KD-4 and UM-UC-14-PAI-1KD-17) using shRNA, and two stably transfected HeLa cervical cancer cells (HeLa-PAI-1OE-12 and HeLa-PAI-1OE-18) that overexpressed a functionally active human PAI-1. Efficiency of shRNA-mediated depletion, and exogenous PAI-1 overexpression was documented by Western blot analysis, RT-PCR and, and ELISA assay of the conditioned media (Supplemental Fig. 2). In addition to shRNA technology, inhibition of PAI-1 was achieved through treatment of parental T24, UM-UC-14 and HeLa cells with the small molecule inhibitor, tiplaxtinin, a novel antagonist capable of silencing PAI-1 activity. PAI-1 activity was abrogated in urothelial parental cells and HeLa parental cells treated with tiplaxtinin, as demonstrated by the appearance of lytic zones of plasmin generation in zymography gels containing plasminogen and uPA under non-reducing conditions. The expected activity of PAI-1 in urothelial cell knock-downs and over-expressing HeLa clones was confirmed by zymography (Supplemental Fig. 2).
In an in vitro proliferation assay, proliferation of T24 cells (Fig. 2A), UM-UC-14 cells (Fig. 2B) and HeLa cells (Fig. 2C) correlated with PAI-1 expression, i.e., reduced PAI-1 expression in T24 and UM-UC-14 clones was associated with a reduction in cellular proliferation. Treatment of all parental cells with tiplaxtinin resulted in a significant reduction in cellular proliferation (Fig. 2A-C). IC50 values for tiplaxtinin were determined for UROtsa cells (70.3 ± 0.1 μM), T24 cells (43.7 ± 6.3 μM), UM-UC-14 cells (52.8 ± 1.6 μM), and HeLa cells (29.9 ± 3.1 μM). Our results show that reduction of PAI-1 activity in T24, UM-UC-14 or HeLa cells via genetic manipulation or tiplaxtinin treatment causes significant cell growth inhibition.
Figure 2. Depletion of PAI-1 in human tumor cell lines inhibits cell proliferation.

Proliferation rates were measured in cancer cell clones T24-PAI-1KD (A), UM-UC-14-PAI-1KD (B) and HeLa-PAI-1OE (C) over a 72 hr period. Similarly, proliferation rates were measured in parental T24 (A), UM-UC-14 (B) and HeLa (C) cells without and with tiplaxtinin at 30 and 50 μM over a 72 hr period. Data were represented as mean ± SD relative to untreated cells, which are set to 100%. Three independent experiments were performed in triplicate. Significance compared to control cells is denoted by *, p < 0.05.
Loss of PAI-1 causes cell cycle arrest by differentially regulating key cell cycle proteins
Next, we investigated the effects of silencing PAI-1 expression on cell cycle progression. The percentage of cells in G0/G1, S, and G2/M phases of the cell cycle were monitored in cells with functional inhibition of PAI-1 (T24-PAI-1KD-19 and T24-PAI-1KD-22; UM-UC-14-PAI-1KD-4 and UM-UC-14-PAI-1KD-17), and in overexpressors of PAI-1 (HeLa-PAI-1OE-12 and HeLa-PAI-1OE-18) using flow cytometry (Fig. 3A). Inhibition of PAI-1 in T24 clones resulted in the accumulation of cells in G0/G1-phase from 65% in T24Scr control cells to 74% in T24-PAI-1KD-19 and 75% in T24-PAI-1KD-22, along with a reduction in S-phase cells from 29% in T24Scr control to 19% in both T24-PAI-1KD-19 and -22 clones. In UM-UC-14 clones, there was an accumulation of cells in G0/G1-phase from 55% in UM-UC-14Scr to 82% in UM-UC-14-PAI-1KD-4 and 73% in UM-UC-14-PAI-1KD-17, along with a reduction in S-phase cells from 28% in UM-UC-14Scr to 9% in UM-UC-14-PAI-1KD-4 and 3% in UMUC14-PAI-1KD-17.
Figure 3. Inhibition of PAI-1 promotes cell cycle arrest by depleting cell cycle regulatory proteins associated with G1/S transition.
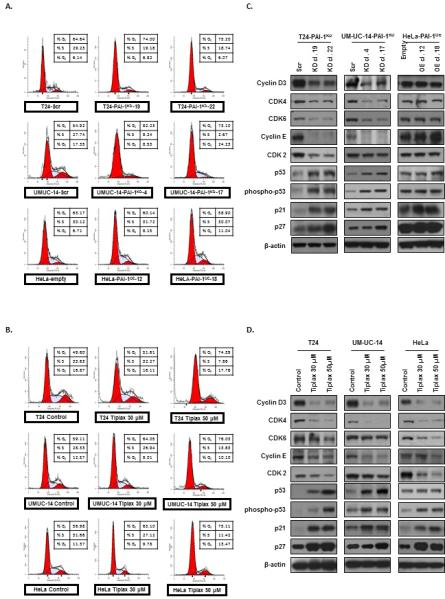
A. Cell cycle progression was examined by flow cytometry in generated T24 clones (T24Scr, T24-PAI-1KD-19 and T24-PAI-1KD-22), UM-UC-14 clones (UM-UC-14Scr, UM-UC-14-PAI-1KD-4 and UMUC14-PAI-1KD-17) both depleted of PAI-1, in addition to HeLa clones (HeLaEmpty, HeLa-PAI-1OE-12 and HeLa-PAI-1OE-18) overexpressing PAI-1. B. Furthermore cell cycle progression was noted in parental cells (T24, UM-UC-14, and HeLa) treated with tiplaxtinin. All experiments were repeated at least three times and a representative of one experiment is depicted. The percentage of cells in G0/G1, S, and G2/M phase of the cell cycle were observed by flow cytometry after propidium iodide staining of cellular DNA and analyzed by the ModFit software. Expression levels of several known G0/G1, S, and G2/M phase cell cycle regulatory factors were analyzed by immunoblotting of clones in C and parental cells treated with tiplaxtinin in D.
Similar to PAI-1 knockdown, inhibition of PAI-1 with tiplaxtinin in parental cells caused a G0/G1-phase cell cycle arrest (Fig. 3B). In T24 cells, tixplaxtinin treatment was associated with an increase in the percent of cells in G0/G1-phase from 50% to 74% and a corresponding decrease in S-phase cells from 34% in T24 control cells to 8% in T24 cells treated with 50 μM tiplaxtinin. UM-UC-14 cells exhibited an accumulation in G0/G1-phase from 59% in control cells to 76% in cells treated with 50 μM tiplaxtinin, and depletion in cells in S-phase from 28% in control cells to 13% in tiplaxtinin-treated cells. In HeLa cells, G0/G1-phase, accumulation was observed from 57% in control cells to 75% in HeLa cells treated with 50 μM tiplaxtinin, and a concomitant decrease in S-phase cells from 27% in control to 11% was observed.
To elucidate the molecular changes associated with the observed G0/G1-phase cell cycle arrest in PAI-1 depleted cells, we assessed the expression of a panel of key regulatory proteins of the cell cycle machinery by Western blot analysis (Fig. 3C and 3D). Inhibition of PAI-1 in T24-PAI-1KD or UM-UC-14KD clones and in parental T24, UM-UC-14 and HeLa cells treated with tiplaxtinin resulted in the depletion of the G1/S transition molecules cyclin D3, cdk4/6, cyclin E and cdk2. A concomitant increase was observed in the levels of the cell cycle inhibitors p53, phospho-p53, p21Cip1/Waf1, and p27kip1, which all play significant roles in G0/G1 to S phase progression. Thus, our data suggests that the loss of PAI-1 prevents cell cycle progression of urothelial and cervical cancer cells through G1 into S-phase through the regulation of key cell cycle factors.
PAI-1 knockdown interferes with progression through the G1 phase of the cell cycle
To further validate that abrogation of PAI-1 can lead to growth phase arrest of human cells, T24 clones (T24-PAI-1KD-19 and T24-PAI-1KD-22) and UM-UC-14 clones (UM-UC-14-PAI-1KD-4 and UMUC14-PAI-1KD-17) were synchronized in G0/G1-phase using a double thymidine block, then cell cycle progression was monitored by flow cytometry following thymidine release. While controls T24Scr and UM-UC-14Scr were able to progress out of G1-phase, T24 and UMUC-14 clones depleted of PAI-1 were primarily arrested in G1-phase with little to no progression to S-phase (Fig. 4A). To confirm this finding, the percentage of cells entering S-phase was also monitored using the Click-iT® EdU Alexa Fluor® 647 Flow Cytometry Assay Kit. Specifically, the incorporation of the thymidine analog, 5-ethynyl-2′-deoxyuridine (EDU) was examined in cells at 0, 3, 6, and 12 hrs post release from thymidine block (Fig. 4B). Depletion of PAI-1 did significantly delay the exit of cells from G1-phase, with only 11% and 15% of the T24-PAI-1KD-19 and T24-PAI-1KD-22 clone cells in S-phase respectively within 3 hrs, while 43% of the T24Scr control cells progressed into S-phase within 3 hrs (p < 0.01) (Fig. 4B). In UM-UC-14 clones, only 10% of UM-UC-14-PAI-1KD-4 and 8% of UMUC14-PAI-1KD-17 cells were able to progress into S-phase while 30% of UM-UC-14Scr control cells were in S-phase (p < 0.01) (Fig. 4B). Our results suggest that PAI-1 expression is necessary to allow transition of cells from G1-phase to S-phase of the cell cycle. This is the first report that has linked PAI-1 to cell cycle changes, and specifically assessed cell promotion through G0/G1 phase.
Figure 4. Depletion of PAI-1 prevents passage of tumor cells out of G1 phase of cell cycle.

A. T24 clones (T24Scr, T24-PAI-1KD-19 and T24-PAI-1KD-22) and UM-UC-14 clones (UM-UC-14Scr, UM-UC-14-PAI-1KD-4 and UMUC14-PAI-1KD-17) were synchronized in G0/G1 via a double thymidine block and cell cycle progression was monitored following thymidine release by propidium iodide staining by flow cytometry analysis at 0 (orange), 3 (green), 6 (blue) and 12 hrs (red). All experiments were repeated at least three times and a representative of one experiment is depicted. B. The percentage of cells entering S phase was quantified using the Click-iT® EdU Alexa Fluor® 647 Flow Cytometry Assay Kit. Incorporation of 5-ethynyl-2′-deoxyuridine (EDU) was examined in cells at 0, 3, 6, and 12 hrs post release of thymidine block. All experiments were repeated at least three times. All data are presented as mean + SD. *, p < 0.05, relative to control.
Inhibition of PAI-1 prevents xenograft tumor growth
Subcutaneous xenograft tumor growth of T24, UM-UC-14 and HeLa cells was assessed in athymic nude mice. In vivo experiments showed a marked decrease in tumor volume in the T24-PAI-1KD-19 and UM-UC-14-PAI-1KD-4 knockdown clones when compared to their respective controls, T24Scr and UM-UC-14Scr (Fig. 5). Upon completion of the study at 4 weeks, T24Scr control xenografts were noted to have an average volume of 516 mm3 compared to 168 mm3 for T24-PAI-1KD-19 xenografts (p = 0.0005). UM-UC-14Scr xenografts had a volume of 1550 mm3 compared to 633 mm3 for UM-UC-14-PAI-1KD-4 xenografts (p = 0.0039). Conversely, overexpression of PAI-1 in HeLa-PAI-1OE-12 enhanced tumor growth considerably relative to HeLaEmpty control cells. HeLaEmpty xenografts had a tumor volume of 933 mm3 compared to HeLa-PAI-1OE-12, which exhibited a dramatic increase in tumor volume to 1858 mm3 (p = 0.0195) (Fig. 5A). We confirmed the expected differences in tissue PAI-1 levels in T24 and UM-UC-14 knockdown xenografts and HeLa overexpressor xenografts (Fig. 5B).
Figure 5. PAI-1 knockdown results in reduction of xenograft tumor growth.
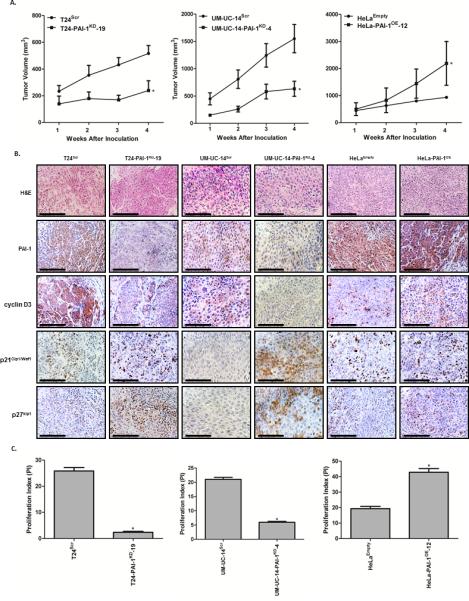
A, Tumor growth of human xenografts were assessed in vivo in athymic nude mice in the PAI-1 T24 cells (T24Scr and T24-PAI-1KD-19) and UM-UC-14 cells (UM-UC-14Scr and UM-UC-14-PAI-1KD-4). In addition, PAI-1 overexpressing cells (HeLa-PAI-1OE-12 and HeLaEmpty) were evaluated (n = 10 per group). Tumor volumes were measured weekly for four weeks and plotted as mean ± SD. *, p < 0.05, relative to control. B, Tumors were resected, fixed in 10% buffered formalin, embedded in paraffin. H&E images are included to identify and define tumor histology. Immunohistochemical analysis of xenograft tumors (T24Scr, T24-PAI-1KD-19, UM-UC-14Scr, UM-UC-14-PAI-1KD-4, HeLaEmpty and HeLa-PAI-1OE-12) for PAI-1, cyclin D3, p21Cip1/Waf1 and p27kip1 was conducted. Representative images from the four groups along are illustrated. These in vivo results confirmed our in vitro results; PAI-1 correlates with cyclin D3 expression and inversely correlates with p21Cip1/Waf1 and p27kip1expression. C, Proliferative index (PI) was quantified based on Ki-67 staining in each group. All data are presented as mean + SD. *, p < 0.05, relative to control.
The expression levels of the proliferative marker (Ki-67) were also monitored in the excised xenograft tissues by IHC, and a proliferation index (PI) was quantified (Fig. 5C). We observed a significant reduction in proliferative capacity in T24-PAI-1KD-19 and UM-UC-14-PAI-1KD-4 tumors depleted of PAI-1, and an enhanced proliferative capacity in HeLa-PAI-1OE-12. Specifically, T24-PAI-1KD-19 showed a reduction in proliferative index of 91 % compared to T24Scr (p = 0.0007) and UM-UC-14-PAI-1KD-4 exhibited a reduction of 72 % compared to UM-UC-14Scr (p < 0.0001). The overexpression of PAI-1 in HeLa-PAI-1OE-12 led to a prominent increase in proliferation of 120 % compared to HeLaEmpty control (p = 0.0002) (Fig. 5C). In addition, IHC analysis confirmed our in vitro cell cycle data. Reduction of a functional PAI-1 in T24-PAI-1KD-19 and UM-UC-14-PAI-1KD-4 was accompanied by a dramatic reduction in the expression of cyclin D3 and an increase in the cell cycle inhibitors, p21Cip1/Waf1 and p27kip1, alluding to a cell cycle arrest in the G1-phase. Staining for HeLa-PAI-1OE-12 xenografts is noted Fig. 5B. Reduction of a functional PAI-1 in T24-PAI-1KD-19 and UM-UC-14-PAI-1KD-4 was not consistently accompanied by a reduction in the expression of cyclin E, CDK2 or p53 (data not shown). Collectively, the xenograft tumor data show that the down-regulation of PAI-1 is associated with a diminution in tumor growth through the attenuation of proliferation coupled with the inhibition of key cyclin/cdk complexes and an induction of cell cycle inhibitors involved in G1/S cell cycle phase progression.
DISCUSSION
PAI-1 is the primary inhibitor of tissue-type plasminogen activator (tPA) and urokinase-type plasminogen activator (uPA), and acts to suppress tissue and plasma fibrinolysis via plasmin conversion (25). PAI-1 is known to play a major role in benign disorders such as deep vein thrombosis, myocardial infarction, atherosclerosis, and stroke (26), and moreover has been linked to some cancers (27, 28). Although PAI-1 activity has been associated with some tumor cell activities (7-9, 29-32), no data has linked PAI-1 to specific changes with cellular proliferation and the cell cycle to date.
Given our compelling data linking PAI-1 expression to cell proliferation, we focused our studies in further studying PAI-1's role in cell cycle progression. In this study, we examined the tumorigenic and proliferative effects of PAI-1 on human urothelial and cervical cell lines by genetically altering the expression of PAI-1 and by interfering with PAI-1 activity with the small molecule inhibitor tiplaxtinin. In both in vitro and in vivo experiments, we found that the down-regulation of PAI-1 led to a) inhibition in cell proliferation and b) potent arrest in the G1 to S phase of the cell cycle, a phenomena associated with reduction in cyclin D3/cdk4/6 and cyclin E/cdk2 and an increase in cell cycle inhibitors, p53, p21Cip1/Waf1, and p27kip1.
Cell proliferation relies on the activation of cyclins, which in turn bind to cyclin-dependent kinases (CDKs) forming complexes that drive progression through the different phases of the cell cycle and which ultimately leads to cell growth (12, 13). This is coupled to regulatory mechanisms by cdk inhibitors that allow or disallow cells to progress through the cell cycle. Since uncontrolled cyclin/cdk activity is a well-established contributing factor for human cancer progression and tumorigenesis (13), we evaluated whether PAI-1 knockdown in tumor cells would affect cell cycle development. Until now, there has been no evidence available showing the effects of functional PAI-1 as it relates to cell cycle progression. Cyclin D members (D1, D2, and D3) are proto-oncogenic regulators of the G1 to S phase checkpoint and have been linked with the pathogenesis of several tumor types (13). In addition, cyclin E and its binding partner cdk2 lead to the phosphorylation of downstream targets for growth progression (33-35). Our data suggests that PAI-1 may confer its pro-tumor properties by causing cell progression through G1-phase via the upregulaion of cyclin D3/cdk4/6 and cyclin E/cdk2 complexes.
In this study, the impairment of progression through G1 into S phase in the PAI-1-depleted cells was also accompanied by prominent increases in the levels of the master cell cycle regulator p53, and activation of specific downstream targets including the cyclin-dependent kinase inhibitors, p21Cip1/Waf1 and p27kip1, which both bind to and inhibit cyclin-cdk complexes to regulate cell cycle progression through G1 phase. Following anti-mitogenic signals, p21Cip1/Waf1 and p27kip1 typically bind to cyclin-cdk complexes to inhibit their catalytic activity and induce cell-cycle arrest (36, 37). Cancer cells are known to tightly regulate such cell-cycle inhibitors to prevent arrest and thereby facilitate cell proliferation (38-40). Furthermore, the cyclin E/cdk2 complex is known to regulate p27kip1 activity by flagging it for ubiquitination and subsequent degradation, which allows cyclin A expression and progression to S-phase (41). This perhaps explains the observed activation of p27kip1 promoting G1-phase arrest of T24 and UM-UC-14 tumor cells in which PAI-1 was silenced.
TGF-beta is known to arrest epithelial cells in G1-phase (42), while it is also known as a strong inducer of PAI-1 expression (43). Our data clearly illustrates that PAI-1 acts as a G1-phase cell cycle promoter and thus generates some conflict with respect to the effect of TGF-beta on cell cycle progression. We are in the process of delving into this mechanism, but believe that PAI-1 and TGF-1 interact with each other via a feedback loop (e.g., elevated TGF-beta leads to elevated PAI-1 which then shuts down TGF-beta). Furthermore, negative regulators in these pathways have been shown to be important, adding complexity and versatility to PAI-1 gene regulation (44).
Aberrant expression of PAI-1 has been observed in some tumor types (e.g., breast and pancreatic) and has been associated with poor prognosis (45-47). Little attention has been given to PAI-1 in human bladder or cervical tumors. For example, only two groups have reported on PAI-1 levels in human bladder cancer patients. Urquidi et al. noted a significant increase in urothelial cell PAI-1 levels in patients bearing bladder tumors compared to non-tumor bearing patients (22), and the same group reported increased urinary PAI-1 protein levels (23) in patients with bladder cancer in an independent study. Becker et al. reported significantly higher PAI-1 levels in tissue and plasma samples, but not in urine, from patients with bladder cancer compared with controls (48). In cervical cancer, the literature on PAI-1 is even more scant. Kobayashi et al. demonstrated a significantly higher lymph node-positive rate in patients that had cervical tumors with strong urokinase plasminogen activator and/or PAI-1 tissue staining, than in those with tumors with weak expression (49). In another study, Tee et al. noted a specific PAI-1 allelic polymorphism in women with cervical cancer compared to women without cervical cancer (50). Thus, further exploration of PAI-1 in human tumors is warranted. Interestingly, PAI-1 expression was noted to be increase in MIBC compared to NMIBC (Fig. 1F), but no association was noted with tumor grade (Fig. 1G). Furthermore in cervical cancer, PAI-1 expression was not associated with higher stage cervical cancer, but was associated with high-grade cervical cancer (Supplemental Fig. 1). This stage and grade specific discrepancy could be due to inherited differences between bladder and cervical tumors, or if larger cohorts were studied, the discrepancies may be reduced or eliminated.
Recently, we reported that the reduction or inhibition of PAI-1 by tiplaxtinin resulted in the reduction of cellular proliferation, cell adhesion, and colony formation, and the induction of apoptosis and anoikis in vitro. Furthermore, treatment of T24 xenografts with tiplaxtinin resulted in inhibition of angiogenesis and induction of apoptosis, leading to a significant reduction in tumor growth. Similar results were obtained through evaluation of the human cervical cancer HeLa cell line, showing that PAI-1 mediated effects are not restricted to tumor cells of bladder origin (51). Of note in our in vitro studies when PAI-1 was silenced, the cell's ability to progress through the cell cycle was severely hampered (Fig. 4). However, we must point out that little expression of PAI-1 was evident in xenograft tumors in which PAI-1 was silenced. Despite genetically silencing PAI-1, xenograft tumors demonstrated a minimal growth potential over time, not a reduction in growth (Fig. 5). Thus, we believe within xenograft tumors there are other factors that can help the tumors escape from the affects of silencing PAI-1, since these tumors still show some, albeit reduce proliferative potential. We are currently planning follow-up studies to closely look into this aspect of the project. Collectively, these data along with the present data show that targeting PAI-1 may be beneficial and support the notion that novel drugs such as tiplaxtinin could be investigated as anti-cancer agents. In this setting, care must be exercised when titrating tiplaxtinin to reduce any unsuspected bleeding issues.
Taken together, the results presented here show the importance of PAI-1 as it relates to tumor cell proliferation. We are the first to show that cell cycle arrest associated with the down-regulation of PAI-1 was accompanied by the depletion of G1 cell cycle transition complexes in parallel with the up-regulation of key cell cycle inhibitors. Although its function is complex, further investigation into PAI-1 is warranted in the hope that it can provide insight into specific aspects of tumor biology and the identification of tumor cell vulnerabilities for therapeutic exploitation.
Supplementary Material
Implications.
Targeting PAI-1 has beneficial anti-tumoral effects and should be further investigated clinically.
ACKNOWLEDGMENT
This work is funded in part by the James and Esther King Biomedical Team Science Project, 1KT-01 (CJR) and NIH/NCI RO1 CA108597 (SG).
Drs. Rosser and Goodison are officers in Nonagen Bioscience Corporation. The remaining authors, Drs. Evan Gomes-Giacoia, Makito Miyake and Adrienne Lawton declare no conflicts of interest.
ABBREVIATIONS
- EdU
5-ethynyl-2′-deoxyuridine
- MIBC
muscle invasive bladder cancer
- NMIBC
non-muscle invasive bladder cancer
- PA
plasminogen activation
- Scr
scrambled
- TMA
tissue microarray
- tPA
tissue-type plasminogen activator
- uPA
urokinase-type plasminogen activator
REFERENCES
- 1.Lee CC, Huang TS. Plasminogen Activator Inhibitor-1: The Expression, Biological Functions, and Effects on Tumorigenesis and Tumor Cell Adhesion and Migration. Journal of Cancer Molecules. 2005;1:25–36. [Google Scholar]
- 2.Wilkins-Port CE, Freytag J, Higgins SP, Higgins PJ. PAI-1: A Multifunctional SERPIN with Complex Roles in Cell Signaling and Migration. Cell Communication Insights. 2010;3:1–10. [Google Scholar]
- 3.Lijnen HR. Pleiotropic functions of plasminogen activator inhibitor-1. Thromb Haemost. 2005;3:35–45. doi: 10.1111/j.1538-7836.2004.00827.x. [DOI] [PubMed] [Google Scholar]
- 4.Jankun J, Keck RW, Skrzypczak-Jankun E, Swiercz R. Inhibitors of urokinase reduce size of prostate cancer xenografts in severe combined immunodeficient mice. Cancer Res. 1997;57:559–63. [PubMed] [Google Scholar]
- 5.McMahon GA, Petitclerc E, Stefansson S, Smith E, Wong MK, Westrick RJ, et al. Plasminogen activator inhibitor-1 regulates tumor growth and angiogenesis. J Biol Chem. 2001;276:33964–8. doi: 10.1074/jbc.M105980200. [DOI] [PubMed] [Google Scholar]
- 6.Binder BR, Mihaly J. The plasminogen activator inhibitor “paradox” in cancer. Immunol Lett. 2008;118:116–24. doi: 10.1016/j.imlet.2008.03.017. [DOI] [PubMed] [Google Scholar]
- 7.Soff GA, Sanderowitz J, Gately S, Verrusio E, Weiss I, Brem S, et al. Expression of plasminogen activator inhibitor type 1 by human prostate carcinoma cells inhibits primary tumor growth, tumor-associated angiogenesis, and metastasis to lung and liver in an athymic mouse model. J Clin Invest. 1995;96:2593–600. doi: 10.1172/JCI118323. [DOI] [PMC free article] [PubMed] [Google Scholar]
- 8.Ma D, Gerard RD, Li XY, Alizadeh H, Niederkorn JY. Inhibition of metastasis of intraocular melanomas by adenovirus-mediated gene transfer of plasminogen activator inhibitor type 1 (PAI-1) in an athymic mouse model. Blood. 1997;90:2738–46. [PubMed] [Google Scholar]
- 9.Czekay RP, Wilkins-Port CE, Higgins SP, Freytag J, Overstreet JM, Klein RM, et al. PAI-1: An Integrator of Cell Signaling and Migration. Int J Cell Biol. 2011:562481. doi: 10.1155/2011/562481. [DOI] [PMC free article] [PubMed] [Google Scholar]
- 10.Hudson MA, McReynolds LM. Urokinase and the urokinase receptor: association with in vitro invasiveness of human bladder cancer cell lines. J Natl Cancer Inst. 1997;89:709–717. doi: 10.1093/jnci/89.10.709. [DOI] [PubMed] [Google Scholar]
- 11.Vermeulen K, Van Bockstaele DR, Berneman ZN. The cell cycle: a review of regulation, deregulation and therapeutic targets in cancer. Cell Prolif. 2003;36:131–49. doi: 10.1046/j.1365-2184.2003.00266.x. [DOI] [PMC free article] [PubMed] [Google Scholar]
- 12.Malumbres M, Hunt SL, Sotillo R, Martín J, Odajima J, Martín A, et al. Driving the cell cycle to cancer. Adv Exp Med Biol. 2003;532:1–11. doi: 10.1007/978-1-4615-0081-0_1. [DOI] [PubMed] [Google Scholar]
- 13.Elokdah H, Abou-Gharbia M, Hennan JK, McFarlane G, Mugford CP, Krishnamurthy G, et al. Tiplaxtinin, a novel, orally efficacious inhibitor of plasminogen activator inhibitor-1: design, synthesis, and preclinical characterization. J Med Chem. 2004;47:3491–4. doi: 10.1021/jm049766q. [DOI] [PubMed] [Google Scholar]
- 14.Leik CE, Su EJ, Nambi P, Crandall DL, Lawrence DA. Effect of pharmacologic plasminogen activator inhibitor-1 inhibition on cell motility and tumor angiogenesis. J Thromb Haemost. 2006;4:2710–5. doi: 10.1111/j.1538-7836.2006.02244.x. [DOI] [PubMed] [Google Scholar]
- 15.Miyake M, Goodison S, Giacoia EG, Rizwani W, Ross S, Rosser CJ. Influencing factors on the NMP-22 urine assay: an experimental model. BMC Urol. 2012;12:23–27. doi: 10.1186/1471-2490-12-23. [DOI] [PMC free article] [PubMed] [Google Scholar]
- 16.Cao W, Yacoub S, Shiverick KT, Namiki K, Sakai Y, Porvasnik S, et al. Dichloroacetate (DCA) sensitizes both wild-type and over expressing Bcl-2 prostate cancer cells in vitro to radiation. Prostate. 2008;68:1223–31. doi: 10.1002/pros.20788. [DOI] [PubMed] [Google Scholar]
- 17.Pfaffl MW. A new mathematical model for relative quantification in real-time RT-PCR. Nucleic Acids Res. 2001;29:e45. doi: 10.1093/nar/29.9.e45. [DOI] [PMC free article] [PubMed] [Google Scholar]
- 18.Whitfield ML, Sherlock G, Saldanha AJ, Murray JI, Ball CA, Alexander KE, et al. Identification of genes periodically expressed in the human cell cycle and their expression in tumors. Mol Biol Cell. 2002;13:1977–2000. doi: 10.1091/mbc.02-02-0030.. [DOI] [PMC free article] [PubMed] [Google Scholar]
- 19.Anai S, Goodison S, Shiverick K, Hirao Y, Brown BD, Rosser CJ. Knock-down of Bcl-2 by antisense oligodeoxynucleotides induces radiosensitization and inhibition of angiogenesis in human PC-3 prostate tumor xenografts. Mol Cancer Ther. 2007;6:101–11. doi: 10.1158/1535-7163.MCT-06-0367. [DOI] [PubMed] [Google Scholar]
- 20.Rosser CJ, Liu L, Sun Y, Villicana P, McCullers M, et al. Bladder cancer-associated gene expression signatures identified by profiling of exfoliated urothelia. Cancer Epidemiol Biomarkers Prev. 2009;18:444–453. doi: 10.1158/1055-9965.EPI-08-1002. [DOI] [PMC free article] [PubMed] [Google Scholar]
- 21.Urquidi V, Goodison S, Cai Y, Sun Y, Rosser CJ. A Candidate Molecular Biomarker Panel for the Detection of Bladder Cancer. Cancer Epidemiol Biomarkers Prev. 2012;21:2149–58. doi: 10.1158/1055-9965.EPI-12-0428. [DOI] [PMC free article] [PubMed] [Google Scholar]
- 22.Goodison S, Chang M, Dai Y, Urquidi V, Rosser CJ. A multi-analyte assay for the non-invasive detection of bladder cancer. PLoS One. 2012;7(10) doi: 10.1371/journal.pone.0047469. [DOI] [PMC free article] [PubMed] [Google Scholar]
- 23.Rosser CJ, Ross S, Chang M, Dai Y, Mengual L, Zhang G, et al. Multiplex Protein Signature for the Detection of Bladder Cancer in Voided Urine Samples. J Urol. 2013;5347:4581–3. doi: 10.1016/j.juro.2013.06.011. [DOI] [PMC free article] [PubMed] [Google Scholar]
- 24.Wiman B, Collen D. Purification and characterization of human antiplasmin, the fast-acting plasmin inhibitor in plasma. Eur J Biochem. 1977;78:19–26. doi: 10.1111/j.1432-1033.1977.tb11709.x. [DOI] [PubMed] [Google Scholar]
- 25.Stefansson S, Haudenschild CC, Lawrence DA. Beyond fibrinolysis: the role of plasminogen activator inhibitor-1 and vitronectin in vascular wound healing. Trends Cardiovasc Med. 1998;8:175–80. doi: 10.1016/S1050-1738(98)00003-6. [DOI] [PubMed] [Google Scholar]
- 26.Fang H, Placencio VR, DeClerck YA. Protumorigenic activity of plasminogen activator inhibitor-1 through an antiapoptotic function. J Natl Cancer Inst. 2012;104:1470–84. doi: 10.1093/jnci/djs377. [DOI] [PMC free article] [PubMed] [Google Scholar]
- 27.Wilkins-Port CE, Ye Q, Mazurkiewicz JE, Higgins PJ. TGF-beta1 + EGF-initiated invasive potential in transformed human keratinocytes is coupled to a plasmin/MMP-10/MMP-1-dependent collagen remodeling axis: role for PAI-1. Cancer Res. 2009;69:4081–91. doi: 10.1158/0008-5472.CAN-09-0043. [DOI] [PMC free article] [PubMed] [Google Scholar]
- 28.Almholt K, Lund LR, Rygaard J, Nielsen BS, Danø K, Rømer J, et al. Reduced metastasis of transgenic mammary cancer in urokinase-deficient mice. Int J Cancer. 2005;113:525–32. doi: 10.1002/ijc.20631. [DOI] [PubMed] [Google Scholar]
- 29.Shapiro RL, Duquette JG, Roses DF, Nunes I, Harris MN, Kamino H, et al. Induction of primary cutaneous melanocytic neoplasms in urokinase-type plasminogen activator (uPA)-deficient and wild-type mice: cellular blue nevi invade but do not progress to malignant melanoma in uPA-deficient animals. Cancer Res. 1996;56:3597–604. [PubMed] [Google Scholar]
- 30.Sabapathy KT, Pepper MS, Kiefer F, Möhle-Steinlein U, Tacchini-Cottier F, Fetka I, et al. Polyoma middle T-induced vascular tumor formation: the role of the plasminogen activator/plasmin system. J Cell Biol. 1997;137:953–63. doi: 10.1083/jcb.137.4.953. [DOI] [PMC free article] [PubMed] [Google Scholar]
- 31.Praus M, Collen D, Gerard RD. Both u-PA inhibition and vitronectin binding by plasminogen activator inhibitor 1 regulate HT1080 fibrosarcoma cell metastasis. Int J Cancer. 2002;102:584–91. doi: 10.1002/ijc.10767. [DOI] [PubMed] [Google Scholar]
- 32.Stamatakos M, Palla V, Karaiskos I, Xiromeritis K, Alexiou I, Pateras I, et al. Cell cyclins: triggering elements of cancer or not? World J Surg Oncol. 2010;8:111–114. doi: 10.1186/1477-7819-8-111. [DOI] [PMC free article] [PubMed] [Google Scholar]
- 33.Donnellan R, Chetty R. Cyclin E in human cancers. FASEB J. 1999;13:773–80. doi: 10.1096/fasebj.13.8.773. [DOI] [PubMed] [Google Scholar]
- 34.Malumbres M, Barbacid M. Cell cycle, CDKs and cancer: a changing paradigm. Nat Rev Cancer. 2009;9:153–66. doi: 10.1038/nrc2602. [DOI] [PubMed] [Google Scholar]
- 35.Slingerland J, Pagano M. Regulation of the cdk inhibitor p27 and its deregulation in cancer. J Cell Physiol. 2000;183:10–7. doi: 10.1002/(SICI)1097-4652(200004)183:1<10::AID-JCP2>3.0.CO;2-I. [DOI] [PubMed] [Google Scholar]
- 36.Viglietto G, Motti ML, Fusco A. Understanding p27(kip1) deregulation in cancer: down-regulation or mislocalization. Cell Cycle. 2002;1:394–400. doi: 10.4161/cc.1.6.263. [DOI] [PubMed] [Google Scholar]
- 37.Nho RS, Sheaff RJ. p27kip1 contributions to cancer. Prog Cell Cycle Res. 2003;5:249–59. [PubMed] [Google Scholar]
- 38.Coqueret O. New roles for p21 and p27 cell-cycle inhibitors: a function for each cell compartment? Trends Cell Biol. 2003;13:65–70. doi: 10.1016/s0962-8924(02)00043-0. [DOI] [PubMed] [Google Scholar]
- 39.Romanov VS, Pospelov VA, Pospelova TV. Cyclin-dependent kinase inhibitor p21(Waf1): contemporary view on its role in senescence and oncogenesis. Biochemistry. 2012;77:575–84. doi: 10.1134/S000629791206003X. [DOI] [PubMed] [Google Scholar]
- 40.Sheaff RJ, Groudine M, Gordon M, Roberts JM, Clurman BE. Cyclin E-CDK2 is a regulator of p27Kip1. Genes Dev. 1997;11:1464–78. doi: 10.1101/gad.11.11.1464. [DOI] [PubMed] [Google Scholar]
- 41.Duffy MJ. Urokinase plasminogen activator and its inhibitor, PAI-1, as prognostic markers in breast cancer: from pilot to level 1 evidence studies. Clin Chem. 2002;48:1194–97. [PubMed] [Google Scholar]
- 42.Ewen ME. p53-dependent repression of cdk4 synthesis in transforming growth factor-beta-induced G1 cell cycle arrest. J Lab Clin Med. 1996;128:355–60. doi: 10.1016/s0022-2143(96)80006-0. [DOI] [PubMed] [Google Scholar]
- 43.Samarakoon R, Higgins PJ. Integration of non-SMAD and SMAD signaling in TGF-beta1-induced plasminogen activator inhibitor type-1 gene expression in vascular smooth muscle cells. Thromb Haemost. 2008;100:976–83. [PMC free article] [PubMed] [Google Scholar]
- 44.Nagamine Y. Transcriptional regulation of the plasminogen activator inhibitor type 1-- with an emphasis on negative regulation. Thromb Haemost. 2008;100:1007–13. [PubMed] [Google Scholar]
- 45.Eljuga D, Razumovic JJ, Bulic K, Petrovecki M, Draca N, Bulic SO. Prognostic importance of PAI-1 in node negative breast cancer patients--results after 10 years of follow up. Pathol Res Pract. 2011 May 15;207(5):290–4. doi: 10.1016/j.prp.2011.02.008. [DOI] [PubMed] [Google Scholar]
- 46.Smith R, Xue A, Gill A, Scarlett C, Saxby A, Clarkson A, Hugh T. High expression of plasminogen activator inhibitor-2 (PAI-2) is a predictor of improved survival in patients with pancreatic adenocarcinoma. World J Surg. 2007 Mar;31(3):493–502. doi: 10.1007/s00268-006-0289-9. discussion 503. [DOI] [PubMed] [Google Scholar]
- 47.Becker M, Szarvas T, Wittschier M, vom Dorp F, Tötsch M, Schmid KW, et al. Prognostic impact of plasminogen activator inhibitor type 1 expression in bladder cancer. Cancer. 2010;116:4502–12. doi: 10.1002/cncr.25326. [DOI] [PubMed] [Google Scholar]
- 48.Kobayashi H, Fujishiro S, Terao T. Impact of urokinase-type plasminogen activator and its inhibitor type 1 on prognosis in cervical cancer of the uterus. Cancer Res. 1994;54:6539–48. [PubMed] [Google Scholar]
- 49.Tee YT, Wang PH, Tsai HT, Lin LY, Lin HT, Yang SF, et al. Genetic polymorphism of urokinase-type plasminogen activator is interacting with plasminogen activator inhibitor-1 to raise risk of cervical neoplasia. J Surg Oncol. 2012;106:204–8. doi: 10.1002/jso.23072. [DOI] [PubMed] [Google Scholar]
- 50.Eck M, Schmausser B, Scheller K, Brändlein S, Müller-Hermelink HK. Pleiotropic effects of CXC chemokines in gastric carcinoma: differences in CXCL8 and CXCL1 expression between diffuse and intestinal types of gastric carcinoma. Clin Exp Immunol. 2003;134:508–15. doi: 10.1111/j.1365-2249.2003.02305.x. [DOI] [PMC free article] [PubMed] [Google Scholar]
- 51.Gomes-Giacoia E, Miyake M, Goodison S, Rosser CJ. Targeting plasminogen activator inhibitor-1 inhibits angiogenesis and tumor growth in a human cancer xenograft model. Mol Can Ther. 2013 Sep 26; doi: 10.1158/1535-7163.MCT-13-0500. [DOI] [PMC free article] [PubMed] [Google Scholar]
Associated Data
This section collects any data citations, data availability statements, or supplementary materials included in this article.