Abstract
Mitochondria are integral components of cellular calcium (Ca2+) signaling. Calcium stimulates mitochondrial adenosine 5′-triphosphate production, but can also initiate apoptosis. In turn, cytoplasmic Ca2+ concentrations are regulated by mitochondria. Although several transporter and ion-channel mechanisms have been measured in mitochondria, the molecules that govern Ca2+ movement across the inner mitochondrial membrane are unknown. We searched for genes that regulate mitochondrial Ca2+ and H+ concentrations using a genome-wide Drosophila RNA interference (RNAi) screen. The mammalian homolog of one Drosophila gene identified in the screen, Letm1, was found to specifically mediate coupled Ca2+/H+ exchange. RNAi knockdown, overexpression, and liposome reconstitution of the purified Letm1 protein demonstrate that Letm1 is a mitochondrial Ca2+/H+ antiporter.
Mitochondrial Ca2+ uptake across the inner mitochondrial membrane occurs via tightly regulated channels [e.g., MCU/MiCa (1, 2) and transporters (3-6)]. Increases in the concentration of calcium ([Ca2+]) in the mitochondrial matrix enhance the activities of adenosine 5′-triphosphate (ATP) synthase and enzymes in the tricarboxylic acid cycle (7, 8), but if homeostatic mechanisms fail, high levels of matrix Ca2+ induce cell death (9, 10). We set out to identify the genes that mediate Ca2+ flux across the inner mitochondrial membrane.
We conducted a genome-wide, high-throughput RNA interference (RNAi) screen to identify genes that control mitochondrial Ca2+ transport. Drosophila S2 cells stably expressing mitochondria-targeted ratiometric pericam were incubated with arrayed double-stranded RNAs (dsRNAs) against each of the ~22,000 Drosophila genes (11). Mitochondrial (Mt)-pericam emission due to excitation at 405 nm is sensitive to changes in [Ca2+], whereas emission in response to excitation at 488 nm independently reports changes in pH (figs. S1 and S2). Through a series of screens discussed in the supporting online material (SOM) (fig. S2 and tables S1 to S3), CG4589, the Drosophila homolog of the human gene Letm1, was identified as a gene strongly affecting [Ca2+]mito and [H+]mito responses. Mammalian uncoupling proteins (UCPs) were recently proposed to be critical for Ca2+mito uptake (12) [but see (13)]. However, dsRNAs against Drosophila mitochondrial UCPs did not affect [Ca2+]mito and [H+]mito changes in our screen and subsequent assays (fig. S4).
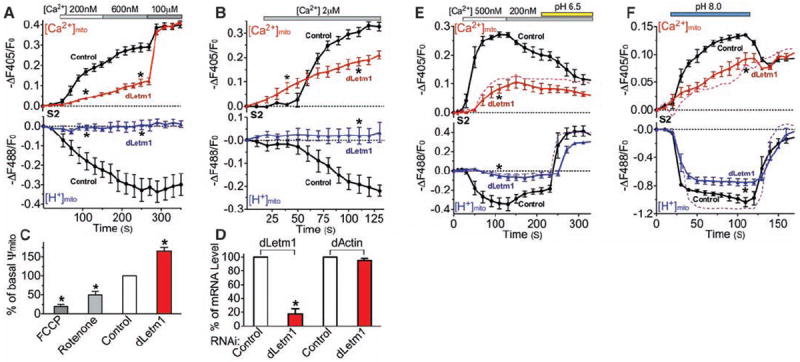
Extramitochondrial [Ca2+] was clamped in permeabilized S2 cells in Na+-free intracellular solution to abrogate potential mitochondrial Na+ (/H+ or /Ca2+) exchangers. Basal [Ca2+]mito and [H+]mito were similar in control and dLetm1 knockdown cells under this condition (fig. S5). dLetm1 knockdown markedly reduced Ca2+mito uptake at <1 μM [Ca2+]cyto, a transport mode coupled with mitochondrial H+ extrusion (Fig. 1A). Free [Ca2+]mito at steady state was ~5 μM, far below the calculated free [Ca2+]mito equilibrium (~1 M, assuming 1 μM cytoplasmic [Ca2+]), indicating an intrinsic limit for this mode of uptake. At [Ca2+]cyto >1 μM, a dLetm1-independent Ca2+mito uptake mode became apparent (Fig. 1B). This rapid Ca2+mito uptake mode stimulated by higher [Ca2+]cyto was not associated with H+mito extrusion and caused membrane depolarization, consistent with MCU/MiCa. dLetm1 knockdown had little effect on 100 μM [Ca2+]cyto-induced Ca2+mito influx (Fig. 1A).
Fig. 1.

dLetm1 knockdown reduces Ca2+/H+ antiport. (A) [Ca2+]mito (upper panel) and [H+]mito (lower panel) measurements in digitonin-permeabilized S2-pericam cells treated with scrambled control (circles; n = 6, 194 cells) or dLetm1 dsRNAs (triangles; n = 6, 167 cells). (B) Experiment as in (A), but with 2 μMCa2+ applied to cells treated with scrambled control (circles; n = 4, 93 cells) or dLetm1 dsRNAs (triangles; n = 4, 81 cells). (C) Transmitochondrial voltage (Ψmito; measured with 5 nM TMRM) in control S2-pericam cells was reduced by the ETC inhibitors rotenone and antimycin (5 μM, n = 3, 81 cells) or by the protonophore trifluoromethoxy carbonyl cyanide phenylhydrazone (FCCP; 10 μM, n = 3, 102 cells). By contrast, Ψmito was increased in dLetm1 knockdown cells (n = 3, 113 cells) as compared to cells treated with scrambled control dsRNA (n = 3, 168 cells). (D) Relative mRNA level of dLetm1 and actin in control and dLetm1 dsRNA-treated S2 cells by quantitative reverse transcription–polymerase chain reaction (RT-PCR) (n =3). (E) Ca2+- and pH gradient–driven [Ca2+]mito and [H+]mito changes in permeabilized S2-pericam cells treated with control (circles; n = 4, 143 cells) or dLetm1 dsRNAs (triangles; n = 4, 113 cells). A representative trace shows the effect of applying the H+/K+ antiporter nigericin (1 μM, dashed colored line) on dLetm1 dsRNA-treated cells (n = 3, 87 cells). (F) pH-dependent [Ca2+]mito and [H+]mito changes in permeabilized S2-pericam cells treated with scrambled control (circles; n = 6, 214 cells) or dLetm1 dsRNAs (triangles; n = 6, 187 cells). BAPTA-maintained test solution [Ca2+] = 50 nM. A representative trace shows the effect of nigericin (1 μM, dotted line) on dLetm1 dsRNA-treated cells (n = 3, 104 cells). All data shown are the mean ± SEM (*P < 0.05, two-tailed Student’s t test).
Ca2+mito uptake in cells lacking dLetm1 was not coupled with H+mito extrusion. We measured voltage across the inner mitochondrial membrane (Ψmito) using tetramethyl rhodamine methyl ester (TMRM; 5 nM) to determine whether dLetm1 knockdown affected electron transport chain (ETC)–dependent proton export. Unlike ETC inhibitors that reduce Ψmito in control cells, resting Ψmito was increased in dLetm1-knockdown cells (Fig. 1, C and D). To summarize the results thus far, dLetm1 is crucial to Ca2+mito uptake in low [Ca2+], and the pH gradient appears to intrinsically limit dLetm1-associated mitochondrial Ca2+ uptake.
To test the apparent limitation by the pH gradient, we studied pH-dependent changes on [Ca2+]mito and [H+]mito. Ca2+mito extrusion and H+ mito influx were induced by a decline in [Ca2+]cyto, and by cytoplasmic acidification (Fig. 1E). dLetm1 knockdown specifically abolished Ca2+-dependent pH changes and pH-driven Ca2+mito extrusion. As expected, alkalinization induced an initial phase of rapid Ca2+mito uptake and H+mito extrusion, and a much slower second phase of Ca2+mito uptake and H+mito extrusion (Fig. 1F). The pH-dependent Ca2+mito uptake was slowed by more than fourfold in dLetm1 knockdown cells. In the yeast mdm38 (homolog of Letm1 and CG4589) mutant, mitochondria were swollen and the phenotype could be rescued by the exogenous K+/H+ exchanger, nigericin (14). In these studies, however, active mitochondrial K+/H+ exchange was only observed under low-divalent or divalent-free conditions (14). In our experiments in dLetm1 knockdown S2 cells, application of nigericin augmented H+ flux (Fig. 1, E and F), but did not rescue the loss of pH-driven Ca2+ exchange.
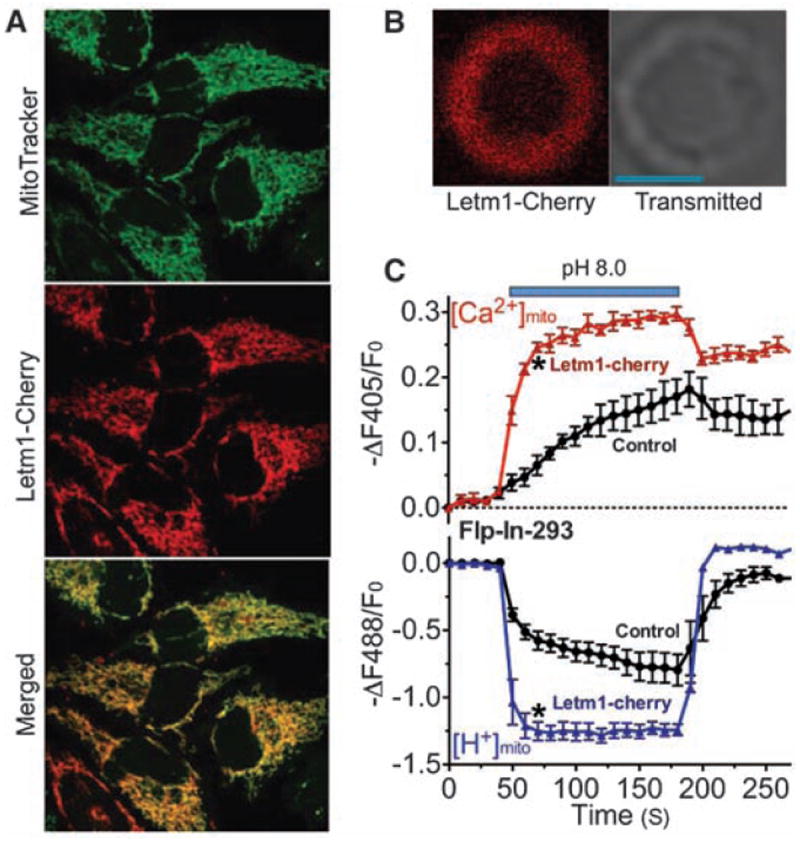
The human homolog of CG4589, Letm1 (leucine zipper EF-hand–containing transmembrane protein 1), is an evolutionarily conserved, ubiquitously expressed, homomeric inner mitochondrial membrane protein of unclear function (15-18). In humans, partial deletion of the short arm of chromosome 4 (including Letm1) results in Wolf-Hirschhorn syndrome (WHS), characterized by mental retardation, microcephaly, seizures, hypotonia, and cleft lip/palate (19). In mammalian cells, Cherry-tagged Letm1 was exclusively localized to the mitochondrial inner membrane (Fig. 2, A and B). In cells overexpressing Letm1, pH-driven Ca2+mito uptake and H+mito extrusion were accelerated by more than fivefold (Fig. 2C). Mitochondrial H+ transport was not secondary to [Ca2+]mito alone, but rather to the Ca2+ gradient across the inner mitochondrial membrane (fig. S6).
Fig. 2.

Letm1 overexpression enhances Ca2+/H+ antiport. (A) Letm1 is localized to mitochondria. Representative images of Flp-In-293-pericam cells transfected with Letm1-Cherry and loaded with 10 nM MitoTracker green. (B) Representative image of a Letm1-Cherry–labeled mitoplast; Letm1-Cherry was targeted to the mitochondrial inner membrane. Scale bar: 2 μm. (C) Alkaline pH (pH 8.0) increased [Ca2+]mito and decreased [H+]mito in digitonin-permeabilized Flp-In-293-pericam cells in vector controls (circles; n = 5, 119 cells). Overexpression of Letm1-Cherry (triangles; n = 5, 93 cells) enhanced these changes. [Ca2+]o = 250 nM. Data shown are the mean ± SEM (*P < 0.05, two-tailed Student’s t test).
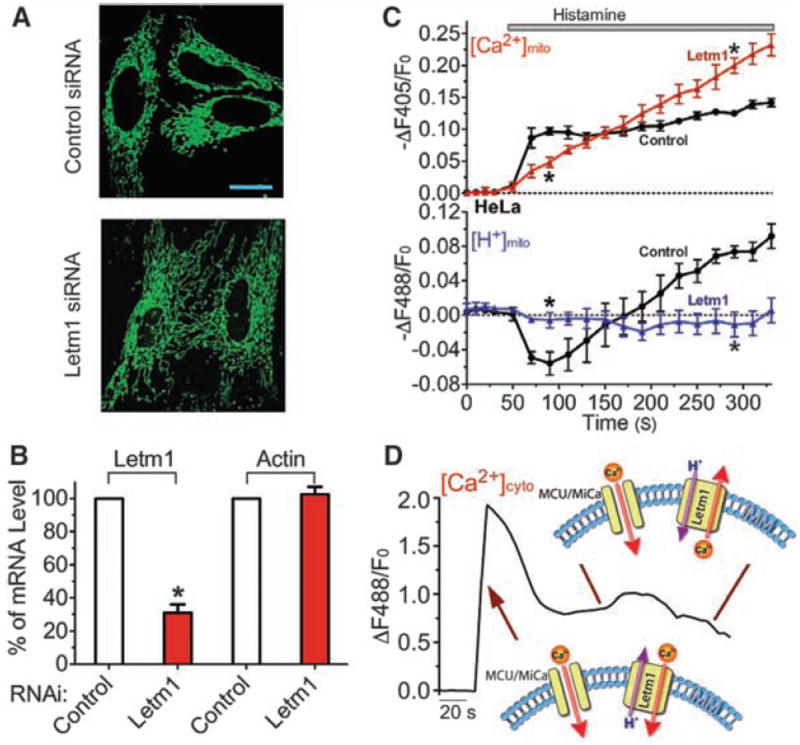
Most HeLa cells with short-term (~3 days) Letm1 small interfering RNA (siRNA) treatment appeared healthy and their mitochondria appeared normal under light microscopy (Fig. 3A), despite an ~70% reduction in mRNA level (Fig. 3B). Knockdown of Letm1 abolished bidirectional mitochondrial Ca2+/H+ antiport, resulting in reduced initial Ca2+mito uptake and late Ca2+mito overload (Fig. 3, C and D), supporting the essential role of Letm1 in Ca2+/H+ antiporter function and [Ca2+]mito homeostasis. As in S2 cells, knockdown of Letm1 did not cause a decrease, but rather a slight increase, in resting Ψmito (fig. S7), consistent with a previous report that Letm1 knockdown does not impair ETC function (17).
Fig. 3.

Letm1 knockdown disrupts Ca2+/H+ antiport in intact cells. (A) mt-Pericam–labeled mitochondria appear grossly normal in a representative image of Letm1 siRNA-treated HeLa cells compared to cells treated with scrambled control siRNA. Scale bar: 20 μm. (B) Determination of the mRNA level of Letm1 and actin in control and Letm1 siRNA-treated HeLa cells by quantitative RT-PCR (n = 3). (C) Letm1 knockdown disturbs normal mitochondrial [Ca2+]mito and [H+]mito regulation in H1R-expressing HeLa cells. Histamine was applied to stimulate an increase in cytoplasmic [Ca2+] in cells in [Ca2+]o = 2 mM treated with control (circles; n = 8, 76 cells) or Letm1 siRNAs (triangles; n = 6, 47 cells). Two independent Letm1 siRNAs were used to confirm the result. (D) Representative trace of the [Ca2+]cyto changes in HeLa cells upon histamine stimulation, and model of the roles of MCU/MiCa and Letm1 Ca2+/H+ exchanger activity under these conditions (arrows indicate their actions during the trace). All data shown are the mean ± SEM (*P < 0.05, two-tailed Student’s t test).
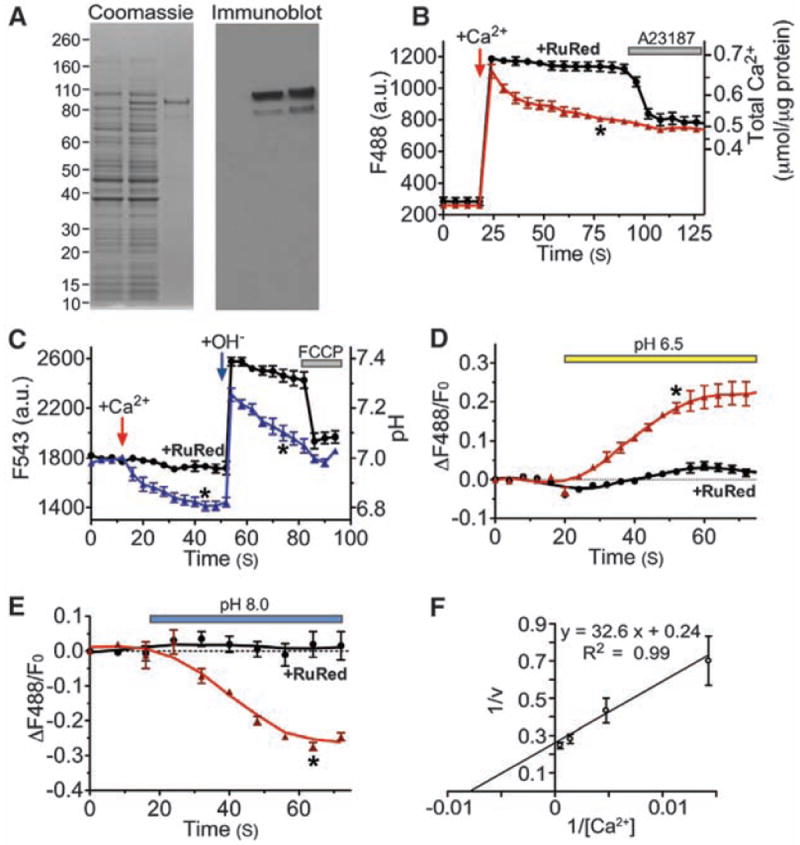
To directly test whether the Letm1 protein mediates Ca2+/H+ antiport, C-terminal His-tagged Letm1 was expressed in bacteria, purified (Fig. 4A), and incorporated into liposomes. Letm1-containing liposomes rapidly accumulated Ca2+. Ca2+ uptake was blocked by Ruthenium red (and Ru360), nonselective inhibitors of divalent cation channels and transporters (Fig. 4B). CGP-37157 (~4 μM), a nonselective inhibitor of Na+/Ca2+ exchangers, inhibited the transport rate by ~25%. Addition of Ca2+ induced H+ efflux; also transiently increasing external pH induced rapid H+ efflux from Letm1-liposomes (Fig. 4C). In symmetrical [Ca2+], external acidic pH drove Ca2+ release (Fig. 4D), whereas alkaline pH induced Ca2+ uptake (Fig. 4E). The maximum rate of Ca2+ transport (Vmax) by isolated Letm1 protein was 4.1 nmol/μg protein per second [~1700 ions per second, assuming that Letm1 is tetrameric (22, 23)], reaching half-saturation at 132.7 nmol Ca2+/μg protein; Michaelis constant (Km) = 137 nmol Ca2+/μg protein (Fig. 4F). Ca2+ transport velocity was increased about sevenfold by increasing the transliposomal potential (fig. S8), suggesting that Letm1 is electrogenic. These results, using isolated Letm1-containing liposomes, strongly suggest that Letm1 itself comprises a Ca2+/H+ antiporter.
Fig. 4.

Purified Letm1 reconstitutes Ca2+ transport in liposomes. (A) Letm1 protein stained by Coomassie blue (left) and antibody to His-Letm1 (right). Left lane, total bacterial cell lysate from control; middle lanes, Letm1-His–expressing bacteria; right lanes, isolated Letm1-His proteins. The band migrating at ~83 kD is consistent with Letm1’s predicted molecular size. (B) Ca2+ addition initially increased external Ca2+, followed by Ca2+ import as indicated by decreasing fluorescence (triangles; n = 8). Ca2+ uptake was blocked by Ruthenium red (RuR; 10 nmol/μg; circles; n = 5), which was reversed by the Ca2+ ionophore, A23187 (5 μM). Liposomes occupied ~30% of the total volume based on the maximum Ca2+ uptake triggered by 4-Bromo-A23187. No leak was detected in liposomes without Letm1. (C) Ca2+-driven H+ efflux in Letm1 proteoliposomes. Addition of 100 μM Ca2+ triggered H+ efflux; application of 100 μM CsOH transiently increased the external pH, followed by a rapid decline in pH (triangles; n = 5), which was blocked by RuR (10 nmol/μg; circles; n = 3). Finally, FCCP (10 μM, protonophore) reduced the external pH to basal levels. (D and E) pH-driven Ca2+ uptake in Letm1 proteoliposomes; Ca2+ release or uptake in Letm1 proteoliposomes was blocked by RuR. No-added-RuR, triangles, n = 4; 10 nmol/μg RuR, circles, n = 3. (F) The inverse Ca2+ transport velocity (1/v; nmol/μg protein per second) was plotted against inverse total added [Ca2+] (nmol/μg protein, n = 3 to 8) in this double reciprocal plot to calculate Km (137 nmol Ca2+/μg protein) and Vmax (4.2 nmol/μg protein per second) using Michaelis-Menten assumptions (24). All data shown are the mean ± SEM (*P < 0.05 in a two-tailed Student’s t test).
We showed that Letm1 is a Ca2+/H+ exchanger in S2 cells, mammalian cells, and as an isolated protein in proteoliposomes. Letm1 exchanges Ca2+ for H+ at submicromolar [Ca2+]cyto. When [Ca2+]mito is high, such as after MCU/MiCa activation, or when cytoplasmic pH is low, Letm1 should extrude excess Ca2+ and acidify the mitochondrial matrix. When [Ca2+]mito is low, Ca2+ will be imported and the mitochondrial matrix alkalinized. Letm1 Ca2+/H+ exchange was not sensitive to [Na+]. Prior evidence for Na+-dependent Ca2+ extrusion suggests that a third molecule, probably a Na+/ Ca2+ exchanger, is also present in the inner mitochondrial membrane (1, 4, 5). We speculate that the relative amounts of these three Ca2+-exchange mechanisms vary in different cell types, correlating with their cell-specific functions.
We found that long-term Letm1 knockdown with repetitive siRNA application resulted in morphological changes in certain HeLa cell subpopulations (~20% cells). However, other studies showed no mitochondrial morphology changes in lymphoblastoid cells and primary fibroblasts from WHS patients despite a notable reduction in the amount of Letm1 protein (17). These data suggest that mitochondrial morphology changes are secondary to the loss of Letm1, but may depend on cell type.
Letm1 has no appreciable homology to the bacterial and plant CaX family of Ca2+/H+ or Ca2+/ Na+ transporters. Based on our preliminary analysis of the potential topologies using Robetta (fig. S9) (20), we hypothesize that Letm1 resembles the inner mitochondrial membrane Mg2+ transporter (21), whose bacterial homolog (CorA) forms a funnel-shaped structure (22, 23).
Supplementary Material
Acknowledgments
We thank B. Mathey-Prevot, N. Ramadan, M. Booker, and staff at the Drosophila RNAi Screening Center for assistance with the screen; A. Miyawaki for pericam; R. Tsien for CherryFP; T. Schwarz for the PMK33 vector; R. Kaplan for advice on the proteoliposome study; D. Baker for assistance with Robetta; and G. Krapivinsky, Y. Kirichok, and J. Jin for discussions. D.J. is a recipient of fellowship awards from the Canadian Institutes of Health Research and the Alberta Heritage Foundation for Medical Research.
Footnotes
Supporting Online Material
www.sciencemag.org/cgi/content/full/326/5949/144/DC1
SOM Text
Materials and Methods
Figs. S1 to S9
Tables S1 to S3
References and Notes
- 1.Rizzuto R, Bernardi P, Pozzan T. J Physiol. 2000;529:37. doi: 10.1111/j.1469-7793.2000.00037.x. [DOI] [PMC free article] [PubMed] [Google Scholar]
- 2.Kirichok Y, Krapivinsky G, Clapham DE. Nature. 2004;427:360. doi: 10.1038/nature02246. [DOI] [PubMed] [Google Scholar]
- 3.Gunter KK, Gunter TE. J Bioenerg Biomembr. 1994;26:471. doi: 10.1007/BF00762732. [DOI] [PubMed] [Google Scholar]
- 4.Bernardi P. Physiol Rev. 1999;79:1127. doi: 10.1152/physrev.1999.79.4.1127. [DOI] [PubMed] [Google Scholar]
- 5.Demaurex N, Poburko D, Frieden M. Biochim Biophys Acta. 2009;1787:1383. doi: 10.1016/j.bbabio.2008.12.012. [DOI] [PubMed] [Google Scholar]
- 6.Nicholls DG. Biochim Biophys Acta. 2008;1777:550. doi: 10.1016/j.bbabio.2008.03.014. [DOI] [PMC free article] [PubMed] [Google Scholar]
- 7.Szabadkai G, Duchen MR. Physiology (Bethesda) 2008;23:84. doi: 10.1152/physiol.00046.2007. [DOI] [PubMed] [Google Scholar]
- 8.Hajnoczky G, Robb-Gaspers LD, Seitz MB, Thomas AP. Cell. 1995;82:415. doi: 10.1016/0092-8674(95)90430-1. [DOI] [PubMed] [Google Scholar]
- 9.Rasola A, Bernardi P. Apoptosis. 2007;12:815. doi: 10.1007/s10495-007-0723-y. [DOI] [PubMed] [Google Scholar]
- 10.Giacomello M, Drago I, Pizzo P, Pozzan T. Cell Death Differ. 2007;14:1267. doi: 10.1038/sj.cdd.4402147. [DOI] [PubMed] [Google Scholar]
- 11.Ramadan N, Flockhart I, Booker M, Perrimon N, Mathey-Prevot B. Nat Protocols. 2007;2:2245. doi: 10.1038/nprot.2007.250. [DOI] [PubMed] [Google Scholar]
- 12.Trenker M, Malli R, Fertschai I, Levak-Frank S, Graier WF. Nat Cell Biol. 2007;9:445. doi: 10.1038/ncb1556. [DOI] [PMC free article] [PubMed] [Google Scholar]
- 13.Brookes PS, et al. Nat Cell Biol. 2008;10:1235. doi: 10.1038/ncb1108-1235. [DOI] [PMC free article] [PubMed] [Google Scholar]
- 14.Nowikovsky K, Reipert S, Devenish RJ, Schweyen RJ. Cell Death Differ. 2007;14:1647. doi: 10.1038/sj.cdd.4402167. [DOI] [PubMed] [Google Scholar]
- 15.Piao L, et al. Cancer Res. 2009;69:3397. doi: 10.1158/0008-5472.CAN-08-3235. [DOI] [PubMed] [Google Scholar]
- 16.Tamai S, et al. J Cell Sci. 2008;121:2588. doi: 10.1242/jcs.026625. [DOI] [PubMed] [Google Scholar]
- 17.Dimmer KS, et al. Hum Mol Genet. 2008;17:201. doi: 10.1093/hmg/ddm297. [DOI] [PubMed] [Google Scholar]
- 18.Hasegawa A, van der Bliek AM. Hum Mol Genet. 2007;16:2061. doi: 10.1093/hmg/ddm154. [DOI] [PubMed] [Google Scholar]
- 19.Bergemann AD, Cole F, Hirschhorn K. Trends Genet. 2005;21:188. doi: 10.1016/j.tig.2005.01.008. [DOI] [PubMed] [Google Scholar]
- 20.Kim DE, Chivian D, Baker D. Nucleic Acids Res. 2004;32:W526. doi: 10.1093/nar/gkh468. [DOI] [PMC free article] [PubMed] [Google Scholar]
- 21.Schindl R, Weghuber J, Romanin C, Schweyen RJ. Biophys J. 2007;93:3872. doi: 10.1529/biophysj.107.112318. [DOI] [PMC free article] [PubMed] [Google Scholar]
- 22.Lunin VV, et al. Nature. 2006;440:833. doi: 10.1038/nature04642. [DOI] [PMC free article] [PubMed] [Google Scholar]
- 23.Eshaghi S, et al. Science. 2006;313:354. doi: 10.1126/science.1127121. [DOI] [PubMed] [Google Scholar]
- 24.Materials and methods and references are given in the supporting material available on Science Online.
Associated Data
This section collects any data citations, data availability statements, or supplementary materials included in this article.


