

Abstract
Current drug-safety assays for hepatotoxicity rely on biomarkers with low predictive power. The production of radical species, specifically reactive oxygen species (ROS) and reactive nitrogen species (RNS), has been proposed as an early unifying event linking the bioactivation of drugs to hepatotoxicity and as a more direct and mechanistic indicator of hepatotoxic potential. Here we present a nanosensor for rapid, real-time in vivo imaging of drug-induced ROS and RNS for direct evaluation of acute hepatotoxicity. By combining fluorescence resonance energy transfer (FRET) and chemiluminescence resonance energy transfer (CRET), our semiconducting polymer–based nanosensor simultaneously and differentially detects RNS and ROS using two optically independent channels. Drug-induced hepatotoxicity and its remediation are imaged longitudinally in mice following systemic challenge with acetaminophen or isoniazid. Dose-dependent ROS and RNS activity is detected in the liver within minutes of drug challenge, preceding histological changes, protein nitration and DNA double strand break induction.
Drug toxicity is a long-standing concern of modern medicine1, with an annual estimate of 750,000 emergency department visits in the US due to unintentional drug toxicity2. The liver is the most frequently affected organ, and its failure can result in mortality 3,4. Drug-induced hepatotoxicity is also the single most important cause of both United States Food and Drug Administration (FDA) non-approval and withdrawal from the market after approval. Reducing hepatotoxicity during drug development may be possible with innovative pre-clinical hepatotoxicity screening methods3,5–7. Pre-clinical interrogation of drug hepatotoxicity may also have added benefits in improving patient safety and therapeutic outcomes6,8.
In the liver, drugs undergo enzymatic biotransformation, which enhances metabolite hydrophilicity and clearance from the body4,9,10. However, biotransformation can also generate reactive radicals or reactive electrophiles through one- or two-electron oxidation reactions, respectively10. Because reactive metabolite formation is necessary for most drug-induced hepatotoxicity, it is highly desirable to identify drug candidates that avoid bioactivation4,11,12. Reactive metabolites are short-lived and typically have half-lives of less than a second, precluding their detection in plasma and necessitating in situ detection at their sites of formation4. Electrophilic reactive metabolites have been used as a measure of drug hepatotoxicity because of the ease of detecting their covalent binding to endogenous nucleophiles (i.e. protein, glutathione)4,10. However, electrophiles are a poor predictor of the hepatotoxic potential of the parent drug molecule4, and do not represent a mechanistic link between the administered drug and toxic outcome7,10,11,13.
Reactive oxygen species (ROS) and reactive nitrogen species (RNS) may offer an alternative, superior biomarker of safety10,14,15. ROS, including hydrogen peroxide (H2O2), can be generated directly by oxidative Phase I enzymes (e.g. cytochrome P450, peroxidase) during metabolism10 or indirectly by the reaction of radical drug metabolites with oxygen10. RNS, such as peroxynitrite (ONOO−), are the result of drug metabolite–induced mitochondrial toxicity caused by disruption of the electron transport chain10,14. Because ROS and RNS have distinct sources of production, their simultaneous detection could contribute additional insights into the mechanism of drug-induced hepatotoxicity in vivo.
Methods to detect these radical species even individually have encountered technical challenges, preventing their implementation for pre-clinical drug safety screening3,10. We previously synthesized semiconducting polymer nanoparticles (SPNs) for deep tissue tumor imaging16 and for in vivo detection of RNS in the context of systemic bacterial infection17. Here we combined optical molecular imaging with rationally designed liver-targeted SPNs to detect ONOO− and H2O2 simultaneously in the liver of living mice and in real time. We demonstrated this approach to monitor in vivo hepatotoxicity caused by two widely used drugs: the analgesic and anti-pyretic acetaminophen (APAP) and the anti-tuberculosis agent isoniazid (INH).
Results
Design of CF-SPN and Sensing Mechanism
We employed two matrix polymers and two sensing moieties to engineer two channels of optical detection into the SPN (Fig. 1a): chemiluminescence for detection of H2O2, and fluorescence for detection of ONOO− and hypochlorite (−OCl) (Fig. 1b). A chemiluminescent substrate was incorporated into the conjugated polymer matrix of the SPN, allowing for the detection of H2O2 without external light excitation via chemiluminescence resonance energy transfer (CRET)18. Fluorescence resonance energy transfer (FRET) from the SPN matrix to an oxidation-degradable fluorophore permitted ratiometric detection of ONOO− upon light excitation of the SPN matrix19. CRET and FRET are combined into the SPN and form CRET-FRET-SPN (CF-SPN).
Figure 1. Design of CF-SPN for detection of ROS and RNS.

(a) The molecular components of CF-SPN are the NIR fluorescent semiconducting polymer PFODBT (dark red), a PEG-grafted poly(styrene) copolymer conjugated to galactose for hepatocyte targeting (black), the H2O2-specific chemiluminescent substrate CPPO (light blue) that serves as CRET energy donor, and the FRET acceptor IR775S (bright green) that degrades after oxidation by ONOO− or −OCl (dark green). PFODBT serves as the CRET energy acceptor and the FRET energy donor. (b) An illustration of the mechanism of simultaneous and differential detection of ONOO− or −OCl and H2O2 by CF-SPN is shown. Following drug challenge to the liver, CF-SPN report via the chemiluminescent and fluorescent channels the generation of radical metabolites at safe (left) and toxic drug doses (right). The hydrodynamic diameter distribution of CF-SPN was determined by dynamic light scattering (c). A transmission electron micrograph of CF-SPN (scale bar = 100 nm) is shown in (d).
The matrix is composed of the near-infrared (NIR) fluorescent semiconducting polymer poly[2,7-(9,9′-dioctylfluorene)-alt-4,7-bis(thiophen-2-yl)benzo-2,1,3-thiadiazole] (PFODBT) and a galactosylated graft copolymer of poly(styrene) and poly(ethylene glycol) (PS-g-PEG-Gal) (Fig. 1a). PFODBT serves as both the FRET energy donor and the CRET energy acceptor, while PS-g-PEG-Gal targets the CF-SPN to the liver. The CF-SPNs are targeted to hepatocytes by the presentation of PEG and conjugated galactose residues, which bind the asialoglycoprotein receptor (ASGPR) expressed on the sinusoidal membrane of hepatocytes20. The fluorescence-based sensor is a cyanine dye, 2-[4′-(β-carboxyethylthio)-7′-(1″,3″,3″-trimethylindolenine)-3′,5′-trimethyleneheptatrien-1-yl]-1,3,3-trimethylindolenium (IR775S), which irreversibly decomposes in the presence of ONOO− and −OCl due to the oxidative cleavage of its polymethine linkers17,19 (Fig. 1a). FRET occurs in the absence of nitrosative species and the CF-SPN emits at both 680 nm and 820 nm following excitation of PFODBT. In the presence of ONOO− or −OCl, IR775S is irreversibly degraded and FRET is abolished, resulting in an emission enhancement at 680 nm (Fig. 1b).
The chemiluminescence-based sensor is a hydrophobic peroxyoxalate, bis-(2,4,5-trichloro-6-(pentyloxycarbonyl)phenyl)oxalate (CPPO), which rapidly and selectively decomposes in the presence of H2O2 to form the high energy 1,2-dioxetanedione intermediate known to excite nearby dye molecules to emit light18. The chemiluminescence of CF-SPNs is activated upon elevated local production of H2O2, decomposing CPPO to the high energy 1,2-dioxatanedione that subsequently induces luminescence without external excitation (Fig. 1a, b).
In Vitro Characterization of CF-SPNs
The CF-SPNs had average diameters of approximately 50 nm, as determined by dynamic light scattering and transmission electron microscopy (Fig. 1 c, d), and were spherical in shape (Fig. 1d). The UV/Vis spectrum of CF-SPNs shows the broad absorption of PFODBT (500–600 nm) and a peak at 775 nm corresponding to the ONOO−/−OCl sensing dye IR775S (Fig. 2a). Under excitation at 580 nm, fluorescence from both PFODBT (680 nm) and IR775S (820 nm) can be observed (Fig. 2b, red), indicating efficient FRET from the CF-SPN matrix (PFODBT) to IR775S. After the addition of H2O2 without any external light excitation, luminescence from both PFODBT and IR775S can be detected (Fig. 2b, blue). This result confirms the successful encapsulation of the H2O2-sensitive chemiluminescence energy donor CPPO within the CF-SPN and demonstrates efficient CRET from oxidized CPPO to the PFODBT and IR775S acceptors.
Figure 2. Spectral characterization, specificity and sensitivity of CF-SPN in vitro.

(a) The UV/Vis absorption spectrum of CF-SPN, with PFODBT maximum at 580 nm and NIR775S maximum at 775 nm. (b) Fluorescence (red) and chemiluminescence (blue) spectra of CF-SPN, indicating PFODBT and NIR775S emission maxima at 680 nm and 820 nm, respectively. Chemiluminescence was induced by the addition of 2 mM H2O2. (c) The fluorescence emission ratio of CF-SPN (1 μg/mL) in the presence of indicated ROS/RNS (6 μM). (d) The sensitivity and range of fluorescence ratiometric detection of ONOO− with CF-SPN (1 μg/mL) following 1 μM incremental additions of NaONOO. (e) The specificity of the chemiluminescent signal of CF-SPN (5 μg/mL) was determined in the presence of ROS/RNS (6 μM). (f) The chemiluminescent response of CF-SPN to varying concentrations of H2O2 was assessed. Experiments were performed with CF-SPN (1 μg/mL) in 1x PBS.
We then evaluated the specificity of CF-SPNs towards ROS and RNS under physiological conditions. We quantified the degradation of IR775S due to RNS-mediated methine oxidation by measuring the loss of FRET-induced emission at 820 nm following excitation at 580 nm and treatment of CF-SPNs with a variety of molecules (Fig. 2c). The fluorescent response of CF-SPNs was most sensitive to the presence of ONOO− and −OCl. To determine the fluorescence spectral change of CF-SPNs in response to RNS, we added ONOO− in a stepwise manner and measured the progressive loss of emission at 820 nm and concurrent gain in emission at 680 nm (Fig. 2d). The chemiluminescence response of CF-SPNs to various ROS and RNS, assessed without external light excitation (Fig. 2e), demonstrated that CRET is only detected in the presence of H2O2 and that this response linearly corresponds to environmental H2O2 (Fig. 2f). The fluorescence limit of detection of CF-SPNs is 10 nM in response to ONOO− and −OCl (Fig. 2d) and the chemiluminescence limit of detection of H2O2 is 5 nM (Fig. 2f). A prolonged generation of luminescence was observed in vitro, with a signal half-life of approximately 80 minutes (Supplementary Fig. S1a). Thus, CF-SPNs exhibit the sensitivity required to detect nanomolar changes in oxidative and nitrosative species generated during pathophysiological conditions in vivo21.
We incubated CF-SPNs in undiluted mouse serum at 37 °C and assessed fluorescence (emission ratio of 680/820 nm) and chemiluminescence over time (Supplementary Fig. S1b). There was no change in the fluorescence ratio during the first 4 hours of incubation, but we noted a gradual consumption of CPPO that reached a plateau within 2 hours, indicating that imaging should occur within 1 hour of CF-SPN administration. As optical imaging is limited by the penetration of light through tissue22, the depth of imaging penetration of CF-SPNs is critical for the interrogation of deep, absorbing tissue such as the liver. The depth of imaging penetration following incubation of CF-SPNs with H2O2 was assessed using a tissue-mimicking gel phantom composed of gelatin, hemoglobin, and intralipid23. By overlaying various thicknesses of gel phantom, the penetration of the luminescent signal from CF-SPNs was found to be at least 2.5 cm of gel depth (Supplementary Fig. S1c). Furthermore, there was no significant loss of total chemiluminescence emission from CF-SPNs upon incubation with H2O2 and various concentrations of ONOO−, supporting the independent detection of H2O2 by CF-SPNs through chemiluminescence imaging (Supplementary Fig. S1d).
In Vivo Characterization of CF-SPNs
To assess the extent of selective targeting to the liver by galactose20, we compared galactose-conjugated SPNs (Gal-SPNs) to an SPN formulation lacking targeting ligand (PEG-SPNs) and administering them to mice to determine accumulation in several tissues. Upon necropsy, we observed a selective and significant liver accumulation of Gal-SPNs relative to PEG-SPNs (Supplementary Fig. S2a), which was confirmed after quantitation of SPN fluorescence (p<0.05) (Supplementary Fig. S2b). We further confirmed the hepatocellular uptake of Gal-SPNs by ex vivo confocal microscopy 30 min following i.v. administration of nanosensors (Supplementary Fig. S2c).
The rate of CF-SPN uptake and retention in the liver was assessed by measuring the total liver fluorescence intensity (the sum of the emission at 680 nm and at 820 nm) over time in mice treated with either saline or a toxic dose of APAP (300 mg/kg) (Supplementary Fig. S3a). The uptake of CF-SPNs was independent of drug treatment with little change in CF-SPN levels in the liver over the course of imaging (80 min). The confirmation of sensor stability, good imaging depth of penetration (Supplementary Fig. S1), significant hepatic accumulation through galactose-mediated targeting (Supplementary Fig. S2), and stable nanosensor retention in liver tissues (Supplementary Fig. S3a) supports the utility of CF-SPNs for monitoring drug-induced hepatotoxicity in real time.
Since the production of −OCl requires myeloperoxidase, which is not expressed in hepatocytes, CF-SPNs likely detect ONOO− alone in models of drug-induced liver toxicity. To account for changes in the fluorescence metric (i.e. percent difference in emission at 680 nm and 820 nm) due to CF-SPN accumulation in the liver over time and the non-linear variation in imaging depth of penetration afforded to light emitted at 680 nm versus 820 nm24,25, normalization of this metric following drug treatment to that of control mice resulted in the fluorescence index for quantifying drug-induced ONOO− (see Online methods).
One of the challenges of using nanosensors to detect ROS and RNS in vivo is the potential generation of oxidative and nitrosative species by the nanosensors themselves26,27. If CF-SPNs induced the production of significant amounts of ROS or RNS in the liver, we would expect an elevated degree of baseline activation of CF-SPNs following a prior dose of Gal-SPNs relative to the saline control. However, upon pre-dosing with Gal-SPNs, neither the luminescence intensity nor the fluorescence index indicated any significant production of H2O2 or ONOO− (Supplementary Fig. 3).
Longitudinal Imaging of APAP Hepatotoxicity In Vivo
The mechanism of APAP-induced hepatotoxicity is well established and is mainly due to Phase I metabolism. An overdose of APAP can result in oxidative and nitrosative stress through the overproduction of ROS and RNS. This results in the consumption of key cellular antioxidants, such as glutathione (GSH), initiating a signaling cascade that results in necrotic cell death28,29. Thus APAP-induced hepatotoxicity serves as an ideal model of liver toxicity with which to validate CF-SPNs.
Female nude mice were administered APAP i.p., anesthetized, and fitted with tail vein catheters. Sequential fluorescent and luminescent images were acquired immediately following administration of 0.8 mg of CF-SPNs (Fig. 3), which occurred 15 min after drug administration. Chemiluminescence images clearly show a significant enhancement in signal by 18 min following the commencement of imaging with APAP overdose (300 mg/kg); however, only baseline chemiluminescence was detected following lower drug doses (75 and 150 mg/kg) (Fig. 3a). This threshold dose-type toxicity, i.e. dose-independent below a critical toxic dose, is in good agreement with the manifestation of APAP-induced hepatotoxicity in mice4,30. Although the increase in chemiluminescence following APAP overdose was sustained over the time course of imaging (Fig. 3b), our previous observation of baseline consumption of CPPO in mouse serum (Supplementary Fig. S1b) prompted us to assess the possibility of extending the H2O2 detection window with the re-administration of CF-SPNs (Supplementary Fig. S4). The re-administration of CF-SPNs produced an elevated chemiluminescence signal of approximately 50% the intensity of the initial CF-SPN injection, as compared to a nominal increase in chemiluminescence in a control animal. The data suggest that extending the period within which H2O2 can be detected is possible through re-administration of CF-SPNs, and that a significant decrease in H2O2 production occurs within 60 min of APAP administration.
Figure 3. Real-time in vivo imaging of hepatotoxicity following APAP administration to mice.

(a) Representative images of mice receiving, from left to right, 300, 150, 75 mg/kg of APAP or saline i.p., followed by CF-SPN (0.8 mg) i.v. Threshold toxicity is observed for both the chemiluminescence (top row, shown at 18 min after CF-SPN administration) and fluorescence (bottom row, shown at 53 min after CF-SPN administration) channels. The emission intensities of the liver for (b) chemiluminescence and (c) normalized fluorescent percent difference (FL Index) over time are shown. The black arrows indicate the respective time points shown in (a). Values are the mean±s.d. for n=3 mice. Representative immunohistochemistry is shown for liver (d) 45 min and (e) 180 min after drug administration. Nitrotyrosine (top) and TUNEL (bottom) staining was performed, with white arrowheads representing positive cellular or nuclear staining, respectively. Scale bars represent 10 μm.
The same threshold-dose type toxicity noted from the chemiluminescence imaging was observed in the fluorescence channel (Fig. 3a), in which an increase in the fluorescence index, correspondingly ONOO−, was observed 53 min after CF-SPN administration in mice receiving 300 mg/kg APAP. Thus, the increase in ONOO− generation with APAP overdose occurs later than the generation of H2O2 (Fig. 3c).
Histological and immunohistochemical analysis of liver tissue was performed on mice 45 min (Fig. 3d and Supplementary Fig. S5) and 180 min (Fig. 3e and Supplementary Fig. S5) following treatment with APAP. No histological changes were noted in liver tissue 45 min after drug challenge at any dose level (Supplementary Fig. S5). Likewise, no foci positive for nitrosative stress, as measured by immunohistochemistry against protein nitrotyrosyl residues, or DNA fragmentation suggesting hepatocyte cell death, as indicated by TUNEL staining, were observed at 45 min (Fig. 3d). However, 180 min following APAP administration, significant centrilobular protein nitrotyrosyl and TUNEL-positive foci, as well as hepatocellular degeneration characteristic of APAP-induced oncotic necrosis31, were observed at the 300 mg/kg dose level (Fig. 3e and Supplementary Fig. S5). Histological changes to liver tissue were not observed with lower doses of APAP, in agreement with a threshold toxic dose between 150 mg/kg and 300 mg/kg as detected by the CF-SPNs.
We compared CF-SPNs to luminol, a blue-emitting chemiluminescent reporter commonly used for H2O2 sensing32, following APAP overdose. Luminol did not produce a detectable luminescent signal when administered at an equal dose to that of CPPO encapsulated in CF-SPNs (Supplementary Fig. S6). This is likely due to the combination of high local concentration of CPPO in CF-SPNs and the efficiency of CRET to the near infrared-emitting PFODBT, resulting in a more sensitive imaging probe spectrally tuned for in vivo deep tissue imaging. Altogether, these results confirm the utility of CF-SPNs to detect early hepatotoxicity in vivo, even before the appearance of histological changes in drug-damaged tissue.
Monitoring the Modulation of APAP-Induced Hepatotoxicity In Vivo
The proposed mechanism for APAP bioactivation involves CYP450-mediated oxidation to an iminoquinone, N-acetylparaquinonimine (NAPQI), which can bind directly to cellular proteins to induce mitochondrial dysfunction and the production of superoxide (O2·−) and ONOO−, or undergo reduction by molecular oxygen to directly form O2·− and H2O2 (Fig. 4a)4,9,30. This pathway can be inhibited by administration of GSH—an antioxidant and nucleophilic scavenger of reactive metabolites (i.e. NAPQI) and ROS/RNS33, 1-aminobenzotriazole (1-ABT)—a broad spectrum suicide inhibitor of CYP450 enzymes34, and trans-1,2-dichloroethylene (t-1,2-DCE)—a specific inhibitor of CYP2E134, the CYP450 isoform responsible for the majority of Phase I metabolism of APAP30. Using CF-SPNs, we observed a reduction of chemiluminescence emission (Fig. 4b, c) and of the fluorescence index (Fig. 4d) with all three of these inhibitors, indicating the successful remediation of oxidative and nitrosative stress, respectively. However, there were differences in the magnitude and time course of remediation among the inhibitors. GSH, which has been shown to be superior to N-acetylcysteine as antidote to APAP toxicity in mice35, resulted in reduced levels of H2O2 and ONOO− production relative to mice receiving APAP alone, but still elevated relative to mice receiving either 1-ABT or t-1,2-DCE (Fig. 4c, d). Additionally, 1-ABT and t-1,2-DCE suppressed ONOO− production to the same extent (Fig. 4d), but t-1,2-DCE was able to completely prevent H2O2 production, while an intense but short-lived (<20 min after CF-SPN administration) production of H2O2 was observed following 1-ABT treatment (Fig. 4c).
Figure 4.

Longitudinal, in vivo monitoring of the remediation of APAP-induced hepatotoxicity with enzyme inhibitors and antioxidant scavengers. (a) A representation of the mechanism of APAP induced toxicity is shown, with the effects of inhibition by GSH, 1-ABT, and t-1,2-DCE;
 indicates inhibition. (b) Representative images of mice receiving, from left to right, saline, 300 mg/kg APAP i.p. alone, and 300 mg/kg APAP with GSH (200 mg/kg i.v.), 1-ABT (2×100 mg/kg i.p.), or t-1,2-DCE (0.2 mg/kg i.p.), followed by CF-SPN (0.8 mg) i.v. The emission intensities of the liver for the (c) chemiluminescence or (d) fluorescent ratiometric signals are shown over time. The black arrows indicate the respective time points shown in (a). Values are the mean±s.d. for n=3 mice.
Longitudinal Monitoring of INH Hepatotoxicity In Vivo
We next tested CF-SPNs for detecting the hepatic oxidative and nitrosative stress caused by another widely used chemotherapy agent INH (Fig. 5). INH is associated with hepatotoxicity in 3 to 13% of patients36, but its mechanism is still under debate37. It has been suggested that Phase II metabolism plays a role in INH toxicity, but new evidence implicates direct oxidation of the drug as the cause of covalent protein modifications and cellular damage37,38. Sequential fluorescence and luminescence images were acquired 15 min after i.p. INH dosing and immediately following administration of CF-SPNs. Unlike the threshold toxicity observed with APAP (Fig. 3), INH exhibited a threshold dose–type production of H2O2 but a dose-dependent enhancement of ONOO− production (Fig. 5a–c). Additionally, the kinetics of both oxidative and nitrosative stress differed significantly between APAP and INH, with INH inducing a more short-lived oxidative burst (Fig. 5b) and a more rapidly developed and sustained induction of nitrosative stress (Fig. 5c). The dose-dependent enhancement of hepatotoxicity detected by CF-SPNs correlated with prospective hepatocyte death, as indicated by cell vacuolization observed upon histological examination of liver tissues (Fig. 5d). Notably, there was a dose-dependent increase in the severity of liver cell vacuolization that more closely echoed the dose-dependent generation of ONOO− (Fig. 5c), not the threshold dose-type generation of H2O2 (Fig. 5b). These results demonstrate the applicability of CF-SPNs to the prodromal, longitudinal and in vivo monitoring of drug-induced hepatic oxidative and nitrosative stress independent of the specific mechanism of drug bioactivation (Phase I versus Phase II), and not limited to a specific drug class.
Figure 5.

Real-time in vivo imaging of dose-dependent hepatotoxicity in mice following INH administration. (a) Representative images of mice receiving, from left to right, 200, 100, 50 mg/kg INH, or saline i.p., followed by CF-SPN (0.8 mg i.v.). The emission intensities of the liver for the (b) chemiluminescence or (c) fluorescent ratiometric signals are shown over time. The black arrows indicate the respective time points shown in (a). Values are the mean±s.d. for n=3 mice. (d) Representative histology (H&E) of the liver of mice treated as in (a) is shown 180 min after drug administration, with corresponding image enlargements in the bottom row. Scale bars represent (top) 10 μm and (bottom enlargement) 2.5 μm, respectively.
Discussion
Drug-induced hepatotoxicity reduces the rate of approval of new chemical entities and plays a major role in the withdrawal of approved drugs from the market3,5–7. We have shown that our nanoparticle is capable of simultaneous and differential dual-analyte sensing using two optical channels inherently free from cross-talk, enabling in vivo and longitudinal detection of drug-induced hepatic oxidative and nitrosative stress. Moreover, the imaging results correlate with histological markers of hepatotoxicity that validate ROS and RNS as prodromal imaging biomarkers for drug safety evaluation.
While semiconducting polymers have been widely used in optoelectronic devices39,40, they possess many advantages for biomedical imaging, such as large mass extinction coefficients resulting in efficient fluorescence41, excellent acute and subacute polymer biocompatibility equivalent to FDA approved poly(lactate-co-glycolate)42, and excellent photostability, which is of particular importance to the in vivo imaging of oxidative and nitrosative species. Both quantum dots and small molecule fluorophores undergo chemical degradation by ROS and RNS, including H2O2, ONOO− and −OCl41, while SPNs are resistant to such oxidative chemical bleaching effects17,41. This characteristic makes SPNs a superior optical reporter for robust imaging of oxidative and nitrosative stress, limiting the loss of FRET or CRET to target analyte sensing instead of nanoparticle core degradation. The unique ability to simultaneously employ two optical channels (fluorescence and chemiluminescence) for dual-analyte sensing was achieved by efficient and target-specific FRET and CRET of CF-SPNs (Figs. 1 & 2). The broad absorption peak from cyan to orange wavelengths provided for efficient CRET from the H2O2 sensor CPPO (Fig. 2b, e, f), and the broad red to NIR emission range facilitated efficient FRET to IR775S in the absence of ONOO−/−OCl (Fig. 2b–d). The rapid sensing kinetics and large dynamic range of sensitivity allow CF-SPNs to detect nM to μM levels of ROS and RNS in near real time (Fig. 2), enabling the differentiation of threshold-dose type (e.g. APAP, Fig. 3) from classical dose-response (e.g. INH, Fig. 5) generation of oxidative and nitrosative stress. Of the few resonance energy transfer based nanosensors reported previously for in vivo ROS sensing, none would make a suitable alternative to CF-SPNs for hepatotoxicity imaging due to their dependence on quantum dots43, which degrade in oxidative environments 17,41, or because they must be injected locally owing to their large size (>500 nm)18. Therefore, CF-SPN has the potential to uniquely remediate current limitations in drug safety screening, and to introduce the concept of molecular imaging as a tool to study toxicology in vivo.
Current methods of hepatotoxicity screening generally employ covalent binding to biological molecules as drug safety biomarkers. These assays, however, have limited predictive power since the degree of observed covalent binding correlates poorly to the hepatotoxic potential of the parent drug4,44. CF-SPN has overcome this limitation by employing radical reactive species as safety biomarkers, which have been hypothesized to more closely correlate with toxic outcome10,14,15. The data presented here support the use of H2O2 and ONOO− as imaging biomarkers for drug safety evaluation, as: (1) only at overdose levels were there signs of oncotic necrosis, protein nitration, and DNA fragmentation characteristic of APAP hepatotoxicity (Supplementary Fig. S5 and 3d–e); (2) both H2O2 and ONOO− appear very early in the induction of liver damage and precede even histological signs of toxicity (Fig. 3d–e and Supplementary Fig. S5), a necessary requirement of an effective safety biomarker11; (3) the threshold dose-type centrilobular production of H2O2 and ONOO− (Fig. 3) following APAP overdose is in good agreement with its well-characterized mechanism of toxicity involving both oxidative and nitrosative stress4,30 and parallel the kinetics of mitochondrial protein nitration following APAP overdose described previously45. Notably, both the threshold dose-type response and the reduction in chemiluminescence emission following GSH pre-treatment are in good agreement with GSH recovery kinetics in mice46. The recovery of GSH levels occurred readily in mice treated with 75 and 150 mg/kg of APAP, however, it was not observed until 5 to 6 hours after challenge with 300 mg/kg of APAP. In support of existing literature46, our data suggest that the degree to which APAP metabolism can overwhelm endogenous GSH is a critical parameter in hepatotoxic outcome.
As products of drug metabolism, H2O2 suggests elevated production of oxygen radicals derived directly from Phase I oxidation10,28, the reaction of drug metabolites with molecular oxygen10, or the production of superoxide anion from uncoupling of the mitochondrial electron transport chain28, whereas ONOO− is more indicative of either mitochondrial dysfunction or the formation of drug-derived nitrogen radicals47,48 (Fig. 6). The value of the two-channel imaging of both oxidative and nitrosative stress provided by CF-SPNs is demonstrated when comparing APAP (Fig. 3) with INH hepatotoxicity (Fig. 5). The generation of both H2O2 and ONOO− following APAP challenge showed a threshold dose-type response and correlated with the observed hepatotoxicity. In contrast, following INH challenge, only ONOO− production showed a classical dose dependent-type response, while H2O2 exhibited threshold dose-type dependence (Fig. 5). Even though INH challenge resulted in both oxidative and nitrosative stress, the correlation of histological signs of hepatotoxicity (i.e. vacuolization) with RNS but not ROS, suggests a mechanistic role for ONOO− generation and mitochondrial dysfunction in INH hepatotoxicity in vivo. While the mechanism of INH toxicity remains incompletely characterized37,38,49, these results are supported by new evidence implicating mitochondrial impairment following INH bioactivation49,50, and by the potentiation of hepatotoxicity in humans deficient in acetylation capacity38,51.
Figure 6.
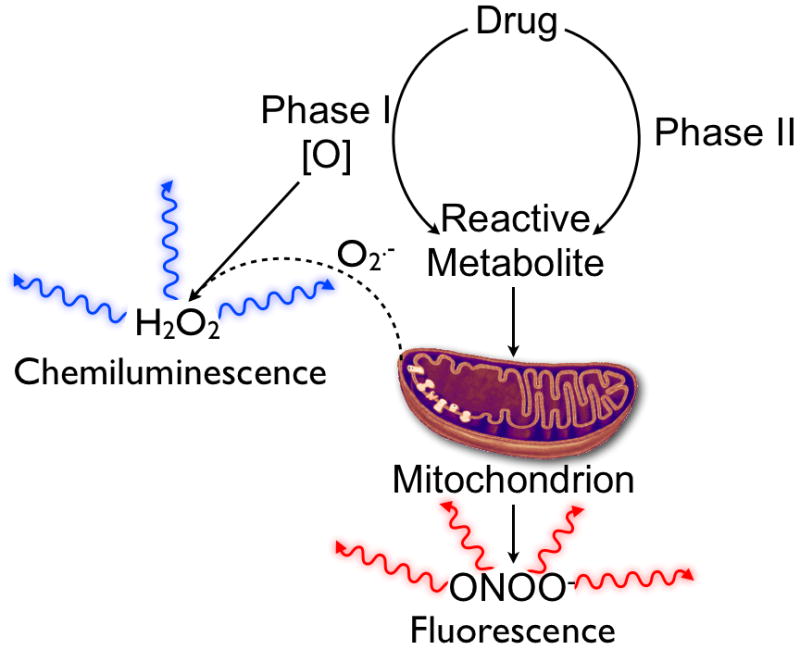
The ability of CF-SPN to differentially and simultaneously detect H2O2 and ONOO− provides mechanistic insights into parent drug bioactivation. The majority of H2O2 is produced following Phase I bioactivation, either through uncoupling of enzyme-mediated drug oxidation or through the initiation of redox cycling following oxidation of the parent drug. Strong chemiluminescence from CF-SPN suggests the involvement of Phase I bioactivation in the mechanism of drug toxicity. Conversely, the production of ONOO− is associated with mitochondrial toxicity and uncoupling of the mitochondrial electron transport chain by reactive drug metabolites. A significant increase in the FL index indicates the production the ONOO−, and suggests that drug bioactivation leads to mitochondrial dysfunction.
CF-SPN imaging for in vivo mechanistic studies of drug-induced liver toxicity may allow improvements in drug design that avoid specific pathways of bioactivation and may aid in the selection of remediation strategies for hepatotoxicity. In addition, CF-SPNs may be applied to study the etiology and pathophysiology of an array of other diseases52. For example, ROS/RNS play a role in chronic inflammatory diseases52, acting as signaling and effector molecules in both the innate and adaptive immune response. ROS have been implicated as the initiators of protein misfolding and as the downstream inducers of cell death in the context of neurodegenerative diseases53. The overproduction of ROS and RNS by tumor cells alters tumor metabolism, promotes metastasis and angiogenesis, and fosters drug resistance phenotypes52,54. Thus, detection of ROS and RNS in real time and with high spatial and temporal resolution using CF-SPNs may help uncover the mechanisms of ROS/RNS production and action in a broad range of diseases and lead to the development of novel therapeutics.
Online Methods
Chemicals
All chemicals were obtained from Sigma-Aldrich unless otherwise stated. PEGCOOH-g-PS (Mn=217,000, Mw/Mn= 1.25) was purchased from Polymer Source, and the number of branches of this polymer is 11 per 74 units of styrene backbone units. Ultrapure water and 1×PBS were purchased from Invitrogen. The RONS-sensitive dye (IR775S) was synthesized according to the literature.19
Materials characterization
TEM images were obtained on a JEM 1230 transmission electron microscope with an accelerating voltage of 200 kV. Dynamic light scattering was performed on a 90 plus particle size analyzer (Brookhaven Instruments Corporation). Zeta potential measurements were conducted on the Malvern ZetaSizer Nano S. UV-Vis spectra were recorded on an Agilent spectrophotometer. Fluorescence and chemiluminescence spectra were recorded on a wavelength-calibrated FluoroMax-3 fluorometer (Horiba JobinYvon). Chemiluminescent properties of the nanoparticles were also measured with IVIS™ Spectrum pre-clinical in vivo imaging system (PerkinElmer, MA, USA). NMR spectra were taken on Bruker 400 MHz magnetic resonance spectrometer. MALDI-MS spectra were collected at the Mass Spectrometry Facility of Stanford University.
Synthesis of amino galactoside
Azidoethyldiethylene glycol (816 mg, 4.658 mmol) and glycosyl donor 2,3,4,6-tetra-O-acetyl-D-galactopyranosyl trichloroacetamide (5.00 g, 9.316 mmol) were dissolved in dry dichloromethane (50 mL). Molecular sieves (5.0 g, 4 Å) were added and the mixture was stirred for 1 h at room temperature under argon. The reaction mixture was cooled to 0 °C, and trimethylsilyl trifluoromethanesulfonate (84μL, 0.466 mmol) was added slowly. The reaction was allowed to warm to r.t. and completed in 1 h. Triethylamine (100μL) was added to neutralize the solution, and column chromatography gave titled compound as a yellowish solid. The product was dissolved in methanolic solution of sodium methoxide (10 mM, 50 mL), and stirred for 30 min at r.t. Triphenylphosphine (1.22 g, 4.658 mmol) was then added and the reaction mixture was stirred overnight at r.t. Methanol was removed by rotary evaporation and the resulting residue was purified by HPLC. Lyophilization gave the product as yellowish syrup (520 mg, β isomer only, 36% over three steps). 1H NMR (400 MHz, d6-DMSO): δ 4.88, 4.75, 4.71, 4.61, 4.55, 4.48, 4.44, 4.28, 4.19, 4.09 (β isomer, H-1), 3.85, 3.74, 3.70-3.20, 2.95 (CH2NH2). ESI MS calcd. for C12H26NO8 (M + H): 311.17, found: 311.17.
Synthesis of PS-PEG-Gal
PEGCOOH-g-PS (50 mg), amino galactoside (8 mg), O-benzotriazole-N,N,N′,N′-tetramethyl-uronium-hexafluoro-phosphate (HBTU) (9.2 mg), and N-hydroxybenzotriazole (HOBt) (3.28 mg) were dissolved in DMF (0.5 mL). Then, N,N-Diisopropylethylamine (DIPEA) (10μL) was added, and the mixture was stirred at room temperature for 24 h. The reaction mixture was poured into diethyl ether, and the precipitate was dissolved in water. To remove the residual small molecule reagents, the aqueous solution was washed five times with DI-water using a 30 K centrifugal filter units (Millipore) under centrifugation at 4,000 rpm for 3 min at 4 °C. After freeze-drying, the product was obtained as white power. The amount galactose grafted to polystyrene was quantified to be 0.4% per styrene ring (1H-NMR in d6-DMSO).
Preparation of CF-SPNs
A tetrahydrofuran solution (2 mL) of PFODBT (0.25 mg), PS-PEG-Gal (0.5 mg), CPPO (1 mg) and IR775S (2.5μg) was rapidly injected into distilled-deionized water (10 mL) under continuous sonication. After sonication for additional 2 min, THF was evaporated at 40 °C under nitrogen atmosphere. The aqueous solution was filtered through a polyethersulfone (PES) syringe driven filter (0.22μm) (Millipore), and washed three times using a 30 K centrifugal filter units (Millipore) under centrifugation at 4,000 rpm for 3 min at 4 °C. The nanoparticle solution was finally concentrated to 5 mg/mLby ultrafiltration and used immediately for experiments. Employing the molar absorption coefficients of CPPO (ε280=5×10⁴ M−1 cm−1), IR775S (ε790=3×10⁶ M−1 cm−1), and PFODBT-based SPN (ε550=5×10⁷ M−1 cm−1), the number of sensing moieties was calculated at ~1000 CPPO molecules and 15 IR775S molecules per nanoparticle.
Optical responses of CF-SPN towards different RONS in solution
H2O2, ONOO−, −OCl, and O2•−, stock solutions were prepared by directly diluting commercially available H2O2, NaONOO, NaOCl, and KO2 respectively. NO was generated from diethylamine NONOate. •OH was generated from Fenton reaction between H2O2 and Fe(ClO4)2. 1O2 was produced from the H2O2/molybdate ions (Na2MoO4) system. The fluorescence intensities (lex=580 nm, lem=680 or 820 nm) of the CF-SPN solution (5μg/mL) in PBS (30 mM, pH = 7.4) were measured 5 min after the addition of RONS (6 μM) to determine the intensity enhancement. Chemiluminescence intensities were measured by IVIS with open filter. PBS used for these experiments was purged with N2 for 1 h before the measurement.
In vitro characterization of CF-SPN
For chemiluminescence lifetime measurement, CF-SPN (10 μg/mL) in PBS (30 mM, pH = 7.4) was placed in a black 96-well plate. After addition of excess H2O2 (50mM), the chemiluminescence was continuously acquired using an IVIS™ Spectrum pre-clinical in vivo imaging system (PerkinElmer, MA, USA) with open filter and autoexposure setting. The intensities were calculated from a region of interest and plotted as a function of time. The stability of CF-SPN fluorescence and chemiluminescence was determined by diluting CF-SPN to a final concentration of 5μg/mL in undiluted mouse serum and incubating at 37 °C for the indicated time period. Both fluorescence and chemiluminescence imaging was performed using an IVIS™ Spectrum pre-clinical in vivo imaging system. Chemiluminescence images were acquired for 3 min with open filter, and fluorescence images were acquired using autoexposure with excitation of 580±10 nm, and emission at both 680±10 nm and 820±10 nm. To determine the depth of signal penetration through tissue-like gel phantoms, CF-SPN solution (5μg/mL) in PBS (30 mM, pH = 7.4) was placed in a black 96-well plate. Gel phantoms previously described 23 composed of procine gelatin, bovine hemoglobin, intralipid and NaN3 in Tris-buffered saline at final concentrations of 10% w/v, 170mM, 1% v/v, and 15 mM, respectively, were overlaid on top of the wells at the desired gel thickness. Images were acquired using an IVIS™ Spectrum imaging system using chemiluminescence acquisition mode with open filter and autoexposure setting.
Animal models of drug-induced hepatotoxicity
All animal experiments were performed in compliance with the Guidelines for the Care and Use of Research Animals established by the Stanford University Institutional Animal Care and Use Committee. All animal experiments involved 8–10 week old female nude mice (Charles River Laboratories International, Inc., MA, USA). Test group sizes were 3 animals per treatment, balancing sufficient replication of results with a reduction in animal number. With this sample size, the large projected difference in signal with toxicity (d=4), and an α=0.05, power=0.83. All animals imaged were included in the analyses. Animals were fasted for 8 hours prior to imaging for all drug-induced hepatotoxicity imaging. Cages of animals were randomly selected for the following treatments. Animals were treated i.p. with sterilized saline solutions of APAP (10 mg/mL) or INH (10 mg/mL), and were then anesthetized with i.p. injection of 100 mg/kg of ketamine and 10 mg/mL of xylazine. A tail vein catheter was inserted, and the mice were placed in an IVIS™ Spectrum imaging system. Fifteen minutes after the administration of drug, 0.8 mg of CF-SPN were injected i.v. through the tail vein catheter, and imaging began immediately using an IVIS™ Spectrum imaging system. Chemiluminescence images were acquired for 3 min with open filter, and fluorescence images were acquired using autoexposure with excitation of 580±10 nm, and emission at both 680±10 nm and 820±10 nm. Animals were imaged longitudinally for the indicated lengths of time, warmed until observable sternal recumbence, and then returned to their cage. Animals were euthanized 180 min following drug treatment, and their livers were resected and placed into buffered formalin for histological examination. A separate set of animals was fasted, treated with drug, and their livers were resected after euthanasia to provide tissues for histological examination 45 min following drug treatment. For inhibitor studies, animals were treated with 200 mg/kg of GSH i.v. 5 min prior to drug treatment33, with 0.2 mg/kg of t-1,2-DCE i.p. 2 hours prior to drug treatment34 or with 100 mg/kg of 1-ABT i.p. 12 and 24 hours prior to drug treatment34 as indicated in previous reports. For the assessment of APAP-induced hepatotoxicity with luminol, mice were treated as described, and injected i.v. with 0.2 mg of luminol in 100 mL of saline adjusted to pH 8.0 with NaHCO3. To assess the production of hepatic oxidative or nitrosative stress in vivo following administration of SPN, mice were anesthetized by ketamine/xylazine injection and fitted with tail vein catheters. Either saline or 0.8 mg of Gal-SPN were then administered i.v., followed immediately by 0.8 mg of CF-SPN. To determine the biodistribution of Gal-SPN and PEG-SPN, 0.8 mg of nanoparticles were administered i.v. to each mouse, which was euthanized 45 min later. Thigh muscle, lungs, heart, liver, kidneys, and spleen were resected, placed onto black paper, and imaged using the IVIS™ Spectrum system with excitation at 580±10 nm and emission at 680±10 nm.
Histology
All tissues were embedded in paraffin prior to 10 micron sectioning. Histology samples were stained by hematoxylin and eosin under standard protocols. Immunohistochemistry samples were processed using an anti-nitrotyrosine primary antibody (A-21285, Life Technologies Inc., NY, USA) at 1:500 dilution, with color development according to the protocol described in the DAKO LSB+ kit. Endogenous peroxidases were quenched prior to processing. TUNEL staining was performed according to the manufacturer instructions using the ApopTag Plus Peroxidase In Situ Apoptosis Kit (EMD Millipore, MA, USA). All images were acquired using an Olympus IX2-UCB (Olympus America Inc., PA, USA) inverted fluorescence microscope equipped with a Nuance (CRi Inc., MA, USA) hyperspectral camera capable of brightfield full color imaging.
Data analysis
Chemiluminescence data was processed using Living Image software (v. 4.3.1, Perkin Elmer, MA, USA) for all experiments, in addition to fluorescence data for biodistribution experiments. The investigators were not blinded to the treatment group of the animals prior to data analysis. For fluorescent ratiometric mapping of liver intensity, image scale bars were normalized, with the scale set to a red color scheme. Fluorescence images without photograph overlay were exported as TIFF, read into Matlab™ (v. 8.0.0.783, The MathWorks Inc., CO, USA) where the percent difference between the fluorescence intensity at 680 nm and 820 nm was mapped for the liver region of interest. In order to plot the fluorescence index (FL index) over time, fluorescence intensities of the liver region of interest were extracted for images acquired with emission at 680 nm and at 820 nm using Living Image software. The intensity values, measured in units of radiance efficiency, were exported to Microsoft® Excel® (v.14.3.4, Microsoft Corporation, WA, USA) where the percent difference in emission intensity at 680 nm and 820 nm was calculated. Finally, the FL index was calculated as the ratio of the percent difference of drug treated animals to that of control animals according to equation 1.
| (1) |
All statistical analyses were performed using Prism software, including assumptions of tests utilized (v.5.0c, GraphPad Software Inc., CA, USA).
Supplementary Material
Acknowledgments
This work was supported by the NIH National Cancer Institute (NCI) grants R01CA135294, R01DK099800-06A1, R21CA138353A2, the Stanford University NCI CCNE-T grant (U54CA151459) and ICMIC (P50CA114747). We acknowledge the use of the SCi3 Core Facility and the Neuroscience Microscopy Service Facility at Stanford University. A.J.S. acknowledges Susan G. Komen For The Cure for fellowship support. The authors acknowledge Pauline Chu for her expertise in preparation of histology samples, Emily J. McWalter for assistance with MatLab script, and Steven Machtaler for assistance with tissue preparation and imaging by confocal microscopy.
Footnotes
Author contributions
A.J.S., K.P. and J.R. conceived of the nanosensor design, and A.J.S., K.P., J.P.U. and J.R. designed the experiments. L.C. synthesized the galactose moiety. K.P. synthesized PS-PEG-Gal and CF-SPN, performed in vitro characterization of CF-SPN and data analysis. A.J.S. performed in vivo studies, analyzed in vivo data, and acquired histology images. A.J.S., K.P., J.P.U., and J.R. discussed the results and co-wrote the manuscript.
Supplementary figures and chemical compound information are available in the online version of the paper.
Reprints and permission information is available online at http://www.nature.com/reprints.
References
- 1.Nasr A, Lauterio TJ, Davis MW. Unapproved drugs in the United States and the Food and Drug Administration. Adv Ther. 2011;28:842–856. doi: 10.1007/s12325-011-0059-4. [DOI] [PubMed] [Google Scholar]
- 2.Budnitz DS, et al. National surveillance of emergency department visits for outpatient adverse drug events. JAMA. 2006;296:1858–1866. doi: 10.1001/jama.296.15.1858. [DOI] [PubMed] [Google Scholar]
- 3.Sakatis MZ, et al. Preclinical strategy to reduce clinical hepatotoxicity using in vitro bioactivation data for >200 compounds. Chem Res Toxicol. 2012;25:2067–2082. doi: 10.1021/tx300075j. [DOI] [PubMed] [Google Scholar]
- 4.Srivastava A, et al. Role of reactive metabolites in drug-induced hepatotoxicity. Handb Exp Pharmacol. 2010;196:165–194. doi: 10.1007/978-3-642-00663-0_7. [DOI] [PubMed] [Google Scholar]
- 5.Dimasi JA. Risks in new drug development: approval success rates for investigational drugs. Clin Pharmacol Ther. 2001;69:297–307. doi: 10.1067/mcp.2001.115446. [DOI] [PubMed] [Google Scholar]
- 6.Kola I, Landis J. Can the pharmaceutical industry reduce attrition rates? Nat Rev Drug Discov. 2004;3:711–715. doi: 10.1038/nrd1470. [DOI] [PubMed] [Google Scholar]
- 7.Tengowski MW, Kotyk JJ. Risk identification and management: MRI as a research tool in toxicology studies of new chemical entities. Prog Drug Res. 2005;62:257–278. doi: 10.1007/3-7643-7426-8_7. [DOI] [PubMed] [Google Scholar]
- 8.Kramer JA, Sagartz JE, Morris DL. The application of discovery toxicology and pathology towards the design of safer pharmaceutical lead candidates. Nat Rev Drug Discov. 2007;6:636–649. doi: 10.1038/nrd2378. [DOI] [PubMed] [Google Scholar]
- 9.Holt M, Ju C. Drug-induced liver injury. Handb Exp Pharmacol. 2010;196:3–27. doi: 10.1007/978-3-642-00663-0_1. [DOI] [PubMed] [Google Scholar]
- 10.Walsh JS, Miwa GT. Bioactivation of drugs: risk and drug design. Annu Rev Pharmacol Toxicol. 2011;51:145–167. doi: 10.1146/annurev-pharmtox-010510-100514. [DOI] [PubMed] [Google Scholar]
- 11.Antoine DJ, Williams DP, Park BK. Understanding the role of reactive metabolites in drug-induced hepatotoxicity: state of the science. Expert Opin Drug Metab Toxicol. 2008;4:1415–1427. doi: 10.1517/17425255.4.11.1415. [DOI] [PubMed] [Google Scholar]
- 12.Tang W, Lu AY. Metabolic bioactivation and drug-related adverse effects: current status and future directions from a pharmaceutical research perspective. Drug Metab Rev. 2010;42:225–249. doi: 10.3109/03602530903401658. [DOI] [PubMed] [Google Scholar]
- 13.Willmann JK, van Bruggen N, Dinkelborg LM, Gambhir SS. Molecular imaging in drug development. Nat Rev Drug Discov. 2008;7:591–607. doi: 10.1038/nrd2290. [DOI] [PubMed] [Google Scholar]
- 14.Pessayre D, Mansouri A, Berson A, Fromenty B. Mitochondrial involvement in drug-induced liver injury. Handb Exp Pharmacol. 2010;196:311–365. doi: 10.1007/978-3-642-00663-0_11. [DOI] [PubMed] [Google Scholar]
- 15.Russmann S, Kullak-Ublick GA, Grattagliano I. Current concepts of mechanisms in drug-induced hepatotoxicity. Curr Med Chem. 2009;16:3041–3053. doi: 10.2174/092986709788803097. [DOI] [PMC free article] [PubMed] [Google Scholar]
- 16.Xiong L, Shuhendler AJ, Rao J. Self-luminescing BRET-FRET near-infrared dots for in vivo lymph-node mapping and tumour imaging. Nat Commun. 2012;3:1193. doi: 10.1038/ncomms2197. [DOI] [PMC free article] [PubMed] [Google Scholar]
- 17.Pu K, Shuhendler AJ, Rao J. Semiconducting Polymer Nanoprobe for In Vivo Imaging of Reactive Oxygen and Nitrogen Species. Angew Chem Int Ed Engl. 2013;52:10325–10329. doi: 10.1002/anie.201303420. [DOI] [PMC free article] [PubMed] [Google Scholar]
- 18.Lee D, et al. In vivo imaging of hydrogen peroxide with chemiluminescent nanoparticles. Nat Mater. 2007;6:765–769. doi: 10.1038/nmat1983. [DOI] [PubMed] [Google Scholar]
- 19.Oushiki D, et al. Development and application of a near-infrared fluorescence probe for oxidative stress based on differential reactivity of linked cyanine dyes. J Am Chem Soc. 2010;132:2795–2801. doi: 10.1021/ja910090v. [DOI] [PubMed] [Google Scholar]
- 20.Hu Y, Haynes MT, Wang Y, Liu F, Huang L. A Highly Efficient Synthetic Vector: Nonhydrodynamic Delivery of DNA to Hepatocyte Nuclei in Vivo. ACS Nano. 2013;7:5376–5384. doi: 10.1021/nn4012384. [DOI] [PMC free article] [PubMed] [Google Scholar]
- 21.Szabo C, Ischiropoulos H, Radi R. Peroxynitrite: biochemistry, pathophysiology and development of therapeutics. Nat Rev Drug Discov. 2007;6:662–680. doi: 10.1038/nrd2222. [DOI] [PubMed] [Google Scholar]
- 22.Smith AM, Mancini MC, Nie S. Bioimaging: second window for in vivo imaging. Nat Nanotechnol. 2009;4:710–711. doi: 10.1038/nnano.2009.326. [DOI] [PMC free article] [PubMed] [Google Scholar]
- 23.Shuhendler AJ, et al. Hybrid quantum dot-fatty ester stealth nanoparticles: toward clinically relevant in vivo optical imaging of deep tissue. ACS Nano. 2011;5:1958–1966. doi: 10.1021/nn103024b. [DOI] [PubMed] [Google Scholar]
- 24.Herd RM, Dover JS, Arndt KA. Basic laser principles. Dermatol Clin. 1997;15:355–372. doi: 10.1016/s0733-8635(05)70446-0. [DOI] [PubMed] [Google Scholar]
- 25.Mourant JR, Fuselier T, Boyer J, Johnson TM, Bigio IJ. Predictions and measurements of scattering and absorption over broad wavelength ranges in tissue phantoms. Appl Opt. 1997;36:949–957. doi: 10.1364/ao.36.000949. [DOI] [PubMed] [Google Scholar]
- 26.Jones CF, Grainger DW. In vitro assessments of nanomaterial toxicity. Adv Drug Deliv Rev. 2009;61:438–456. doi: 10.1016/j.addr.2009.03.005. [DOI] [PMC free article] [PubMed] [Google Scholar]
- 27.Maynard AD, Warheit DB, Philbert MA. The new toxicology of sophisticated materials: nanotoxicology and beyond. Toxicol Sci. 2011;120 (Suppl 1):S109–29. doi: 10.1093/toxsci/kfq372. [DOI] [PMC free article] [PubMed] [Google Scholar]
- 28.Hinson JA, Roberts DW, James LP. Mechanisms of acetaminophen-induced liver necrosis. Handb Exp Pharmacol. 2010:369–405. doi: 10.1007/978-3-642-00663-0_12. [DOI] [PMC free article] [PubMed] [Google Scholar]
- 29.Nakagawa H, et al. Deletion of apoptosis signal-regulating kinase 1 attenuates acetaminophen-induced liver injury by inhibiting c-Jun N-terminal kinase activation. Gastroenterology. 2008;135:1311–1321. doi: 10.1053/j.gastro.2008.07.006. [DOI] [PubMed] [Google Scholar]
- 30.McGill MR, Jaeschke H. Metabolism and Disposition of Acetaminophen: Recent Advances in Relation to Hepatotoxicity and Diagnosis. Pharm Res. 2013;30:2174–2187. doi: 10.1007/s11095-013-1007-6. [DOI] [PMC free article] [PubMed] [Google Scholar]
- 31.Gujral JS, Knight TR, Farhood A, Bajt ML, Jaeschke H. Mode of cell death after acetaminophen overdose in mice: apoptosis or oncotic necrosis? Toxicol Sci. 2002;67:322–328. doi: 10.1093/toxsci/67.2.322. [DOI] [PubMed] [Google Scholar]
- 32.Liu WF, et al. Real-time in vivo detection of biomaterial-induced reactive oxygen species. Biomaterials. 2011;32:1796–1801. doi: 10.1016/j.biomaterials.2010.11.029. [DOI] [PMC free article] [PubMed] [Google Scholar]
- 33.James LP, McCullough SS, Lamps LW, Hinson JA. Effect of N-acetylcysteine on acetaminophen toxicity in mice: relationship to reactive nitrogen and cytokine formation. Toxicol Sci. 2003;75:458–467. doi: 10.1093/toxsci/kfg181. [DOI] [PubMed] [Google Scholar]
- 34.Jackson TE, Lilly PD, Recio L, Schlosser PM, Medinsky MA. Inhibition of cytochrome P450 2E1 decreases, but does not eliminate, genotoxicity mediated by 1,3-butadiene. Toxicol Sci. 2000;55:266–273. doi: 10.1093/toxsci/55.2.266. [DOI] [PubMed] [Google Scholar]
- 35.Saito C, Zwingmann C, Jaeschke H. Novel mechanisms of protection against acetaminophen hepatotoxicity in mice by glutathione and N-acetylcysteine. Hepatology. 2010;51:246–254. doi: 10.1002/hep.23267. [DOI] [PMC free article] [PubMed] [Google Scholar]
- 36.Saukkonen JJ, Powell K, Jereb JA. Monitoring for tuberculosis drug hepatotoxicity: moving from opinion to evidence. Am J Respir Crit Care Med. 2012;185:598–599. doi: 10.1164/rccm.201112-2174ED. [DOI] [PMC free article] [PubMed] [Google Scholar]
- 37.Metushi IG, Nakagawa T, Uetrecht J. Direct oxidation and covalent binding of isoniazid to rodent liver and human hepatic microsomes: humans are more like mice than rats. Chem Res Toxicol. 2012;25:2567–2576. doi: 10.1021/tx300341r. [DOI] [PMC free article] [PubMed] [Google Scholar]
- 38.Metushi IG, Cai P, Zhu X, Nakagawa T, Uetrecht JP. A fresh look at the mechanism of isoniazid-induced hepatotoxicity. Clin Pharmacol Ther. 2011;89:911–914. doi: 10.1038/clpt.2010.355. [DOI] [PubMed] [Google Scholar]
- 39.Peet J, et al. Efficiency enhancement in low-bandgap polymer solar cells by processing with alkane dithiols. Nat Mater. 2007;6:497–500. doi: 10.1038/nmat1928. [DOI] [PubMed] [Google Scholar]
- 40.Sokolov AN, Tee BC, Bettinger CJ, Tok JB, Bao Z. Chemical and engineering approaches to enable organic field-effect transistors for electronic skin applications. Acc Chem Res. 2012;45:361–371. doi: 10.1021/ar2001233. [DOI] [PubMed] [Google Scholar]
- 41.Wu C, Chiu DT. Highly fluorescent semiconducting polymer dots for biology and medicine. Angew Chem Int Ed Engl. 2013;52:3086–3109. doi: 10.1002/anie.201205133. [DOI] [PMC free article] [PubMed] [Google Scholar]
- 42.Guimard NK, Sessler JL, Schmidt CE. Towards a Biocompatible, Biodegradable Copolymer Incorporating Electroactive Oligothiophene Units. Macromolecules. 2009;42:502–511. doi: 10.1021/ma8019859. [DOI] [PMC free article] [PubMed] [Google Scholar]
- 43.Zhang N, Francis KP, Prakash A, Ansaldi D. Enhanced detection of myeloperoxidase activity in deep tissues through luminescent excitation of near-infrared nanoparticles. Nat Med. 2013;19:500–505. doi: 10.1038/nm.3110. [DOI] [PubMed] [Google Scholar]
- 44.Park BK, Kitteringham NR, Maggs JL, Pirmohamed M, Williams DP. The role of metabolic activation in drug-induced hepatotoxicity. Annu Rev Pharmacol Toxicol. 2005;45:177–202. doi: 10.1146/annurev.pharmtox.45.120403.100058. [DOI] [PubMed] [Google Scholar]
- 45.Cover C, et al. Peroxynitrite-induced mitochondrial and endonuclease-mediated nuclear DNA damage in acetaminophen hepatotoxicity. J Pharmacol Exp Ther. 2005;315:879–887. doi: 10.1124/jpet.105.088898. [DOI] [PubMed] [Google Scholar]
- 46.McGill MR, et al. Plasma and liver acetaminophen-protein adduct levels in mice after acetaminophen treatment: dose-response, mechanisms, and clinical implications. Toxicol Appl Pharmacol. 2013;269:240–249. doi: 10.1016/j.taap.2013.03.026. [DOI] [PMC free article] [PubMed] [Google Scholar]
- 47.Ghafourifar P, Cadenas E. Mitochondrial nitric oxide synthase. Trends Pharmacol Sci. 2005;26:190–195. doi: 10.1016/j.tips.2005.02.005. [DOI] [PubMed] [Google Scholar]
- 48.Pacher P, Beckman JS, Liaudet L. Nitric oxide and peroxynitrite in health and disease. Physiol Rev. 2007;87:315–424. doi: 10.1152/physrev.00029.2006. [DOI] [PMC free article] [PubMed] [Google Scholar]
- 49.Chowdhury A, et al. Mitochondrial oxidative stress and permeability transition in isoniazid and rifampicin induced liver injury in mice. J Hepatol. 2006;45:117–126. doi: 10.1016/j.jhep.2006.01.027. [DOI] [PubMed] [Google Scholar]
- 50.Li F, et al. Human PXR modulates hepatotoxicity associated with rifampicin and isoniazid co-therapy. Nat Med. 2013;19:418–420. doi: 10.1038/nm.3104. [DOI] [PMC free article] [PubMed] [Google Scholar]
- 51.Lauterburg BH, Smith CV, Todd EL, Mitchell JR. Pharmacokinetics of the toxic hydrazino metabolites formed from isoniazid in humans. J Pharmacol Exp Ther. 1985;235:566–570. [PubMed] [Google Scholar]
- 52.Nathan C, Cunningham-Bussel A. Beyond oxidative stress: an immunologist’s guide to reactive oxygen species. Nat Rev Immunol. 2013;13:349–361. doi: 10.1038/nri3423. [DOI] [PMC free article] [PubMed] [Google Scholar]
- 53.Li J, OW, Li W, Jiang ZG, Ghanbari HA. Oxidative stress and neurodegenerative disorders. Int J Mol Sci. 2013;14:24438–24475. doi: 10.3390/ijms141224438. [DOI] [PMC free article] [PubMed] [Google Scholar]
- 54.Costa A, Scholer-Dahirel A, Mechta-Grigoriou F. The role of reactive oxygen species and metabolism on cancer cells and their microenvironment. Semin Cancer Biol. 2014 doi: 10.1016/j.semcancer.2013.12.007. [DOI] [PubMed] [Google Scholar]
Associated Data
This section collects any data citations, data availability statements, or supplementary materials included in this article.