

Abstract
The aryl hydrocarbon receptor (AhR) is a ligand activated basic helix-loop-helix transcription factor that binds to environmental poly aromatic hydrocarbons (PAH) and mediates their toxic and carcinogenic responses. There is ample documentation for the role of AhR in PAH-induced carcinogenicity. However, in this report we addressed whether overexpression of AhR alone is sufficient to induce carcinogenic transformation in human mammary epithelial cells (HMEC). Retroviral expression vectors were used to develop a series of stable cell lines expressing varying levels of AhR protein in an immortalized normal HMEC with relatively low endogenous AhR expression. The resulted increase in AhR expression and activity correlated with the development of cellular malignant phenotypes, most significantly epithelial-to-mesenchymal transition. Clones overexpressing AhR by more than 3-fold, exhibited a 50% decrease in population doubling time. Cell cycle analysis revealed that this increase in proliferation rates was due to an enhanced cell cycle progression by increasing the percentage of cells transiting into S- and G2/M phases. Cells overexpressing AhR exhibited enhanced motility and migration. Importantly, these cells acquired the ability to invade matrigel matrix, where more than 80% of plated cells invaded the matrigel matrix within 24 h, whereas none of parental or the vector control HMEC were able to invade matrigel. Collectively, these data provide evidence for a direct role of AhR in the progression of breast carcinoma. The results suggest a novel therapeutic target that could be considered for treatment and prevention of breast cancer progression.
Keywords: aryl hydrocarbon receptor, ectopic overexpression, mammary epithelia, transformation, breast cancer, progression
Introduction
The aryl hydrocarbon receptor (AhR) is a ligand-activated transcription factor [1] that is well characterized for mediating the carcinogenic responses to environmental polyaromatic hydrocarbons (PAH), such as 2,3,7,8-tetrachloro-dibenzo-p-dioxin (TCDD) [2, 3]. It is a member of the basic helix-loop-helix (bHLH)/PAS family of heterodimeric transcriptional regulators. The bHLH/PAS proteins are involved in the control of diverse physiological processes such as circadian rhythm, organ development, neurogenesis, xenobiotic metabolism and stress response to hypoxia [4, 5].
Binding of PAH to cytoplasmic AhR leads to the receptor activation and subsequent translocation into the nucleus, where it dimerizes with another bHLH protein, the AhR nuclear translocator (ARNT). This heterodimer binds to a set of co-activators and/or co-repressors and the resulting complex interacts with consensus regulatory sequences (xenobiotic response elements, XREs) located in the promoter of PAH-responsive genes such as CYP1A1, and enhances their transcription [6, 7]. Once transcriptional regulation has occurred, AhR is exported to the cytosol and degraded by calpain and proteasomes [8-11].
A number of endogenous ligands for AhR have been identified, however, no physiological function has been established for any of them [12, 13]. On the other hand, constitutive activation of AhR via disturbing cellular adhesion to extracellular matrix [14], increasing intracellular calcium [15] or disturbing the cytoskeleton [16] has suggested that multiple pathophysiologically-activated pathways are activated by the AhR. Furthermore, the constitutive pattern of expression of AhR during development and in adult tissues [17]; the large degree of conservation of this receptor among species [18]; and the phenotypic alterations found in mice lacking AhR expression [19-21], are all evidence pointing to the role of AhR in cellular physiology. Recently, a whole issue in the journal of Biochemical Pharmacology was dedicated to discussing functions of AhR that are of physiological relevance and are independent of inducing cytochromes P450 [22].
The AhR appears to have constitutive expression and activity in established cell lines from human adult T-cell leukemia (ATL) and in some primary ATL cell cultures [23], which suggest that this receptor has oncogenic activity in this tumor type. High levels of AhR protein are also expressed in pancreatic cancer tissue samples and several AhR agonists were able to inhibit the proliferation and anchorage-independent growth of cells from these tissues [24].
The role of AhR in breast cancer is well-documented and has been mainly related to the ligand-activated receptor. The AhR is activated by environmental carcinogens such as PAH, leading to the induction of genes that encode the proteins for CYP1A1, CYP1A2 and CYP1B1. These enzymes metabolize PAH and estrogens into reactive metabolites that damage cellular DNA and result in cancer initiation [reviewed in 25]. Another role for AhR in breast carcinogenesis involves the AhR-dependent growth inhibition of breast cells through suppression of estrogen receptor (ER) signaling. The ligand activation of AhR induces AhR-ER interaction and enhances ER degradation [26-28]. On the other hand, the AhR null mouse exhibits impaired development of mammary gland ductal branching [29], suggesting a role for AhR in regulating proliferative stages required for mammary gland development.
Higher levels of AhR expression were reported in DMBA-induced mammary tumors of rats and mice compared to their normal mammary tissues [25, 30]. This elevated level of AhR was attributed to an important function played by AhR during mammary tumorigenesis, independent of environmental carcinogens. In support of these findings are our own data showing that the expression of AhR is elevated in human breast tumors and breast carcinoma cell lines in direct proportion to the tumor progression1. Our current study was undertaken to investigate whether induced overexpression of AhR could be both necessary and sufficient for development of transformed phenotypes in human breast epithelial cells.
Material and Methods
The H16N2 immortalized human mammary epithelial cell line and the metastatic MT2 breast cancer cell lines were kindly provided by Dr. Vimla Band (Northwestern University, Chicago, IL). MT2 cells, H16N2 cells and the subsequently generated clones were grown in DFCI-1 media as described [31] and were maintained in culture at 37°C and 5% CO2.
Recombinant Retroviral Expression Vector and Virus Production
The human AhR cDNA was provided by Dr. Chris Bradfield (McArdle Laboratory for Cancer Research, Madison, WI). Bgl II (5′) and Cla I (3′) restriction sites were added to the full length AhR by PCR to generate a fragment with compatible cloning sites for ligation into the pLNCX2 retroviral vector (Retro-X-System from BD Biosciences), under control of the human cytomegalovirus early promoter (pcmv). This vector also contains a neomycin resistance gene under the viral LTR promoter to allow for selection in mammalian cells. The sequences of retroviral vectors containing the human AhR cDNA (ret-AhR) or the corresponding empty vector control (EV) were confirmed by DNA sequencing at the Vanderbilt-Ingram Cancer Center Molecular Biology Core Facility (Nashville, TN). The two vectors were transfected independently into the Phoenix packaging cell line by calcium phosphate method to produce infectious viral particles, following the manufacturer's instructions. Equal amounts of the pBMN-I-GFP retro vector DNA were co-transfected with each vector to provide a visible screenable marker to assess the transfection efficiency. The titer of the viral stock was assayed using mouse embryo fibroblasts (MEF) generated in this laboratory from AhR-null mice.
Development of Stable Cell Lines
H16N2 cells were plated at 2×10⁶ per 6-cm plate and allowed to incubate overnight. Viral supernatants were mixed with culture media and added to the H16N2 cells in the presence of polybrene (4μg/ml) with gentle and thorough mixing. Cells were incubated at 37°C for 12-18 hours, infection medium was then removed and fresh medium was added to cells for an extra 24-48h, when the fluorescence of GFP expression in Phoenix cells was observed under fluorescence microscope.
Selection, Cloning and Expansion of Clones
H16N2 stable transfectants harboring the retro-AhR or EV control vector were isolated by G418 antibiotic selection. The optimal antibiotic concentration was determined as 800 μg G418/ml of medium and was added to the cells for one week, with fresh medium and antibiotic replenished every two days. Surviving cells from retro-AhR were expanded and cloned by limited dilution. Briefly, cells were plated at 100 cells per 150mm plate surface. The position of individual attached cells was pinpointed on the under side of the culture dish using a marker. The cells were allowed to grow and expand for one week. Once the individual cells divided to form small colonies, sterile cloning discs pre-soaked in trypsin-EDTA were placed on each isolated colony. Cells from each disc were placed in an individual well of a 24-well plate and allowed to reach confluence. Each clone was then expanded and characterized for AhR protein expression by Western immunoblotting. Five representative clones, with varying AhR expression, and EV-expressing cell lines were selected for subsequent characterization.
Immunocytochemical Staining and Fluorescence Microscopy
Cells grown on glass cover slips in 6-well plates were washed in cold PBS and fixed by incubation in a 1:1 methanol: acetone solution at 4°C for 30 minutes and then air dried. Fixed cells on cover slips were used for either staining immediately or stored airtight at –20°C until staining.
For immunostaining, cells were rinsed and hydrated with Tris-buffered saline containing 0.05% Tween 20 (TBST) and transferred to a clean 6-well plate. The cells were incubated at room temperature for 1 hour in 4% milk solution in TBST to block nonspecific binding, followed by incubation at room temperature for 1 hour with either affinity-purified rabbit anti-AhR polyclonal antibody (BEAR-4) at 1 μg/ml, or anti-vimentin monoclonal antibodies (clone V9, Sigma Chemicals) at 1:500 dilution in 2% milk solution in TBST. Cells were then washed three times (15 min each) with TBST. Cells were incubated with a 1:200 dilution of either tetramethyl rhodamine isothiocyanate (TRITC)-conjugated anti-rabbit or fluorescein isothiocyanate (FITC)-conjugated anti-mouse antibodies (Jackson Immunoresearch laboratories, West Grove, PA) in 2% milk at room temperature for 1 hour. The cells were then washed extensively (4x for 15 min each in TBST, 3x for 10 min each in TBS). The nuclei were counter-stained with DAPI fluorescence dye and rinsed for 10 min in purified H2O and mounted on glass slides using PBS-glycerol supplemented with DABCO, the anti-fading agent.
Cellular Fractionation and AhR Nuclear Translocation Experiments
Clonal cells were grown in 6-cm plates and treated at ∼75% confluence with 1 nM TCDD or equivalent volume of DMSO (0.1%) for the 3 hours. Medium was removed and cells were washed twice with cold PBS and lyzed in dishes for 30 min at 4°C in lysis buffer: (1% NP-40 in 25 mM MOPS buffer pH 7.4, containing 0.03% Na azide, 1 mM EDTA, 10% glycerol, 5 mM EGTA), supplemented with protease inhibitors cocktail: 20 μM AEBSF, 32 μM Bestatin, 1μg/ml E64D, 2μM Leupeptin, 1μM Pepstatin, 50μg/ml TLCK, 100μg/ml TPCK, and supplemented also with phosphatase inhibitors (1 mM Na orthovanadate and 1 mM Na fluoride). Cell lysates were scraped from dishes into microcentrifuge tubes and centrifuged at 2,000 rpm for 5 min at 4°C to pellet nuclei. Supernatants (SN) were saved at -20°C until analyzed, and nuclei were washed three times in lysis buffer to remove cytosolic contamination. Nuclear pellets were then homogenized in lysis buffer by sonication on ice bath, and nuclear extracts (NE) were centrifuged and save at -20°C for analysis by Western blotting.
Western Immunoblotting
Protein concentration was determined using BCA protein assay (Pierce, Rockford, IL). Proteins were separated on 7.5% SDS-PAGE and transferred to PVDF membranes. Membranes were first stained with Ponceau S (Sigma Chemicals, St Luis MO) to visualize protein bands to ensure equal protein transfer. Membranes were blocked with 4% milk in TBST for 1 hour. Membranes were then incubated with affinity-purified rabbit anti-AhR polyclonal antibody (BEAR-3) from Dr. Chris Bradfield (McArdle Laboratory for Cancer Research, Madison, WI) in 2% milk solution in TBST (1 μg/ml) for 1 hour. Membranes were rinsed 3x in TBST and followed by incubation for 1 hour in 1:20,000 dilution of horseradish peroxidase-conjugated anti-rabbit IgG (Promega, Madison, WI) in 2% milk solution in TBST. Immunoreactive proteins were visualized using chemiluminescence reagents (Pierce Chemicals, Rockford, IL). To determine the relative expression of AhR protein among samples, band density was quantified by AlphaImager 2000 Digital system using Alpha Image acquisition analysis software (Alpha Innotech Corp, San Leonardo, CA). Subsequently, blots were re-probed with actin monoclonal antibodies (1:4000) to normalize for protein loading.
Following immunoblotting for AhR proteins in cellular fractionation experiments, the membranes were stripped and re-probed with anti GAPDH rabbit polyclonal antibody (Sigma Chemical) and anti SP1 monoclonal antibody clone 1A5 (Novus Biologicals, Littleton, CO), as markers for cytosolic and nuclear proteins, respectively.
Immunoblotting for cell cycle molecules was done essentially the same way as described above using the following antibodies: anti-cdk2 (SC-163), anti-cdk4 (SC-260), anti-cyclin E (SC-481) from Santa Cruz Biotech (Santa Cruz, CA), anti-cyclin D1 (AB 1320) from Chemicon International (Temecula, CA) and anti-Rb from Oncogene (San Diego, CA).
Reverse Transcriptase-Polymerase Chain Reaction (RT-PCR)
Following cell lysis with Trizol, total RNA was isolated according to manufacturer's protocol. The cDNA was prepared from 2 µg of total RNA using random hexamer primers and Moloney murine leukemia virus reverse transcriptase. CYP1A1 PCR was done using forward primer sequence 5′TAG ACA CTG ATC TGG CTG CAG3′ and the reverse primer sequence 5′GGG AAG GCT CCA TCA GCA TC3′. CYP1B1 amplification was done using forward primer sequence 5′AAC GTC ATG AGT GCC GTG TGT3′ and the reverse primer sequence 5′GGC CGG TAC GTT CTC CAA ATC3′. As an internal control Glyceraldehyde 3-phosphate dehydrogenase (GAPDH) and 18S ribosomal RNA (18s) were amplified using GAPDH forward primer 5′ACC ACA GTC CAT GCC ATC AC3′ and the reverse primer 5′TCC ACC ACC CTG TTG CTG TA3′; 18s forward primer 5′CGG ACA GGA TTG ACA GAT TGA TAG C3′ and the reverse primer 5′TGC CAG AGT CTC GTT CGT TAT CG3′.
Quantitative RT-PCR for AhR Repressor (AhRR)
RT-qPCR for determining the expression of AhRR in the clones compared to EV-control cell line was performed essentially as described by Zudaire et al 2008 [32], with slight modifications. First strand cDNA was generated as described in the preceding section and qPCR was performed by monitoring in real time the increase in fluorescence of the SYBR green dye using an iCycler detection system and SYBR green dye (Bio-Rad, Hercules, CA). Amplification was performed in triplicates using 10 microM each of the sense and antisense primers: AHRR sense, 5′-CTT AAT GGC TTT GCT CTG GTC G-3′; AHRR antisense, 5′-TGC ATT ACA TCC GTC TGA TGG A-3′ [32]. The transcripts were amplified according to the following cycle program: initial denaturation of the samples at 50°C for 2 min, 95°C for 10 min, 40 cycles of 95°C for 15 s, 60°C for 60 s. The values of AhRR mRNA levels determined were normalized to the levels of 18S ribosomal RNA of each sample. Relative normalized values of AhRR in different clones compared to the EV-expressing cell line were graphed as the mean ± SD from triplicate assays of two independent cultures of the cell lines.
Cell Proliferation Studies
Proliferative capacity of the clones was determined using the FluoReporter Blue Fluorometric dsDNA Quantitation kit from Molecular Probes (Eugene, OR). This method measures cellular proliferation based on quantitation of cellular DNA using the blue-fluorescent Hoechst 33258 nucleic acid stain, with all manipulations carried out in 96-well plates. Serial dilutions of cells in 100ul culture media were plated in microplate wells, ranging from 1000 to 100,000 cells per well. The plates were allowed to incubate at 37° C for 3, 12, 24, 48, and 72 hours at which times the media were removed and the plates were placed at -80°C. At the time of assay, the plates were allowed to thaw and 100ul of distilled water was added to each well and the plates were incubated at 37°C for 1 hour. The plates were then placed at –80°C until frozen and then thawed to room temperature. A 100ul aliquot of aqueous Hoechst 33258 was added to each well. Fluorescence of Hoechst 33258 dye was measured on a Cytofluor using excitation and emission filters 360nm and 460nm, respectively.
Cell Cycle Analysis
Cells were trypsinized and single cell suspensions were fixed in cold 70% ethanol. Fixed cells were stored at –20°C until staining. Cells were collected by centrifugation at 700 rpm for 5 minutes and resuspended in PBS. The cells were checked microscopically to ensure no clumps persisted. If clumps were observed, cells were passed 3-5 times through a 25-gauge syringe needle. RNase in PBS (0.1mg/ml) and propidium iodide (40 μg/ml) was added to the suspension. The cells were incubated at 37°C for 30 minutes. The fluorescent cells were then analyzed in a FACS Caliber BenchTop Analyzer (Becton-Dickson). The percentage of cell cycle distribution was determined using ModFit analysis software.
Invasion and Migration Studies
The invasive potential of the generated clones in comparison to EV cell line and MT-2 human breast cancer cell line was measured by a fluorescence-based tumor cell invasion assay (FluoroBlok invasion assay kits, BD Biosciences, Franklin Lakes, NJ). The assay has coupled a multi-well insert device containing a micro-porous membrane with a BD Matrigel coating process. The micro-porous membrane allows separation of fluorescence readings of the top and bottom compartment of the chamber. The BD Matrigel coat functions as a barrier to the passage of non-invasive cells analogous to the in vivo extracellular basement membrane.
Cell suspensions were prepared by trypsinizing cell monolayers and resuspending the cells in serum-free medium at 5×10⁴ cells/ml. Medium (750ul) containing 5% fetal calf serum was added to the bottom of each well as a chemo-attractant. A 500ul aliquot of the cell suspension (2.5×10⁴ cells) was added to the top chamber. The cells were incubated at 37°C for 24 hours. Following incubation, the medium from the top chamber was carefully removed by aspiration and the insert was transferred to a second plate containing 0.5ml/well of 4μg/ml Calcein AM (Molecular Probes, Eugene, OR). The plates were allowed to incubate for 1 hour at 37°C. Calcein fluorescence of the invaded cells was read from the bottom at excitation and emission wavelength of 485 and 530 nm, respectively. The migration measurements were performed similar to the invasion assay procedure, with the exception that inserts without a matrigel coating were used, and migration was measured at three different cell densities.
Cloning in Soft Agar
A 0.6% agar underlay was prepared by combining an equal volume of 2X DFCI medium and 1.2% agar. The 0.6% agar was added to the bottom of 6-well culture plates and allowed to gel at room temperature. Cell suspensions of 1×10⁴ cells/ml and 3.5×10³cells/ml were prepared and 20ul of each dilution were added to 2ml of 0.3% agar medium. The agar and cell suspensions were mixed and 1ml of each mixture was added to the respective wells. The solution was allowed to gel at room temperature. The culture plates were then stored in a 37°C incubator for 2 weeks and were fed every three days. Cells were plated in triplicate at each cell density.
Statistical Analysis
A two-tailed Student's T-test was used to compare the mean values of cell doubling times, cell cycle distribution, expression of cell cycle regulators, migration, invasion or soft agar colonization between empty vector (EV)-carrying control cells and different clones overexpressing the AhR. A p-value of 0.05 or less was deemed significant.
Results
Overexpression of the AhR is Paralleled by Transformation of Epithelial Cells to a Fibroblastic Morphology
We developed five independent clonal cell lines, which are overexpressing AhR to varying degrees compared to the endogenous level in the parental H16 HMEC. The AhR expression levels in these clones range from a 30% to an ∼15-fold increase relative to the vector control (Figure 1). Two of these clones (clones A & E) exhibited a remarkable change in their morphology, with a loss of their typical epithelial shape and adoption of elongated fibroblastic-like patterns (Figure 1B). Western blot analysis (Figure 1A) revealed that clone A and clone E also have the highest increase in AhR expression. Consistent with their fibroblastic phenotype, both cytochemical immuno-fluorescence and Western blot analyses revealed that these two clones also expressed the highest levels of vimentin, which is a fibroblast-specific marker (Figure 2A-B), indicating that overexpression of the AhR in these clones enhances their epithelial-to-mesenchymal transition (EMT). However, clone D, which has slightly lower AhR levels than clones A or E, expressed only a modest level of approximately 10% of the vimentin level in clone A (Figure 2 A, lower panel), and largely maintained its epithelial morphology.
Figure 1. Analysis of AhR protein expression in AhR-transformed H16N2 clones in comparison to their empty vector (EV) control.
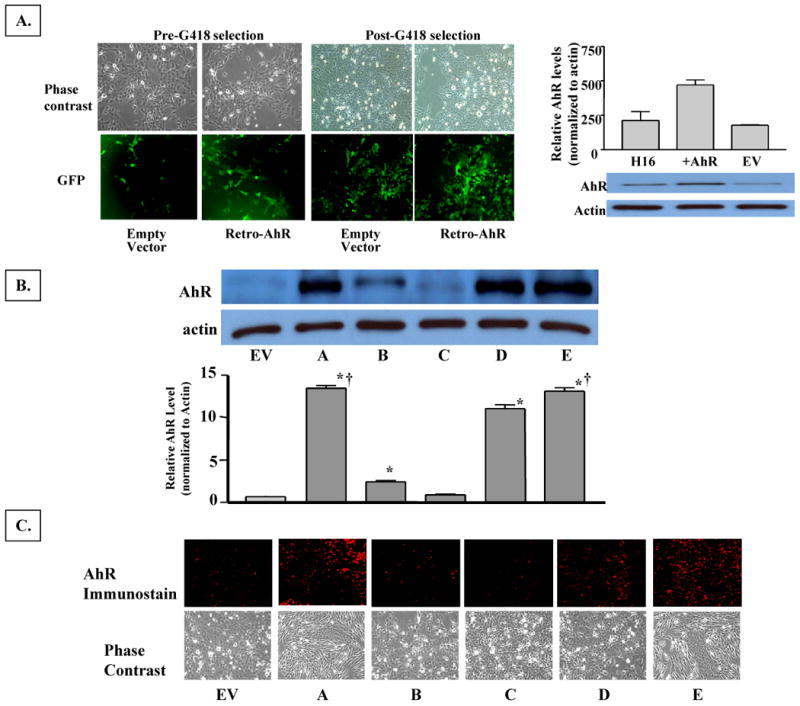
A. Fluorescence images of H16N2 immortalized mammary epithelial cells two days after infection with retro-viruses expressing EGFP/EV or EGFP-AhR, and after they have been enriched by antibiotic selection. Upper panel images were captured as phase contrast micrograph and lower panel are the fluorescence images of GFP expression. Following antibiotic selection, the heterogeneous stables were screened by Western blotting for AhR expression. The enriched AhR-expressing cells were cloned by limited dilution and several clones were isolated, and five representative clones were analyzed in comparison to EV-expressing cell lines.
B. Western immunoblotting analysis. Five clones (A-E) with varying levels of AhR-expression and a cell line expressing only the empty vector (EV) were isolated by limiting dilution from G418-selected transformed H16N2 cell lines. Ten μg of protein from each clone was analyzed by Western immunoblotting. Upper panel is a representative blot and lower panel is the densitometric quantitation of AhR protein (apparent molecular mass of 108 kDa) in the clones. Values in the graph are means and standard deviations of n=3 independent cultures of different analyses. Values from different experimental analyses were each normalized internally to the respective EV control before the mean and SD was calculated. A (*) denotes significant difference from the values of EV (p<0.05), and a (†) denotes significantly higher value than that of clone D (p<0.05).
C. Immunocytochemical staining of AhR protein expression in H16 clones. Clonal cells were grown and fixed on cover slips. Cellular AhR protein was visualized by staining with rabbit anti-AhR polyclonal antibodies followed by rhodamine-conjugated donkey anti-rabbit antibodies. Images were captured on an Olympus fluorescence microscope (200× magnifications). Lower panels are micrographs of the phase contrast images of the clonal cells.
Figure 2. Immunocytochemical staining for vimentin in H16 clonal cell lines.
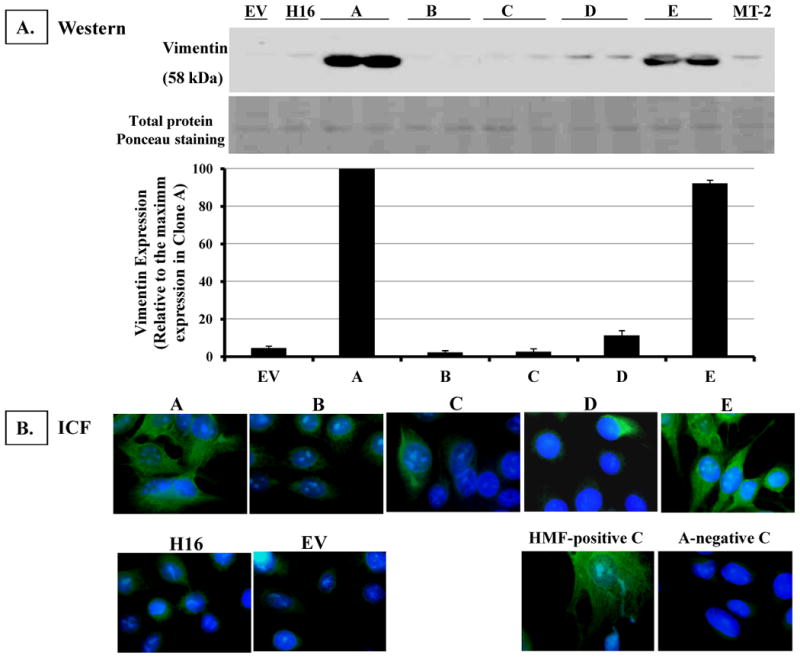
A. Western immunoblotting analysis. Ten micrograms of protein from each clonal cell line was analyzed by Western blotting. Illustrated is a representative blot of vimentin protein expression in the clones (apparent molecular mass of 58 kDa).
B. Immunocytochemical staining for Vimentin expression in H16 clones Clonal cell lines were grown and fixed on cover slips. Cells were immunostained for vimentin by incubating with a 1:50 dilution of mouse anti-vimentin monoclonal antibodies (clone V9) followed by FITC-conjugated donkey anti-mouse antibodies. The nuclei were counter-stained with DAPI fluorescence dye. Cell images were captured by an Olympus fluorescence microscope (500× magnification), and images from DAPI and FITC-fluorescence channels were merged. As a positive control, human mammary fibroblasts (HMF) were stained. Clone A cell line was stained as a negative control by eliminating primary antibody.
Increased AhR Expression is Accompanied by Enhanced Nuclear Translocation and Transcriptional Activity
Since Cytochrome P4501A1 (CYP1A1) expression requires an activated nuclear AhR and the expression of CYP1A1 is a direct measurement of AhR transcriptional activity, we utilized nuclear translocation of AhR and AhR-dependent CYP1A1 expression as two responses of AhR functional activity. Immunocytochemical staining revealed that substantial levels of AhR are localized in the nuclei of clones overexpressing AhR by ∼ 15-fold (clones A, D, E), in the absence of treatment with TCDD, an AhR agonist (Figure 3A). Subcellular fractionation of these clonal cell lines revealed that there are only modest levels of full length AhR protein in the nuclear fractions of clones A, D & E under constitutive, no ligand treatment conditions, with levels only ranging between 10-13% (Figure 3B). However there are substantial levels of a proteolytic fragment of AhR (∼ 37 kDa) in clones A, D and E; and this fragment is not affected by the treatment with TCDD (3-C). This AhR fragment might have contributed to the heavy constitutive nuclear staining in our whole cell immunostaining experiments (Figure 3A). As expected, the treatment of the clones with TCDD for 3 hours has resulted in substantial nuclear localization of full length AhR and its down-regulation in all clones and EV cell line (Figure 3-B).
Figure 3. Analysis of AhR activation in H16 clones.
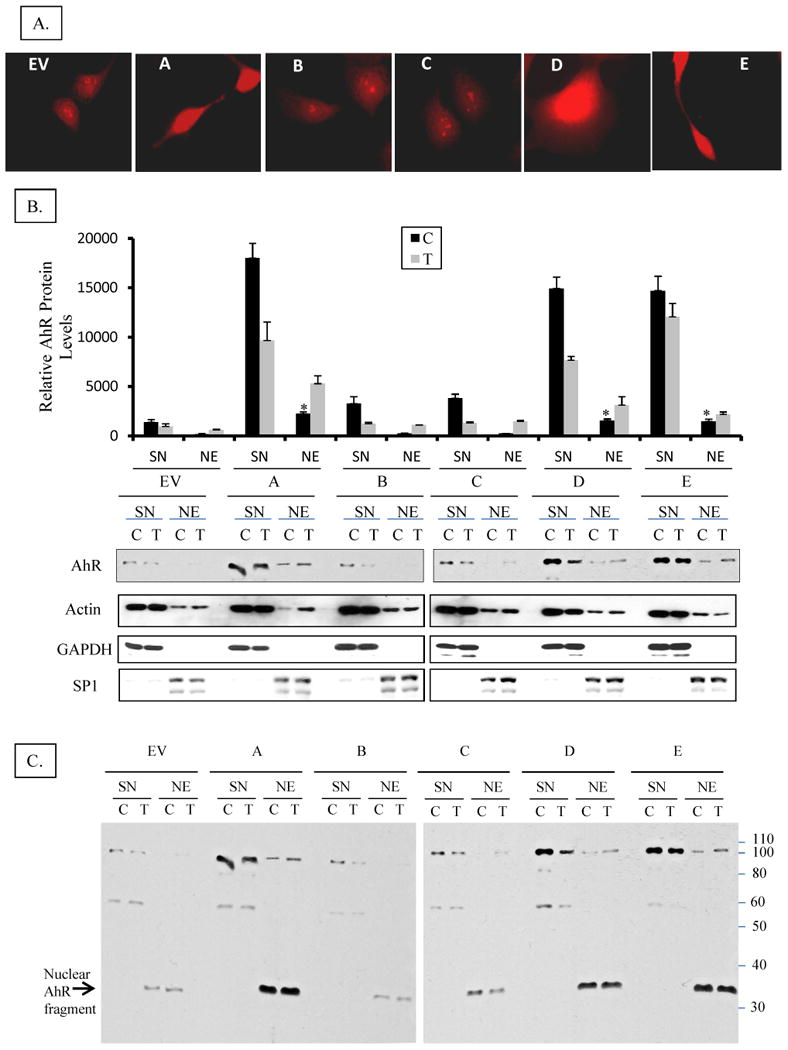
A. Subcellular localization of AhR in H16 clones by immuno-cytochemical staining Clones were grown on cover slips and fixed with methanol: acetone. AhR was visualized by staining with rabbit anti-AhR polyclonal antibodies followed by a rhodamine-conjugated donkey anti-rabbit. Images were captured on an Olympus wide field fluorescence microscope (1000x magnification).
B. Subcellular localization of AhR in H16 clones by nuclear and cytosolic fractionation Cell lines were grown on 6-cm dishes until ∼75% confluent then they were treated with 1 nM TCDD (T) or DMSO (C) for 3 hours. Cells were washed with cold PBS and lyzed at 4°C in 1% NP-40 lysis buffer containing a cocktail of protease and phosphatase inhibitors (as detailed in M & M), and fractionated into nuclei and supernatant (SN), which will be considered cytosolic fraction although it additionally contains detergent-solublized membranes. Nuclei were washed thoroughly in lysis buffer to remove cytosolic contamination then solublized by sonication in lysis buffer forming nuclear extract (NE). The nuclear extracts (NE) and cytosolic fractions (SN) were analyzed by Western blotting for AhR protein expression. The relative level of AhR was normalized by the respective actin level. Cell lysate of untreated EV cell was included as an internal control in different blots to correct for the inter-blot staining variations so as to allow for pooling values from different blots. In the upper panel bars represent means and standard deviations of the corrected values from three independent experiments and (*) denotes constitutive nuclear levels of AhR in clones that are significantly different from nuclear levels in untreated EV control. Lower panel is a representative blot stained consecutively for AhR, Actin (protein loading control), GAPDH (cytosolic protein marker), and Sp1 (nuclear protein marker).
C. Full Western immunoblot for AhR in the clones and EV control cell line A complete image of the representative Western blot shown in the lower panel of 3-B, above, demonstrating the full length AhR and its different fragments and their partitioning in cytosolic or nuclear fractions. Nuclear fragments at 37 kDa are denoted by an arrow.
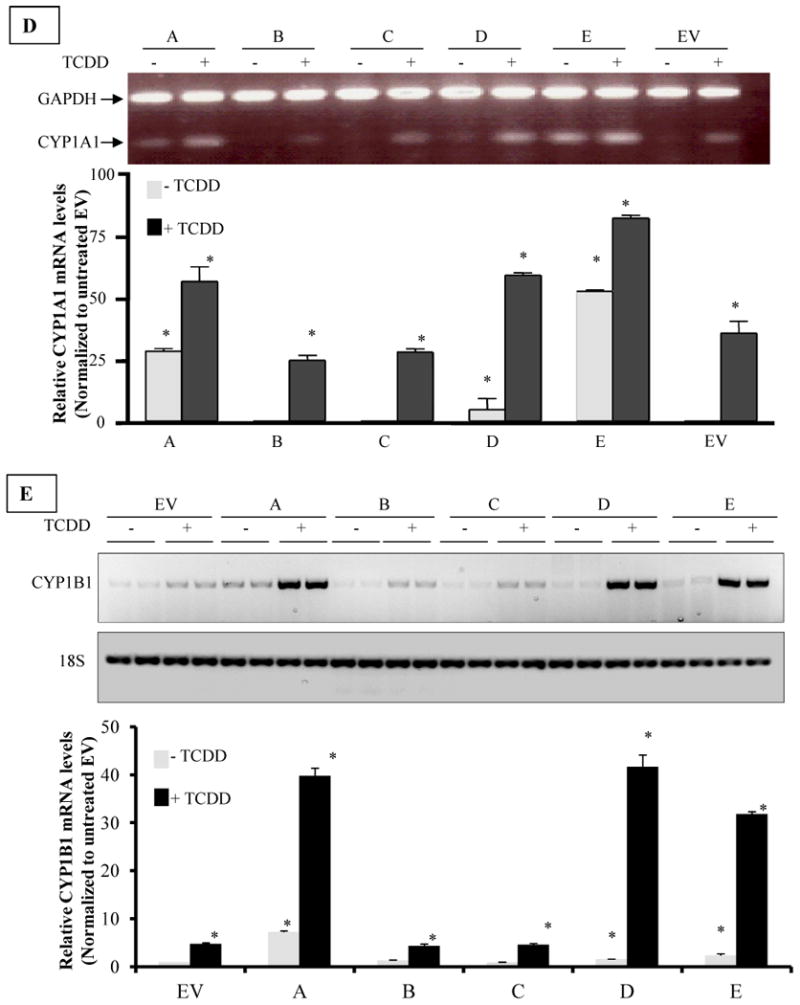
D. RT-PCR analysis of CYP1A1 mRNA expression in H16 Clones Cells were treated with I nM TCDD or vehicle (DMSO) for 24h and total RNA was isolated and subjected to reverse transcriptase (RT) reaction, as described in the M&M section. RT products were subsequently used for PCR amplification of CYP1A1 and glyceraldehyde-3-phosphate dehydrogenase (GAPDH) was amplified simultaneously as an internal control. Upper panel is a representative image of ethidium bromide-stained gel of PCR products from different clones. The intensity of bands was quantified by digital imaging and normalized to GAPDH signals. The means and standard deviations of duplicate PCR of three independent experiments were plotted in graph in lower panel. A (*) denotes significant difference from the values of untreated EV (p<0.05).
E. RT-PCR analysis of CYP1B1 mRNA expression in H16 Clones. Cells were treated TCDD or DMSO and RT-PCR analyses were performed essentially the same as for CYP1A1 except that 18s ribosomal RNA was used as an internal control. Upper panel is a representative image of inverse signal of ethidium bromide-stained gel of PCR products. The intensity of bands was quantified by digital imaging and normalized to 18s signals. The means and standard deviations of duplicate PCR of three independent experiments were plotted in graph in lower panel. A (*) denotes significant difference from the values of untreated EV (p<0.05).
Consequently, clones A & E (but not clone D) showed substantial levels of CYP1A1 mRNA under basal conditions (Figure 3D), consistent with ligand-independent AhR nuclear localization and constitutive activation of AhR. Not surprisingly, TCDD treatment induced CYP1A1 expression by only two-fold in these clones, despite the 15-fold higher AhR levels. This minimal induction is expected since basal levels of CYP1A1 have been so dramatically elevated by AhR overexpression alone.
CYP1B1, another gene that is regulated by AhR has shown different trend of expression, where only clone A expresses substantial level of CYP1B1 mRNA constitutively while clone D & E express low basal levels. TCDD treatment induced CYP1B1 expression in clones A, D & E by 30-40 folds over the levels of untreated EV, while the low AhR-expressing clones (B & C) and EV control induced CYP1B1 by only 5-folds.
AhR Overexpression Increases Cell Cycle Progression to S- and G2/M Phases of Cell Cycle and Correlates with Reduced Cell Doubling Time
To determine the impact of AhR overexpression on the cell cycle, we evaluated the cell cycle distribution of clonal cell lines. Figure 4A provides a comparison of control cells (cells expressing empty vector, EV) with clone A, which expresses ∼15-fold higher AhR level. While 80% of the cells remained in G0/G1 phase of the cell cycle in the EV control cells, only about 30% remained in G0/G1 in clones that overexpressed AhR (Fig 4A). The lower panel summarizes the findings for all clonal cell lines and further illustrates that in all three clones overexpressing AhR, higher percentages of cells exit G0/G1 and pile in S- and G2/M phases.
Figure 4.
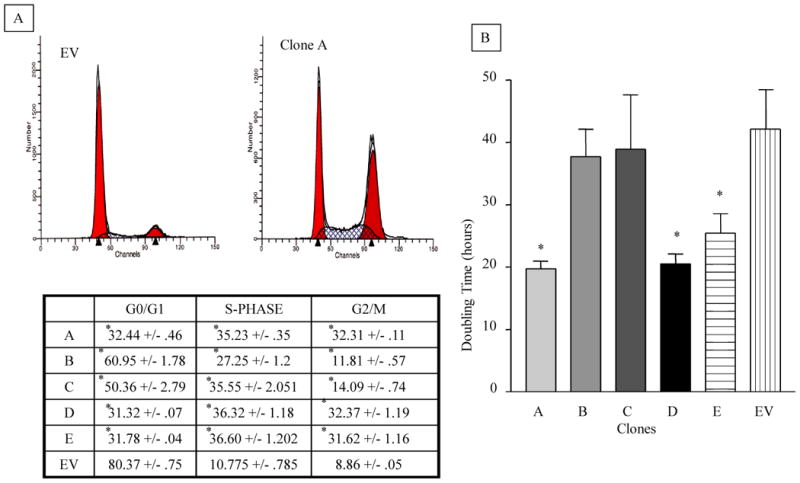
A. Cell Cycle Distribution of AhR-overexpressing clonal cell lines of H16N2. Cells were trypsinized and fixed in 70% ethanol. Single-cell suspension was stained with propidium iodide, and analyzed by fluorescence-activated cell sorting (FACS) analysis as described in the methods section. The percentage of cell cycle distribution was determined using ModFit analysis software. The upper panel is a representative histogram, comparing clone A to the EV control clone. The lower panel is a table summarizing the percentage distribution of cells among different phases of cell cycle. The values in table are means and standard deviations of two independent cultures, each analyzed in duplicates.
B. Population doubling times of AhR-overexpressing clones compared to their vector control. Cells were grown in 96 well plates for 3, 12, 24 and 48 hours. They were then lyzed and the DNA stained with Hoechst 33258 nucleic acid dyes. DNA fluorescence was measured (in Artificial Fluorescence Units AFU, which were correlated to cell numbers) using excitation and emission wavelength 360nm and 460nm, respectively. Cell numbers were plotted against time using Graphpad statistical software and doubling times were calculated by non-linear regression curve analysis (for exponential growth). Values in graph are average population doubling times of the clonal cell lines. Values are means and standard deviations of triplicate determination of three independent experiments. (*) Denotes significant difference from the EV control ((p<0.05).
In order to determine what effect the AhR-induced abrogation of cell cycle transition might have on overall cellular proliferation, doubling times for each clone were compared to the EV control. Only the clones with the highest AhR overexpression (clones A, D, and E) exhibited a statistically significant decrease in doubling time. These clonal cell lines had a calculated doubling time of about 25 hours based on nonlinear regression data analysis of Hoechst 33258 staining for DNA content (see Methods). In contrast, the proliferation rates of clonal cell lines with modest (clone B and clone C) increases in AhR expression, had a doubling time that was not significantly different from the EV control, i.e. a calculated doubling time of about 50 hours (Figure 4B).
Ectopic AhR Overexpression is Associated with Altered Expression of Cell Cycle Regulatory Proteins
To further identify the source of the cell cycle abrogation in clones overexpressing AhR, we analyzed the expression of key regulators of cell cycle transition from G1 phase, including cyclin D1, cyclin E and their dependent kinases, CDK4 and CDK2. Results in Figure 5 showed that there is a significant up-regulation of both cyclin D1 and cyclin E in clones over-expressing AhR (A, D and E). Results for CDK2 analysis showed its significant increase in clones A and E, while only clone A has a significant increase in CDK4 expression, compared to EV control. On the other hand, the expression of Rb protein, another key player in G1→S transition, was significantly higher in all three clones expressing high AhR levels (clones A, D and E).
Figure 5. Analysis of cell cycle regulatory molecules in AhR-transformed H16N2 clones in comparison to their empty vector (EV) control.
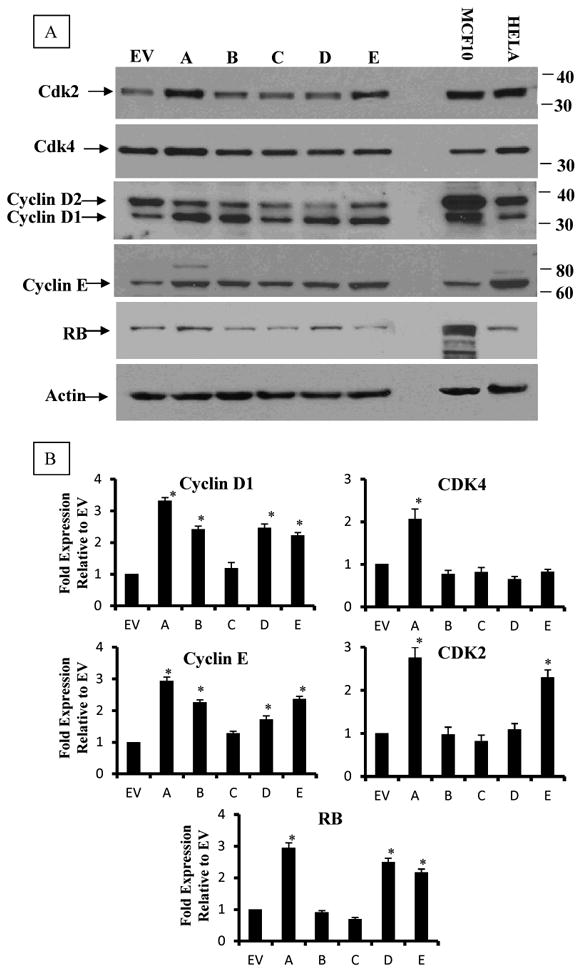
Expression of cyclins D1 and E, their cyclin-dependent kinases CDK2 and CDK4 and tumor suppressor RB. Cells growing at 80% confluent were lyzed in Trizol and proteins were isolated and analyzed by Western blotting. Upper Panel is a representative blot and lower panel is the densitometric quantitation of the blots. Values in the graphs are means and standard deviations of n=3 independent blot analyses of duplicate experiment, extracts from MCF10 and Hela cell line were used as internal standard. Significant increase over the values of EV (p<0.05) is denoted by (*).
Increased AhR Expression Promotes Mammary Epithelial Cell Migration and Invasion
Transformed cells possess a number of functional changes that distinguish them from untransformed cells. In addition to increased proliferation and altered cell cycle regulation, transformed cells also could acquire the ability to invade the extracellular matrix, in part due to their enhanced migration and proteolytic activities. In order to assess these characteristics of transformation, we measured the invasive potential of each clonal cell line by determining its ability to invade matrigel matrix in vitro. Matrigel, by occluding the pores of a semi-porous membrane that bisects a cell culture well, provides a barrier that is sufficient to preclude non-invasive cells from moving from the upper to lower cell culture compartment. In contrast, invasive cells have the ability to degrade the matrigel and migrate to the underside of the membrane. As shown in figure 6, clones A, D & E manifest invasive potential that is comparable to the metastatic MT2 breast cancer cell line, which is included as a positive control (Fig 6A). Thus, approximately eighty to ninety percent of the cells from clonal lines A, D or E were invasive. Microscopic images of the underside of the membrane correlate with the percentage of invasive cells calculated (lower panel).
Figure 6. Effect of AhR-overexpression on migration and invasive potential of H16N2 human mammary epithelial cell lines.
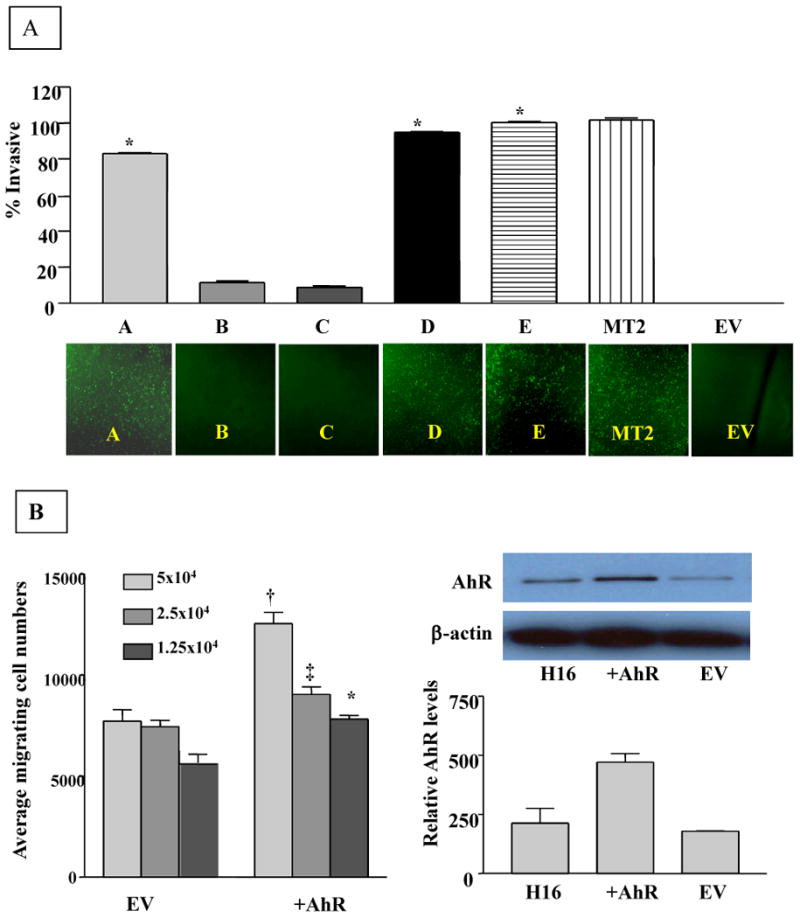
A. Analysis of invasive potential of AhR-transformed clones of H16N2 cell lines. Cell suspensions (2.5 × 10⁴) of normal or AhR over-expressing cells were plated in BD FluoroBlok invasion chambers containing matrigel, and incubated for 24 hours. Cells passing to the underside of the insert were stained with calcein AM fluorescence dye. Calcein fluorescence of invasive cells was measured on Cytofluor at excitation/emission wavelengths 485/530nm respectively. The fluorescence of the invasive cells was calculated as a percentage of the fluorescence of total cells. A. Values plotted are the means and standard deviations of three independent experiments, where each experiment was run in duplicate. (*) Denotes significant difference from EV control (p< 0.05). Lower panel: Representative microscopic images of invasive cells were taken at 10X magnification following staining with calcein AM of the underside of the insert.
B. Effects of overexpressed AhR on migration of H16 mammary epithelial cells. The migration measurements were done using the BD FluoroBlok chambers without matrigel. Cell suspensions were prepared by trypsinizing cell monolayers and resupending the cells in serum free media at 5×10⁴ cells/ml. Medium (750ul) containing 5% fetal calf serum was added to the bottom of each well as a chemo-attractant. A 500ul aliquot of the cell suspension (at three cell densities) was added to the top chamber. The cells were incubated at 37°C for 24 hours. Following incubation, the media from the top chamber was carefully removed by aspiration and the insert was transferred to a second plate containing 0.5ml/well of 4μg/ml Calcein AM (Molecular Probes, Eugene, OR). The plates were allowed to incubate for 1 hour at 37°C. Calcein fluorescence of the migrating cells was read at excitation and emission wavelength of 485 and 530 respectively. Symbols denote significant difference (p<0.05) from the respective EV control of different cell density.
Preliminary studies using cells overexpressing AhR prior to their subcloning to individual clonal cell lines revealed that the degree of cellular migration also correlates with overall AhR expression (Figure 6B) and as expected, has a characteristic dependence on cell density. Cells overexpressing AhR exhibited an average of 1.5-fold enhanced migration compared to their empty vector-carrying controls, indicating that AhR significantly (p<0.05) increased the migration ability of H16 mammary epithelial cell lines (Figure 6B).
Increased AhR Expression Correlates with Anchorage-Independent Growth
In order to assess the ability of the clonal cell lines to grow detached from the surface, we grew the clonal cell lines in soft agar for 2 weeks and determined the extent of colony formation microscopically. As shown in Figure 7, clonal lines A, D, and E formed colonies comparable in size and number to those colonies formed by the metastatic MT2 cell line. In addition, each formed 20-25 colonies per field compared to visibly single viable cells in each field for clones B and C, which are expressing a small enhancement of AhR expression (figure 7).
Figure 7. Anchorage-independent growth of H16N2 clones overexpressing AhR.

Single-cell suspensions of different clones were prepared in 0.3% agar media and overlaid onto 0.6% agar layer coated on each well of the six-well plates. Cells were plated in triplicate at two cell densities. Individual cells were visualized microscopically and colony formation was monitored for up to 2 weeks. The numbers of colonies were counted at low magnification (20x) and the scoring was done by three independent observers. Values are means and standard deviations of two independent experiments. A (*) is significantly different from EV control (p<0.05).
Expression of AhR Repressor (AhRR) does not Correlate with AhR Levels
In order to investigate the relevance of AHRR expression to this AhR-mediated transformation of HMEC, we measured the expression of AhRR mRNA in clones A-E in comparison to EV cell line. As reported in Figure 8, the levels of AhRR in the clones overexpressing AhR by 15-fold were not significantly different from the levels in EV-expressing cell line, thus demonstrating the lack of correlation between AhRR expression, the level of AhR in these clones and their acquired phenotypes.
Figure 8. Relative AhRR mRNA expression in clones overexpressing AhR.

Ectopic overexpression of AhR in H16 mammary epithelial cells did not affect the levels of AhRR expression. QRT-PCR was used for determining the expression of AhRR in the clones compared to EV-control cell. The values of AhRR mRNA levels were normalized to the levels of 18S ribosomal RNA of each sample. Relative normalized values of AhRR in different clones compared to the EV-expressing cell line were graphed as the mean ± SD from triplicate assays of two independent cultures of the cell lines.
Discussion
In this study we provide the first evidence that the AhR is capable of inducing tumorigenic transformation in immortalized human mammary epithelial cells. Classically, transformation is associated with genetic instability and three major phenotypic changes: immortalization, aberrant growth control, and malignancy [34]. While the parental cell line used in our studies was previously immortalized, increased AhR expression in this cell line was both necessary and sufficient to induce aberrant growth and malignant phenotypes, such as increased proliferation, changes in cell cycle regulation, enhanced migration and invasion of matrigel matrix as well as anchorage-independent growth.
Immortalization does not automatically result in a loss of growth control, since our cell cycle analysis showed that the parental immortalized human mammary epithelial cells (the parent H16 cell line or its empty vector-carrying control EV) are under stringent G1→S transition control. However, increased AhR expression appeared to release these mammary epithelial cells from the G1→S block towards a much-deregulated cell cycle leading to an accumulation of cells in the S and G2/M phases. Interestingly, the low to moderate increases in AhR expression (clones B and C) have resulted only in accumulation of cells in the S-phase, while only high AhR-expressing clones (clones A, D and E) managed to transition S-phase and accumulate in the G2/M phase, suggesting a requirement of high AhR expression level for this progression. The failure of clones B and C to transition through S-phase was reflected in their growth rate, where their doubling times were not different from the parent cells.
Consistent with this phenotypic deregulation of cell cycle control, the over-expression of AhR has resulted in upregulation of factors required for S-phase transition, such as cyclin D1 and its dependant kinase, cdk4 and cyclin E and its dependant kinase, cdk2. Increases in these cell cycle regulators contribute to hyper-phosphorylation of Rb and the subsequent release of E2F transcription factor to induce the transcription of S-phase genes. This effect is further potentiated by the finding that Rb expression was also upregulated in clones overexpressing AhR. A recent report showing that depletion of AhR by siRNA results in a significant decrease in expression of cyclin D1, cyclin E, Cdk4, and Cdk2 in HepG2 cells further supports our findings [34].
The data we are reporting here on the effects of AhR in transforming HMEC do not involve its ligand-dependent activation. Nevertheless, the high expression of AhR in clones A, D and E was accompanied by constitutive activation of AhR as evident by its nuclear localization and increase transcription of CYP1A1 and CYP1B1 in absence of ligand treatment. In addition to the full length AhR protein, the nuclear localization also involves, and to a larger extent a 37kDa fragment of the AhR. The antibody which is used to detect this fragment is against N-terminal domain of AhR; hence the fragment lacks the c-terminal part of the receptor which encompasses the transactivation domain. This would imply that the fragment can function as a dominant negative regulator for AhR, attenuating its transcriptional activity, which explains the lack of correlation between the high intensity fluorescence staining for nuclear AhR in untreated clones A, D, & E and the modest expression of constitutive CYP1A1 in these clones.
The direct association between Rb and AhR, which is deemed crucial in the TCDD (AhR agonist)-induced cell cycle arrest [35, 36] requires AhR activation and nuclear localization [37]. To reconcile our contradicting observation here that high AhR nuclear accumulation in clones overexpressing AhR resulted in enhancing cell cycle progression, we are proposing two models. In one model, AhR-Rb interaction functions to repress E2F activity causing G1/S arrest, while in the other model, a defect in AhR-Rb interaction will relieve the repression on E2F to enhance the transcription of genes encoding G1/S regulatory proteins and inducing cell cycle progression [36]. The reported LXCXE motif for Rb binding with AhR is located within the N-terminal 364 amino acids of the AhR [35]. However, a second site that is localized at the glutamine-rich domain in the C-terminal domain of AhR was reported to be required for efficient Rb-AhR interaction accounting for 20-fold enhancement of the activity resulting from the two protein binding [35]. It is conceivable that the disparate high nuclear accumulation of the truncated 37kDa AhR lacking the C-terminal domain is contributing to diminished Rb-AhR interaction efficiency, resulting in the relief of repression on E2F and inducing cell cycle progression in our clones.
However, a recent report has excluded a direct AhR-Rb interaction and suggested that in the absence of ligand, the AhR interacts in a complex with CDK4 and cyclin D1 to promote cell cycle progression, and that such interaction is disrupted by TCDD leading to a decreased Rb phosphorylation; repressing E2F activity and cell cycle arrest [38].
Alternatively, AhR has also been shown to directly interact with the transcription factor NF-κB, which is known to regulate many genes involved in proliferation, transformation, and apoptosis. In human breast epithelia and breast cancer cell lines, there is a reported constitutive physical interaction between NF-κB and AhR leading to enhanced transcription of c-myc oncogene [39]. This enhanced transcription of c-myc thereby might lead to increased proliferation and transformation.
Our data are important extensions of previous studies that have explored the impact of relative AhR density on cell growth [40, 41]. For instance, a lung cancer cell line (A549) manipulated to overexpress AhR grew at a faster rate in proportion to the extent of AhR expression [41]. Conversely, Hepa-1 variant cells that express lower amount of AhR when compared to wild-type Hepa-1 cells, exhibited a delayed cell growth and longer doubling time [40]. Our data are consistent with these findings, although these two studies are on tumor cells; as they affirm that AhR expression level correlates with enhanced cellular proliferation. More importantly, we have shown that AhR overexpression alone is sufficient to induce additional malignant phenotypes.
Invasion potential is a good indicator for malignancy, and our invasion assessment experiments showed that overexpression of AhR was sufficient to induce invasiveness in immortalized HMEC, to a level comparable to a metastatic cell line. Clones which are overexpressing AhR but at lower level failed to invade the matrigel matrix in vitro, suggesting that there is a threshold for AhR expression level required for this phenotype. In support of this finding is a report that TCDD, an AhR potent agonist which activate and subsequently down-regulate the receptor [42], inhibited invasion activity of a metastatic breast cancer cell line [43].
The two clones with the highest expression of AhR exhibited epithelial-to-mesenchymal transition (EMT), a process which usually occurs during critical phases of tumor progression to the metastatic phenotype [44]. The key step during this process is the disruption of E-cadherin-mediated cell-cell contact. The loss of E-cadherin expression is due to transcriptional repression [45, 46] mediated by a family of zinc finger proteins of the Slug/Snail family [47, 48]. The AhR has been shown to participate as a transcription factor in the induction of Slug expression in the context of loss of cell–cell contact, which, in turn, regulates EMT [49]. Ectopic co-expression of CK2 and NFkB c-Rel in untransformed mammary epithelial cells was sufficient to induce a mesenchymal invasive phenotype, in association with induction of AhR and Slug. Conversely, the up-regulation of Slug was abrogated by co-expression of AhR repressor (AhRR), indicating that Slug expression is regulated by AhR [50].
The lack of the repressor activity of the AhRR was proposed in a recent report to be the culprit for the role of AhR in developing cancers in absence of exogenous ligand [32]. However, our study does not corroborate with this report where we are unable to detect any correlation between AhRR expression and that of AhR or between the AhRR expression and the acquired transformation phenotypes in our clones. AhRR is generally described as being induced by exogenous AhR ligands such as TCDD [51]; requiring a ligand-activated AhR. This induced AhRR in turn suppresses AhR activity in a feedback loop. Therefore, the AhRR mRNA levels generally increase following AhR activation with ligands such as TCDD, and AhRR usually affects the AhR transcriptional activity (e.g., CYP1A1 induction) but not the AhR levels, which could partially explain our findings. AhR was reported to repress transcription of some target genes; therefore it is possible that in our clones, for AhR to maintain its crucial role of driving cellular growth and survival, it will suppress AhRR transcription so as to relieve the negative feedback loop (reviewed in 52). Another explanation of our data could be that the outcome of AhR-AhRR interactions might be more complex than the simplistic model of AhR-induced, AhRR-mediated feedback model, and that the outcome of their interaction could be cell-specific and context-specific.
Classically this receptor was viewed in the context of its role in mediating the toxic and biochemical responses to environmental PAH [3, 53]. The contribution of AhR to PAH-induced carcinogenesis is well characterized through its role in the transcriptional activation of a battery of genes including CYP1A1, CYP1A2 and CYP1B1 [6, 54]. The protein products of these genes catalyze the bioactivation of some endogenous and exogenous chemicals into reactive metabolites that form DNA adducts thus contributing to the initiation of pre-neoplastic lesions [55]. In addition to this mechanism, AhR was also shown to shuttle PAH reactive metabolites into the nucleus, further contributing to enhancement of PAH-induced DNA damage [56].
Our research investigated and provided evidence for a role of AhR in driving the progression of breast carcinoma. This novel role for AhR is independent of ligand activation, therefore this work is distinct from, although it complements the studies using constitutively active AhR [57-59]. These studies report that transgenic mice expressing constitutively active AhR exhibited severe tumors of the glandular part of the stomach [57] and acquired higher susceptibility to development of hepatocellular carcinoma in response to treatment with a liver carcinogen [58]. Although no ligand for AhR was involved, the constitutively active AhR was generated by deletion of the ligand-binding domain to mimic the agonist-activated receptor [59], therefore it is likely that the pathway involved is via the transcriptional induction of CYPs and bioactivation with the subsequent cancer initiation. An indirect support for our work was provided by a recent report from Fernandez-Salguero's laboratory [60], where his group have shown that the lack of AhR in mouse mammary fibroblasts, co-transfected with the simian virus 40 (SV-40) large T antigen and c-H-Ras proto-oncogene, lowers their ability to induce subcutaneous tumors in immunodeficient mice by four fold. Unlike our findings, the lack of AhR in these cells did not affect their doubling time or their cell cycle distribution in culture. However, it led to their diminished migration on collagen and correlated with down-regulation in their VEGF and ERK-FAK-AKT-Rac-1 pathways. The authors related the lower tumorigenic potential of AhR-/- cells to their impaired ability to migrate and to respond to angiogenic signals.
The novelty of our study is that it addresses the basic question of whether AhR itself has the potential of acting as a proto-oncogene and as a factor capable of advancing the progression of breast carcinoma and our data have provided some support for this claim.
Conclusion
Although the precise molecular mechanism requires further investigation, the present data suggest that AhR has an oncogenic potential and contributes to the progression of breast cancer from pre-cancerous to malignant invasive carcinoma. Such action of AhR might not be unique for the breast and might accompany tumor progression in other target organ/system. Thus the data identify AhR as a relevant therapeutic target for cancer treatment.
Acknowledgments
The authors acknowledge Drs. Lee Limbird, Ida Owens and Steve Safe for their invaluable critical reviewing of the manuscript and Petra Prins for technical assistance. This research was supported by NIH grants RR03032 15, CA91408-01 and Department of Defense (DOD) grant DAMD17-02-01-0483 to SEE and DOD Predoctoral fellowship DAMD17-02-01-0458 to JB.
Abbreviations
- AhR
aryl hydrocarbon receptor
- ARNT
aryl hydrocarbon receptor nuclear translocation protein
- CYP1A1
cytochrome P450 1A1
- CYP1B1
cytochrome P450 1B1
- bHLH
basic helix-loop-helix
- HMEC
human mammary epithelial cell line
- PAH
polyaromatic hydrocarbons
- TCDD
2,3,7,8-tetrachlorodibenzo-p-dioxin
- FACS
fluorescence activated cell sorter
- Rb
retinoblastoma
- cdk
cyclin-dependent kinase
- EV
empty vector
Footnotes
Eltom S.E., Gasmelseed A.A. and Saoudi-Guentri D. The aryl hydrocarbon receptor is over-expressed and constitutively activated in advanced breast carcinoma. Proc. Amer. Assoc. Cancer Res. 2007, 47,1730
Conflict of Interest: The authors declare that they have no conflict of interest.
References
- 1.Burback K, Poland A, Bradfield C. Cloning of the Ah receptor cDNA reveals a distinctive ligand-activated transcription factor. Proc Natl Acad Sci. 1992;89:8185–8189. doi: 10.1073/pnas.89.17.8185. [DOI] [PMC free article] [PubMed] [Google Scholar]
- 2.Poland A, Knutson J. 2,3,7,8-Tetrachlorodibenzo-p-dioxin and related halogenated aromatic hydrocarbons: examination of the mechanism of toxicity. Annu Rev Pharmacol Toxicol. 1982;22:517–554. doi: 10.1146/annurev.pa.22.040182.002505. [DOI] [PubMed] [Google Scholar]
- 3.Rowlands JC, Gustafsson JA. Aryl hydrocarbon receptor-mediated signal transduction. Crit Rev Toxicol. 1997;27:109–134. doi: 10.3109/10408449709021615. [DOI] [PubMed] [Google Scholar]
- 4.Crews ST. Control of cell lineage-specific development and transcription by bHLH-PAS proteins. Genes Dev. 1998;12:607–620. doi: 10.1101/gad.12.5.607. [DOI] [PubMed] [Google Scholar]
- 5.Gonzalez FJ, Fernandez-Salguero P. The aryl hydrocarbon receptor: studies using the AHR-null mice. Drug Metab Dispos. 1998;26:1194–1198. [PubMed] [Google Scholar]
- 6.Whitlock JP., Jr Induction of cytochrome P4501A1. Annu Rev Pharmacol Toxicol. 1999;39:103–125. doi: 10.1146/annurev.pharmtox.39.1.103. [DOI] [PubMed] [Google Scholar]
- 7.Hankinson O. Role of coactivators in transcriptional activation by the aryl hydrocarbon receptor. Arch Biochem Biophys. 2005;433:379–386. doi: 10.1016/j.abb.2004.09.031. [DOI] [PubMed] [Google Scholar]
- 8.Dale Y, Eltom SE. Calpain mediates dioxin-induced activation and down-regulation of the aryl hydrocarbon receptor. Mol Pharmacol. 2006;70:1481–1487. doi: 10.1124/mol.106.027474. [DOI] [PubMed] [Google Scholar]
- 9.Davarinos NA, Pollenz RS. Aryl hydrocarbon receptor imported into the nucleus following ligand binding is rapidly degraded via the cytosplasmic proteasome following nuclear export. J Biol Chem. 1999;274:28708–28715. doi: 10.1074/jbc.274.40.28708. [DOI] [PubMed] [Google Scholar]
- 10.Ma Q, Baldwin KT. 2,3,7,8-tetrachlorodibenzo-pdioxin-induced degradation of aryl hydrocarbon receptor (AhR) by the ubiquitin-proteasome pathway. Role of the transcription activation and DNA binding of AhR. J Biol Chem. 2000;275:8432–8438. doi: 10.1074/jbc.275.12.8432. [DOI] [PubMed] [Google Scholar]
- 11.Santiago-Josefat B, Fernandez-Salguero PM. Proteasome inhibition induces nuclear translocation of the dioxin receptor through an Sp1 and protein kinase C-dependent pathway. J Mol Biol. 2003;333:249–260. doi: 10.1016/j.jmb.2003.08.020. [DOI] [PubMed] [Google Scholar]
- 12.Song J, Clagett-Dame M, Peterson RE, Hahn ME, Westler WM, Sicinski RR, DeLuca HF. A ligand for the aryl hydrocarbon receptor isolated from lung. Proc Natl Acad Sci. 2002;99:14694–14699. doi: 10.1073/pnas.232562899. [DOI] [PMC free article] [PubMed] [Google Scholar]
- 13.Wattenberg LW, Loub WD. Inhibition of polycyclic aromatic hydrocarbon-induced neoplasia by naturally occurring indoles. Cancer Res. 1978;38:1410–1413. [PubMed] [Google Scholar]
- 14.Sadek CM, Allen-Hoffmann BL. Suspension-mediated induction of Hepa 1c1c7 Cyp1a-1 expression is dependent on the Ah receptor signal transduction pathway. J Biol Chem. 1994;269:31505–31509. [PubMed] [Google Scholar]
- 15.Reiners JJ, Jr, Cantu AR, Pavone A. Modulation of constitutive cytochrome P-450 expression in vivo and in vitro in murine keratinocytes as a function of differentiation and extracellular Ca2+ concentration. Proc Natl Acad Sci. 1990;87:1825–1829. doi: 10.1073/pnas.87.5.1825. [DOI] [PMC free article] [PubMed] [Google Scholar]
- 16.Scholler A, Hong NJ, Bischer P, Reiners JJ., Jr Short and long term effects of cytoskeleton-disrupting drugs on cytochrome P450 Cyp1a-1 induction in murine hepatoma 1c1c7 cells: suppression by the microtubule inhibitor nocodazole. Mol Pharmacol. 1994;45:944–954. [PubMed] [Google Scholar]
- 17.Hahn ME. Aryl hydrocarbon receptors: diversity and evolution. Chem Biol Interact. 2002;141:131–160. doi: 10.1016/s0009-2797(02)00070-4. [DOI] [PubMed] [Google Scholar]
- 18.Abbott BD, Birnbaum LS, Perdew GH. Developmental expression of two members of a new class of transcription factors: I. Expression of aryl hydrocarbon receptor in the C57BL/6N mouse embryo. Dev Dyn. 1995;204:133–143. doi: 10.1002/aja.1002040204. [DOI] [PubMed] [Google Scholar]
- 19.Schmidt JV, Su GHT, Reddy JK, Simon MC, Bradfield CA. Characterization of a murine Ahr null allele: involvement of the Ah receptor in hepatic growth and development. Proc Natl Acad Sci. 1996;93:6731–6736. doi: 10.1073/pnas.93.13.6731. [DOI] [PMC free article] [PubMed] [Google Scholar]
- 20.Mimura J, Yamashita K, Nakamura K, Morita M, Takagi TN, Nakao K, Ema M, Sogawa K, Yasuda M, Katsuki M, Fujii-Kuriyama Y. Loss of teratogenic response to 2,3,7,8-tetrachlorodibenzo-p-dioxin (TCDD) in mice lacking the Ah (dioxin) receptor. Genes Cells. 1997;2:645–654. doi: 10.1046/j.1365-2443.1997.1490345.x. [DOI] [PubMed] [Google Scholar]
- 21.Fernandez-Salguero P, Pineau T, Hilbert DM, McPhail T, Lee SS, Kimura S, Nebert DW, Rudikoff S, Ward JM, Gonzalez FJ. Immune system impairment and hepatic fibrosis in mice lacking the dioxin-binding Ah receptor. Science. 1995;268:722–726. doi: 10.1126/science.7732381. [DOI] [PubMed] [Google Scholar]
- 22.Matsumura F, Puga A, Tohyama C, editors. Biological Functions of the Ah Receptor: Beyond Induction of Cytochrome P450s. Biochem Pharmacol. 2009;77:473–760. doi: 10.1016/j.bcp.2008.10.037. [DOI] [PubMed] [Google Scholar]
- 23.Esser C, Temchura V, Majora M, Hundeiker C, Schwarzler C, Gunthert U. Signaling via the AHR leads to enhanced usage of CD44v10 by murine fetal thymic emigrants: possible role for CD44 in emigration. Int Immunopharmacol. 2004;4:805–818. doi: 10.1016/j.intimp.2004.03.006. [DOI] [PubMed] [Google Scholar]
- 24.Koliopanos A, Kleeff J, Xiao Y, Safe S, Zimmermann A, Buchler MW, Friess H. Increased arylhydrocarbon receptor expression offers a potential therapeutic target for pancreatic cancer. Oncogene. 2002;21:6059–6070. doi: 10.1038/sj.onc.1205633. [DOI] [PubMed] [Google Scholar]
- 25.Schlezinger J, Liu D, Farago M, Seldin D, Belguise K, Sonenshein G, Sherr DA. Role for the aryl hydrocarbon receptor in mammary gland tumorigenesis. Biol Chem. 2006;387:1175–1187. doi: 10.1515/BC.2006.145. [DOI] [PubMed] [Google Scholar]
- 26.Safe S. Modulation of gene expression and endocrine response pathways by 2,3,7,8-tetrachlorodibenzo-p-dioxin and related compounds. Pharm Ther. 1995;67:247–281. doi: 10.1016/0163-7258(95)00017-b. [DOI] [PubMed] [Google Scholar]
- 27.Krishnan V, Porter W, Santostefano M, Wang X, Safe S. Molecular mechanism of inhibition of estrogen-induced cathepsin D gene expression by 2,3,7,8-tetrachlorodibenzo -p-dioxin (TCDD) in MCF-7 cells. Mol Cell Biol. 1995;15:6710–6719. doi: 10.1128/mcb.15.12.6710. [DOI] [PMC free article] [PubMed] [Google Scholar]
- 28.Wang W, Smith R, 3rd, Safe S. Aryl hydrocarbon receptor-mediated antiestrogenicity in MCF-7 cells: modulation of hormone-induced cell cycle enzymes. Arch Biochem Biophys. 1998;356:239–248. doi: 10.1006/abbi.1998.0782. [DOI] [PubMed] [Google Scholar]
- 29.Hushka LJ, Williams JS, Greenlee WF. Characterization of 2,3,7,8-tetrachlorodibenzofuran-dependent suppression and AH receptor pathway gene expression in the developing mouse mammary gland. Toxicol Appl Pharmacol. 1998;152:200–210. doi: 10.1006/taap.1998.8508. [DOI] [PubMed] [Google Scholar]
- 30.Trombino AF, Matulka RA, Yang S, Hafer LJ, Rogers AE, Tosselli P, Kim D, Sonenshein GE, Near RI, Sherr DH. Expression of the aryl hydrocarbon receptor/transcription factor (AhR) and AhR-regulated CYP1 gene transcription in a rat model of mammary tumorigenesis. Breast Cancer Res Treat. 2000;62:117–131. doi: 10.1023/a:1006443104670. [DOI] [PubMed] [Google Scholar]
- 31.Band V, Zajchowski D, Swisshelm K, Trask D, Kulesa V, Cohen C, Connolly J, Sager R. Tumor progression in four mammary epithelial cell lines derived from the same patient. Cancer Res. 1990;50:7351–7357. [PubMed] [Google Scholar]
- 32.Zudaire E, Cuesta N, Murty V, Woodson K, Adams L, Gonzalez N, Martínez A, Narayan G, Kirsch I, Franklin W, Hirsch F, Birrer M, Cuttitta F. The aryl hydrocarbon receptor repressor is a putative tumor suppressor gene in multiple human cancers. J Clin Invest. 2008;118:640–650. doi: 10.1172/JCI30024. [DOI] [PMC free article] [PubMed] [Google Scholar]
- 33.Kern SE. Progressive Genetic Abnormalities in Human Neoplasia. In: Howley PM, Israel MA, Liotta LA, editors. The Molecular Basis of Cancer; Mendelsohn J. W.B. Saunders Co.; Philadelphia PA: 2001. pp. 41–69. [Google Scholar]
- 34.MolAbdelrahim M, Smith R, 3rd, Safe S. Aryl hydrocarbon receptor gene silencing with small inhibitory RNA differentially modulates Ah-responsiveness in MCF-7 and HepG2 cancer cells. Mol Pharmacol. 2003;63:1373–1381. doi: 10.1124/mol.63.6.1373. [DOI] [PubMed] [Google Scholar]
- 35.Ge NL, Elferink CJ. A direct interaction between the aryl hydrocarbon receptor and retinoblastoma protein: Linking dioxin signaling to the cell cycle. J Biol Chem. 1998;273:22708–22713. doi: 10.1074/jbc.273.35.22708. [DOI] [PubMed] [Google Scholar]
- 36.Huang G, Elferink CJ. Multiple mechanisms are involved in Ah receptor-mediated cell cycle arrest. Mol Pharmacol. 2005;67:88–96. doi: 10.1124/mol.104.002410. [DOI] [PubMed] [Google Scholar]
- 37.Puga A, Barnes SJ, Dalton TP, Chang C, Knudsen ES, Maier MA. Aromatic hydrocarbon receptor interaction with the retinoblastoma protein potentiates repression of E2F-dependent transcription and cell cycle arrest. J Biol Chem. 2000;275:2943–2950. doi: 10.1074/jbc.275.4.2943. [DOI] [PubMed] [Google Scholar]
- 38.Barhoover MA, Hall JM, Greenlee WF, Thomas RS. Aryl hydrocarbon receptor regulates cell cycle progression in human breast cancer cells via a functional interaction with cyclin-dependent kinase 4. Mol Pharmacol. 2010;77:195–201. doi: 10.1124/mol.109.059675. [DOI] [PubMed] [Google Scholar]
- 39.Kim DW, Gazourian S, Quadri DS, Sherr DH, Sonenshein G. The RelA NF-kB subunit and the aryl hydrocarbon receptor (AhR) cooperate to transactivate the c-myc promoter in mammary cells. Oncogene. 2000;19:5498–5506. doi: 10.1038/sj.onc.1203945. [DOI] [PubMed] [Google Scholar]
- 40.Ma Q, Whitlock JP., Jr The aromatic hydrocarbon receptor modulates the Hepa 1c1c7 cell cycle and differentiated state independently of dioxin. Mol Cell Biol. 1996;16:2144–2150. doi: 10.1128/mcb.16.5.2144. [DOI] [PMC free article] [PubMed] [Google Scholar]
- 41.Shimba S, Komiyama K, Moro I, Tezuka M. Overexpression of the aryl hydrocarbon receptor (AhR) accelerates the cell proliferation of A549 cells. J Biochem (Tokyo) 2002;132:795–802. doi: 10.1093/oxfordjournals.jbchem.a003289. [DOI] [PubMed] [Google Scholar]
- 42.Pollenz RS. The aryl-hydrocarbon receptor, but not the aryl-hydrocarbon receptor nuclear translocator protein, is rapidly depleted in hepatic and nonhepatic culture cells exposed to 2,3,7,8-tetrachlorodibenzo-p-dioxin. Mol Pharmacol. 1996;49:391–398. [PubMed] [Google Scholar]
- 43.Greenlee WE, Hushka LJ, Hushka DR. Molecular basis of dioxin actions: evidence supporting chemoprotection. Toxicol Pathol. 2001;29:6–7. doi: 10.1080/019262301301418810. [DOI] [PubMed] [Google Scholar]
- 44.Thiery JP. Epithelial–mesenchymal transitions in tumor progression. Nat Rev Cancer. 2002;2:442–454. doi: 10.1038/nrc822. [DOI] [PubMed] [Google Scholar]
- 45.Comijn J, Berx G, Vermassen P, Verschueren K, Grunsven L, Bruyneel E. The two-handed E box binding zinc finger protein SIP1 downregulates E-cadherin and induces invasion. Mol Cell. 2001;7:1267–1278. doi: 10.1016/s1097-2765(01)00260-x. [DOI] [PubMed] [Google Scholar]
- 46.Poser I, Dominguez D, Herreros AG, Varnai A, Buettner R, Bosserhoff AK. Loss of E-cadherin expression in melanoma cells involves up-regulation of the transcriptional repressor Snail. J Biol Chem. 2001;276:24661–24666. doi: 10.1074/jbc.M011224200. [DOI] [PubMed] [Google Scholar]
- 47.Batlle E, Sancho E, Francí C, Domínguez D, Monfar M, Baulida J, García de Herreros A. The transcription factor Snail is a repressor of E-cadherin gene expression in epithelial tumour cells. Nat Cell Biol. 2000;2:84–89. doi: 10.1038/35000034. [DOI] [PubMed] [Google Scholar]
- 48.Cano A, Pérez-Moreno MA, Rodrigo I, Locascio A, Blanco MJ, Barrio MG, Portillo F, Nieto MA. The transcription factor Snail controls epithelial–mesenchymal transitions by repressing E-cadherin expression. Nat Cell Biol. 2000;2:76–83. doi: 10.1038/35000025. [DOI] [PubMed] [Google Scholar]
- 49.Ikuta T, Kobayashi Y, Kawajiri K. Zinc finger transcription factor Slug is a novel target gene of aryl hydrocarbon receptor. Exp Cell Res. 2006;312:3585–3594. doi: 10.1016/j.yexcr.2006.08.002. [DOI] [PubMed] [Google Scholar]
- 50.Belguise K, Guo S, Yang S, Rogers AE, Seldin DC, Sherr DH, Sonenshein GE. Green tea polyphenols reverse cooperation between c- Rel and CK2 that induces the aryl hydrocarbon receptor Slug, and an invasive phenotype. Cancer Res. 2007;67:11742–11750. doi: 10.1158/0008-5472.CAN-07-2730. [DOI] [PubMed] [Google Scholar]
- 51.Mimura J, Ema M, Sogawa K, Fujii-Kuriyama Y. Identification of a novel mechanism of regulation of Ah (dioxin) receptor function. Genes Dev. 1999;13:20–25. doi: 10.1101/gad.13.1.20. [DOI] [PMC free article] [PubMed] [Google Scholar]
- 52.Hahn ME, Allan LL, Sherr DH. Regulation of constitutive and inducible AHR signaling: Complex interactions involving the AHR repressor. Biochem Pharmacol. 2009;77:485–497. doi: 10.1016/j.bcp.2008.09.016. [DOI] [PMC free article] [PubMed] [Google Scholar]
- 53.Schmidt JV, Bradfield CA. Ah receptor signaling pathways. Annu Rev Cell & Develop Biol. 1996;12:55–89. doi: 10.1146/annurev.cellbio.12.1.55. [DOI] [PubMed] [Google Scholar]
- 54.Ohura T, Morita M, Kuruto-Niwa R, Amagai T, Sakakibara H, Shimoi K. Differential action of chlorinated polycyclic aromatic hydrocarbons on aryl hydrocarbon receptor-mediated signaling in breast cancer cells. Expertl Toxicol. 2010;25:180–187. doi: 10.1002/tox.20488. [DOI] [PubMed] [Google Scholar]
- 55.Conney AH. Induction of microsomal enzymes by foreign chemicals and carcinogenesis by polycyclic aromatic hydrocarbons: G. H. A. Clowes Memorial Lecture. Cancer Res. 1982;42:4875–4917. [PubMed] [Google Scholar]
- 56.Park JH, Mangal D, Frey AJ, Harvey RG, Ian A, Blair IA, Penning TM. Aryl Hydrocarbon Receptor Facilitates DNA Strand Breaks and 8-Oxo-2-deoxyguanosine Formation by the Aldo-Keto Reductase Product Benzo[a]pyrene-7,8-dione. J Biol Chem. 2009;284:29725–29734. doi: 10.1074/jbc.M109.042143. [DOI] [PMC free article] [PubMed] [Google Scholar]
- 57.Andersson P, McGuire J, Rubio C, Gradin K, Whitelaw ML, Pettersson S, Hanberg A, Poellinger L. A constitutively active dioxin/aryl hydrocarbon receptor induces stomach tumors. Proc Natl Acad Sci. 2002;99:9990–9995. doi: 10.1073/pnas.152706299. [DOI] [PMC free article] [PubMed] [Google Scholar]
- 58.Moennikes O, Loeppen S, Buchmann A, Andersson P, Ittrich C, Poellinger L, Schwarz M. A constitutively active dioxin/aryl hydrocarbon receptor promotes hepatocarcinogenesis in mice. Cancer Res. 2004;64:4707–4710. doi: 10.1158/0008-5472.CAN-03-0875. [DOI] [PubMed] [Google Scholar]
- 59.McGuire J, Okamoto K, Whitelaw ML, Tanaka H, Poellinger L. Definition of a dioxin receptor mutant that is a constitutive activator of transcription: delineation of overlapping repression and ligand binding functions within the PAS domain. J Biol Chem. 2001;276:41841–41849. doi: 10.1074/jbc.M105607200. [DOI] [PubMed] [Google Scholar]
- 60.Mulero-Navarro S, Pozo-Guisado E, Perez-Mancera PA, Alvarez-Barrientos A, Catalina-Fernandez I, Hernandez-Nieto E, Saenz-Santamaria J, Martinez N, Rojas JM, Sanchez-Garcia I, Fernandez-Salguero PM. Immortalized Mouse Mammary Fibroblasts Lacking Dioxin Receptor Have Impaired Tumorigenicity in a Subcutaneous Mouse Xenograft Model. J Biol Chem. 2005;280:28731–28741. doi: 10.1074/jbc.M504538200. [DOI] [PubMed] [Google Scholar]