

Abstract
Ozone is associated with adverse health; however, less is known about vulnerable/sensitive populations, which we refer to as sensitive populations. We systematically reviewed epidemiologic evidence (1988–2013) regarding sensitivity to mortality or hospital admission from short-term ozone exposure. We performed meta-analysis for overall associations by age and sex; assessed publication bias; and qualitatively assessed sensitivity to socioeconomic indicators, race/ethnicity, and air conditioning. The search identified 2,091 unique papers, with 167 meeting inclusion criteria (73 on mortality and 96 on hospitalizations and emergency department visits, including 2 examining both mortality and hospitalizations). The strongest evidence for ozone sensitivity was for age. Per 10-parts per billion increase in daily 8-hour ozone concentration, mortality risk for younger persons, at 0.60% (95% confidence interval (CI): 0.40, 0.80), was statistically lower than that for older persons, at 1.27% (95% CI: 0.76, 1.78). Findings adjusted for publication bias were similar. Limited/suggestive evidence was found for higher associations among women; mortality risks were 0.39% (95% CI: −0.22, 1.00) higher than those for men. We identified strong evidence for higher associations with unemployment or lower occupational status and weak evidence of sensitivity for racial/ethnic minorities and persons with low education, in poverty, or without central air conditioning. Findings show that some populations, especially the elderly, are particularly sensitive to short-term ozone exposure.
Keywords: age, air pollution, effect modifiers, hospitalization, mortality, ozone, sex
Ozone is a common air pollutant associated with adverse health outcomes, including mortality (1). In the recently published Global Burden of Disease (GBD) Study, Lim et al. (2) estimated almost 2.5 million disability-adjusted life years attributable to ozone in 2010 worldwide. The Global Burden of Disease Study is the most comprehensive research on health burdens worldwide to date, based on a 5-year project involving about 500 researchers. However, the analysis assumed that all persons have identical sensitivity to ozone, by applying a single concentration-response function (3). The authors noted that such assumptions obscure potentially vast differences in health risks across regions and populations. Estimating ozone risks for different populations requires evidence regarding which subpopulations are most sensitive.
Here we refer to “sensitive populations” broadly as individuals or communities with higher health risk due to susceptibility or vulnerability. “Susceptibility” is often used to describe elevated health risk due to biological or other intrinsic factors, such as sex or genetics, whereas “vulnerability” often refers to higher risk from nonbiological or external factors, such as socioeconomic status (SES) or occupation (4). Sensitivity may relate to modified exposure (e.g., different risks by air conditioning status) or different health responses from the same exposure across individuals (e.g., different risks by sex). These population characteristics or factors are also called effect modifiers of the ozone-health relationship. To date, there is no consensus on who is more or less sensitive to health impacts associated with short-term exposure to ozone.
While evidence that ozone adversely affects health is strong and consistent (5–8), results regarding susceptibility and vulnerability of exposed populations are inconclusive. Such evidence would aid efforts to quantify health risks across heterogeneous populations, such as the Global Burden of Disease Study. Understanding which populations are sensitive could inform knowledge on credible pathological mechanisms. Assessing susceptibility to air pollutants is a priority research area for the US Environmental Protection Agency (9, 10), which sets regulations with a margin of safety for sensitive individuals. Physicians would benefit from information on which patients are most likely to be affected. Lack of scientific evidence on how different populations may respond differently to ozone also hinders understanding of health impacts from climate change (11).
We systematically reviewed population-based studies regarding which persons are most sensitive to risk of mortality and risk of hospital admission from short-term exposure to ozone. Meta-analysis was performed to generate overall risk estimates by subpopulation. Systematic reviews with meta-analyses can help decision-makers, physicians, and researchers integrate findings and identify consistencies in the scientific literature (12).
METHODS
We performed a systematic search in the National Library of Medicine's MEDLINE/PubMed database (13). Search terms and exclusion criteria were designed to identify population-based studies on health impacts of short-term exposure (i.e., a day or a few days) to ambient ozone with regard to mortality, hospital admissions, and emergency room visits in adults (see Web Appendix, available at http://aje.oxfordjournals.org/). Study designs other than population-based research (e.g., chamber studies) were excluded. Both single-city and multicity studies were included.
Article titles and abstracts were reviewed in relation to exclusion criteria, and the full texts of remaining articles were then reviewed. Web Figure 1 provides a flow diagram of the search. The systematic review and meta-analysis were performed with consideration of PRISMA (Preferred Reporting Items for Systematic Reviews and Meta-Analyses) and MOOSE (Meta-Analysis of Observational Studies in Epidemiology) guidelines (14, 15).
We extracted information on each study's time frame, location, population description, sample size, ozone metric (e.g., 24-hour average), study design (e.g., time series), lag period between exposure and health responses, health outcome, and statistical approach to assessment of ozone sensitivity (e.g., stratification). We then performed data extraction. Although we focused on populations' sensitivities to ozone, we noted results for other potential modifiers of the association between ozone and health. We classified each potential modifier as individual-level (e.g., individual's SES), community-level (e.g., county's unemployment rate), or temporal (e.g., day's temperature or season). Results were divided by health outcome (mortality, hospital admissions), grouping emergency department visits with hospitalizations. For multicity studies providing city-specific results, we examined each city's results separately.
No studies were excluded for quality considerations; however, information on study design and presentation of results was summarized for the following characteristics: description of model structure (e.g., model structure provided, general description), consideration of co-pollutants, single or multiple lags, rationale for selected lag, exposure approach (e.g., ambient monitors), presentation of ozone sensitivity results (e.g., tables, figures), and specification of International Classification of Diseases codes and source of health data. For studies included in the meta-analysis, we extracted information on ozone-related health risk (e.g., relative risk), measure of uncertainty (e.g., confidence interval), increment of pollution for estimates of the association (e.g., 10 μg/m3), and ozone metric (e.g., 24-hour average).
Meta-analysis by random-effects modeling (16), which addresses heterogeneity in the actual effects across studies, was performed separately for sex and age groups. Population characteristics that were defined differently by study (e.g., employment defined as “percent unemployed” vs. “occupation”) could not meaningfully be combined quantitatively. Meta-analyses were considered when at least 5 studies using individual-level data were available. If studies presented estimates for multiple lags, we used the key lag presented by the study authors or the single-day lag closest to the health outcome (i.e., lag 0 if available). If multiple models had been utilized in a given study (e.g., different sets of confounding variables), we used results from the main model as presented by the original study authors. For multicity studies, city-specific estimates were included separately when available. Results based on categorical exposures (e.g., the highest quartile of exposure vs. the lowest quartile) were not incorporated into the meta-analysis. Results reported in various forms were converted to regression coefficients and their standard errors for pooling. Estimates based on specific 8-hour periods (e.g., 10 am–6 pm) were combined with those for daily 8-hour maximum. Values from other ozone metrics were converted to daily 8-hour maximum based on standard ratios, although true ratios vary (17). Estimates presented in μg/m3 were converted to parts per billion (ppb), assuming standard temperature and pressure. Overall estimates were calculated for a 10-ppb increase in daily 8-hour maximum. We calculated the uncertainty parameter (I2) representing the percentage of total variance in study-specific results explained by heterogeneity (18). We assessed publication bias with Egger's test for asymmetry (19) and adjusted for publication bias using the “trim and fill” method (20). Analyses were performed in R, version 2.15.2 (R Foundation for Statistical Computing, Vienna, Austria). We generated forest plots and funnel plots for each meta-analysis.
A priori, we identified population characteristics potentially relevant to ozone sensitivity: sex, age, race/ethnicity, SES indicators (education, income, employment/occupation, and poverty), and air conditioning. For these characteristics, we synthesized the overall evidence using categories loosely based on those established by Institute of Medicine committees (21) and applied by government agencies and researchers. The original categories used by the Institute of Medicine and other groups were: sufficient evidence of a causal relationship; sufficient evidence of an association; limited/suggestive evidence of an association; inadequate/insufficient evidence to determine whether an association does or does not exist; and limited/suggestive evidence of no association (21). Because our study focused on modification of associations for epidemiologic studies, we altered these categories to the following, in increasing order of certainty: no evidence of ozone sensitivity, weak evidence of ozone sensitivity, limited/suggestive evidence of ozone sensitivity, and strong evidence of ozone sensitivity. The overall state of scientific evidence for each population characteristic was assigned a category based on the quality and quantity of studies providing consistent and significant evidence in comparison with conflicting findings. For sex and age, we also considered meta-analysis results. These categories allowed qualitative synthesis of evidence for population characteristics for which meta-analysis was not viable.
RESULTS
The search identified 2,470 published articles, with 2,091 unique papers. After exclusions, 169 papers remained. Two peer-reviewed agency reports that duplicated published articles were omitted. Of the remaining 167 papers, 73 examined mortality and 96 examined hospitalizations and emergency department visits, including 2 studies that considered both mortality and hospitalization. Web Tables 1 and 2 provide information on the studies of mortality and hospital admission, respectively. Although we focused on certain population characteristics for ozone sensitivity, Web Tables 1 and 2 also show results for other potential modifiers considered in these studies. The most represented country was the United States (21% of studies), while 12% of the studies were in Taiwan and 11% were in Canada. Web Figure 2 gives study characteristics regarding analytical decisions and the presentation of study design and results.
Table 1 presents scientific evidence for selected population characteristics and provides our conclusions on ozone sensitivity. The table notes the numbers of studies that found statistically significant evidence of ozone sensitivity (and in which direction the evidence pointed) and those that did not. Below we provide evidence for ozone sensitivity with regard to sex, age, race/ethnicity, SES indicators, and air conditioning, including the results of meta-analyses for sex and age. Meta-analysis was not applied to other population characteristics because of few estimates or substantial heterogeneity in how characteristics were defined.
Table 1.
Scientific Evidence on Populations That May Be Sensitive to Associations of Ozone Exposure With Mortality and Hospital Admissions, 1988–2013
| Outcome | Statistically Significant Results |
Lack of Statistically Significant Evidence |
Evidence of Association | ||
|---|---|---|---|---|---|
| No. of Studies | Reference No(s). | No. of Studies | Reference No(s). | ||
| Sex | |||||
| Mortality | Limited or suggestive evidence of higher associations in women | ||||
| Individual data | 11 | 31, 32, 44, 45, 67–73 | |||
| Higher risk in women | 2 | 22, 23 | |||
| Hospitalization | |||||
| Individual data | 18 | 37, 39, 43, 74–88 | |||
| Higher risk in women | 5 | 24–28 | |||
| Higher risk in men | 1 | 28 | |||
| Age | |||||
| Mortality | Strong evidence of higher associations in older populations | ||||
| Individual data | 32 | 1, 8, 29, 44, 46, 67, 69, 70, 73, 95–117 | |||
| Higher risk with higher age | 11 | 22, 23, 45, 71, 72, 89–94 | |||
| Lower risk with higher age | 4 | 30–32, 93 | |||
| Community data | 0 | 1 | 29 | ||
| Hospitalization | 26 | ||||
| Individual data | 24–27, 37, 43, 74, 77, 78, 80–83, 86–88, 108, 126–134 | ||||
| Higher risk with higher age | 13 | 28, 33–36, 118–125 | |||
| Higher risk with lower age | 9 | 28, 33–36, 38–40, 84 | |||
| Race/Ethnicity | |||||
| Mortality | Weak evidence of higher associations in minority populations | ||||
| Individual data | 0 | 2 | 22, 44 | ||
| Community data | 1 | 42 | |||
| Higher risk for higher minority population | 1 | 41 | |||
| Hospitalization (individual data) | 2 | 24, 43 | |||
| Higher for minority populations | 2 | 27, 135 | |||
| Lower for minority populations | 1 | 27 | |||
| Education | |||||
| Mortality | Weak evidence of higher associations with lower educational level | ||||
| Individual data | 5 | 22, 44, 46, 69, 72 | |||
| Lower risk with higher education | 1 | 45 | |||
| Higher risk for unknown education than for known education | 1 | 31 | |||
| Higher risk for known education than for unknown education | 1 | 31 | |||
| Community data | 0 | 1 | 42 | ||
| Hospitalization | |||||
| Community data | 0 | 2 | 75, 76 | ||
| Income | |||||
| Mortality | No evidence of ozone sensitivity by income | ||||
| Community data | 0 | 6 | 23, 42, 44, 45, 47, 136 | ||
| Hospitalization | |||||
| Community data | 0 | 3 | 75, 76, 137 | ||
| Employment/Occupation | |||||
| Mortality | Strong evidence of higher associations with lower employment status | ||||
| Individual data | 0 | ||||
| Higher risk for lower-level employment | 3 | 31, 45, 46 | |||
| Higher risk for higher-level employment | 1 | 46 | |||
| Community data | 9 | ||||
| Higher risk with higher unemployment | 2 | 29, 41 | |||
| Poverty | |||||
| Mortality | Weak evidence of higher associations in high-poverty areas | ||||
| Community data | 0 | 2 | 44, 47 | ||
| Hospitalization | |||||
| Community data | 2 | 48, 49 | |||
| Higher risk for higher-poverty areas | 1 | 36 | |||
| Air Conditioning | |||||
| Mortality | Weak evidence of higher associations with lower AC prevalence | ||||
| Community data | 0 | ||||
| Higher risk with lower AC prevalence | 3 | 6, 41, 42 | |||
| Higher risk with higher AC prevalence | 2 | 22, 42 | |||
| Hospitalization | |||||
| Community data | 0 | ||||
| Higher risk with lower AC prevalence | 1 | 48 | |||
Abbreviation: AC, air conditioning.
Modification of the association by sex
Thirty-six studies examined ozone sensitivity by sex, all using individual-level data. Risk estimates were generally higher for women, with 6 studies finding this result (2 for mortality (22, 23), 4 for hospitalization (24–27)) and 1 finding higher hospitalization associations for women during the warm season and for men during the cool season or all year (28). Twenty-nine studies identified no significant results. We conducted meta-analysis for total mortality separately by sex, based on 9 pairs of risk estimates from 9 studies (Table 2, Figures 1 and 2). For women, a 10-ppb increase in daily 8-hour ozone concentration was associated with a 1.12% (95% confidence interval (CI): 0.62, 1.63) increase in mortality—slightly higher than the estimate for men at 0.73% (95% CI: 0.40, 1.07) (Figure 3). The ozone-mortality relative risk was 0.39% (95% CI: –0.22, 1.00) higher for women than for men. Estimates adjusted for publication bias were similar. We found limited/suggestive evidence of higher associations in women than in men.
Table 2.
Results From a Meta-Analysis of Associations Between Ozone Exposure and Mortality, by Sex, 1988–2013
| I2 (Uncertainty Parametera), % | 95% CI | P Value (Egger's Regression Test) | Overall Risk Estimate,b % | 95% CI | Overall Estimate Adjusted for Publication Bias,b % | 95% CI | No. of Adjusted Estimates | |
|---|---|---|---|---|---|---|---|---|
| Men | 26.4 | 0.0, 65.6 | 0.02 | 0.73 | 0.40, 1.07 | 0.64 | 0.31, 0.98 | 2 |
| Women | 64.7 | 27.8, 82.7 | 0.003 | 1.12 | 0.62, 1.63 | 1.12 | 0.62, 1.63 | 0 |
| Women vs. menc | 0.39 | –0.22, 1.00 | 0.48 | –0.13, 1.09 |
Abbreviation: CI, confidence interval.
a Percentage of variance in observed study results explained by heterogeneity.
b Percent increase in risk for a 10-ppb increase in 8-hour ozone concentration.
c Percent increase in ozone risk estimates for women compared with men.
Figure 1.
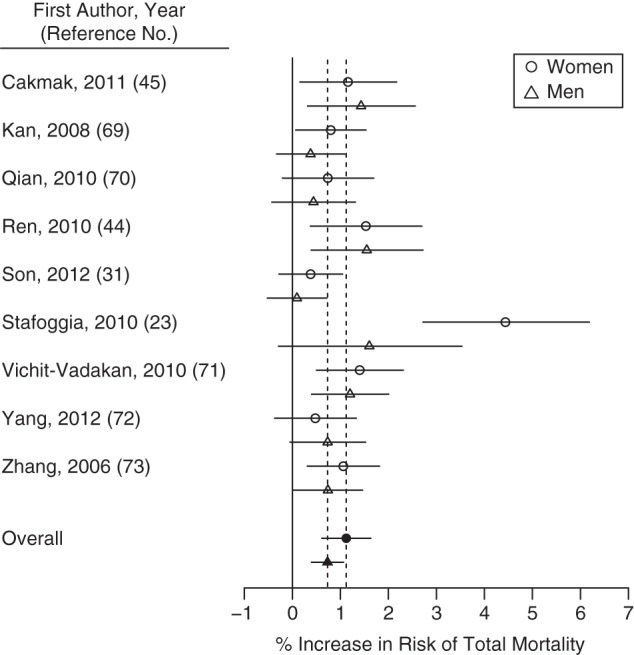
Percent increase in risk of total mortality for a 10-ppb increase in 8-hour ozone concentration for published studies included in a meta-analysis, by sex, 1988–2013. The open points represent individual study estimates; the closed points and dashed vertical lines represent overall estimates from the meta-analysis. Horizontal lines represent 95% confidence intervals.
Figure 2.
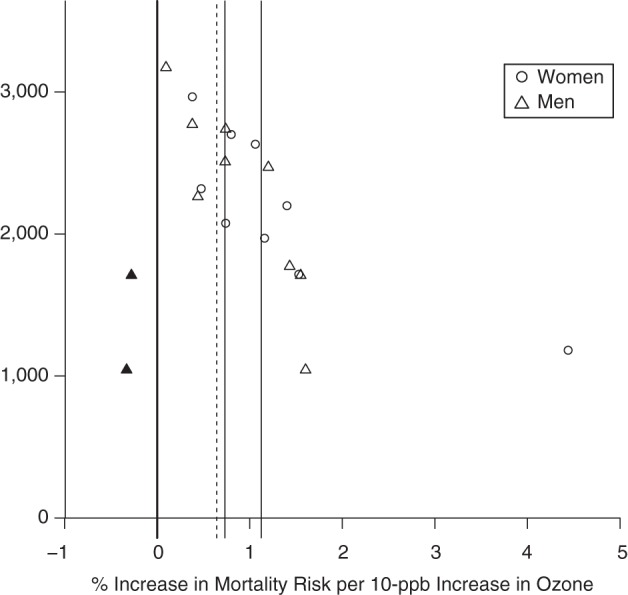
Estimates of the association between ozone exposure and total mortality for published studies included in a meta-analysis, by sex, 1988–2013. Estimates show the percentage increase in risk per 10-ppb increase in 8-hour ozone concentration. The open points represent individual study estimates; the closed points represent “missing studies” for which data were derived from the trim-and-fill method to adjust for publication bias. Solid vertical lines represent overall estimates based on study results; dashed lines represent overall estimates adjusted for publication bias.
Figure 3.

Results from a meta-analysis of associations of ozone exposure with mortality and hospital admission, by sex or age, 1988–2013. A) Risk of mortality by sex; B) risk of mortality by age; C) risk of hospital admission by age. Points represent central estimates for the increase in health risk for a 10-ppb increase in daily 8-hour ozone concentration. Vertical lines represent 95% confidence intervals. CVD, cardiovascular disease.
Modification of the association by age
Ozone sensitivity by age was investigated in 46 mortality studies and 43 hospitalization studies. Categorization of age differed by study. All studies used individual-level data on age, except for 1 mortality study that found no evidence that risk varied by communities’ percentage of persons over age 75 years (29). Of mortality studies using individual-level data for age, 10 found risk increases with age, and 1 additional study found higher or lower risks for older persons depending on season and cause of death (Table 1). Three studies finding lower risk for older persons were based on subpopulations (e.g., survivors of myocardial infarction) (30–32).
Of the 43 hospitalization studies on age, higher associations were observed for older persons in 13. Five studies found mixed results, with the highest risk appearing in an age group other than the youngest or oldest (33, 34), or different results on age by time lag (35), outcome and cause (36), or sex (28). Four studies finding lower risks for older persons were for subpopulations (e.g., asthma emergency department visits for women during the warm season) (37–40).
We performed meta-analysis by age category (younger and older populations) for total, cardiovascular disease (CVD), and respiratory mortality and for CVD, respiratory, and asthma hospitalizations (Table 3, Figures 3–5, Web Figures 3–12). For older populations, we used the oldest age category available in each study. Younger populations were considered those most closely matching adults, excluding elder populations. Some studies compared estimates for older populations with persons of all ages, in which case we combined estimates for “all ages” with younger populations and performed sensitivity analysis excluding these studies.
Figure 4.

Percent increase in risk of total mortality for a 10-ppb increase in 8-hour ozone concentration for published studies included in a meta-analysis, by age, 1988–2013. The open points represent individual study estimates; the closed points and dashed vertical lines represent overall estimates from the meta-analysis. Horizontal lines represent 95% confidence intervals.
Table 3.
Results From a Meta-Analysis of Associations Between Ozone Exposure and Mortality and Hospital Admission, by Age, 1988–2013
| No. of Estimate Pairs | No. of Studies | I2 (Uncertainty Parametera), % | 95% CI | P Value (Egger's Regression Test) | Overall Risk Estimate,b % | 95% CI | Overall Estimate Adjusted for Publication Bias,b % | 95% CI | No. of Adjusted Estimates | |
|---|---|---|---|---|---|---|---|---|---|---|
| Total mortality | 35 | 33 | ||||||||
| Younger persons | 66.5 | 52.2, 76.5 | 0.06 | 0.60 | 0.40, 0.80 | 0.55 | 0.34, 0.76 | 4 | ||
| Older persons | 99.9 | 99.9, 100 | 0.48 | 1.27 | 0.76, 1.78 | 1.43 | 0.98, 1.89 | 6 | ||
| Older vs. youngerc | 0.66 | 0.12, 1.12 | 0.16 | 0.07, 0.24 | ||||||
| CVD mortality | 17 | 12 | ||||||||
| Younger | 70.6 | 51.8, 82.0 | 0.48 | 0.53 | 0.20, 0.86 | 0.53 | 0.20, 0.86 | 0 | ||
| Older | 64.4 | 40.2, 78.8 | 0.18 | 0.73 | 0.43, 1.04 | 0.73 | 0.43, 1.04 | 0 | ||
| Older vs. younger | 0.20 | −0.25, 0.65 | 0.20 | −0.25, 0.65 | ||||||
| Respiratory mortality | 16 | 11 | ||||||||
| Younger | 0.0 | 0.0, 23.7 | 0.33 | 0.45 | 0.24, 0.65 | 0.43 | 0.23, 0.64 | 3 | ||
| Older | 8.1 | 0.0, 44.5 | 0.04 | 0.36 | 0.09, 0.63 | 0.32 | 0.03, 0.61 | 5 | ||
| Older vs. younger | −0.09 | −0.42, 0.25 | −0.12 | −0.47, 0.24 | ||||||
| CVD hospitalization | 8 | 8 | ||||||||
| Younger | 72.0 | 42.4, 86.4 | 0.45 | 0.29 | −0.80, 0.22 | 0.29 | −0.80, 0.22 | 0 | ||
| Older | 84.8 | 71.8, 91.8 | 0.16 | 0.57 | −0.05, 1.19 | 0.57 | −0.05, 1.19 | 0 | ||
| Older vs. younger | 0.86 | 0.05, 1.67 | 0.86 | 0.05, 1.67 | ||||||
| Respiratory hospitalization | 12 | 11 | ||||||||
| Younger | 78.3 | 62.5, 87.4 | 0.65 | −0.20 | −0.73, 0.33 | 0.22 | −0.31, 0.76 | 4 | ||
| Older | 77.2 | 60.4, 86.9 | 0.49 | 0.32 | −0.31, 0.96 | 0.32 | −0.31, 0.96 | 0 | ||
| Older vs. younger | 0.52 | −0.31, 1.35 | 0.10 | −0.73, 0.93 | ||||||
| Asthma hospitalization | 8 | 8 | ||||||||
| Younger | 81.9 | 65.5, 90.5 | 0.15 | 2.74 | 0.47, 5.06 | 3.30 | 1.24, 5.40 | 2 | ||
| Older | 61.5 | 16.8, 82.2 | 0.61 | 2.43 | 0.47, 4.42 | 2.43 | 0.47, 4.42 | 0 | ||
| Older vs. younger | −0.31 | −3.20, 2.79 | −0.85 | −3.57, 1.95 |
Abbreviations: CI, confidence interval; CVD, cardiovascular disease.
a Percentage of variance in observed study results explained by heterogeneity.
b Percent increase in risk for a 10-ppb increase in 8-hour ozone concentration.
c Percent increase in ozone risk estimates for older persons compared with younger persons.
Figure 5.
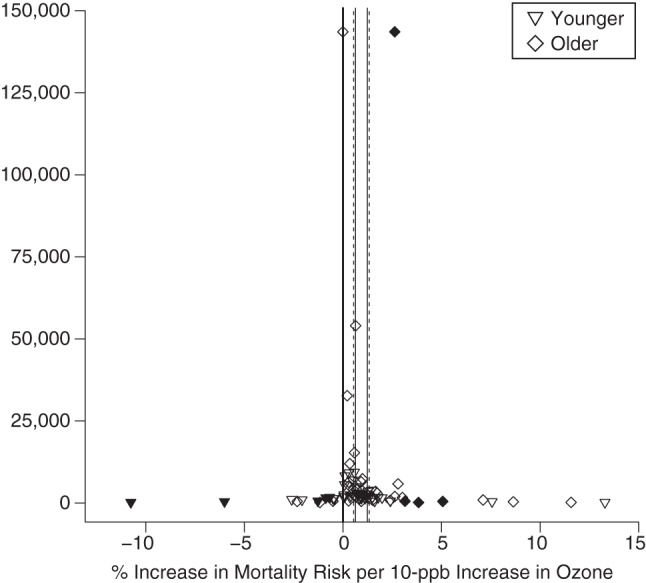
Estimates of the association between ozone exposure and total mortality for published studies included in a meta-analysis, by age, 1988–2013. Estimates show the percentage increase in risk per 10-ppb increase in 8-hour ozone concentration. The open points represent individual study estimates; the closed points represent “missing studies” for which data were derived from the trim-and-fill method to adjust for publication bias. Solid vertical lines represent overall estimates based on study results; dashed lines represent overall estimates adjusted for publication bias.
A 10-ppb increase in daily 8-hour ozone concentration was associated with a 0.60% (95% CI: 0.40, 0.80) increase in total mortality for younger persons and a 1.27% (95% CI: 0.76, 1.78) increase for older persons. The ozone-mortality risk was 0.66% (95% CI: 0.12, 1.12) higher for older populations than for younger populations (Table 3). Sensitivity analysis removing studies comparing “all ages” with older populations was based on 22 pairs of estimates from 20 studies. Estimates were higher for older populations at 0.87% (95% CI: 0.61, 1.13) as compared with 0.50% (95% CI: 0.24, 0.76) for younger populations. Meta-analysis results were higher, but not statistically so, for older persons than for younger persons for CVD mortality, CVD hospital admissions, and respiratory hospital admissions (Web Figures 3–10). Results for respiratory mortality or asthma hospitalization were lower for older groups than for younger groups but were not statistically different (Table 3). Results from Egger's test did not suggest heterogeneity (P > 0.05), except for ozone–respiratory mortality estimates. We found strong evidence of higher ozone associations for mortality in older populations.
Modification of the association by race/ethnicity
Eight studies examined ozone sensitivity by race/ethnicity. Two found higher risks for minority populations, 1 with individual-level data and 1 with community-level data, and an additional study with individual-level data found higher risk for non-Caucasians for asthma and pneumonia emergency room admissions and higher associations for Caucasians for exacerbation of chronic obstructive pulmonary disease. We conclude that there is weak evidence of higher associations in minority populations. Investigation of ozone sensitivity by race/ethnicity was limited. All 4 hospitalization studies considered a single community (1 in Italy, 3 in the United States). All 4 mortality studies were US multicity studies. Race/ethnicity categorizations were simplistic, with most studies using 2 categories (e.g., black and other (22, 41, 42)). Only 2 studies used 3 or more race/ethnicity categories (43, 44).
Modification of the association by SES indicators
We considered ozone sensitivity with the following SES indicators: education, income, employment/occupation, and poverty. Overall, research suggested higher associations with lower SES. The most commonly studied SES indicator was education, with 10 studies evaluating this association. One mortality study found higher risk for persons with less than a primary school education than for those with a university education (45); there were no significant results in the remaining studies. We found weak evidence of higher associations with lower education.
We conclude that current research provides no evidence of ozone sensitivity by income, since none of the 9 such studies found statistically significant evidence. Analysis was limited because of exclusive reliance on community-level data and the US focus.
Sensitivity by employment/occupation was investigated in 5 mortality studies and no hospitalization studies. Employment categories were defined differently by study (e.g., unemployed, blue-collar, white-collar (45)). Unemployed persons had higher ozone-mortality risk than white-collar employees in Chile (45) and higher risk than professional employees in South Korea (31). The other study with individual-level data, based in Hong Kong, China, found higher ozone-mortality risk for blue-collar workers than for white-collar or never-employed workers (46). Two studies found higher community-level ozone-mortality estimates with higher unemployment (29, 41). We found strong evidence of higher ozone-mortality risk with lower employment status.
Ozone sensitivity by community-level poverty was considered in 5 US studies (2 mortality (44, 47) and 3 hospitalization (36, 48, 49)). Poverty was typically defined as percentage of persons, or persons aged 65 years or more, living in poverty. Some studies divided communities’ populations into binary categories (36, 49) or quartiles (44) by poverty status. One study found higher risks of ozone-related emergency department visits for CVD and dysrhythmia in high-poverty areas (36). The remaining studies found no evidence of ozone sensitivity by poverty level. We found weak evidence of higher ozone associations in high-poverty communities.
Modification of the association by air conditioning
Four studies examined sensitivity to ozone mortality by the presence of air conditioning (6, 22, 41, 42). Findings were more consistent for central air conditioning than for window air conditioning; there were higher associations with lower levels of central air conditioning in 3 studies (6, 41, 42). The 1 hospitalization study found higher risks with lower air conditioning (48). Analyses were limited by the use of community-level data, measurement of air conditioning prevalence rather than use, and a US focus, with the exception of 1 meta-analysis that included both US and Canadian cities (6). We found weak evidence of higher ozone associations with lower air conditioning prevalence.
DISCUSSION
Ozone sensitivities may relate to physiological differences. The structure of the respiratory system changes as we age, with decreased chest wall compliance, respiratory muscle strength, and vital capacity (50). Hormones and structural/morphological differences in the respiratory system may affect differences in risk between men and women (51).
Populations likely differ in terms of how estimated exposure relates to actual exposure. In the studies we identified, most researchers estimated exposure using outdoor levels, whereas actual exposure is affected by occupational exposure and indoor/outdoor activity patterns. A US survey found that 86.9% of participants’ time was spent indoors (52). Activity patterns can differ by sex, age, race/ethnicity, employment, and education (53). The indoor/outdoor ratio of ozone levels varies with air conditioning status (54) and housing structure, which can relate to SES. Further, studies use different approaches to estimate exposure to ozone, such as the nearest monitor value, the average of monitor values over a given area, interpolated values from several monitors, and modeled estimates, and they can take different approaches on whether to estimate ozone levels for days missing monitor values and the nature of such estimation.
Baseline health status, smoking, obesity, occupation, and other health-related factors that may affect vulnerability to ozone are more prevalent in some populations. For example, obesity can vary by race/ethnicity and sex (55, 56). Further, population characteristics are not independent (e.g., SES and race/ethnicity), complicating the ability to disentangle which factors in this complex system are most relevant for ozone sensitivity.
Previous meta-analyses of ozone associations did not focus on sensitive populations, although some examined risks by age. One earlier meta-analysis found a 0.57% (95% CI: –0.26, 1.41) higher total mortality–ozone estimate for older populations than for younger populations (8), a finding confirmed by our significant result of 0.66% (95% CI: 0.12, 1.12). Ozone–respiratory hospitalization estimates were 0.52% higher for older populations than for younger populations in our study, whereas a previous meta-analysis found a 0.15% difference (57); in both meta-analyses, risks were not statistically different by age group. An earlier meta-analysis found a 2.45% lower estimate for the association between ozone exposure and chronic obstructive pulmonary disease hospitalization among older persons than among persons of all ages; findings were not statistically significant and were based on 4 estimates for all ages (57). Other previous meta-analyses of ozone investigated mortality without exploration of sensitive populations (5, 58, 59).
In this analysis, 69% of studies provided results for multiple lag structures. The rationale for the selected lag structure varied and was not presented in all articles (Web Figure 2). Presentation of findings from a single lag structure may result in publication bias (8). Earlier work found that estimates of ozone associations from meta-analysis were consistently higher when based on a single lag than when results for multiple lags were reported (8). In future work, investigators could examine whether risks differ by lag using studies that presented results on multiple lag structures.
Although our findings ascertained sensitive populations, we identified gaps in the scientific literature. The lack of sufficient numbers of studies to perform meta-analysis necessitated qualitative assessment for sensitivity by race/ethnicity, SES indicators, and air conditioning. Categorization of cause of death or hospitalization by means of International Classification of Diseases codes is not perfectly consistent across studies (57). Many studies were designed to investigate issues other than population sensitivities. Studies developed specifically to explore ozone sensitivity may have different study designs. In particular, analysis of sensitivity by race/ethnicity used crude categories. Only 2 studies used 3 or more race/ethnicity categories (43, 44). No studies used individual-level data to investigate sensitivity by education or employment for hospitalizations, or to investigate income or poverty for either health outcome. All air conditioning studies employed prevalence of air conditioning rather than use. Some analysis was hindered further by a US focus. Because of these limitations and publication bias, the absence of evidence for ozone sensitivity should not be interpreted as evidence for the absence of sensitivity.
Many of the differences in estimates of ozone associations among groups were small in terms of the relative percent difference (Tables 2 and 3). However, these values present the relative increase in risk for a given group as compared with another group, and the actual health burden will relate to the baseline level of risk for ozone and the given health outcome for each group. Given the high levels of ozone pollution in many parts of the world and the large populations exposed, small relative differences in the risks for 2 populations could translate to large differences in the public health burden. Further, evidence on differences in sensitivity to ozone can inform policy-makers in their efforts to protect the public from air pollution, the medical community in their efforts to protect patients, and researchers who assess health impacts across different populations, as in the Global Burden of Disease Study.
Ozone levels have generally declined in many industrialized countries, yet over 123 million people in the United States live in areas with ozone concentrations exceeding the levels specified in health-based ozone regulations (60). Concentrations are increasing in much of the developing world with the expanding transportation networks, energy consumption, and industry that accompany urbanization (61). Worldwide, an estimated 470,000 respiratory deaths per year result from ozone exposure (62), and it is estimated that ozone-related deaths in the United Kingdom will increase 71% by 2050 (61). However, the true health burden of ozone is unknown without evidence regarding which populations are most sensitive. Estimates on health consequences from ozone for specific populations, such as in the Global Burden of Disease Study, for the present day (2, 62–64), or under a changing climate (61, 65, 66), often rely on a single or small number of concentration-response functions applied to all persons, although such functions may be based on populations with characteristics quite dissimilar from the population of interest and such characteristics change over time. Our findings indicate that health responses to ozone differ by age and employment/occupation, and possibly by sex, race/ethnicity, and other SES indicators. Evidence on which populations are most sensitivity to ozone is needed to inform physicians as to which patients face higher risk, to aid decision-makers who formulate air-quality regulations, and to help sensitive individuals themselves, who may wish to modify their ozone exposure and understand their risk factors. Future studies should investigate ozone sensitivity for the population characteristics identified here, ideally with studies designed for this task.
Supplementary Material
ACKNOWLEDGMENTS
Author affiliations: School of Forestry and Environmental Studies, Yale University, New Haven, Connecticut (Michelle L. Bell); Department of Environmental Health, School of Public Health, Harvard University, Boston, Massachusetts (Antonella Zanobetti); and Department of Biostatistics, School of Public Health, Harvard University, Boston, Massachusetts (Francesca Dominici).
Funding for this work was provided by the National Institutes of Health (grants R01ES019560, R01ES019587, R01ES019955, ES020152, and R21ES021427), the Environmental Protection Agency (grants RD 83479801, RD 83490001, and R834894), and the Health Effects Institute (Boston, Massachusetts) (grant 4909).
Conflict of interest: none declared.
REFERENCES
- 1.Bell ML, McDermott A, Zeger SL, et al. Ozone and short-term mortality in 95 US urban communities, 1987–2000. JAMA. 2004;292(19):2372–2378. doi: 10.1001/jama.292.19.2372. [DOI] [PMC free article] [PubMed] [Google Scholar]
- 2.Lim SS, Vos T, Flaxman AD, et al. A comparative risk assessment of burden of disease and injury attributable to 67 risk factors and risk factor clusters in 21 regions, 1990–2010: a systematic analysis for the Global Burden of Disease Study 2010. Lancet. 2012;380(9859):2224–2260. doi: 10.1016/S0140-6736(12)61766-8. [DOI] [PMC free article] [PubMed] [Google Scholar]
- 3.Jerrett M, Burnett RT, Pope CA, 3rd, et al. Long-term ozone exposure and mortality. N Engl J Med. 2009;360(11):1085–1095. doi: 10.1056/NEJMoa0803894. [DOI] [PMC free article] [PubMed] [Google Scholar]
- 4.The Interagency Working Group on Climate Change. A Human Health Perspective on Climate Change: A Report Outlining the Research Needs of the Human Health Effects of Climate Change. Research Triangle Park, NC: National Institute of Environmental Health Sciences; 2010. [Google Scholar]
- 5.Ito K, De Leon SF, Lippmann M. Associations between ozone and daily mortality: analysis and meta-analysis. Epidemiology. 2005;16(4):446–457. doi: 10.1097/01.ede.0000165821.90114.7f. [DOI] [PubMed] [Google Scholar]
- 6.Levy JI, Chemerynski SM, Sarnat JA. Ozone exposure and mortality: an empiric Bayes metaregression analysis. Epidemiology. 2005;16(4):458–468. doi: 10.1097/01.ede.0000165820.08301.b3. [DOI] [PubMed] [Google Scholar]
- 7.Touloumi G, Katsouyanni K, Zmirou D, et al. Short-term effects of ambient oxidant exposure on mortality: a combined analysis within the APHEA project. Am J Epidemiol. 1997;146(2):177–185. doi: 10.1093/oxfordjournals.aje.a009249. [DOI] [PubMed] [Google Scholar]
- 8.Bell ML, Dominici F, Samet JM. A meta-analysis of time-series studies of ozone and mortality with comparison to the National Morbidity, Mortality, and Air Pollution Study. Epidemiology. 2005;16(4):436–445. doi: 10.1097/01.ede.0000165817.40152.85. [DOI] [PMC free article] [PubMed] [Google Scholar]
- 9.Environmental Protection Agency. Notification of upcoming meeting of the Science Advisory Board Particulate Matter Research Centers Program Advisory Panel. Fed Regist. 2008;73(136):40576–40577. [Google Scholar]
- 10.Environmental Protection Agency. Funding Opportunity: Clean Air Research Centers. (http://www.epa.gov/ncer/rfa/2009/2009_star_clean_air.html. Updated October 3, 2012. (Accessed April 8, 2014)
- 11.Vardoulakis S, Heaviside CE. Health Effects of Climate Change in the UK 2012: Current Evidence, Recommendations and Research Gaps. London, United Kingdom: Health Protection Agency; 2012. [Google Scholar]
- 12.Mulrow CD. Rationale for systematic reviews. BMJ. 1994;309(6954):597–599. doi: 10.1136/bmj.309.6954.597. [DOI] [PMC free article] [PubMed] [Google Scholar]
- 13.National Center for Biotechnology Information, National Library of Medicine. 2012. PubMed. Bethesda, MD: National Library of Medicine (http://www.ncbi.nlm.nih.gov/pubmed/ ). (Accessed June 21, 2013)
- 14.Stroup DF, Berlin JA, Morton SC, et al. Meta-analysis of observational studies in epidemiology: a proposal for reporting. Meta-analysis Of Observational Studies in Epidemiology (MOOSE) Group. JAMA. 2000;283(15):2008–2012. doi: 10.1001/jama.283.15.2008. [DOI] [PubMed] [Google Scholar]
- 15.Moher D, Liberati A, Tetzlaff J, et al. Preferred reporting items for systematic reviews and meta-analyses: the PRISMA statement. BMJ. 2009;339:b2535. doi: 10.1136/bmj.b2535. [DOI] [PMC free article] [PubMed] [Google Scholar]
- 16.Neyeloff JL, Fuchs SC, Moreira LB. Meta-analyses and forest plots using a Microsoft Excel spreadsheet: step-by-step guide focusing on descriptive data analysis. BMC Res Notes. 2012;5:52. doi: 10.1186/1756-0500-5-52. [DOI] [PMC free article] [PubMed] [Google Scholar]
- 17.Anderson GB, Bell ML. Does one size fit all? The suitability of standard ozone exposure metric conversion ratios and implications for epidemiology. J Expo Sci Environ Epidemiol. 2010;20(1):2–11. doi: 10.1038/jes.2008.69. [DOI] [PMC free article] [PubMed] [Google Scholar]
- 18.Thorlund K, Imberger G, Johnston BC, et al. Evolution of heterogeneity (I2) estimates and their 95% confidence intervals in large meta-analyses. PLoS One. 2012;7(7):e39471. doi: 10.1371/journal.pone.0039471. [DOI] [PMC free article] [PubMed] [Google Scholar]
- 19.Egger M, Davey Smith G, Schneider M, et al. Bias in meta-analysis detected by a simple, graphical test. BMJ. 1997;315(7109):629–634. doi: 10.1136/bmj.315.7109.629. [DOI] [PMC free article] [PubMed] [Google Scholar]
- 20.Duval S, Tweedie R. Trim and fill: a simple funnel-plot-based method of testing and adjusting for publication bias in meta-analysis. Biometrics. 2000;56(2):455–463. doi: 10.1111/j.0006-341x.2000.00455.x. [DOI] [PubMed] [Google Scholar]
- 21.Fulco CE, Liverman CT, Sox HC, editors. Gulf War and Health. Volume 1. Depleted Uranium, Pyridostigmine Bromide, Sarin, and Vaccines. Washington, DC: National Academy Press; 2000. [PubMed] [Google Scholar]
- 22.Medina-Ramón M, Schwartz J. Who is more vulnerable to die from ozone air pollution? Epidemiology. 2008;19(5):672–679. doi: 10.1097/EDE.0b013e3181773476. [DOI] [PubMed] [Google Scholar]
- 23.Stafoggia M, Forastiere F, Faustini A, et al. Susceptibility factors to ozone-related mortality: a population-based case-crossover analysis. Am J Respir Crit Care Med. 2010;182(3):376–384. doi: 10.1164/rccm.200908-1269OC. [DOI] [PubMed] [Google Scholar]
- 24.Cassino C, Ito K, Bader I, et al. Cigarette smoking and ozone-associated emergency department use for asthma by adults in New York City. Am J Respir Crit Care Med. 1999;159(6):1773–1779. doi: 10.1164/ajrccm.159.6.9809042. [DOI] [PubMed] [Google Scholar]
- 25.Dales RE, Cakmak S, Vidal CB, et al. Air pollution and hospitalization for acute complications of diabetes in Chile. Environ Int. 2012;46:1–5. doi: 10.1016/j.envint.2012.05.002. [DOI] [PubMed] [Google Scholar]
- 26.Middleton N, Yiallouros P, Kleanthous S, et al. A 10-year time-series analysis of respiratory and cardiovascular morbidity in Nicosia, Cyprus: the effect of short-term changes in air pollution and dust storms. Environ Health. 2008;7:39. doi: 10.1186/1476-069X-7-39. [DOI] [PMC free article] [PubMed] [Google Scholar]
- 27.Santus P, Russo A, Madonini E, et al. How air pollution influences clinical management of respiratory diseases. A case-crossover study in Milan. Respir Res. 2012;13:95. doi: 10.1186/1465-9921-13-95. [DOI] [PMC free article] [PubMed] [Google Scholar]
- 28.Szyszkowicz M, Porada E, Kaplan GG, et al. Ambient ozone and emergency department visits for cellulitis. Int J Environ Res Public Health. 2010;7(11):4078–4088. doi: 10.3390/ijerph7114078. [DOI] [PMC free article] [PubMed] [Google Scholar]
- 29.Peng RD, Samoli E, Pham L, et al. Acute effects of ambient ozone on mortality in Europe and North America: results from the APHENA study. Air Qual Atmos Health. 2013;6(2):445–453. doi: 10.1007/s11869-012-0180-9. [DOI] [PMC free article] [PubMed] [Google Scholar]
- 30.Berglind N, Bellander T, Forastiere F, et al. Ambient air pollution and daily mortality among survivors of myocardial infarction. Epidemiology. 2009;20(1):110–118. doi: 10.1097/EDE.0b013e3181878b50. [DOI] [PubMed] [Google Scholar]
- 31.Son JY, Lee JT, Kim H, et al. Susceptibility to air pollution effects on mortality in Seoul, Korea: a case-crossover analysis of individual-level effect modifiers. J Expo Sci Environ Epidemiol. 2012;22(3):227–234. doi: 10.1038/jes.2012.6. [DOI] [PMC free article] [PubMed] [Google Scholar]
- 32.Sunyer J, Basagaña X, Belmonte J, et al. Effect of nitrogen dioxide and ozone on the risk of dying in patients with severe asthma. Thorax. 2002;57(8):687–693. doi: 10.1136/thorax.57.8.687. [DOI] [PMC free article] [PubMed] [Google Scholar]
- 33.Jones GN, Sletten C, Mandry C, et al. Ozone level effect on respiratory illness: an investigation of emergency department visits. South Med J. 1995;88(10):1049–1056. doi: 10.1097/00007611-199510000-00010. [DOI] [PubMed] [Google Scholar]
- 34.Silverman RA, Ito K. Age-related association of fine particles and ozone with severe acute asthma in New York City. J Allergy Clin Immunol. 2010;125(2):367–373.e5. doi: 10.1016/j.jaci.2009.10.061. [DOI] [PubMed] [Google Scholar]
- 35.Namdeo A, Tiwary A, Farrow E. Estimation of age-related vulnerability to air pollution: assessment of respiratory health at local scale. Environ Int. 2011;37(5):829–837. doi: 10.1016/j.envint.2011.02.002. [DOI] [PubMed] [Google Scholar]
- 36.Winquist A, Klein M, Tolbert P, et al. Comparison of emergency department and hospital admissions data for air pollution time-series studies. Environ Health. 2012;11:70. doi: 10.1186/1476-069X-11-70. [DOI] [PMC free article] [PubMed] [Google Scholar]
- 37.Szyszkowicz M. Ambient air pollution and daily emergency department visits for ischemic stroke in Edmonton, Canada. Int J Occup Med Environ Health. 2008;21(4):295–300. doi: 10.2478/v10001-008-0029-5. [DOI] [PubMed] [Google Scholar]
- 38.Ko FW, Tam W, Wong TW, et al. Effects of air pollution on asthma hospitalization rates in different age groups in Hong Kong. Clin Exp Allergy. 2007;37(9):1312–1319. doi: 10.1111/j.1365-2222.2007.02791.x. [DOI] [PubMed] [Google Scholar]
- 39.Dales RE, Cakmak S, Vidal CB. Air pollution and hospitalization for venous thromboembolic disease in Chile. J Thromb Haemost. 2010;8(4):669–674. doi: 10.1111/j.1538-7836.2010.03760.x. [DOI] [PubMed] [Google Scholar]
- 40.Villeneuve PJ, Chen L, Rowe BH, et al. Outdoor air pollution and emergency department visits for asthma among children and adults: a case-crossover study in northern Alberta, Canada. Environ Health. 2007;6:40. doi: 10.1186/1476-069X-6-40. [DOI] [PMC free article] [PubMed] [Google Scholar]
- 41.Bell ML, Dominici F. Effect modification by community characteristics on the short-term effects of ozone exposure and mortality in 98 US communities. Am J Epidemiol. 2008;167(8):986–997. doi: 10.1093/aje/kwm396. [DOI] [PMC free article] [PubMed] [Google Scholar]
- 42.Smith RL, Xu B, Switzer P. Reassessing the relationship between ozone and short-term mortality in U.S. urban communities. Inhal Toxicol. 2009;21(suppl 2):37–61. doi: 10.1080/08958370903161612. [DOI] [PubMed] [Google Scholar]
- 43.Glad JA, Brink LL, Talbott EO, et al. The relationship of ambient ozone and PM2.5 levels and asthma emergency department visits: possible influence of gender and ethnicity. Arch Environ Occup Health. 2012;67(2):103–108. doi: 10.1080/19338244.2011.598888. [DOI] [PubMed] [Google Scholar]
- 44.Ren C, Melly S, Schwartz J. Modifiers of short-term effects of ozone on mortality in eastern Massachusetts—a case-crossover analysis at individual level. Environ Health. 2010;9:3. doi: 10.1186/1476-069X-9-3. [DOI] [PMC free article] [PubMed] [Google Scholar]
- 45.Cakmak S, Dales RE, Rubio MA, et al. The risk of dying on days of higher air pollution among the socially disadvantaged elderly. Environ Res. 2011;111(3):388–393. doi: 10.1016/j.envres.2011.01.003. [DOI] [PubMed] [Google Scholar]
- 46.Ou CQ, Hedley AJ, Chung RY, et al. Socioeconomic disparities in air pollution-associated mortality. Environ Res. 2008;107(2):237–244. doi: 10.1016/j.envres.2008.02.002. [DOI] [PubMed] [Google Scholar]
- 47.Zanobetti A, Schwartz J. Mortality displacement in the association of ozone with mortality: an analysis of 48 cities in the United States. Am J Respir Crit Care Med. 2008;177(2):184–189. doi: 10.1164/rccm.200706-823OC. [DOI] [PubMed] [Google Scholar]
- 48.Medina-Ramón M, Zanobetti A, Schwartz J. The effect of ozone and PM10 on hospital admissions for pneumonia and chronic obstructive pulmonary disease: a national multicity study. Am J Epidemiol. 2006;163(6):579–588. doi: 10.1093/aje/kwj078. [DOI] [PubMed] [Google Scholar]
- 49.Sarnat JA, Sarnat SE, Flanders WD, et al. Spatiotemporally resolved air exchange rate as a modifier of acute air pollution-related morbidity in Atlanta. J Expo Sci Environ Epidemiol. 2013;23(6):606–615. doi: 10.1038/jes.2013.32. [DOI] [PubMed] [Google Scholar]
- 50.Janssens JP. Aging of the respiratory system: impact on pulmonary function tests and adaptation to exertion. Clin Chest Med. 2005;26(3):469–484. doi: 10.1016/j.ccm.2005.05.004. vi–vii. [DOI] [PubMed] [Google Scholar]
- 51.Harms CA. Does gender affect pulmonary function and exercise capacity? Respir Physiol Neurobiol. 2006;151(2-3):124–131. doi: 10.1016/j.resp.2005.10.010. [DOI] [PubMed] [Google Scholar]
- 52.Klepeis NE, Nelson WC, Ott WR, et al. The National Human Activity Pattern Survey (NHAPS): a resource for assessing exposure to environmental pollutants. J Expo Anal Environ Epidemiol. 2001;11(3):231–252. doi: 10.1038/sj.jea.7500165. [DOI] [PubMed] [Google Scholar]
- 53.Tsang AM, Klepeis NE. Descriptive Statistics Tables from a Detailed Analysis of the National Human Activity Pattern Survey (NHAPS) Data. Washington, DC: Office of Research and Development, Environmental Protection Agency; 1996. [Google Scholar]
- 54.Hayes SR. Use of an indoor air quality model (IAQM) to estimate indoor ozone levels. J Air Waste Manage Assoc. 1991;41(2):161–170. doi: 10.1080/10473289.1991.10466833. [DOI] [PubMed] [Google Scholar]
- 55.National Obesity Observatory. Obesity and Ethnicity. London, United Kingdom: Public Health England; 2011. [Google Scholar]
- 56.Lincoln KD, Abdou CM, Lloyd D. Race and socioeconomic differences in obesity and depression among Black and non-Hispanic White Americans. J Health Care Poor Underserved. 2014;25(1):257–275. doi: 10.1353/hpu.2014.0038. [DOI] [PMC free article] [PubMed] [Google Scholar]
- 57.Ji M, Cohan DS, Bell ML. Meta-analysis of the association between short-term exposure to ambient ozone and respiratory hospital admissions. Environ Res Lett. 2011;6(2) doi: 10.1088/1748-9326/6/2/024006. [DOI] [PMC free article] [PubMed] [Google Scholar]
- 58.Yan M, Liu Z, Liu X, et al. Meta-analysis of the Chinese studies of the association between ambient ozone and mortality. Chemosphere. 2013;93(6):899–905. doi: 10.1016/j.chemosphere.2013.05.040. [DOI] [PubMed] [Google Scholar]
- 59.Thurston GD, Ito K. Epidemiological studies of acute ozone exposures and mortality. J Expo Anal Environ Epidemiol. 2001;11(4):286–294. doi: 10.1038/sj.jea.7500169. [DOI] [PubMed] [Google Scholar]
- 60.Environmental Protection Agency. The Green Book Nonattainment Areas for Criteria Pollutants. Washington, DC: Environmental Protection Agency; 2012. (http://www.epa.gov/oar/oaqps/greenbk/index.html. (Accessed August 21, 2012)
- 61.The Royal Society. Ground-level Ozone in the 21st Century: Future Trends, Impacts, and Policy Implications. London, United Kingdom: The Royal Society; 2008. [Google Scholar]
- 62.Silva RA, West JJ, Zhang Y, et al. Global premature mortality due to anthropogenic outdoor air pollution and the contribution of past climate change. Environ Res Lett. 2013;8(3):034005. [Google Scholar]
- 63.Murray CJ, Richards MA, Newton JN, et al. UK health performance: findings of the Global Burden of Disease Study 2010. Lancet. 2013;381(9871):997–1020. doi: 10.1016/S0140-6736(13)60355-4. [DOI] [PubMed] [Google Scholar]
- 64.Anenberg SC, Horowitz LW, Tong DQ, et al. An estimate of the global burden of anthropogenic ozone and fine particulate matter on premature human mortality using atmospheric modeling. Environ Health Perspect. 2010;118(9):1189–1195. doi: 10.1289/ehp.0901220. [DOI] [PMC free article] [PubMed] [Google Scholar]
- 65.Bell ML, Goldberg R, Hogrefe C, et al. Climate change, ambient ozone, and health in 50 US cities. Clim Change. 2007;82(1-2):61–76. [Google Scholar]
- 66.Knowlton K, Rosenthal JE, Hogrefe C, et al. Assessing ozone-related health impacts under a changing climate. Environ Health Perspect. 2004;112(15):1557–1563. doi: 10.1289/ehp.7163. [DOI] [PMC free article] [PubMed] [Google Scholar]
- 67.Oliveira MS, Leon AP, Mattos IE, et al. Differential susceptibility according to gender in the association between air pollution and mortality from respiratory diseases. Cad Saude Publica. 2011;27(9):1827–1836. doi: 10.1590/s0102-311x2011000900016. [DOI] [PubMed] [Google Scholar]
- 68.Goldberg MS, Burnett RT, Yale JF, et al. Associations between ambient air pollution and daily mortality among persons with diabetes and cardiovascular disease. Environ Res. 2006;100(2):255–267. doi: 10.1016/j.envres.2005.04.007. [DOI] [PubMed] [Google Scholar]
- 69.Kan H, London SJ, Chen G, et al. Season, sex, age, and education as modifiers of the effects of outdoor air pollution on daily mortality in Shanghai, China: the Public Health and Air Pollution in Asia (PAPA) Study. Environ Health Perspect. 2008;116(9):1183–1188. doi: 10.1289/ehp.10851. [DOI] [PMC free article] [PubMed] [Google Scholar]
- 70.Qian Z, He Q, Lin HM, et al. Part 2. Association of daily mortality with ambient air pollution, and effect modification by extremely high temperature in Wuhan, China. Res Rep Health Eff Inst. 2010;(154):91–217. [PubMed] [Google Scholar]
- 71.Vichit-Vadakan N, Vajanapoom N, Ostro B, et al. Part 3. Estimating the effects of air pollution on mortality in Bangkok, Thailand. Res Rep Health Eff Inst. 2010;(154):231–268. [PubMed] [Google Scholar]
- 72.Yang C, Yang H, Guo S, et al. Alternative ozone metrics and daily mortality in Suzhou: the China Air Pollution and Health Effects Study (CAPES) Sci Total Environ. 2012;426:83–89. doi: 10.1016/j.scitotenv.2012.03.036. [DOI] [PubMed] [Google Scholar]
- 73.Zhang Y, Huang W, London SJ, et al. Ozone and daily mortality in Shanghai, China. Environ Health Perspect. 2006;114(8):1227–1232. doi: 10.1289/ehp.9014. [DOI] [PMC free article] [PubMed] [Google Scholar]
- 74.Arbex MA, de Souza Conceição GM, Cendon SP, et al. Urban air pollution and chronic obstructive pulmonary disease-related emergency department visits. J Epidemiol Community Health. 2009;63(10):777–783. doi: 10.1136/jech.2008.078360. [DOI] [PubMed] [Google Scholar]
- 75.Cakmak S, Dales RE, Judek S. Do gender, education, and income modify the effect of air pollution gases on cardiac disease? J Occup Environ Med. 2006;48(1):89–94. doi: 10.1097/01.jom.0000184878.11956.4b. [DOI] [PubMed] [Google Scholar]
- 76.Cakmak S, Dales RE, Judek S. Respiratory health effects of air pollution gases: modification by education and income. Arch Environ Occup Health. 2006;61(1):5–10. doi: 10.3200/AEOH.61.1.5-10. [DOI] [PubMed] [Google Scholar]
- 77.Canova C, Dunster C, Kelly FJ, et al. PM10-induced hospital admissions for asthma and chronic obstructive pulmonary disease: the modifying effect of individual characteristics. Epidemiology. 2012;23(4):607–615. doi: 10.1097/EDE.0b013e3182572563. [DOI] [PubMed] [Google Scholar]
- 78.Carlsen HK, Forsberg B, Meister K, et al. Ozone is associated with cardiopulmonary and stroke emergency hospital visits in Reykjavík, Iceland 2003–2009. Environ Health. 2013;12:28. doi: 10.1186/1476-069X-12-28. [DOI] [PMC free article] [PubMed] [Google Scholar]
- 79.Corea F, Silvestrelli G, Baccarelli A, et al. Airborne pollutants and lacunar stroke: a case cross-over analysis on stroke unit admissions. Neurol Int. 2012;4(2):e11. doi: 10.4081/ni.2012.e11. [DOI] [PMC free article] [PubMed] [Google Scholar]
- 80.Kaplan GG, Dixon E, Panaccione R, et al. Effect of ambient air pollution on the incidence of appendicitis. CMAJ. 2009;181(9):591–597. doi: 10.1503/cmaj.082068. [DOI] [PMC free article] [PubMed] [Google Scholar]
- 81.Luginaah IN, Fung KY, Gorey KM, et al. Association of ambient air pollution with respiratory hospitalization in a government-designated “area of concern”: the case of Windsor, Ontario. Environ Health Perspect. 2005;113(3):290–296. doi: 10.1289/ehp.7300. [DOI] [PMC free article] [PubMed] [Google Scholar]
- 82.Paulu C, Smith AE. Tracking associations between ambient ozone and asthma-related emergency department visits using case-crossover analysis. J Public Health Manag Pract. 2008;14(6):581–591. doi: 10.1097/01.PHH.0000338371.53242.0e. [DOI] [PubMed] [Google Scholar]
- 83.Son JY, Lee JT, Park YH, et al. Short-term effects of air pollution on hospital admissions in Korea. Epidemiology. 2013;24(4):545–554. doi: 10.1097/EDE.0b013e3182953244. [DOI] [PubMed] [Google Scholar]
- 84.Szyszkowicz M. Ambient air pollution and daily emergency department visits for asthma in Edmonton, Canada. Int J Occup Med Environ Health. 2008;21(1):25–30. doi: 10.2478/v10001-008-0002-3. [DOI] [PubMed] [Google Scholar]
- 85.Villeneuve PJ, Chen L, Stieb D, et al. Associations between outdoor air pollution and emergency department visits for stroke in Edmonton, Canada. Eur J Epidemiol. 2006;21(9):689–700. doi: 10.1007/s10654-006-9050-9. [DOI] [PubMed] [Google Scholar]
- 86.Xu X, Sun Y, Ha S, et al. Association between ozone exposure and onset of stroke in Allegheny County, Pennsylvania, USA, 1994–2000. Neuroepidemiology. 2013;41(1):2–6. doi: 10.1159/000345138. [DOI] [PubMed] [Google Scholar]
- 87.Dales RE, Cakmak S, Vidal CB. Air pollution and hospitalization for headache in Chile. Am J Epidemiol. 2009;170(8):1057–1066. doi: 10.1093/aje/kwp217. [DOI] [PMC free article] [PubMed] [Google Scholar]
- 88.Oudin A, Strömberg U, Jakobsson K, et al. Estimation of short-term effects of air pollution on stroke hospital admissions in southern Sweden. Neuroepidemiology. 2010;34(3):131–142. doi: 10.1159/000274807. [DOI] [PubMed] [Google Scholar]
- 89.Cakmak S, Dales RE, Vidal CB. Air pollution and mortality in Chile: susceptibility among the elderly. Environ Health Perspect. 2007;115(4):524–527. doi: 10.1289/ehp.9567. [DOI] [PMC free article] [PubMed] [Google Scholar]
- 90.Fischer P, Hoek G, Brunekreef B, et al. Air pollution and mortality in The Netherlands: are the elderly more at risk? Eur Respir J Suppl. 2003;40:34s–38s. doi: 10.1183/09031936.03.00402503. [DOI] [PubMed] [Google Scholar]
- 91.Goldberg MS, Burnett RT, Brook J, et al. Associations between daily cause-specific mortality and concentrations of ground-level ozone in Montreal, Quebec. Am J Epidemiol. 2001;154(9):817–826. doi: 10.1093/aje/154.9.817. [DOI] [PubMed] [Google Scholar]
- 92.Qian Z, He Q, Lin HM, et al. Short-term effects of gaseous pollutants on cause-specific mortality in Wuhan, China. J Air Waste Manag Assoc. 2007;57(7):785–793. doi: 10.3155/1047-3289.57.7.785. [DOI] [PubMed] [Google Scholar]
- 93.Romieu I, Gouveia N, Cifuentes LA, et al. Multicity study of air pollution and mortality in Latin America (the ESCALA study) Res Rep Health Eff Inst. 2012;(171):5–86. [PubMed] [Google Scholar]
- 94.Wong CM, Rabl A, Thach TQ, et al. Impact of the 1990 Hong Kong legislation for restriction on sulfur content in fuel. Res Rep Health Eff Inst. 2012;(170):5–91. [PubMed] [Google Scholar]
- 95.Borja-Aburto VH, Castillejos M, Gold DR, et al. Mortality and ambient fine particles in southwest Mexico City, 1993–1995. Environ Health Perspect. 1998;106(12):849–855. doi: 10.1289/ehp.106-1533229. [DOI] [PMC free article] [PubMed] [Google Scholar]
- 96.Chock DP, Winkler SL, Chen C. A study of the association between daily mortality and ambient air pollutant concentrations in Pittsburgh, Pennsylvania. J Air Waste Manag Assoc. 2000;50(8):1481–1500. doi: 10.1080/10473289.2000.10464170. [DOI] [PubMed] [Google Scholar]
- 97.de Almeida SP, Casimiro E, Calheiros J. Short-term association between exposure to ozone and mortality in Oporto, Portugal. Environ Res. 2011;111(3):406–410. doi: 10.1016/j.envres.2011.01.024. [DOI] [PubMed] [Google Scholar]
- 98.De Leon SF, Thurston GD, Ito K. Contribution of respiratory disease to nonrespiratory mortality associations with air pollution. Am J Respir Crit Care Med. 2003;167(8):1117–1123. doi: 10.1164/rccm.200205-409OC. [DOI] [PubMed] [Google Scholar]
- 99.Garrett P, Casimiro E. Short-term effect of fine particulate matter (PM2.5) and ozone on daily mortality in Lisbon, Portugal. Environ Sci Pollut Res Int. 2011;18(9):1585–1592. doi: 10.1007/s11356-011-0519-z. [DOI] [PubMed] [Google Scholar]
- 100.Gouveia N, Fletcher T. Time series analysis of air pollution and mortality: effects by cause, age and socioeconomic status. J Epidemiol Community Health. 2000;54(10):750–755. doi: 10.1136/jech.54.10.750. [DOI] [PMC free article] [PubMed] [Google Scholar]
- 101.Hoek G, Schwartz JD, Groot B, et al. Effects of ambient particulate matter and ozone on daily mortality in Rotterdam, The Netherlands. Arch Environ Health. 1997;52(6):455–463. doi: 10.1080/00039899709602224. [DOI] [PubMed] [Google Scholar]
- 102.Liang WM, Wei HY, Kuo HW. Association between daily mortality from respiratory and cardiovascular diseases and air pollution in Taiwan. Environ Res. 2009;109(1):51–58. doi: 10.1016/j.envres.2008.10.002. [DOI] [PubMed] [Google Scholar]
- 103.Lin CM, Liao CM. Temperature-dependent association between mortality rate and carbon monoxide level in a subtropical city: Kaohsiung, Taiwan. Int J Environ Health Res. 2009;19(3):163–174. doi: 10.1080/09603120802460384. [DOI] [PubMed] [Google Scholar]
- 104.O'Neill MS, Loomis D, Borja-Aburto VH. Ozone, area social conditions, and mortality in Mexico City. Environ Res. 2004;94(3):234–242. doi: 10.1016/j.envres.2003.07.002. [DOI] [PubMed] [Google Scholar]
- 105.Parodi S, Vercelli M, Garrone E, et al. Ozone air pollution and daily mortality in Genoa, Italy between 1993 and 1996. Public Health. 2005;119(9):844–850. doi: 10.1016/j.puhe.2004.10.007. [DOI] [PubMed] [Google Scholar]
- 106.Pattenden S, Armstrong B, Milojevic A, et al. Ozone, heat and mortality: acute effects in 15 British conurbations. Occup Environ Med. 2010;67(10):699–707. doi: 10.1136/oem.2009.051714. [DOI] [PubMed] [Google Scholar]
- 107.Penttinen P, Tiittanen P, Pekkanen J. Mortality and air pollution in metropolitan Helsinki, 1988–1996. Scand J Work Environ Health. 2004;30(suppl 2):19–27. [PubMed] [Google Scholar]
- 108.Prescott GJ, Cohen GR, Elton RA, et al. Urban air pollution and cardiopulmonary ill health: a 14.5 year time series study. Occup Environ Med. 1998;55(10):697–704. doi: 10.1136/oem.55.10.697. [DOI] [PMC free article] [PubMed] [Google Scholar]
- 109.Revich B, Shaposhnikov D. The effects of particulate and ozone pollution on mortality in Moscow, Russia. Air Qual Atmos Health. 2010;3(2):117–123. doi: 10.1007/s11869-009-0058-7. [DOI] [PMC free article] [PubMed] [Google Scholar]
- 110.Simpson RW, Williams G, Petroeschevsky A, et al. Associations between outdoor air pollution and daily mortality in Brisbane, Australia. Arch Environ Health. 1997;52(6):442–454. doi: 10.1080/00039899709602223. [DOI] [PubMed] [Google Scholar]
- 111.Simpson R, Denison L, Petroeschevsky A, et al. Effects of ambient particle pollution on daily mortality in Melbourne, 1991–1996. J Expo Anal Environ Epidemiol. 2000;10(5):488–496. doi: 10.1038/sj.jea.7500137. [DOI] [PubMed] [Google Scholar]
- 112.Sunyer J, Castellsagué J, Sáez M, et al. Air pollution and mortality in Barcelona. J Epidemiol Community Health. 1996;50(suppl 1):s76–s80. doi: 10.1136/jech.50.suppl_1.s76. [DOI] [PMC free article] [PubMed] [Google Scholar]
- 113.Wong CM, Ou CQ, Thach TQ, et al. Does regular exercise protect against air pollution-associated mortality? Prev Med. 2007;44(5):386–392. doi: 10.1016/j.ypmed.2006.12.012. [DOI] [PubMed] [Google Scholar]
- 114.Wong CM, Thach TQ, Chau PY, et al. Part 4. Interaction between air pollution and respiratory viruses: time-series study of daily mortality and hospital admissions in Hong Kong. Res Rep Health Eff Inst. 2010;(154):283–362. [PubMed] [Google Scholar]
- 115.Zanobetti A, Schwartz J. Is there adaptation in the ozone mortality relationship: a multi-city case-crossover analysis. Environ Health. 2008;7:22. doi: 10.1186/1476-069X-7-22. [DOI] [PMC free article] [PubMed] [Google Scholar]
- 116.Bremner SA, Anderson HR, Atkinson RW, et al. Short-term associations between outdoor air pollution and mortality in London 1992–4. Occup Environ Med. 1999;56(4):237–244. doi: 10.1136/oem.56.4.237. [DOI] [PMC free article] [PubMed] [Google Scholar]
- 117.Kwon HJ, Cho SH, Nyberg F, et al. Effects of ambient air pollution on daily mortality in a cohort of patients with congestive heart failure. Epidemiology. 2001;12(4):413–419. doi: 10.1097/00001648-200107000-00011. [DOI] [PubMed] [Google Scholar]
- 118.Atkinson RW, Bremner SA, Anderson HR, et al. Short-term associations between emergency hospital admissions for respiratory and cardiovascular disease and outdoor air pollution in London. Arch Environ Health. 1999;54(6):398–411. doi: 10.1080/00039899909603371. [DOI] [PubMed] [Google Scholar]
- 119.Atkinson RW, Anderson HR, Strachan DP, et al. Short-term associations between outdoor air pollution and visits to accident and emergency departments in London for respiratory complaints. Eur Respir J. 1999;13(2):257–265. doi: 10.1183/09031936.99.13225799. [DOI] [PubMed] [Google Scholar]
- 120.Lee JT, Kim H, Cho YS, et al. Air pollution and hospital admissions for ischemic heart diseases among individuals 64+ years of age residing in Seoul, Korea. Arch Environ Health. 2003;58(10):617–623. doi: 10.3200/AEOH.58.10.617-623. [DOI] [PubMed] [Google Scholar]
- 121.Petroeschevsky A, Simpson RW, Thalib L, et al. Associations between outdoor air pollution and hospital admissions in Brisbane, Australia. Arch Environ Health. 2001;56(1):37–52. doi: 10.1080/00039890109604053. [DOI] [PubMed] [Google Scholar]
- 122.Ponce de Leon A, Anderson HR, Bland JM, et al. Effects of air pollution on daily hospital admissions for respiratory disease in London between 1987–88 and 1991–92. J Epidemiol Community Health. 1996;50(suppl 1):s63–s70. doi: 10.1136/jech.50.suppl_1.s63. [DOI] [PMC free article] [PubMed] [Google Scholar]
- 123.Schouten JP, Vonk JM, de Graaf A. Short term effects of air pollution on emergency hospital admissions for respiratory disease: results of the APHEA project in two major cities in The Netherlands, 1977–89. J Epidemiol Community Health. 1996;50(suppl 1):s22–s29. doi: 10.1136/jech.50.suppl_1.s22. [DOI] [PMC free article] [PubMed] [Google Scholar]
- 124.Wong TW, Lau TS, Yu TS, et al. Air pollution and hospital admissions for respiratory and cardiovascular diseases in Hong Kong. Occup Environ Med. 1999;56(10):679–683. doi: 10.1136/oem.56.10.679. [DOI] [PMC free article] [PubMed] [Google Scholar]
- 125.Buadong D, Jinsart W, Funatagawa I, et al. Association between PM10 and O3 levels and hospital visits for cardiovascular diseases in Bangkok, Thailand. J Epidemiol. 2009;19(4):182–188. doi: 10.2188/jea.JE20080047. [DOI] [PMC free article] [PubMed] [Google Scholar]
- 126.Anderson HR, Ponce de Leon A, Bland JM, et al. Air pollution, pollens, and daily admissions for asthma in London 1987–92. Thorax. 1998;53(10):842–848. doi: 10.1136/thx.53.10.842. [DOI] [PMC free article] [PubMed] [Google Scholar]
- 127.Bhaskaran K, Hajat S, Armstrong B, et al. The effects of hourly differences in air pollution on the risk of myocardial infarction: case crossover analysis of the MINAP database. BMJ. 2011;343:d5531. doi: 10.1136/bmj.d5531. [DOI] [PMC free article] [PubMed] [Google Scholar]
- 128.Freitas MC, Pacheco AM, Verburg TG, et al. Effect of particulate matter, atmospheric gases, temperature, and humidity on respiratory and circulatory diseases’ trends in Lisbon, Portugal. Environ Monit Assess. 2010;162(1-4):113–121. doi: 10.1007/s10661-009-0780-5. [DOI] [PubMed] [Google Scholar]
- 129.Halonen JI, Lanki T, Tiittanen P, et al. Ozone and cause-specific cardiorespiratory morbidity and mortality. J Epidemiol Community Health. 2010;64(9):814–820. doi: 10.1136/jech.2009.087106. [DOI] [PubMed] [Google Scholar]
- 130.Larrieu S, Jusot JF, Blanchard M, et al. Short term effects of air pollution on hospitalizations for cardiovascular diseases in eight French cities: the PSAS program. Sci Total Environ. 2007;387(1-3):105–112. doi: 10.1016/j.scitotenv.2007.07.025. [DOI] [PubMed] [Google Scholar]
- 131.Morgan G, Corbett S, Wlodarczyk J. Air pollution and hospital admissions in Sydney, Australia, 1990 to 1994. Am J Public Health. 1998;88(12):1761–1766. doi: 10.2105/ajph.88.12.1761. [DOI] [PMC free article] [PubMed] [Google Scholar]
- 132.Spix C, Anderson HR, Schwartz J, et al. Short-term effects of air pollution on hospital admissions of respiratory diseases in Europe: a quantitative summary of APHEA study results. Arch Environ Health. 1998;53(1):54–64. doi: 10.1080/00039899809605689. [DOI] [PubMed] [Google Scholar]
- 133.Sunyer J, Spix C, Quénel P, et al. Urban air pollution and emergency admissions for asthma in four European cities: the APHEA Project. Thorax. 1997;52(9):760–765. doi: 10.1136/thx.52.9.760. [DOI] [PMC free article] [PubMed] [Google Scholar]
- 134.Wilson AM, Wake CP, Kelly T, et al. Air pollution, weather, and respiratory emergency room visits in two northern New England cities: an ecological time-series study. Environ Res. 2005;97(3):312–321. doi: 10.1016/j.envres.2004.07.010. [DOI] [PubMed] [Google Scholar]
- 135.Gwynn RC, Thurston GD. The burden of air pollution: impacts among racial minorities. Environ Health Perspect. 2001;109(suppl 4):501–506. doi: 10.1289/ehp.01109s4501. [DOI] [PMC free article] [PubMed] [Google Scholar]
- 136.Villeneuve PJ, Burnett RT, Shi Y, et al. A time-series study of air pollution, socioeconomic status, and mortality in Vancouver, Canada. J Expo Anal Environ Epidemiol. 2003;13(6):427–435. doi: 10.1038/sj.jea.7500292. [DOI] [PubMed] [Google Scholar]
- 137.Yang Q, Chen Y, Shi Y, et al. Association between ozone and respiratory admissions among children and the elderly in Vancouver, Canada. Inhal Toxicol. 2003;15(13):1297–1308. doi: 10.1080/08958370390241768. [DOI] [PubMed] [Google Scholar]
Associated Data
This section collects any data citations, data availability statements, or supplementary materials included in this article.