

Abstract
Motivation: Various approaches based on features extracted from protein sequences and often machine learning methods have been used in the prediction of protein folds. Finding an efficient technique for integrating these different protein features has received increasing attention. In particular, kernel methods are an interesting class of techniques for integrating heterogeneous data. Various methods have been proposed to fuse multiple kernels. Most techniques for multiple kernel learning focus on learning a convex linear combination of base kernels. In addition to the limitation of linear combinations, working with such approaches could cause a loss of potentially useful information.
Results: We design several techniques to combine kernel matrices by taking more involved, geometry inspired means of these matrices instead of convex linear combinations. We consider various sequence-based protein features including information extracted directly from position-specific scoring matrices and local sequence alignment. We evaluate our methods for classification on the SCOP PDB-40D benchmark dataset for protein fold recognition. The best overall accuracy on the protein fold recognition test set obtained by our methods is ∼86.7%. This is an improvement over the results of the best existing approach. Moreover, our computational model has been developed by incorporating the functional domain composition of proteins through a hybridization model. It is observed that by using our proposed hybridization model, the protein fold recognition accuracy is further improved to 89.30%. Furthermore, we investigate the performance of our approach on the protein remote homology detection problem by fusing multiple string kernels.
Availability and implementation: The MATLAB code used for our proposed geometric kernel fusion frameworks are publicly available at http://people.cs.kuleuven.be/∼raf.vandebril/homepage/software/geomean.php?menu=5/
Contact: pooyapaydar@gmail.com or yves.moreau@esat.kuleuven.be
Supplementary information: Supplementary data are available at Bioinformatics online.
1 INTRODUCTION
Knowledge on functions of proteins can be provided by information about their tertiary structure; hence, determining this structure is among the most essential objectives in molecular biology, cell biology, proteomics and bioinformatics. Structural information also provides a much better understanding of protein–protein interaction. Furthermore, this information is potentially useful for drug design studies. Unfortunately, experimentally identifying the 3D structure of proteins is expensive and time-consuming. By contrast, recent development in genome sequencing projects has tremendously increased the number of protein coding sequences. Because there is much slower growth in information on 3D structure, there is an increasing gap between the protein sequence information and protein structure information. Despite these problems, knowledge about protein folds can be useful in determining its structural properties. Because of the limitation of homology modelling methods, when there is no sequence similarity to homologous proteins of known structure, the taxonomic approach is usually considered as a trustworthy alternative. This approach is based on the assumption that the number of protein domain folds is restricted (Dubchak et al., 1999; Murzin et al., 1995). Promising results are reported using taxonomic approaches (Ding and Dubchak, 2001; Shen and Chou, 2006; Yang et al., 2011), but they are still far from tackling the classification of protein folds completely. So, fold recognition or protein threading is still among the most challenging tasks in bioinformatics. In many bioinformatics tasks, it is worthwhile to consider several representations of the data, which will not always be vectors. In particular, we should be able to deal with them using the same algorithm, regardless whether they are represented as binary vectors, real vectors on different scales, sequences, graph data, etc. Various approaches based on features extracted from protein sequence and often machine learning approaches have been used to tackle the fold recognition problem. Several informative fold data sources can be constructed based on various representative models of protein features (PFs), such as primary structural information (Chen and Kurgan, 2007; Ding and Dubchak, 2001; Yang et al., 2011), local pairwise sequence alignment-based feature spaces (Damoulas and Girolami, 2008), physicochemical properties of constituent amino acids (Ding and Dubchak, 2001; Lin et al., 2013) and sequence evolution information (Chen and Kurgan, 2007; Kavousi et al., 2011; Sharma et al., 2013; Shen and Chou, 2009; Yang et al., 2011). More attention needs to be paid to finding an efficient and cost-effective technique for integrating these different discriminatory data sources for protein fold classification. Nevertheless, to deal with biological data, there are not only a lot of issues in machine learning algorithms but also a lot of difficulties in data analysis. Full integration and decision integration are common techniques for fusing protein fold data sources. In particular, full integration is a fast and easy way to fuse data sources. However, because of heterogeneity of the biological data, combining data sources at the data level is not always feasible in practice. By contrast, fusing data sources at decision level, such as in the ensemble learning framework, is considered as an intuitive manner to deal with heterogeneous data. Various decision-based integration approaches have been proposed for protein fold classification (Kavousi et al., 2011; Lin et al., 2013; Nanni, 2006; Shen and Chou, 2006, 2009; Yang et al., 2011). In addition to limitations of using ad hoc ensemble learning, the computational cost of decision-based approaches increases corresponding to the number of data sources.
The heterogeneous biological data sources can also be integrated intelligently using partial integration, such as kernel-based data fusion. Using kernel methods is an elegant and versatile strategy because it decouples the original data from the machine learning algorithms by using a representation of the data as a kernel matrix. The main idea behind kernel methods is, rather than using original data directly, to use only a kernel matrix. Symmetric positive definite (SPD) kernel matrices are the non-linear extension of covariance/correlation matrices and encode the similarity between samples in their respective input space. This implies that the heterogeneous data (binary vectors, real vectors on different scales, graph data) can all be replaced by appropriately scaled kernel matrices, which all have the same size, and thus that the data heterogeneity disappears. Then other algorithms (such as classification, clustering and prioritization) can access the same data, which is currently not possible. Constructing the same representation for all datasets and integrating these representations systematically is the main intuition behind kernel fusion methods. In the simplest scenario, we can compute kernel matrices separately for each data source and then average them together.
The standard approach for combining kernel matrices is to take the (weighted) arithmetic average. There are several methods for obtaining a valid and fitting kernel by tuning the kernel matrices weights (Gönen and Alpaydin, 2011). Finding such weights from training data and replacing the single kernel by a linear combination of weighted base kernels is usually referred to as multiple kernel learning (MKL). These weights can also be interpreted as their corresponding importance in the fused kernel. During the past decades, several MKL methods have been proposed in the literature (Bach et al., 2004; Lanckriet et al., 2004a,b; Sonnenburg et al., 2006; Rakotomamonjy et al., 2008; Vishwanathan et al., 2010) and are shown to yield good results in various applications, in particular in bioinformatics applications (De Bie et al., 2007; Lanckriet et al., 2004b; Ying et al., 2009; Yu, 2011; Zien and Ong, 2007). Most of these approaches try to learn a linear combination of base kernels, which can be interpreted as the concatenation of the base kernel feature space or an ‘OR’ combination of the individual kernels.
The kernel integration problem is often reduced to a convex optimization problem. In addition to the limitation of linear combinations, solving this optimization problem is only possible for a small number of kernels and small number of data points. Furthermore, because this type of averaging is often sensitive to deal with complementary and noisy kernels, it is not appropriate for biological data. In fact, going with such approaches could cause a loss of potentially useful latent information in the data.
Recent biological applications have demonstrated that even using uniformly weighted kernel integration can boost the generalization capability of the decision function (Daemen et al., 2009; De Bie et al., 2007; Lanckriet et al., 2004b; Ying et al., 2009). By contrast, the results obtained by using such averaging of the kernel matrices are comparable with the results of the best existing MKL approaches in general applications (De Bie et al., 2007; Lanckriet et al., 2004b; Ying et al., 2009). Hence, using the uniformly weighted average of the base kernels can be considered as a reliable and computationally more scalable alternative. Uniformly weighted kernel integration can also be considered as the arithmetic mean (AM) of kernel matrices, which is always a generator of a valid Mercer kernel. Similar to the AM, other types of means of SPD matrices [such as the harmonic mean (HM), Log-Euclidean mean (LogEM; Arsigny et al., 2007) and geometric mean (GM)] result in SPD kernels. In this study, we propose and develop several new techniques that combine the Mercer kernel matrices through other types of averaging than convex linear combination. Such averaging of the base kernels can be interpreted as a kind of fusion that expresses the non-linear relationship between the individual kernels. In particular, we focus on taking the matrix GM of base kernels. However, computing the GM of a general number of SPD matrices is a challenge. In fact, for a general number of SPD matrices, a proper definition of a GM with some natural properties has only recently been developed (Bhatia, 2007). We present two methods for computing the GM. The first approach is focused on computing the actual GM using the definition of the Karcher mean (Jeuris et al., 2012). The second, however, only computes a rough approximation of the actual GM using a proposed heuristic method based on Arithmetic-Geometric-Harmonic (AGH) mean. We show in the second section that it is a computationally scalable method for computing an approximate GM. We also consider the behaviour of combining kernels by taking HM and log-EM, where this last one can be seen as a consensus between the AM and GM. Moreover, our computational model has been developed by incorporating the functional domain information through the hybridization model. Experimental results on the SCOP PDB-40D benchmark dataset (Ding and Dubchak, 2001) demonstrate that our integration technique can effectively improve the accuracy of the state-of-the-art kernel fusion model.
2 GEOMETRIC KERNEL FUSION
To improve the efficiency of kernel data fusion through the convex combination of kernel matrices, there are several complex convex optimization-based approaches (Bach et al., 2004; Lanckriet et al., 2004a; Rakotomamonjy et al., 2008; Sonnenburg et al., 2006; Vishwanathan et al., 2010) that try to optimize the kernel weights based on different optimization criteria. The optimized weights of kernel matrices reflect the relative importance of the different dataset in the fused kernel. It is expected that the kernel matrices that have more information than others receive higher weights in such weighted convex linear combination. However, convex combination of kernel matrices often leads to mixed results. Moreover, it has also been shown that optimization of weights causes an improvement in performance only when dealing with redundant or noisy kernel matrices (Lanckriet et al., 2004b). Linear convex combination of kernel matrices often fails to fully capture all the information for kernels containing complementary non-redundant information. This is, however, a typical situation in biological applications. This is also affirmed by the equal weights theorem (Wainer, 1976), which states when all optimized weights are uniformly distributed on the interval [0.25; 0.75], the performance is barely changed using equal weights. Therefore, when dealing with many data sources, which are all not informative, a more practical scenario could be to select the reliable data sources and discard the rest, then take an unweighted averaging between kernel matrices. Using the Euclidean distance on a convex cone whose interior contains all SPD matrices  , we can obtain the AM. For a given set of SPD kernel matrices
  , the AM is given by
  . By contrast, because it has been shown that this type of averaging mixed the result and has usually sensitive behaviour in dealing with complementary and noisy kernels, Euclidean distance on SPD matrices might not be appropriate. Moreover, SPD matrices form a convex cone and not a vector space. This has an effect on the ‘natural’ geometry of SPD matrices, which may not be Euclidean, but rather should rely on concepts from Riemannian geometry. This motivates us to think about other means between SPD matrices that are not relative to the Euclidean distance on
  and necessarily a linear combination of SPD matrices. For example, the mean corresponding to Riemannian distance on
  is the GM. For a given set of SPD kernel matrices
  , the GM
  is the unique solution of the non-linear matrix equation
  . Because of the non-commutative property of matrix multiplication, the equation can not be solved in closed form. However, the GM of two SPD kernel matrices K1 and K2 can be defined explicitly as follows (Bhatia, 2007):
| (1) |
This leads to the fusion of K1 and K2 as  . The GM has several properties that make it useful, of which an important one is its invariance under inversion. On the contrary, the AM is not invariant under inversion, which means that if
  , then in general,
  . This property becomes interesting when kernel matrices are considered under analogy to covariance matrices of Gaussian distributions. In the Gaussian case, the covariance matrix K can be used as a positive semi-definite kernel representation of a data sources. But the covariance matrix is not the most interesting object to investigate. For a multivariate normal distribution, the precision matrix P (which is the inverse of the covariance matrix,
  ) encodes independence relations between variables in the form of partial correlations. Zeros in the precision matrix indicate some notion of partial correlation independence between two variables. Some immediate manipulations result in equalities such as
  and
and  . Hence, computing the GM of the covariance matrices is equivalent to computing the GM between the precision matrices, which is a particularly attractive idea in the case of Gaussian distributions, and may thus be a valuable property when fusing kernels. For a general number of matrices, the fused kernel is obtained by taking the GM
| (2) |
We describe our proposed methods for computing the GM of SPD matrices and some approximations in the following sections.
2.1 Karcher mean and AGH mean
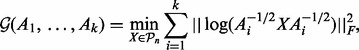
For two SPD matrices A and B, the GM is given by the explicit formula (1). However, for more than two matrices, a proper definition of a GM with some natural properties remained elusive for long. The most popular instance of the matrix GM is considered to be the Karcher mean (Jeuris et al., 2012). The Karcher mean of SPD matrices  is defined as the barycenter of these matrices on the manifold of SPD matrices with its Riemannian geometry. In practice, this is obtained by searching the minimizer of an optimization problem, given as follows:
 |
(3) |
where  represents the set of SPD
  matrices and
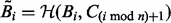
  is the Frobenius norm. To find the minimizer, we use manifold optimization (Absil et al., 2008; for more details see the Supplementary Material). However, retrieving the Karcher mean can be computationally expensive, which is why we also discuss the AGH mean, which can be considered as an approximation to the Karcher mean. For every two positive scalars, alternatively computing the AM and HM repeatedly will converge to the GM. At the base of the AGH mean lies the observation that the GM of two matrices can be obtained by taking the AM and HM (for more details see the Supplementary Material) of the matrices and iteratively repeating this procedure with the new matrices (Foster and Phillips, 1984). Generalizing this to more than two matrices, we duplicate the original set of matrices and combine both in arithmetic and harmonic operations, as illustrated by the matrices Bi and Ci in Algorithm 1. To counteract the decrease of speed of this technique, a randomization is introduced (last step in Algorithm 1). The result is a rapidly converging algorithm that provides a decent approximation to the Karcher mean.
This approximate mean requires a computational cost of the order  per iteration, which is an improvement when compared with the Karcher mean. The stopping criteria of the algorithm are the same as those of the Karcher mean, except when determining the distance between the consecutive iterations, where only the first of the Bi-matrices is considered. The kernel fusion framework approaches using the Karcher and AGH mean are called Karcher-KF (geometric kernel fusion 1, GKF1) and AGH-KF (GKF2), respectively.
Algorithm 1 The approximate AGH mean algorithm where  denotes the AM and
  the HM.
Let  be SPD matrices
For all i set
 and
and  ;
;- while not converged
- For all i set
 ;
; - For all i set
 ;
; - For all i set
 ,
,  , with p a random permutation of
  .
.
end
2.2 Log-Euclidean mean
In this section we describe a new approach (Arsigny et al., 2007) to compute a mean of SPD matrices called the LogEM.
Given SPD matrices  , their Log-Euclidean Fréchet mean exists and is uniquely given by the explicit formula
 |
(4) |
The LogEM is similarity-invariant, invariant by group multiplication, inversion and exponential-invariant. The LogEM also has outstanding behaviour with respect to the determinant (for more details see the Supplementary Material). Because of the nice properties of the LogEM and the high computational cost of GM, it will also be considered in our fusion framework for combining kernels (LogE-KF).
3 MATERIAL AND METHODS
3.1 Benchmark datasets
We use the benchmark dataset from Ding and Dubchak (DD) (Ding and Dubchak, 2001), which has been widely used for evaluating protein fold recognition predictors. This benchmark dataset consists of 27 SCOP fold classes for 694 protein domains (311 proteins for the training set and 383 proteins for the test set). The identity between any two proteins in the training and test set is kept to <35% to get balance between the homologous bias and the size of the dataset. Supplementary Table S1 lists a summary of training and test datasets belonging to the 27 protein domain folds of SCOP corresponding to all major structural classes:  . We also developed the model based on the newer SCOP database (version 1.75; newDD) as it is used in (Yang and Chen, 2011). This database version contains 3397 protein sequences in the 27 folds.
3.2 Feature vectors
The first 12 PFs listed in Supplementary Material S2 are the most popular representative models of protein domains, which have been employed frequently for classification of DD protein domain folds. These PFs include six types of structural information [Amino Acid composition (C), Predicted Secondary Structure (S), PseAAC  (L1), PseAAC
  (L4), PseAAC
  (L14) and PseAAC
  (L30)], four kinds of physicochemical properties of constituent amino acids [Hydrophobicity (H), Polarity (P), van der Waals volume (V) and Polarizability] and two local pairwise sequence alignment-based feature spaces [based on Smith Waterman using BLOSUM62 (SWr1) and PAM50(SWr2)] (Damoulas and Girolami, 2008). In addition, because these features were already considered by two kernel-based data integration approaches (Damoulas and Girolami, 2008; Ying et al., 2009), we are able to compare and evaluate the performance of our approach more precisely using those results.
Sequence evolution information. Recently, sequence evolution information is often used to perform protein fold classification (Kavousi et al., 2011; Sharma et al., 2013; Shen and Chou, 2009; Yang and Chen, 2011) because good results can be obtained when using such information to determine protein secondary structure (Kaur and Raghava, 2003), subcellular localization (Rashid et al., 2007; Xie et al., 2005) and subnuclear localization (Shen and Chou, 2007). In particular, promising results have been reported recently using only the sequence evolution information through a new feature extraction method (bi-gram; Sharma et al., 2013) from position-specific scoring matrices (PSSM; Schaffer et al., 2001).
A protein sample P with L amino acid residues can be represented by its evolutionary information through PSSM or position-specific frequency matrices (PSFM) profiles (Rangwala and Karypis, 2005), which both have L columns and 20 rows. Each row of PSSM ( ) represents the log-likelihood of the residue substitution at the corresponding position in the protein sequence. In particular, the
  -th entry of the PSSM matrix (
 ) represents the possibility of the amino acid type j appearing in the i-th position of the protein domain during the evolution process. The PSSM entries are obtained using the PSI-BLAST program to search the non-redundant protein database, like the Swiss-prot database, through three iterations with the E-value cut-off set to 0.001. We use four common profile-based representative models of protein sequences:
A 400 dimensional feature vector created by summing up each column of the same amino acid in the PSSM and dividing by the length of the protein domain, followed by a normalization
 that scales each score to the range of [0,1] (PS1).
A 20 dimensional feature vector created by summing up each column in the PSFM profile and dividing by the length of the domain (PS2).
A 20 dimensional feature vector created by summing up each column in the PSSM profile and dividing by the length of the domain (PS3).
The PsePSSM was originally introduced in (Chou, 2001) to avoid complete loss of the sequence-order information (for more details see the Supplementary Material).
Functional domain composition. To incorporate the available functional domain information (FunD) of proteins, we consider the FunD composition of protein sequences using integrated FunD databases, which contain protein sequences with noted FunD descriptions. A protein sequence can be summarized by its known functional domains. This representative model for a protein sequence was first introduced in (Cai et al., 2002, 2003) and is also considered for protein fold classification (Shen and Chou, 2009), protein structural recognition (Chou and Cai, 2004), protein subcellular location prediction (Cai et al., 2002) and prediction of protein submitochondria locations (Zakeri et al., 2011). In fact, fold information is a useful clue in determining a protein’s tertiary structure, which can facilitate the identification of its function. Hence, the FunD composition features are considered based on the rationale that the function of a protein is often correlated with its structural characteristics. For this purpose, we use the InterPro database (Apweiler et al., 2001; Hunter et al., 2012), which is an integrated database of recognized protein families, domains and functional sites to functionally characterize a new protein sequence. Moreover, we use the Conserved Domain Database (CDD; Marchler-Bauer et al., 2007, 2013), which is known as the integrated FunD database, to identify the putative function of a new protein sequence.
4 RESULT AND DISCUSSION
In this section, we discuss the extensive study of integrating multiple informative fold data sources. First, we focus on the individual performance of each PF data source. We should note that the GM applies only to SPD matrices. Besides the flexibility of the radial basis function (RBF) kernel function and its good generalization through the non-linear mapping of the input space to the infinite-dimensional feature space, the RBF kernel function produces SPD matrix. Two types of Gaussian RBF kernel functions are used for these data sources. Then, classification is performed using a Gaussian support vector machine (SVM) model, and its performance is estimated on an independent test set. Parameter selection details are provided in Supplementary Material. A one-against-other SVM classifier is constructed based on each representative model of the protein samples. To train SVMs, we used LIBSVM-3.1 implementation of the SVM algorithm (Chang and Lin, 2011). The performance of the individual classifiers on the test data is listed in Supplementary Table S2.
Next, to see the advantage of fusing heterogeneous data sources for protein fold classification through intermediate-based data integration, we focus on combining 26 RBF kernel matrices derived from each view on protein domains. The kernel matrices are combined through various types of means like GKF1, GKF2, AM, HM and LogE. Afterwards, the combined kernel is used to determine the performance. The general architecture of the proposed approaches for classifying protein folds is shown in Figure 1.
Fig. 1.
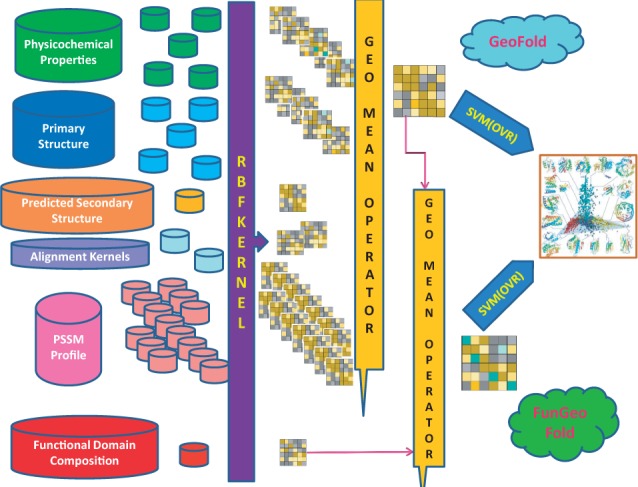
The architecture of our fusion model for protein fold recognition. GeoFold refers to the fusion model that uses 26 different data sources, and FunGeoFold refers to the kernel fusion model that incorporates the FunD information through GM between FunD kernel and fused kernel produced by GeoFold (GeoFold kernel)
Furthermore, to compare the performance of our proposed approaches, we also consider three types of MKL approaches [MKLdiv-dc and MKLdiv-conv (Ying et al., 2009) and SimpleMKL (Rakotomamonjy et al., 2008)], which have already been used for protein fold classification (Ying et al., 2009). We also consider a heuristic and simple MKL method (Qiu and Lane, 2009), which chooses the kernel weights based on the relationship between the kernel matrix and the covariance matrix of the target labels (AK-MKL) (for more details see the Supplementary Material). Then, a one-against-other SVM classifier is again constructed, now based on each of the combined kernels. The parameter C is chosen through 5-fold cross validation and is searched over a grid of values  .
.
Table 1 provides the total prediction accuracies of the existing approaches for classification of protein folds in the DD dataset. Table 1 also lists the success rates of our proposed kernel fusion approaches based on averaging of the kernel matrices. According to Table 1, classification results of the combined kernels using Karcher-KF, AGH-KF and LogE-KF show considerable improvement compared with the state-of-the-art. Figure 2 illustrates the behaviour of integrating kernel matrices using GKF1, GFK2 and LogE-KF. According to Table 1, the performance of GKF1, GKF2 and LogE-KF including all 26 sequence-based features achieves a test accuracy of 86.68, 86.16 and 81.72%, respectively. This implies that, in terms of similarity between protein samples, the fused kernel based on our proposed alternative algorithm (AGH mean) holds the same information as the fused kernel obtained using the Karcher mean, while the computational cost is lower. Also, promising results are achieved by our alternative fusion approach using the LogEM, which has an even lower computational cost.
Table 1.
Comparison of proposed models with the existing predictor and meta-predictors
| Methods | PERF | Description |
|---|---|---|
| SVM | 56 | (Ding and Dubchak, 2001) |
| SE | 61.1 | (Nanni, 2006) |
| PFP-Pred | 62.1 | (Shen and Chou, 2006) |
| PFRES | 68.4 | (Chen and Kurgan, 2007) |
| VBKC | 68.1 | (Damoulas and Girolami, 2008) |
| MLKdiv-dc | 73.36 | (Ying et al., 2009) 12 PFs |
| MLKdiv-conv | 71.01 | (Ying et al., 2009) 12 PFs |
| MLKdiv-dc | 75.19 | (Ying et al., 2009) 7 PFs |
| PFP-FunDseqE | 70.5 | (Shen and Chou, 2009) |
| Classifier Fusion | 67.02 | (Kavousi et al., 2011) |
| MarFold | 71.7 | (Yang et al., 2011) |
| Tax-Fold | 71.5 | (Yang and Chen, 2011) |
| Bi-grams | 69.5 | (Sharma et al., 2013) |
| HPFP | 74.21 | (Lin et al., 2013) |
| MKLdiv-dc | 61.1 | 26 PFs |
| MKLdiv-conv | 63.70 | 26 PFs |
| AK-MKL | 61.88 | 26 PFs |
| SimpleMKL | 56.92 | 26 PFs |
| Harmonic mean | 65.80 | 26 PFs |
| Arithmetic mean | 60.57 | 26 PFs |
| Karcher-KF (GeoFold1) | 86.16 | GFK1 (geometric mean) 26 PFs |
| AGH-KF (GeoFold2) | 86.68 | GFK2 (geometric mean) 26 PFs |
| LogE-KF (LogEFold) | 81.72 | LogE (Log-Euclidean mean) 26 PFs |
Fig. 2.

The effect of sequentially incorporating PFs according to the decreasing order of their kernels performance. The results of sequentially adding sequence-based features are further discussed in the Supplemental Material
In Figure 2, we consider the effect of sequentially incorporating sequence-based features according to the decreasing order of their kernel performances. The performance of uniformly weighted linear combinations of base kernels increases slowly by varying degrees until we include the 16 most informative data sources, resulting in a best performance of 73.37%. By contrast, its performance decreases continuously if we continue to incorporate less informative PFs. However, there is a slight rise after adding PSp9, and then the performance decreases again when combining all kernels. This observation suggests that sequence-based PsePSSM features that reflect the effect of sequence order carry almost no complementary information with other PFs extracted from the PSSM profile (PS1, PS2, PS3 and PSp0). Similar trends are apparent for MKLdiv-dc, MKLdiv-conv and KA-MKL. Contrary to the previous methods, the performance of AGH-KF increases gradually even when adding kernels considered to carry non-complementary information by AM. Its success rate is consistently outperforming other uniformly weighted kernel integration methods and almost always increases until the 26th kernel is included, resulting in the best performance of 86.68%.The experimental results on the SCOP PDB-40D benchmark dataset demonstrate that the geometric-based averaging of kernel matrices can effectively improve the accuracy of the state-of-the-art kernel fusion model. According to Table 2, promising test set accuracy is obtained using each individual FunD information-based feature (FunD-cdd and FunD-InterPro). Now, our computational model (GeoFold) has been developed by incorporating these FunD compositions of proteins through the proposed hybridization model (FunGeoFlod), described in Figure 1. It is observed that by using this hybridization model, the protein fold recognition accuracy is improved to 89.30%, which is significant for this problem.
Table 2.
The results of incorporating the FunD composition
| Methods | PERF | Methods | PERF |
|---|---|---|---|
| FunFold-cdd | 69.94 | FunLogFold-cdd | 87.43 |
| FunFold-InterPro | 73.89 | FunLogFold-InterPro | 89.30 |
| FunFold-Combined | 76.50 | FunAmtFold-cdd | 77.2 |
| FunGeoFold-cdd | 87.71 | FunAmtFold-InterPro | 84.07 |
| FuncGeoFold-InterPro | 89.30 |
FunLogEFold (FunAmFold) is referred to the kernel fusion model, which incorporates the FunD information (extracted from CDD or InterPro) and GeoFold kernels through LogE(AM).
Next, to compare the efficiency of the proposed formulations AGH-FK and LogE-KF with other MKL approaches, we consider 201 various convex combinations of two different kernels. For this purpose, we assign different weights to each kernel as follows:
| (5) |
where  . These weights can also be interpreted as their corresponding importance in the fused kernel. In fact, finding such weights is the objective of any MKL approach. As illustrated in Figure 3 and Supplementary Material S2, we observe better success rates on the majority of the interval of kernel weight pairs for the new approaches. These results indicate the limitation of MKL approaches in terms of their sensitive behaviour in dealing with kernel weights. They also demonstrate that the best linear combination of two kernels usually is the one where we assign more weight to the kernel with a higher performance. This is particularly true when the difference between the performances of the two kernels is considerable. Our results show that the evolutionary-based features and either the S or C convey the considerable complementary information with respect to each other. Moreover, the evolutionary information extracted from PSSM profiles through Psp0 and PS2 carries complementary information with respect to other features.
Fig. 3.
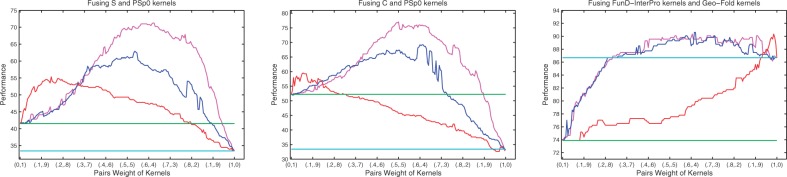
The performance of convex linear combination of two different kernels using 201 different pairs weights of kernels (blue line). The relative performances of fused kernels through weighted LogEM (red line). The relative performances of fused kernels using weighted GM (for more details see the Supplementary Material) (magenta line)
Moreover, we investigate the performance of our approach on the newer SCOP database (version 1.75; Yang and Chen, 2011). As the results on the SCOP PDB-40D benchmark dataset suggest, it is interesting to consider only two PFs including predicted secondary structural information of the protein sequence and information extracted directly from PSSM. For this propose, the PS2 and predicted secondary structure results from NetSurfP (Petersen et al., 2009) are used. Composition, transition and distribution descriptors as described in (Dubchak et al., 1995) are used to construct the feature vector for the representation of S. Table 3 provides the mean percentage accuracy with standard deviation from our proposed kernel data fusion methods using 10-fold cross validation for classification of protein folds in the newDD dataset (Yang and Chen, 2011).
Table 3.
Perfomance of our proposed data fusion approach on newDD dataset
| Methods | Performance | Protein features |
|---|---|---|
| Tax-Fold | 90 | (Yang and Chen, 2011) |
| PS2 |  |
Sequence evolution information |
| S |  |
Predicted secondary structure |
| FunFold-cdd |  |
FunD-cdd |
| FunFold-InterPro |  |
FunD-InterPro |
| GeoFold (AGH-KF) |  |
PS2 and S |
| FunGeogEFold-cdd |  |
PS2,S,FunD-cdd |
| FunGeoFold-InterPro |  |
PS2,S,FunD-InterPro |
| LogEFold (LogE) |  |
PS2 and S |
| FunLogEFold-cdd |  |
PS2,S,FunD-cdd |
| FunLogEFold-InterPro |  |
PS2,S,FunD-InterPro |
It is observed that by incorporating the available functional domain information (nterPro) through our proposed hybridization model, we are almost able to completely crack the protein fold recognition problem for 27-folds. In addition, it is observed that using FunFold-cdd, FunFold-InterPro, LogEFold and GeoFold models, we achieve competitive results compared with the Taxfold webserver (Yang and Chen, 2011).
We also investigate the performance of our GKF approach on the protein remote homology detection problem (Liao and Noble, 2003) by fusing multiple kernels. In the Supplementary Material, we report the competitive results on this problem.
5 CONCLUSION
In this study, we enhance the fold recognition results on the SCOP PDB-40D benchmark dataset through a novel kernel data fusion framework based on the GM of kernel matrices (GFK). We present two methods (Karcher-KF and AGH-KF) for computing the GM, where the second one is a computationally scalable method that computes an approximate GM. The experimental results demonstrate that the GM of kernel matrices can effectively improve the accuracy of the state-of-the-art kernel fusion model. In addition, we obtain similar results using the LogEM, which is a more cost-effective technique for integrating different PFs.
Our meta-predictor is developed by incorporating the available knowledge on functions of protein domains into our kernel data fusion framework, giving a promising total accuracy of 89.30%.
Understanding the relationship between primary and tertiary structure in proteins is one of the main objectives of protein sequence analysis. This relation is still elusive, but our results suggest that combining the evolutionary and secondary structural information could be crucial to elucidate such a latent link. This claim is investigated on the newer SCOP database (version 1.75; Yang and Chen, 2011), where our new methods again have good performance. In addition, by incorporating the available functional domain information using our FunGeoFold model, nearly exact protein fold recognition for 27-folds is achieved.
Furthermore, the limitation of convex linear combinations in dealing with fusion of different PFs that carry complementary information is considered. Our proposed fusion frameworks, by contrast, can be used to detect these features with complementary information, which provides an insightful approach for fusing different features of other problems in bioinformatics.
Funding: Y.M. is a full professor at KU Leuven, Belgium. This research is supported by KUL GOA/10/09 MaNet, KUL PFV/10/016 SymBioSys, KUL IOF 3M120274 Immunosuppressive drugs. IWT TBM Haplotyping. Hercules Stichting: Hercules III PacBio RS. iMinds: SBO 2013. EU COST Action BM1006: NGS Data analysis network. FCT Neuroclinomics. The scientific responsibility is assumed by its authors. This work was partially supported by MIUR grant number 2002014121; by the Research Council KU Leuven, projects OT/11/055 (Spectral Properties of Perturbed Normal Matrices and their Applications), CoE EF/05/006 Optimization in Engineering (OPTEC); by the Fund for Scientific Research–Flanders (Belgium) project G034212N (Reestablishing Smoothness for Matrix Manifold Optimization via Resolution of Singularities); and by the Interuniversity Attraction Poles Programme, initiated by the Belgian State, Science Policy Office, Belgian Network DYSCO (Dynamical Systems, Control and Optimization).
Conflict of Interest: none declared.
Supplementary Material
REFERENCES
- Absil PA, et al. Optimization Algorithms on Matrix Manifolds. Princeton University Press; 2008. [Google Scholar]
- Apweiler R, et al. The interpro database, an integrated documentation resource for protein families, domains and functional sites. Nucleic Acids Res. 2001;29:37–40. doi: 10.1093/nar/29.1.37. [DOI] [PMC free article] [PubMed] [Google Scholar]
- Arsigny V, et al. Geometric means in a novel vector space structure on symmetric positive-definite matrices. SIAM J. Matrix Anal. Appl. 2007;29:328–347. [Google Scholar]
- Bach FR, et al. Proceedings of the 21st International Conference on Machine Learning (ICML) Banff, Canada: Omnipress; 2004. Multiple kernel learning, conic duality, and the SMO algorithm. [Google Scholar]
- Bhatia R. Positive Definite Matrices. Princeton Series in Applied Mathematics. Princeton: Princeton University Press; 2007. [Google Scholar]
- Cai YD, et al. Support vector machines for prediction of protein subcellular location by incorporating quasi-sequence-order effect. J. Cell. Biochem. 2002;84:343–348. doi: 10.1002/jcb.10030. [DOI] [PubMed] [Google Scholar]
- Cai YD, et al. Support vector machines for predicting membrane protein types by using functional domain composition. Biophys. J. 2003;84:3257–3263. doi: 10.1016/S0006-3495(03)70050-2. [DOI] [PMC free article] [PubMed] [Google Scholar]
- Chang CC, Lin CJ. Libsvm: a library for support vector machines. ACM Trans. Intell. Syst. Technol. 2011;2 27.1–27.27. [Google Scholar]
- Chen K, Kurgan L. Pfres: protein fold classification by using evolutionary information and predicted secondary structure. Bioinformatics. 2007;23:2843–2850. doi: 10.1093/bioinformatics/btm475. [DOI] [PubMed] [Google Scholar]
- Chou KC. Prediction of protein cellular attributes using pseudo-amino acid composition. Proteins. 2001;43:246–255. doi: 10.1002/prot.1035. [DOI] [PubMed] [Google Scholar]
- Chou KC, Cai YD. Predicting protein structural class by functional domain composition. Biochem. Biophys. Res. Commun. 2004;321:1007–1009. doi: 10.1016/j.bbrc.2004.07.059. [DOI] [PubMed] [Google Scholar]
- Daemen A, et al. A kernel-based integration of genome-wide data for clinical decision support. Genome Med. 2009;1:39. doi: 10.1186/gm39. [DOI] [PMC free article] [PubMed] [Google Scholar]
- Damoulas T, Girolami MA. Probabilistic multi-class multi-kernel learning: on protein fold recognition and remote homology detection. Bioinformatics. 2008;24:1264–1270. doi: 10.1093/bioinformatics/btn112. [DOI] [PubMed] [Google Scholar]
- De Bie T, et al. Kernel-based data fusion for gene prioritization. Bioinformatics. 2007;23:i125–i132. doi: 10.1093/bioinformatics/btm187. [DOI] [PubMed] [Google Scholar]
- Ding CH, Dubchak I. Multi-class protein fold recognition using support vector machines and neural networks. Bioinformatics. 2001;17:349–358. doi: 10.1093/bioinformatics/17.4.349. [DOI] [PubMed] [Google Scholar]
- Dubchak I, et al. Prediction of protein folding class using global description of amino acid sequence. Proc. Natl Acad. Sci. USA. 1995;92:8700–8704. doi: 10.1073/pnas.92.19.8700. [DOI] [PMC free article] [PubMed] [Google Scholar]
- Dubchak I, et al. Recognition of a protein fold in the context of the scop classification. Proteins. 1999;35:401–407. [PubMed] [Google Scholar]
- Foster D, Phillips G. The arithmetic-harmonic mean. Math. Comput. 1984;42:183–191. [Google Scholar]
- Gönen M, Alpaydin E. Multiple kernel learning algorithms. J. Mach. Learn. Res. 2011;12:2211–2268. [Google Scholar]
- Hunter S, et al. Interpro in 2011: new developments in the family and domain prediction database. Nucleic Acids Res. 2012;40:D306–D312. doi: 10.1093/nar/gkr948. [DOI] [PMC free article] [PubMed] [Google Scholar]
- Jeuris B, et al. A survey and comparison of contemporary algorithms for computing the matrix geometric mean. Electron. Trans. Numer. Anal. 2012;39:379–402. [Google Scholar]
- Kaur H, Raghava G. A neural-network based method for prediction of gamma-turns in proteins from multiple sequence alignment. Protein Sci. 2003;12:923–929. doi: 10.1110/ps.0241703. [DOI] [PMC free article] [PubMed] [Google Scholar]
- Kavousi K, et al. A protein fold classifier formed by fusing different modes of pseudo amino acid composition via {PSSM} Comput. Biol. Chem. 2011;35:1–9. doi: 10.1016/j.compbiolchem.2010.12.001. [DOI] [PubMed] [Google Scholar]
- Lanckriet GRG, et al. Learning the kernel matrix with semi-definite programming. J. Mach. Learn. Res. 2004a;5:27–72. [Google Scholar]
- Lanckriet GRG, et al. A statistical framework for genomic data fusion. Bioinformatics. 2004b;20:2626–2635. doi: 10.1093/bioinformatics/bth294. [DOI] [PubMed] [Google Scholar]
- Liao L, Noble WS. Combining pairwise sequence similarity and support vector machines for detecting remote protein evolutionary and structural relationships. J. Comput. Biol. 2003;10:857–868. doi: 10.1089/106652703322756113. [DOI] [PubMed] [Google Scholar]
- Lin C, et al. Hierarchical classification of protein folds using a novel ensemble classifier. PLoS One. 2013;8:e56499. doi: 10.1371/journal.pone.0056499. [DOI] [PMC free article] [PubMed] [Google Scholar]
- Marchler-Bauer A, et al. CDD: a conserved domain database for interactive domain family analysis. Nucleic Acids Res. 2007;35(Suppl. 1):D237–D240. doi: 10.1093/nar/gkl951. [DOI] [PMC free article] [PubMed] [Google Scholar]
- Marchler-Bauer A, et al. Cdd: conserved domains and protein three-dimensional structure. Nucleic Acids Res. 2013;41:D348–D352. doi: 10.1093/nar/gks1243. [DOI] [PMC free article] [PubMed] [Google Scholar]
- Murzin AG, et al. Scop: a structural classification of proteins database for the investigation of sequences and structures. J. Mol. Biol. 1995;247:536–540. doi: 10.1006/jmbi.1995.0159. [DOI] [PubMed] [Google Scholar]
- Nanni L. A novel ensemble of classifiers for protein fold recognition. Neurocomputing. 2006;69:2434–2437. [Google Scholar]
- Petersen B, et al. A generic method for assignment of reliability scores applied to solvent accessibility predictions. BMC Struct. Biol. 2009;9:51. doi: 10.1186/1472-6807-9-51. [DOI] [PMC free article] [PubMed] [Google Scholar]
- Qiu S, Lane T. A framework for multiple kernel support vector regression and its applications to sirna efficacy prediction. IEEE/ACM Trans. Comput. Biol. Bioinform. 2009;6:190–199. doi: 10.1109/TCBB.2008.139. [DOI] [PMC free article] [PubMed] [Google Scholar]
- Rakotomamonjy A, et al. 2008 Simplemkl. 9, 2491–2521. [Google Scholar]
- Rangwala H, Karypis G. Profile-based direct kernels for remote homology detection and fold recognition. Bioinformatics. 2005;21:4239–4247. doi: 10.1093/bioinformatics/bti687. [DOI] [PubMed] [Google Scholar]
- Rashid M, et al. Support vector machine-based method for predicting subcellular localization of mycobacterial proteins using evolutionary information and motifs. BMC Bioinformatics. 2007;8:337. doi: 10.1186/1471-2105-8-337. [DOI] [PMC free article] [PubMed] [Google Scholar]
- Schaffer AA, et al. Improving the accuracy of psi-blast protein database searches with composition-based statistics and other refinements. Nucleic Acids Res. 2001;29:2994–3005. doi: 10.1093/nar/29.14.2994. [DOI] [PMC free article] [PubMed] [Google Scholar]
- Sharma A, et al. A feature extraction technique using bi-gram probabilities of position specific scoring matrix for protein fold recognition. J. Theor. Biol. 2013;320:41–46. doi: 10.1016/j.jtbi.2012.12.008. [DOI] [PubMed] [Google Scholar]
- Shen HB, Chou KC. Ensemble classifier for protein fold pattern recognition. Bioinformatics. 2006;22:1717–1722. doi: 10.1093/bioinformatics/btl170. [DOI] [PubMed] [Google Scholar]
- Shen HB, Chou KC. Nuc-ploc: a new web-server for predicting protein subnuclear localization by fusing pseaa composition and psepssm. Protein Eng. Des. Sel. 2007;20:561–567. doi: 10.1093/protein/gzm057. [DOI] [PubMed] [Google Scholar]
- Shen HB, Chou KC. Predicting protein fold pattern with functional domain and sequential evolution information. J. Theor. Biol. 2009;256:441–446. doi: 10.1016/j.jtbi.2008.10.007. [DOI] [PubMed] [Google Scholar]
- Sonnenburg S, et al. Large scale multiple kernel learning. J. Mach. Learn. Res. 2006;7:1531–1565. [Google Scholar]
- Vishwanathan SVN, et al. Advances in Neural Information Processing Systems. Vancouver, Canada: 2010. Multiple kernel learning and the SMO algorithm. [Google Scholar]
- Wainer H. Estimating coefficients in linear models: it don’t make no nevermind. Psychol. Bull. 1976;83:213–217. [Google Scholar]
- Xie D, et al. Locsvmpsi: a web server for subcellular localization of eukaryotic proteins using svm and profile of psi-blast. Nucleic Acids Res. 2005;33(Suppl. 2):W105–W110. doi: 10.1093/nar/gki359. [DOI] [PMC free article] [PubMed] [Google Scholar]
- Yang JY, Chen X. Improving taxonomy-based protein fold recognition by using global and local features. Proteins. 2011;79:2053–2064. doi: 10.1002/prot.23025. [DOI] [PubMed] [Google Scholar]
- Yang T, et al. Margin-based ensemble classifier for protein fold recognition. Expert Syst. Appl. 2011;38:12348–12355. [Google Scholar]
- Ying Y, et al. Enhanced protein fold recognition through a novel data integration approach. BMC Bioinformatics. 2009;10:267. doi: 10.1186/1471-2105-10-267. [DOI] [PMC free article] [PubMed] [Google Scholar]
- Yu S, et al. Kernel-based Data Fusion for Machine Learning - Methods and Applications in Bioinformatics and Text Mining. 2011. vol. 345 of Studies in Computational Intelligence, Springer, Heidelberg. [Google Scholar]
- Zakeri P, et al. Prediction of protein submitochondria locations based on data fusion of various features of sequences. J. Theor. Biol. 2011;269:208–216. doi: 10.1016/j.jtbi.2010.10.026. [DOI] [PubMed] [Google Scholar]
- Zien A, Ong CS. Proceedings of the 24th international conference on Machine learning. 2007. Multiclass multiple kernel learning. ICML’07. New York, NY: ACM, pp. 1191–1198. [Google Scholar]
Associated Data
This section collects any data citations, data availability statements, or supplementary materials included in this article.