Abstract
Background/Aim
We compared pulmonary irradiation-induced whole lung, gene transcripts, over 200 days after 20 Gy thoracic irradiation in fibrosis-prone C57BL/6NHsd with fibrosis-resistant C3H/HeNHsd female mice.
Materials and Methods
Lung specimens were analyzed by rt-PCR and changes over time in representative gene transcript levels were correlated with protein levels using Western Blot.
Results
C3H/HeNHsd mice showed a significantly longer duration of elevation of gene transcripts for stress-response genes (NFkβ, Nrf2, Sp1, Ap1), radioprotection gene (SOD2), and endothelial cell associated genes (vWF, VEGFa). C57BL/6NHsd mice showed acute elevation then downregulation and a second elevation in gene transcripts for NFkβ, CTGF, IGFbp7, TNFα, collagen1a, and TLR4. There were reciprocal patterns of elevation and decrease in levels of transcripts for epigenetic reader proteins Brd1, 2, 3, and 4 between mouse strains.
Conclusions
Regulatory pathways linked to radiation pulmonary fibrosis may identify new targets for anti-fibrotic radiation mitigators.
Keywords: Radiation Fibrosis, Genetic, Epigenetic, Bone Marrow
Introduction
A major dose limiting complication of thoracic radiotherapy is lung damage (1–15). Acute radiation pneumonitis is characterized by endothelial cell swelling, alveolar transudates, and local pulmonary as well as circulatory elevation of inflammatory cytokines, prominently IL-1, IL-6, IL-10, TGFβ, and TNFα (4, 7–10, 16). Treatment with non-steroidal, or steroid anti-inflammatory agents may ameliorate symptoms of radiation pneumonitis, which is dependent upon volume of lung irradiated, fraction size, and total dose (1, 2). Not all patients, who suffer radiation pneumonitis, go on to develop late pulmonary fibrosis suggesting distinct differences in the pathophysiology of the two lesions (4, 12, 15, 17).
A valuable model system in which to dissect the mechanisms of late pulmonary fibrosis is the fibrosis prone C57BL/6NHsd mouse compared to the pneumonitis-prone, but fibrosis-resistant C3H/HeNHsd mouse (17, 18–21). C3H/HeNHsd mice are intrinsically radiosensitive to total body irradiation (TBI), and display radiation dose-dependent life shortening (18–22) and radiation pneumonitis. In contrast, C57BL/6NHsd mice are relatively radioresistant to TBI, demonstrate a brief interval of acute radiation pneumonitis followed by a period during which pulmonary histopathology is indistinguishable from unirradiated mice, then develop distinct organizing alveolitis (fibrosis) (18) involving proliferation of both intrinsic lung fibroblasts and bone marrow origin fibroblast progenitors, which migrate to sites of fibrosis (15, 18, 23–24).
Recent studies with C57BL/6NHsd mice (24–25) demonstrated an initial increase in expression of genes for promoter binding proteins, stress response, and inflammatory cytokine genes, which returned to normal levels during a subsequent latent period, followed by elevation of many of the same gene transcripts and proteins, at the time of first detection of histopathologic fibrosis (24). Transcripts for endothelial cell related genes including vWF and VEGF remained elevated in C57BL/6NHsd irradiated lungs indicating a persistent irradiation damage response (24–25). The genetic and molecular biologic determinants that initiate pulmonary fibrosis in C57BL/6NHsd, but not C3H/HeNHsd mice are not known.
In the present studies, we quantitated post-thoracic irradiation levels of 25 representative gene transcripts in the irradiated lungs of C57BL/6NHsd compared to C3H/HeNHsd mice. These transcripts were organized into six groups based on either their published involvement in radiobiologic responses of cells and tissues to ionizing irradiation or data showing their association with lung fibrosis that was attributable to other causes. The first group consisted of representative inflammatory response genes for proteins known to be acutely elevated after thoracic irradiation of C57BL/6J/NHsd mice including: NFkβ, NRF2, SP1, and AP-1. A second group of gene transcripts was chosen based on endothelial cells, which have been implicated in early irradiation responses in several organs including the intestine and included vWF, VEGF, CTGF, and IL-6 (26). A third group of transcripts included those for gene products known to be associated with initiation of fibrosis or found elevated in fibrotic areas of the lungs of patients with lung transplant rejection or those having lung resection for scleroderma lung including MnSOD (SOD2), IL-1, TNF-α, Lysl Ox, IGFbp7, and TGF-β (27–28). As a fourth indicator of the fibrosis response, we measured levels of RNA transcripts for collagen1a, known to be a dominant part of the fibrotic lung in C57BL/6NHsd mice (24–25). A fifth group included Toll-like receptors (TLR) 1–7 known to be upregulated during the inflammatory response (29–30). An initial inflammatory response has been reported to occur in lungs of both fibrosis prone and fibrosis resistant mice (24, 31). Finally, a sixth group of transcripts, included bromodomain epigenetic reader protein Brd1-4 transcripts (32–33).
The results demonstrate similar initial increases in the gene transcripts during the lung irradiation response in both strains, but prominent increases in levels of NFkβ, FGF-1, CTGF, IL-6, TGFβ, IGFbp7, collagen1a, TLR4, Brd1, Brd3, and Brd4 were observed in C57BL/6NHsd mouse lung during the initiation of late fibrosis.
Materials and Methods
Mouse Thoracic Radiation
C57BL/6NHsd and C3H/HeNHsd mice were obtained from Harlan Laboratories (Indianapolis, IN) and housed 5 per cage according to Institutional IACUC protocols. Mice were irradiated to the thoracic cavity with shielding of the head and neck, abdomen, and lower body according to published methods (34). C57BL/6NHsd female mice received 20Gy and groups of C3H/HeNHsd female mice received 14, 16.5, or 20Gy irradiation to the thoracic field and were then maintained according to IACUC directed laboratory conditions. Mice were sacrificed at serial time points after thoracic irradiation including pre-irradiation, days 2, 7, 14, 28, 60, 100, 125, 150 and 200 post-irradiation. A log rank test was used to statistically analyze the in vivo irradiation survival curves.
Measurement of levels of gene transcripts for irradiation inducible transcription factors, growth factors, inflammatory cytokines, adhesion molecules, and radiation-protective enzymes by RT-PCR
RNA was extracted from mouse lung using the TRIzol reagent (Invitrogen, Carlsbad, CA) following the manufacturer’s instructions, quantified using a spectrophotometer, and stored at −80 °C (34). Reverse transcription of 2 μg of total RNA to complementary DNA (cDNA) was accomplished using the High Capacity cDNA Reverse Transcription Kit (Applied Biosystems, Foster City, CA) according to the manufacturer’s protocol.
In subsequent steps, expression of specific RNA moieties included: GPDH (Gen-Bank:NM_008084.2), GUSB (Gen-Bank: NM_010368.1), NFkβ (Gen-Bank: NM_199267.2), TNF-α (Gen-Bank: NM_013693.2), Nrf2 (Gen-bank: NM_010902.3)(21), NFkβ (Gen-Bank: NM_008689.2), JUN (Gen-Bank: NM_010591.2), SP-1 (Gen-Bank: NM_013672.2), AP1 (Gen-Bank: NM_001243043.1), Lysl Ox (Gen-Bank: NM_001178102.1), TGFβ1 (Gen-Bank: NM_011577.1), VEGFa (Gen-Bank: NM_001025250.3), IL-1a (Gen-Bank: NM_010554.4), FGF1 (Gen-Bank: NM_010197.3), IFNγ (Gen-Bank: NM_008337.3), IL-6 (Gen-Bank: NM_031168.1), FAP (Gen-Bank: NM_007986.2), vWF (Gen-Bank: NM_011708.3), CTGF (Gen-Bank: NM_010217.2), MnSOD (Gen-Bank: NM_013671.3), IGFbp7 (Gen-Bank: NM_001159518.1) and epigenetic reader proteins BRD1 (Gen-Bank: AK149714.1), BRD2 (Gen-Bank: AB010246.1), BRD3 (Gen-Bank: AB206708.2), and BRD4 (Gen-Bank: AF273217.1). Collagen 1a (Gen-Bank: AK132180.1). Each was quantitated by real-time polymerase chain reaction (RT-PCR). Ninety-six-well plates were prepared with 10 μl of Taqman Gene Expression Master mix, 5 μl of RNase-free water, 1 μl of the corresponding Taqman Gene Expression probe, and 4 μl of cDNA (totaling 2 μg cDNA) using the Eppendorf epMotion 5070 automated pipetting system (Eppendorf, Westbury, NY). The cDNA was amplified with 40 cycles of 95 °C (denaturation) for 15 s and 60 °C (annealing and elongation) for 1 min using the Eppendorf Realplex2 Mastercycler (17, 35).
Data for each gene transcript were normalized by calculating the differences (ΔCt) from the Ct-GUSB and Ct-Target genes. The relative increase or decrease in expression was calculated by comparing the reference gene with the target gene (ΔΔCt) and using the formula for relative expression (=2ΔΔCt). Subsequently, (ΔΔCt) levels were compared and P values were calculated using one-way ANOVA followed by Tukey’s multiple comparison tests. The results were presented as percent increase in RNA above baseline levels which were adjusted to that of un-irradiated C57BL/6NHsd and C3H/HeNHsd mice (34). Baseline transcript levels were standardized to GPDH.
Western Analysis for protein expression in irradiated mouse lungs
To determine levels of representative proteins MnSOD, NFkβ, Brd4, and Collagen-1 in C3H/HeNHsd lung tissue post 20 Gy thoracic irradiation, lung tissue was taken at acute (day2), latent (day 60), and late (day150) and lysed in NP-400 buffer [50 mM Tris, pH 7.8, 10 mM ethylenediaminetetaacetic acid (EDTA), 150 mM NaC1, 1 mM phenylmethylsulfonyl fluoride (PMSF), 1% NP-40, and a protease inhibitor cocktail tablet (Roche Diagnostics, Indianapolis, IN, USA)]. Protein samples were separated in 15% polyacrylamide gels by electrophoresis and transferred to nitrocellulose membranes. Primary anti-MnSOD antibody (Novus Biologicals, Littleton, CO, USA) or α-tubulin (Sigma Aldrich, St. Louis, MO, USA) antibody were used. Horseradish peroxidase anti-rabbit or anti-mouse secondary antibody (Promega, Pittsburgh, PA, USA) was then applied and membranes developed with Super Signal West Dura ECL (Thermo Scientific, Rockford, IL, USA). Antibodies were obtained from Santa Cruz Biochemical Laboratories, Santa Cruz, California. Antibodies used were anti-SOD2 (ab13533), anti-NFkβ p65(ab16502), anti-collagen 1 (ab34710), and anti-BRD4 [EPR5150(2)] (ab128874) from Abcam, Cambridge, MA, USA. For quantitation of levels of proteins, band densities were quantified with Image J (National Institutes of Health, www.rsbweb.nih.gov/ij) as published (34).
In vivo imaging of coat changes post thoracic irradiation
Groups of C3H/HeNHsd and C57BL/6NHsd mice were irradiated to 20 Gy thoracic irradiation. At 47 days post irradiation, when C57BL/6NHsd mice typically show graying of fur in irradiated fields (24), two isoflurane anesthetized mice from each strain, were imaged using a Xenogen IVIS 200 Imaging System.
Serial imaging of luc+ bone marrow stromal cells
C3H/HeNHsd mice were injected intraperitoneally (I.P.) at each of several time points after 20 Gy thoracic irradiation with 1 × 10⁶ luc+ bone marrow stromal cells from a C3H/HeNHsd luc+ stromal cell line. Following injection with D-luciferin (Gold Biotechnology, St. Louis, MO), mice were imaged at serial timepoints using a Xenogen IVIS 200 Imaging System and the bioluminescent signal for each mouse was quantitated. As controls for pulmonary migration of luc+ bone marrow stromal cells in C3H/HeNHsd mice, C57BL/6NHsd mice received 20 Gy thoracic irradiation and were injected I.P. with 1 × 10⁶ C57BL/6NHsd luc+ bone marrow stromal cells from a C57BL/6 luc+ stromal cell line (24). Mice were imaged and the bioluminescent signal for each mouse was quantitated. Late phase bioluminescence in C3H/HeNHsd mice was compared to late phase bioluminescence C57BL/6NHsd mice using a Student T test (24).
Pulmonary Histopathology
Lungs from irradiated and control unirradiated C3H/HeNHsd and C57BL/6NHsd mice were removed, embedded in OCT and frozen. Frozen sections were stained with H & E, Masson’s trichrome (for collagen), and anti-CD45 (leukocyte common antigen) (28). For CD45 immunostaining, sections were incubated with a monoclonal rat anti-mouse CD45 primary antibody (BD Pharmingen, San Jose, CA), followed by a goat anti-rat Alexa Fluor 555 secondary antibody (Invitrogen, Grand Island, NY).
Measurement of CpG Promoter Methylation
DNA was directly extracted from lung samples according to manufacturer’s instructions using the DNeasy Blood & Tissue Kit (Qiagen, Hilden, Germany). Percent CpG promoter methylation was then measured using the EpiTect Methyl II PCR Assay (Qiagen, Hilden, Germany). Briefly, 250 ng of isolated DNA was incubated in 26 μL of 5 × restriction digestion buffer and methylation sensitive/dependent/null enzymes overnight at 37°C, and then heat inactivated for 20 minutes at 65°C. Ninety-six-well plates were prepared with 12.5 μl of SYBR Green qPCR Master mix, 6.5 μl of RNase-free water, 1 μl of the corresponding EpiTect PCR Primer, and 5 μl of DNA digest. The DNA was then amplified with 40 cycles of 97°C (denaturation) for 15 s and 72°C (annealing and elongation) for 1 min using the Eppendorf Realplex2 Mastercycler (Eppendorf, Westbury, NY). The fraction of methylated DNA for each gene promoter was calculated by normalizing the DNA amount to the amount of digestible DNA. The amount of digestible DNA was equal to the total amount of DNA (determined from the mock digest) minus the amount of DNA resistant to DNA digestion (determined from the double digest).
Statistics
Survival of thoracic irradiated C3H/HeNHsd and C57BL/6NHsd mice was compared pairwise with the two-sided log-rank test.
For the comparison of gene transcript expression between the two mouse strains, data are summarized as mean ± standard deviation in each group. For lungs from each mouse strain, each of the 25 genes was compared with day 0 for each day after irradiation. We also compared the two mouse strains for each gene transcript level at each day.
For the analysis of mouse lung protein levels by western blot data, data were summarized as mean ± standard deviation for the densitometry of each protein for each group. For each mouse strain and each of 4 representative proteins, values on each day were compared to day 0 values, which were set to the level of 1, using the two-sided one-sample t-test. We also compared mouse strains for each gene product protein at each day, using the two-sided two-sample t-test. In all the above tests, p-values less than 0.05 were regarded as significant. As these were exploratory studies, p-values were not adjusted for multiple comparisons.
Results
C3H/HeNHsd mice are relatively sensitive to 20 Gy thoracic irradiation compared to C57BL/6NHsd mice
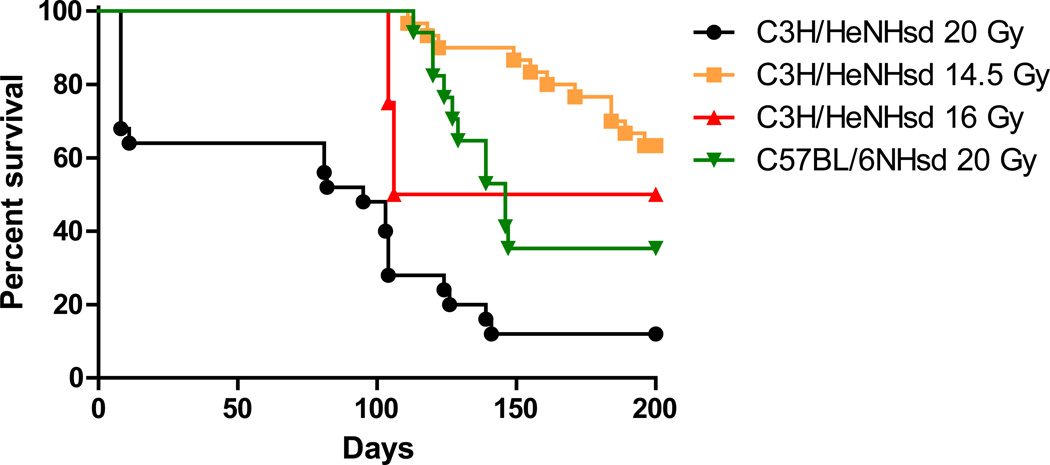
After 20Gy thoracic irradiation C57BL/6NHsd mice all survived to 125 days. In contrast, 20% of C3H/HeNHsd mice irradiated to 20Gy died within 7 days from acute pneumonitis (p = 0.0013) (Fig. 1). Following lower doses of 14.5 Gy or 16 Gy thoracic irradiation, all C3H/HeNHsd mice survived to 100 days (Fig 1).
Figure 1. In vivo survival of thoracic irradiated C3H/HeNHsd and C57BL/6NHsd mice.
In vivo survival curves were generated following thoracic irradiation of groups of mice. C3H/HeNHsd 14.5GY( ); C3H/HeNHsd 16 GY(
 ); C3H/HeNHsd 20 Gy (
 ); C57BL/6NHsd 20GY (
 ). (n = 20 per group)
Distinct gene expression patterns in irradiated C3H/HeNHsd compared to C57BL/6NHsd mouse lung
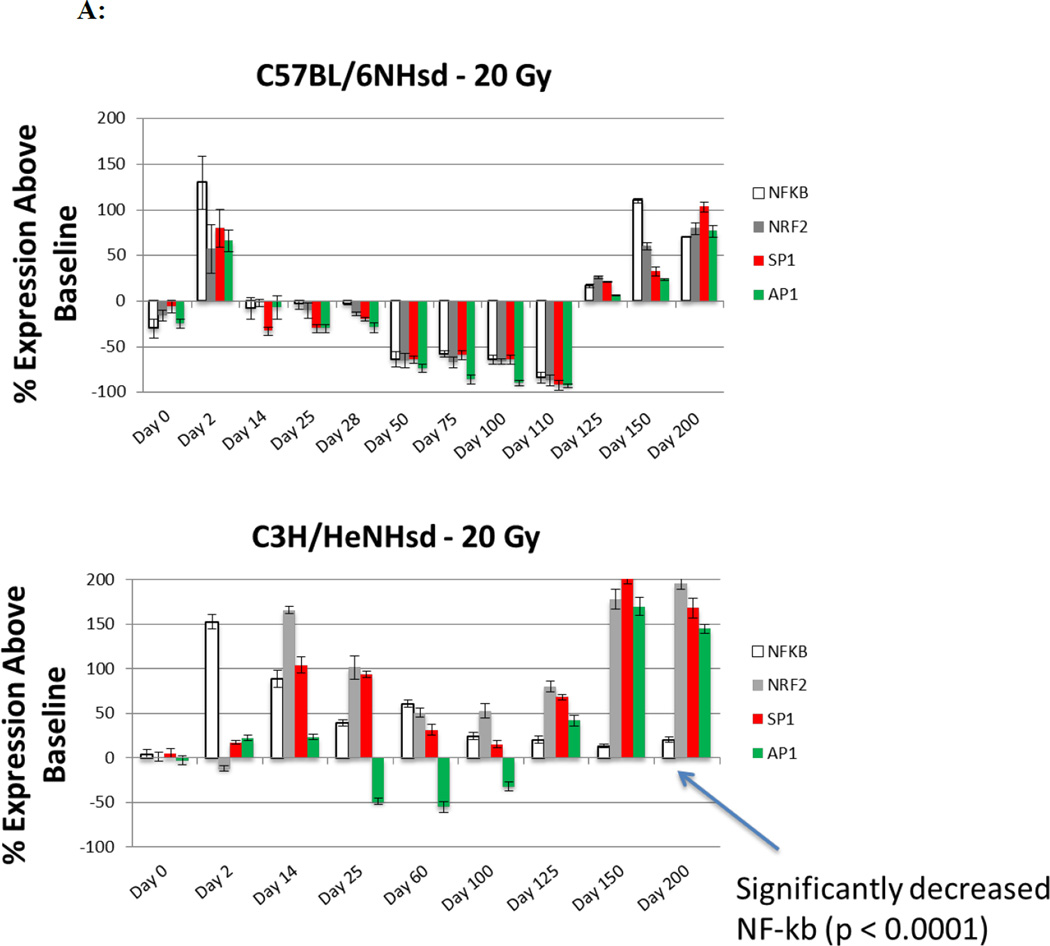
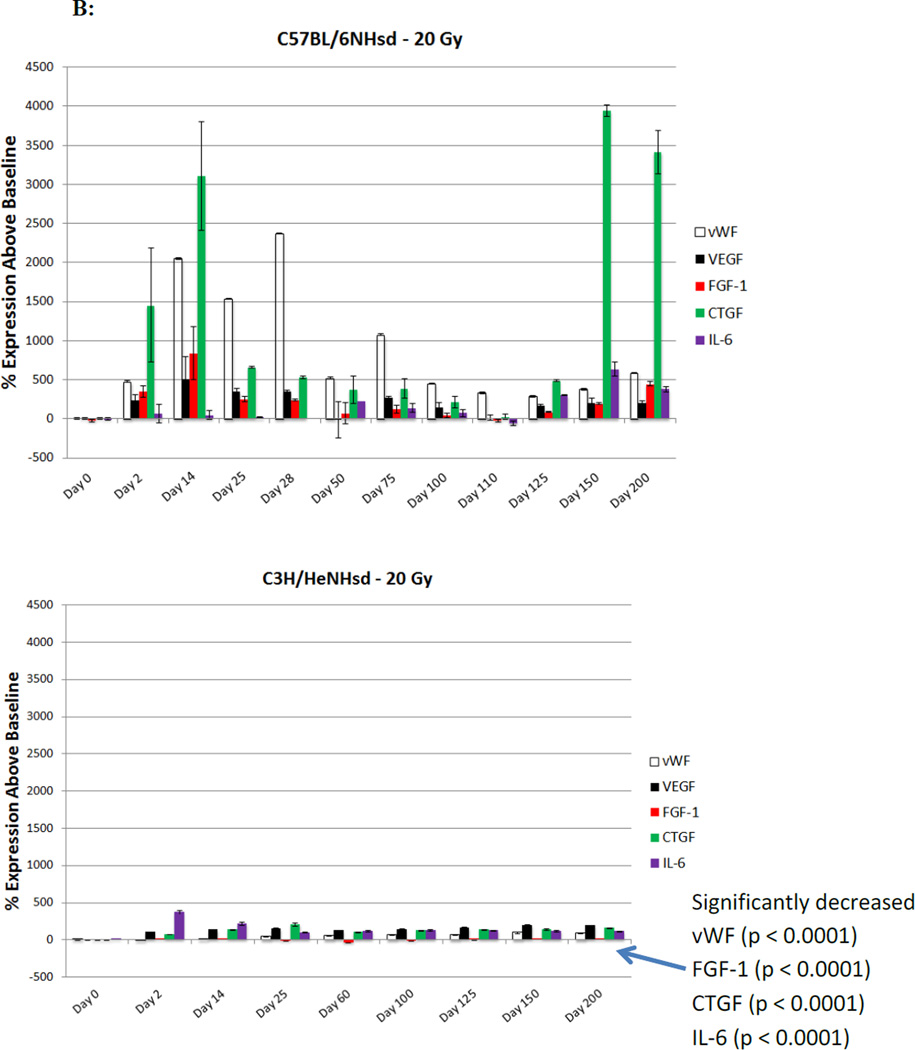
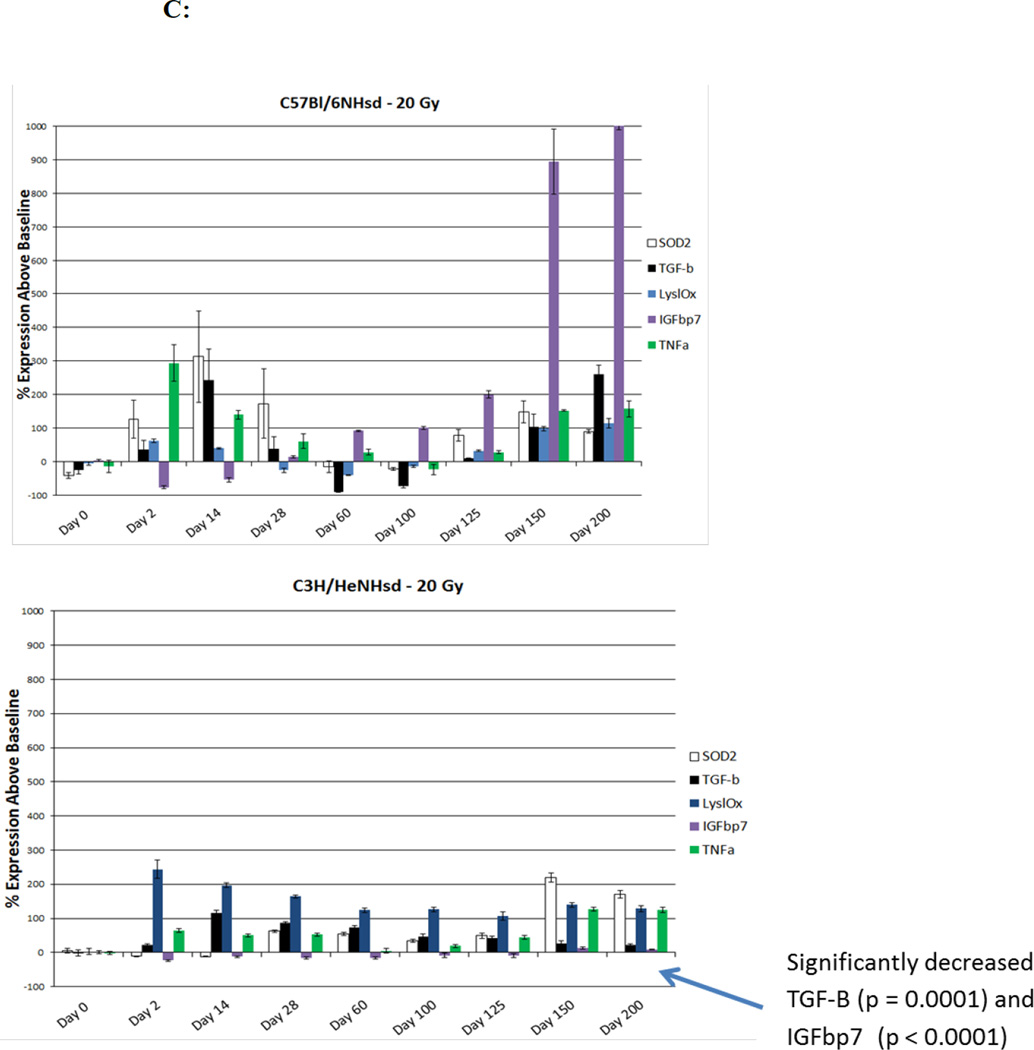
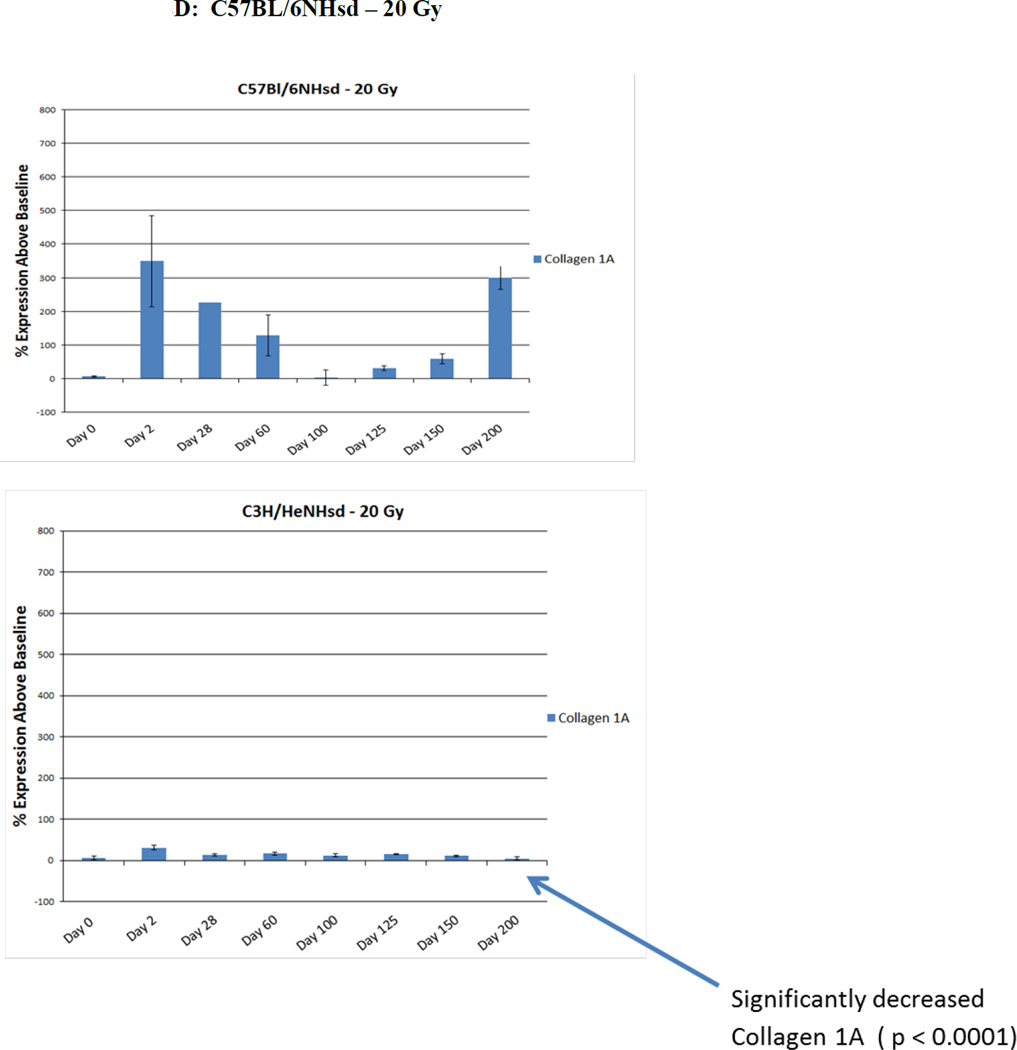
Levels of baseline expression of each of 25 gene transcripts were first standardized using glucose phosphate dehydrogenase (GPDH) as a control (Table 1). For 13 transcript levels, there was no significant difference between mouse strains. The levels of transcripts for 9 genes: vWF, VEGFa, TGFβ, TNFα, COL1a, TLR1, TLR4, Brd2, and Brd3 were higher in C57BL/6NHsd mouse lungs and levels of 3 other gene transcripts: CTGF, Lysl Ox, and TLR7 were higher in C3H/HeNHsd mouse lungs. After 14.5 Gy or 16 Gy thoracic irradiation to C3H/HeNHsd mice, transcript responses were similar to the 20 Gy irradiation group, and there was no detectable late histopathologic evidence of pulmonary fibrosis in any of these groups of irradiated mice (data not shown). Despite early death of some 20 Gy thoracic irradiated C3H/HeNHsd mice, we compared lung tissue responses to the known fibrosis inducing dose of 20 Gy thoracic irradiation in C57BL/6NHsd mice. Analysis of 25 representative pulmonary gene transcripts in C3H/HeNHsd mice following 20 Gy thoracic irradiation revealed an overall similar pattern to 20 Gy thoracic irradiated C57BL/6NHsd mice, but these were also distinct differences. In irradiated C57BL/6NHsd mouse lung, there was an acute increase, a second interval decrease, and a clearly distinct late increase in expression of gene transcripts for NFkβ, Nrf2, SOD2, TGF-β, SP1, AP1, TNFα, IL-6, CTGF, and collagen1a (Fig. 2A, C, D). There was a persistent increase in expression throughout 200 days after irradiation of vWF, and VEGFa in C57BL/6NHsd mouse lungs (Fig. 2B). While fibrosis resistant C3H/HeNHsd mice also demonstrated thoracic-irradiation-induced acute pulmonary increase in transcripts for NFkβ, Nrf2, Ap1, and Sp1, there was no comparable early increase in SOD2 or collagen1a (Fig. 2C, D), and there were significantly lower levels of endothelial cell associated gene transcripts (Fig. 2B). Therefore, while pulmonary fibrosis resistant C3H/HeNHsd mice demonstrated some gene transcript elevations in common with similarly 20 Gy thoracic irradiated C57BL/6NHsd mice; the time course of elevation of several transcripts including SOD2, TGF-β, collagen 1a, vWF, and VEGF differed. C3H/HeNHsd mice irradiated to lower doses of 14.5 Gy or 10 Gy showed the same temporal pattern of gene expression as did the 20 Gy irradiated mice (data not shown).
Table I.
Comparison of baseline levels of gene transcripts between C57BL/6NHsd and C3H/HeNHsd whole lungs.
| Mouse Strain | NFKB | Nrf2 | SP1 | AP1 | vWF |
|---|---|---|---|---|---|
| C57BL/6NHsd | 38.55±1.27 (n=4) |
25.60±0.63 (n=4) |
9.93±0.87 (n=4) |
15.70±0.88 (n=4) |
39.53±1.06 (n=4) |
| C3H/HeNHsd | 39.80±2.01 (n=4) |
24.68±1.29 (n=4) |
11.63±1.31 (n=4) |
17.93±1.78 (n=4) |
36.85±1.61 (n=4) |
| p | 0.3337 | 0.2451 | 0.0738 | 0.0661 | 0.0320 |
| Mouse Strain | VEGFa | FGF1 | CTGF | IL6 | SOD2 |
| C57BL/6NHsd | 17.30±0.84 (n=4) |
20.67±1.23 (n=4) |
11.35±0.88 (n=4) |
20.13±0.99 (n=4) |
38.78±1.12 (n=4) |
| C3H/HeNHsd | 15.48±1.04 (n=4) |
19.33±0.69 (n=4) |
14.33±1.22 (n=4) |
21.20±1.68 (n=4) |
35.95±2.03 (n=4) |
| p | 0.0342 | 0.1038 | 0.0076 | 0.3129 | 0.0511 |
| Mouse Strain | TGFb | Lysl Ox | IGFbp7 | TNFa | Col1a |
| C57BL/6NHsd | 21.20±0.95 (n=4) |
26.05±0.79 (n=4) |
11.38±0.59 (n=4) |
23.23±0.67 (n=4) |
16.28±0.73 (n=4) |
| C3H/HeNHsd | 19.03±0.92 (n=4) |
27.28±0.61 (n=4) |
12.33±0.66 (n=4) |
21.05±0.85 (n=4) |
14.93±0.51 (n=4) |
| p | 0.0166 | 0.0486 | 0.0747 | 0.0071 | 0.0226 |
| Mouse Strain | TLR1 | TLR2 | TLR4 | TLR5 | TLR6 |
| C57BL/6NHsd | 15.35±0.48 (n=4) |
20.60±0.74 (n=4) |
23.10±0.79 (n=4) |
11.45±1.05 (n=4) |
15.00±0.55 (n=4) |
| C3H/HeNHsd | 13.53±1.24 (n=4) |
20.53±1.30 (n=4) |
20.63±1.58 (n=4) |
10.18±0.77 (n=4) |
15.93±0.62 (n=4) |
| p | 0.0337 | 0.9237 | 0.0307 | 0.0977 | 0.0664 |
| Mouse Strain | TLR7 | BRD1 | BRD2 | BRD3 | BRD4 |
| C57BL/6NHsd | 19.15±0.62 (n=4) |
11.45±0.88 (n=4) |
15.48±1.02 (n=4) |
9.30±0.74 (n=4) |
10.45±0.52 (n=4) |
| C3H/HeNHsd | 21.48±1.11 (n=4) |
10.30±0.76 (n=4) |
13.35±0.67 (n=4) |
6.30±1.01 (n=4) |
9.80±0.50 (n=4) |
| p | 0.0108 | 0.0957 | 0.0132 | 0.0030 | 0.1205 |
Transcript levels were standardized to glycerol phosphate dehydrogenase (GPDH) levels, which were the same in the lungs of both strains. Data is summarized as mean ± standard deviation for each group. For each of the 25 gene transcript levels, C57BL/6NHsd and C3H/HeNHsd were compared with the two-sided two-sample t-test. P-values less than 0.05 were significant. As this was an exploratory study, p-values were not adjusted for multiple comparisons.
Significant differences are shown in red.
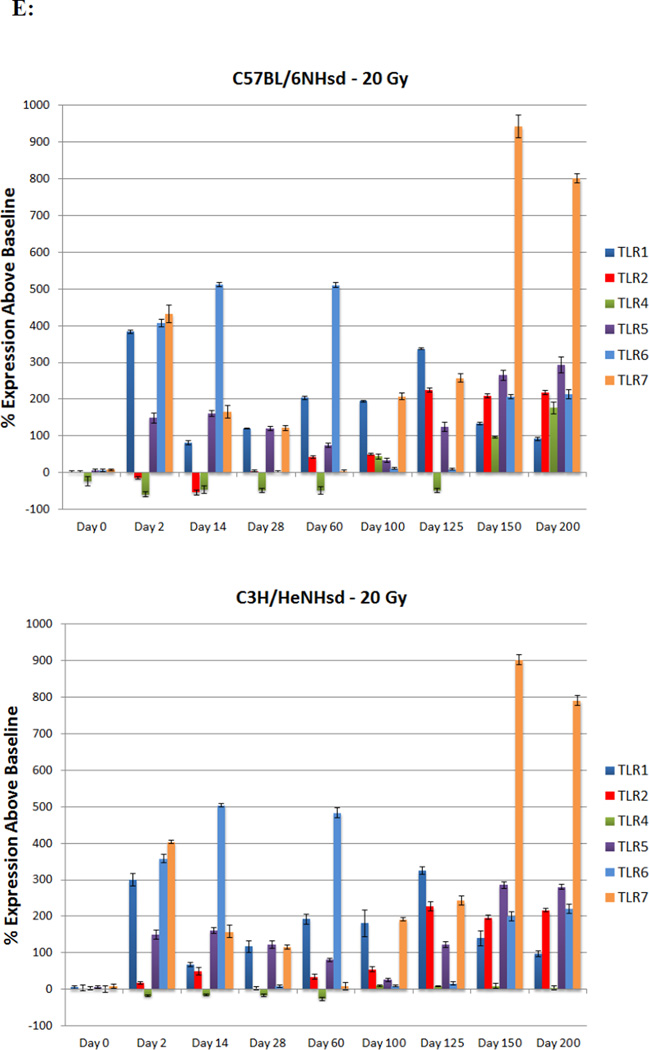
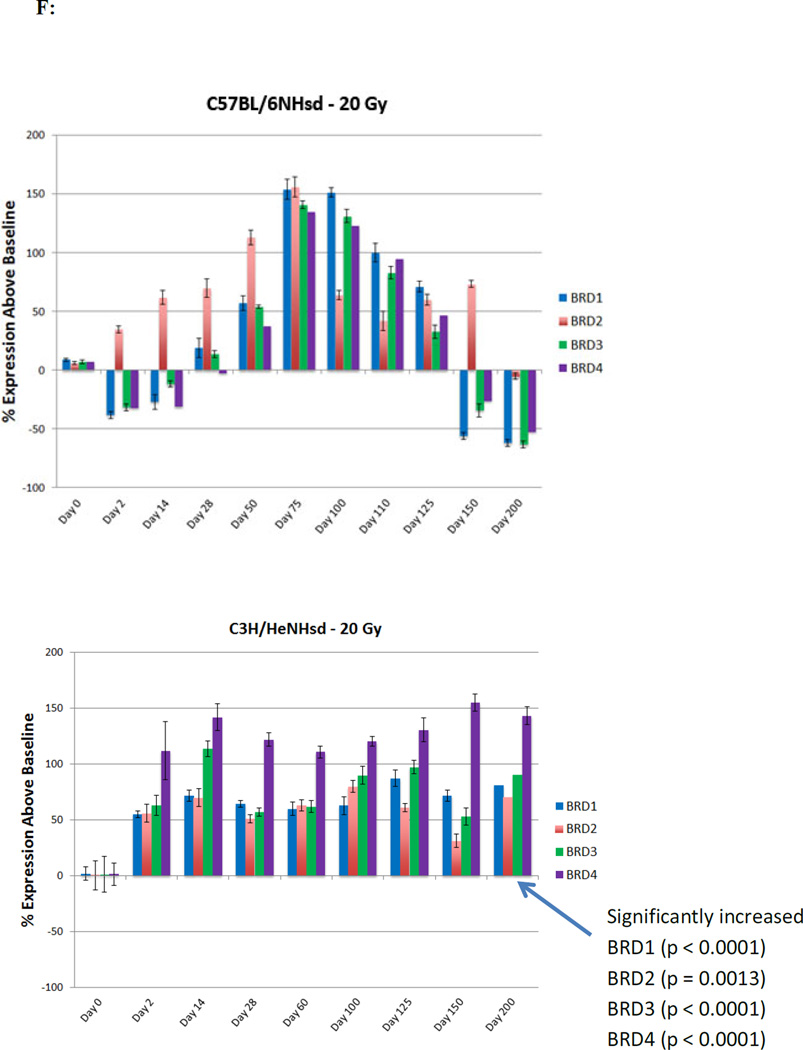
Figure 2. Distinct patterns of irradiation induction of mRNA transcripts for acute phase, latent phase, and late fibrotic period transcript genes in lungs of C3H/HeNHsd compared to C57BL/6NHsd mice.
C57BL/6NHsd and C3HF/HeNHsd mice were irradiated to 20 Gy to the thoracic cavity. The mice were sacrificed at serial time points after irradiation, lungs removed, immediately frozen on dry ice, mRNA extracted, and real time RT-PCR was performed using primers specific for promoters associated with each of multiple genes. Baseline levels of each gene transcript relative to control GDPH RNA are shown in Table 1. Each panel shows relative levels over 200 days after thoracic irradiation standardized to the baseline level for that mouse strain as shown in Table 1. (A) pulmonary early response genes, NFkβ ( ), NRF2 (
 ), SP-1 (
 ), AP-1 (
 ); (B) endothelial cell markers, vWF (
 ), VEGF (
 ), FGF1 (
 ),CTGF (
 ), IL-6 (
 ); (C) genes associated with onset of pulmonary fibrosis, MnSOD (SOD2) (
 ), TGF-β (
 ), Lysl Ox (
 ), IGFbp7 (
 ), TNFα (
 ); (D) collagen1a (
 ); (E) toll-like receptors, TLR1 (
 ), TLR2 (
 ), TLR4 (
 ), TLR5 (
 ), TLR6 (
 ), TLR7 (
 ); and (F) bromodomain epigenetic reader proteins, Brd1 (
 ), Brd2 (
 ), Brd3 (
 ), Brd4 (
 ). The pattern of post-irradiation data is shown in Table 2 and quantitation of data is shown in Supplemental Tables 1-2. (Fig. 2A-D top panels reproduced from Kalash, et al., Radiation Research, 2013 with permission of the publisher).
Distinct expression patterns of TLR4 transcripts in the irradiated lungs of C57BL/6NHsd compared to C3H/HeNHsd mice
Levels of expression of TLR family receptor RNA transcripts were measured in irradiated lungs of each mouse strain. In C57BL/6NHsd mouse lung, there was an acute phase and latent period decrease followed by late increase at the time of detectable pulmonary fibrosis in transcripts for TLR4 (Fig. 2E) and IFGbp7 (Fig. 2C). A prominent difference was the elevated levels of TLR4 in C57BL/6NHsd mouse lungs during the late fibrotic phase, which was absent in lungs of C3H/HeNHsd mice (Fig. 2E).
Reciprocal patterns of elevated bromodomain epigenetic reader protein gene transcripts in C3H/HeNHsd compared to C57BL/6NHsd mouse lung
A major difference between mouse strains following 20 Gy thoracic irradiation was observed with pulmonary levels of transcripts for bromodomain epigenetic reader proteins (BRD1-4). In C57BL/6NHsd mouse lung, there were initial low levels of Brd1, 3 and 4, then increases during the latent period (days 50–125) in expression of BRD1-4, followed by clear decreases at day 150 when pulmonary fibrosis was detected (Fig. 2F), while levels of Brd2 rose earlier at day 2 and persisted to day 50, levels were also low at day 200 in C57BL/6NHsd mouse lungs (Table 2). In contrast, C3H/HeNHsd mouse lung showed increased expression of transcripts for Brd1-4 during the acute phase that persisted over 200 days (Fig. 2F). Thus, the irradiated C57BL/6NHsd mouse lung showed a distinct pattern of late decrease in levels of Brd1, 2, 3, and 4 transcripts beginning with the onset of fibrosis (Fig. 2F). While pre-irradiation pulmonary levels of Brd2 and Brd3 were elevated in C57BL/6NHsd mice, there were no significant differences in levels of Brd1 or Brd4 between strains (Table 1). A summary of the comparative differences between the mouse strains in all 25 pulmonary gene transcript levels over time after lung irradiation is shown in Table 2 and statistical analysis in Tables 3–4.
Table II.
Comparison of Gene Transcript Levels in 20 Gy Thoracic Irradiated C3H/HeNHsd Compared to C57BlL/6NHsd Mouse Lungs.
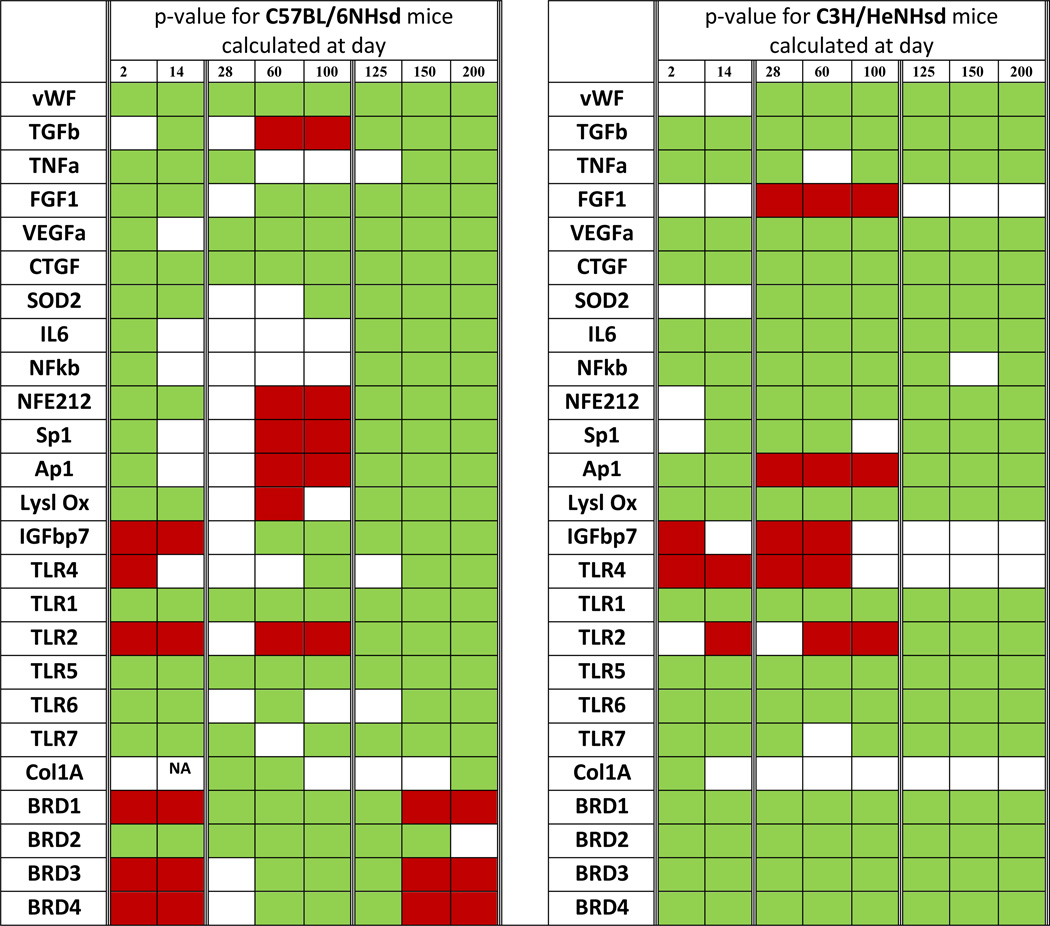 |
The left table is for C57BL/6NHsd and the right table is for C3H/HeNHsd mouse lungs. A green cell color indicates that the level of that gene transcript at the corresponding day is significantly higher than day 0. A red cell color indicates that the level of that gene transcript at the corresponding date is significantly lower than day 0. A white cell color indicates that the level of that gene transcript at the corresponding date is not significantly different from day 0. Results are based on the p-values for comparisons between each day 0.
Table III.
Gene expression in Lungs of 20 Gy Irradiated C57BL/6NHsd mice
| day | vWF | TGFb | TNFa | FGF1 | VEGFa |
|---|---|---|---|---|---|
| 0 | −0.33±39.07 (n=6) |
−25.60±26.54 (n=5) |
−14.00±45.74 (n=6) |
−28.17±41.02 (n=6) |
−5.80±43.60 (n=5) |
| 2 | 656.60±284.71 (n=5) |
35.60±59.34 (n=5) |
293.46±121.95 (n=5) |
329.71±218.05 (n=7) |
211.60±127.47 (n=5) |
| p=0.0003 | p=0.0684 | p=0.0003 | p=0.0023 | p=0.0069 | |
| 14 | 2881.17±2323.88 (n=6) |
243.00±187.15 (n=4) |
139.83±26.14 (n=4) |
1205.20±791.34 (n=5) |
1009.57±1216.80 (n=7) |
| p=0.0125 | p=0.0145 | p=0.0003 | p=0.0039 | p=0.0958 | |
| 28 | 2366.29±2279.84 (n=7) |
37.88±100.57 (n=8) |
61.00±48.97 (n=5) |
61.34±161.85 (n=5) |
341.25±169.37 (n=4) |
| p=0.0282 | p=0.2007 | p=0.0276 | p=0.2200 | p=0.0029 | |
| 60 | 519.67±55.43 (n=3) |
−90.78±3.90 (n=5) |
28.20±17.30 (n=4) |
73.33±83.58 (n=3) |
91.00±28.90 (n=4) |
| p<0.0001 | p=0.0006 | p=0.1209 | p=0.0388 | p=0.0067 | |
| 100 | 449.43±86.67 (n=7) |
−73.60±12.60 (n=5) |
−23.80±34.52 (n=5) |
44.60±24.10 (n=5) |
179.33±82.98 (n=6) |
| p<0.0001 | p=0.0065 | p=0.7031 | p=0.0069 | p=0.0015 | |
| 125 | 387.20±198.74 (n=5) |
10.40±3.51 (n=5) |
27.90±10.98 (n=5) |
84.60±15.57 (n=5) |
167.60±133.55 (n=5) |
| p=0.0011 | p=0.0169 | p=0.0785 | p=0.0003 | p=0.0247 | |
| 150 | 378.67±30.66 (n=3) |
104.20±81.28 (n=5) |
152.33±4.04 (n=3) |
196.33±52.17 (n=3) |
199.33±34.82 (n=3) |
| p<0.0001 | p=0.0094 | p=0.0005 | p=0.0002 | p=0.0005 | |
| 200 | 584.50±26.84 (n=4) |
259.75±53.65 (n=4) |
157.83±58.40 (n=6) |
447.00±72.17 (n=4) |
207.50±25.15 (n=4) |
| p<0.0001 | p<0.0001 | p=0.0002 | p<0.0001 | p=0.0001 | |
| (2) | |||||
|---|---|---|---|---|---|
| day | CTGF | SOD2 | IL6 | NFkb | NFE212 |
| 0 | 3.50±28.01 (n=6) |
−41.50±20.15 (n=6) |
−1.75±29.55 (n=4) |
62.40±27.13 (n=5) |
−25.83±15.41 (n=6) |
| 2 | 1724.40±1855.84 (n=5) |
126.67±137.59 (n=6) |
150.50±37.56 (n=4) |
176.33±40.06 (n=6) |
78.83±95.51 (n=6) |
| p=0.0473 | p=0.0142 | p=0.0007 | p=0.0004 | p=0.0243 | |
| 14 | 3104.67±1209.43 (n=3) |
313.50±333.58 (n=6) |
−9.87±38.81 (n=3) |
101.83±40.79 (n=6) |
2.33±10.80 (n=6) |
| p=0.0003 | p=0.0264 | p=0.7643 | p=0.0988 | p=0.0043 | |
| 28 | 421.00±451.75 (n=5) |
172.84±292.60 (n=8) |
18.70±5.05 (n=4) |
96.67±31.03 (n=6) |
−25.00±22.66 (n=6) |
| p=0.0483 | p=0.1016 | p=0.2214 | p=0.0860 | p=0.9421 | |
| 60 | 373.67±211.11 (n=3) |
−15.83±43.23 (n=6) |
−9.00±38.97 (n=4) |
34.45±13.00 (n=6) |
−64.55±21.04 (n=6) |
| p=0.0027 | p=0.2168 | p=0.7768 | p=0.0511 | p=0.0046 | |
| 100 | 248.00±68.71 (n=4) |
−21.00±10.88 (n=7) |
88.20±110.49 (n=5) |
40.86±24.42 (n=7) |
−67.14±17.58 (n=7) |
| p<0.0001 | p=0.0395 | p=0.1618 | p=0.1803 | p=0.0010 | |
| 125 | 489.00±166.78 (n=5) |
77.80±38.28 (n=5) |
302.40±199.68 (n=5) |
117.33±4.73 (n=3) |
26.00±6.24 (n=3) |
| p=0.0001 | p=0.0001 | p=0.0205 | p=0.0150 | p=0.0010 | |
| 150 | 3944.67±478.16 (n=3) |
148.33±55.90 (n=3) |
638.33±62.07 (n=3) |
210.00±1.00 (n=3) |
59.67±11.50 (n=3) |
| p<0.0001 | p=0.0001 | p<0.0001 | p=0.0001 | p=0.0001 | |
| 200 | 3416.25±135.91 (n=4) |
90.00±11.40 (n=4) |
379.75±25.91 (n=4) |
170.25±11.76 (n=4) |
79.25±7.93 (n=4) |
| p<0.0001 | p<0.0001 | p<0.0001 | p=0.0002 | p<0.0001 | |
| (3) | |||||
|---|---|---|---|---|---|
| day | Sp1 | Ap1 | Lysl Ox | IGFbp7 | TLR4 |
| 0 | −12.00±22.93 (n=7) |
−18.00±15.06 (n=6) |
−5.40±13.70 (n=5) |
3.00±5.00 (n=3) |
−23.00±25.65 (n=4) |
| 2 | 111.50±26.88 (n=6) |
77.83±20.43 (n=6) |
62.00±8.89 (n=3) |
−76.33±6.03 (n=3) |
−59.00±12.91 (n=4) |
| p<0.0001 | p<0.0001 | p=0.0003 | p=0.0001 | p=0.0461 | |
| 14 | −20.08±15.13 (n=6) |
−14.86±35.14 (n=7) |
39.67±4.51 (n=3) |
−54.33±11.15 (n=3) |
−45.75±19.12 (n=4) |
| p=0.4778 | p=0.8430 | p=0.0017 | p=0.0012 | p=0.2048 | |
| 28 | −28.17±9.87 (n=6) |
−31.00±15.85 (n=7) |
−25.67±11.68 (n=3) |
13.70±6.02 (n=3) |
−48.67±9.61 (n=3) |
| p=0.1386 | p=0.1598 | p=0.0778 | p=0.0770 | p=0.1667 | |
| 60 | −59.82±18.71 (n=6) |
−79.15±10.25 (n=6) |
−39.33±2.08 (n=3) |
91.67±3.06 (n=3) |
−49.50±20.44 (n=4) |
| p=0.0019 | p<0.0001 | p=0.0062 | p<0.0001 | p=0.1572 | |
| 100 | −67.14±24.67 (n=7) |
−90.54±6.92 (n=7) |
−13.67±6.03 (n=3) |
101.00±7.55 (n=3) |
44.40±15.44 (n=5) |
| p=0.0010 | p<0.0001 | p=0.3713 | p<0.0001 | p=0.0017 | |
| 125 | 20.80±11.14 (n=5) |
6.60±2.30 (n=5) |
32.67±3.51 (n=3) |
199.67±18.88 (n=3) |
−48.40±12.82 (n=5) |
| p=0.0150 | p=0.0059 | p=0.0038 | p=0.0001 | p=0.0918 | |
| 150 | 32.00±8.89 (n=3) |
24.00±11.14 (n=3) |
98.33±10.07 (n=3) |
893.67±167.82 (n=3) |
96.80±5.26 (n=5) |
| p=0.0140 | p=0.0039 | p<0.0001 | p=0.0008 | p<0.0001 | |
| 200 | 103.00±14.31 (n=4) |
76.25±17.80 (n=4) |
114.33±25.70 (n=3) |
1029.33±70.12 (n=3) |
176.17±40.26 (n=6) |
| p<0.0001 | p<0.0001 | p=0.0001 | p<0.0001 | p<0.0001 | |
| (4) | |||||
|---|---|---|---|---|---|
| day | TLR1 | TLR2 | TLR5 | TLR6 | TLR7 |
| 0 | 2.33±4.93 (n=3) |
2.80±2.55 (n=3) |
5.20±9.00 (n=3) |
6.00±5.29 (n=3) |
8.30±4.03 (n=3) |
| 2 | 384.00±58.41 (n=3) |
−14.00±5.00 (n=3) |
148.67±25.11 (n=3) |
407.33±17.79 (n=3) |
432.33±40.92 (n=3) |
| p=0.0004 | p=0.0066 | p=0.0007 | p<0.0001 | p=0.0001 | |
| 14 | 82.00±10.82 (n=3) |
−53.33±12.01 (n=3) |
161.67±13.20 (n=3) |
511.67±9.71 (n=3) |
166.00±30.27 (n=3) |
| p=0.0003 | p=0.0014 | p=0.0001 | p<0.0001 | p=0.0009 | |
| 28 | 121.00±11.53 (n=3) |
5.33±4.04 (n=3) |
120.67±10.02 (n=3) |
2.93±3.58 (n=3) |
122.00±12.00 (n=3) |
| p=0.0001 | p=0.4106 | p=0.0001 | p=0.4525 | p=0.0001 | |
| 60 | 203.67±8.08 (n=3) |
−42.33±6.81 (n=3) |
74.67±11.68 (n=3) |
511.00±11.53 (n=3) |
4.67±6.11 (n=3) |
| p<0.0001 | p=0.0004 | p=0.0012 | p<0.0001 | p=0.4385 | |
| 100 | 194.33±13.32 (n=3) |
−51.00±4.58 (n=3) |
33.33±10.50 (n=3) |
12.33±4.51 (n=3) |
208.00±15.13 (n=3) |
| p<0.0001 | p=0.0001 | p=0.0244 | p=0.1897 | p<0.0001 | |
| 125 | 337.67±32.81 (n=3) |
225.00±11.00 (n=3) |
124.00±21.93 (n=3) |
9.53±5.28 (n=3) |
257.67±18.50 (n=3) |
| p=0.0001 | p<0.0001 | p=0.0010 | p=0.4591 | p<0.0001 | |
| 150 | 134.00±14.42 (n=3) |
209.33±10.69 (n=3) |
265.00±24.58 (n=3) |
206.33±9.71 (n=3) |
942.33±52.20 (n=3) |
| p=0.0001 | p<0.0001 | p=0.0001 | p<0.0001 | p<0.0001 | |
| 200 | 91.67±6.66 (n=3) |
217.67±10.02 (n=3) |
294.00±37.51 (n=3) |
213.67±22.68 (n=3) |
801.33±22.05 (n=3) |
| p<0.0001 | p<0.0001 | p=0.0002 | p=0.0001 | p<0.0001 | |
| (5) | |||||
|---|---|---|---|---|---|
| day | Col1A | BRD1 | BRD2 | BRD3 | BRD4 |
| 0 | 6.50±4.19 (n=4) |
8.80±3.70 (n=5) |
6.28±3.21 (n=5) |
7.00±3.39 (n=5) |
7.20±3.35 (n=5) |
| 2 | 349.00±233.42 (n=3) |
−37.82±6.11 (n=5) |
34.98±6.66 (n=5) |
−31.60±7.13 (n=5) |
−31.80±8.47 (n=5) |
| p=0.0289 | p<0.0001 | p<0.0001 | p<0.0001 | p<0.0001 | |
| 14 | − (n=0) |
−26.66±4.63 (n=5) |
61.80±13.52 (n=5) |
−11.60±6.19 (n=5) |
−30.78±10.89 (n=5) |
| p<0.0001 | p<0.0001 | p=0.0004 | p=0.0001 | ||
| 28 | 225.50±85.56 (n=2) |
19.40±6.80 (n=5) |
69.92±19.41 (n=5) |
13.80±7.19 (n=5) |
−2.44±12.92 (n=5) |
| p=0.0042 | p=0.0156 | p=0.0001 | p=0.0922 | p=0.1449 | |
| 60 | 128.50±45.21 (n=4) |
57.08±9.94 (n=5) |
112.80±9.12 (n=5) |
54.20±12.52 (n=5) |
37.40±12.01 (n=5) |
| p=0.0017 | p<0.0001 | p<0.0001 | p<0.0001 | p=0.0006 | |
| 100 | 3.58±13.89 (n=4) |
151.60±5.86 (n=5) |
64.00±10.22 (n=5) |
131.20±12.83 (n=5) |
123.20±7.66 (n=5) |
| p=0.7007 | p<0.0001 | p<0.0001 | p<0.0001 | p<0.0001 | |
| 125 | 30.50±30.16 (n=4) |
70.60±9.61 (n=5) |
59.80±6.30 (n=5) |
33.00±6.20 (n=5) |
47.02±8.16 (n=5) |
| p=0.1660 | p<0.0001 | p<0.0001 | p<0.0001 | p<0.0001 | |
| 150 | 58.50±69.36 (n=4) |
−55.82±8.51 (n=5) |
73.40±6.69 (n=5) |
−34.20±11.54 (n=5) |
−25.80±7.36 (n=5) |
| p=0.1851 | p<0.0001 | p<0.0001 | p=0.0001 | p<0.0001 | |
| 200 | 299.33±34.27 (n=3) |
−61.60±3.05 (n=5) |
−4.80±22.69 (n=5) |
−63.20±5.72 (n=5) |
−52.20±9.26 (n=5) |
| p<0.0001 | p<0.0001 | p=0.3111 | p<0.0001 | p<0.0001 | |
Data summary using mean ± SD and group comparisons, where p is the p-value for the comparison of gene expression in lungs of C57BL/6NHsd mice between each day and day 0 for the corresponding gene, using the two-sided two sample t-test.
Table IV.
Gene expression in lungs of 20 Gy thoracic irradiated C3H/HeNHsd mice.
| day | vWF | TGFb | TNFa | FGF1 | VEGFa |
|---|---|---|---|---|---|
| 0 | 2.13±11.08 (n=4) |
−1.25±16.34 (n=4) |
−0.75±9.91 (n=4) |
−1.25±10.12 (n=4) |
−0.50±8.76 (n=4) |
| p2=0.9071 | p2=0.1544 | p2=0.5909 | p2=0.2421 | p2=0.8200 | |
| 2 | −0.45±9.08 (n=4) |
22.32±7.56 (n=4) |
64.73±10.73 (n=4) |
1.25±3.34 (n=4) |
100.68±13.78 (n=4) |
| p1=0.7315 | p1=0.0396 | p1=0.0001 | p1=0.6555 | p1<0.0001 | |
| p2=0.0026 | p2=0.6742 | p2=0.0078 | p2=0.0164 | p2=0.1313 | |
| 14 | 5.96±2.04 (n=4) |
116.75±12.43 (n=4) |
50.15±7.44 (n=4) |
4.13±1.47 (n=4) |
131.28±6.15 (n=4) |
| p1=0.5214 | p1<0.0001 | p1=0.0002 | p1=0.3336 | p1<0.0001 | |
| p2=0.0416 | p2=0.2269 | p2=0.0006 | p2=0.0201 | p2=0.1920 | |
| 28 | 40.00±8.69 (n=4) |
87.23±6.24 (n=4) |
52.83±8.90 (n=4) |
−17.33±5.07 (n=4) |
144.98±20.40 (n=4) |
| p1=0.0017 | p1=0.0001 | p1=0.0002 | p1=0.0295 | p1<0.0001 | |
| p2=0.0773 | p2=0.3611 | p2=0.7546 | p2=0.3699 | p2=0.0610 | |
| 60 | 52.95±12.79 (n=4) |
73.10±11.46 (n=4) |
4.75±13.84 (n=4) |
−40.10±6.69 (n=4) |
120.50±12.40 (n=4) |
| p1=0.0010 | p1=0.0003 | p1=0.5421 | p1=0.0007 | p1<0.0001 | |
| p2<0.0001 | p2<0.0001 | p2=0.0786 | p2=0.0382 | p2=0.1097 | |
| 100 | 65.25±6.24 (n=4) |
47.63±14.19 (n=4) |
19.43±8.95 (n=4) |
−15.75±3.77 (n=4) |
141.00±19.41 (n=4) |
| p1=0.0001 | p1=0.0040 | p1=0.0233 | p1=0.0363 | p1<0.0001 | |
| p2<0.0001 | p2<0.0001 | p2=0.0468 | p2=0.0018 | p2=0.3990 | |
| 125 | 63.50±5.20 (n=4) |
41.85±10.25 (n=4) |
44.50±9.57 (n=4) |
3.25±11.24 (n=4) |
157.50±22.49 (n=4) |
| p1=0.0001 | p1=0.0042 | p1=0.0006 | p1=0.5735 | p1<0.0001 | |
| p2=0.0148 | p2=0.0003 | p2=0.0489 | p2=0.0001 | p2=0.8868 | |
| 150 | 94.50±15.93 (n=4) |
27.25±13.57 (n=4) |
126.33±11.73 (n=4) |
5.43±6.51 (n=4) |
189.25±30.82 (n=4) |
| p1=0.0001 | p1=0.0364 | p1<0.0001 | p1=0.3096 | p1<0.0001 | |
| p2<0.0001 | p2=0.1071 | p2=0.0154 | p2=0.0007 | p2=0.7012 | |
| 200 | 88.03±5.90 (n=4) |
21.80±5.57 (n=4) |
124.00±15.12 (n=4) |
13.95±7.27 (n=4) |
193.28±10.99 (n=4) |
| p1<0.0001 | p1=0.0370 | p1<0.0001 | p1=0.0505 | p1<0.0001 | |
| p2<0.0001 | p2=0.0001 | p2=0.2980 | p2<0.0001 | p2=0.3398 | |
| (2) | |||||
|---|---|---|---|---|---|
| day | CTGF | SOD2 | IL6 | NFkb | NFE212 |
| 0 | −4.00±17.11 (n=4) |
5.25±14.08 (n=4) |
5.55±8.13 (n=4) |
3.50±10.21 (n=4) |
1.22±11.25 (n=4) |
| p2=0.6479 | p2=0.0040 | p2=0.6506 | p2=0.0047 | p2=0.0172 | |
| 2 | 69.75±8.15 (n=4) |
−11.03±1.07 (n=4) |
367.00±55.98 (n=4) |
152.88±16.54 (n=4) |
−12.13±6.02 (n=4) |
| p1=0.0002 | p1=0.0607 | p1<0.0001 | p1<0.0001 | p1=0.0814 | |
| p2=0.1221 | p2=0.0855 | p2=0.0007 | p2=0.3063 | p2=0.0993 | |
| 14 | 130.90±7.21 (n=4) |
−11.30±2.75 (n=4) |
216.75±47.06 (n=4) |
88.45±20.80 (n=4) |
165.85±6.99 (n=4) |
| p1<0.0001 | p1=0.0605 | p1=0.0001 | p1=0.0003 | p1<0.0001 | |
| p2=0.0038 | p2=0.0928 | p2=0.0011 | p2=0.5664 | p2<0.0001 | |
| 28 | 218.75±49.39 (n=4) |
63.05±6.82 (n=4) |
95.15±10.36 (n=4) |
38.63±6.44 (n=4) |
101.60±26.40 (n=4) |
| p1=0.0001 | p1=0.0003 | p1<0.0001 | p1=0.0011 | p1=0.0004 | |
| p2=0.4086 | p2=0.4808 | p2<0.0001 | p2=0.0068 | p2<0.0001 | |
| 60 | 100.73±8.46 (n=4) |
53.85±8.36 (n=4) |
117.25±17.29 (n=4) |
61.28±7.93 (n=4) |
50.90±9.65 (n=4) |
| p1<0.0001 | p1=0.0010 | p1<0.0001 | p1=0.0001 | p1=0.0005 | |
| p2=0.0442 | p2=0.0141 | p2=0.0010 | p2=0.0064 | p2<0.0001 | |
| 100 | 120.75±11.95 (n=4) |
34.95±8.08 (n=4) |
125.38±18.35 (n=4) |
23.90±8.26 (n=4) |
52.25±15.31 (n=4) |
| p1<0.0001 | p1=0.0106 | p1<0.0001 | p1=0.0209 | p1=0.0017 | |
| p2=0.0107 | p2<0.0001 | p2=0.5323 | p2=0.2195 | p2<0.0001 | |
| 125 | 136.75±11.24 (n=4) |
49.00±15.25 (n=4) |
121.25±12.97 (n=4) |
19.80±7.30 (n=4) |
80.10±11.62 (n=4) |
| p1<0.0001 | p1=0.0056 | p1<0.0001 | p1=0.0407 | p1=0.0001 | |
| p2=0.0043 | p2=0.2036 | p2=0.1172 | p2<0.0001 | p2=0.0008 | |
| 150 | 138.75±11.44 (n=4) |
219.75±27.10 (n=4) |
116.25±15.73 (n=4) |
13.13±5.34 (n=4) |
177.75±22.32 (n=4) |
| p1<0.0001 | p1<0.0001 | p1<0.0001 | p1=0.1457 | p1<0.0001 | |
| p2<0.0001 | p2=0.0720 | p2<0.0001 | p2<0.0001 | p2=0.0004 | |
| 200 | 155.30±8.99 (n=4) |
170.75±24.06 (n=4) |
114.03±10.25 (n=4) |
20.13±7.62 (n=4) |
195.75±13.60 (n=4) |
| p1<0.0001 | p1<0.0001 | p1<0.0001 | p1=0.0401 | p1<0.0001 | |
| p2<0.0001 | p2=0.0009 | p2<0.0001 | p2<0.0001 | p2<0.0001 | |
| (3) | |||||
|---|---|---|---|---|---|
| day | Sp1 | Ap1 | Lysl Ox | IGFbp7 | TLR4 |
| 0 | 5.03±10.32 (n=4) |
−2.68±9.42 (n=4) |
3.00±19.11 (n=4) |
1.28±10.01 (n=4) |
2.55±9.04 (n=4) |
| p2=0.2002 | p2=0.1105 | p2=0.4660 | p2=0.7981 | p2=0.1093 | |
| 2 | 17.00±5.16 (n=4) |
22.48±6.19 (n=4) |
243.45±53.97 (n=4) |
−23.43±6.17 (n=4) |
−17.75±6.03 (n=4) |
| p1=0.0832 | p1=0.0043 | p1=0.0002 | p1=0.0057 | p1=0.0097 | |
| p2=0.0001 | p2=0.0009 | p2=0.0024 | p2=0.0001 | p2=0.0012 | |
| 14 | 104.25±19.62 (n=4) |
22.98±6.69 (n=4) |
197.00±13.52 (n=4) |
−12.30±6.23 (n=4) |
−16.10±4.75 (n=4) |
| p1=0.0001 | p1=0.0044 | p1<0.0001 | p1=0.0609 | p1=0.0107 | |
| p2<0.0001 | p2=0.0667 | p2<0.0001 | p2=0.0013 | p2=0.0237 | |
| 28 | 93.90±6.71 (n=4) |
−49.28±6.51 (n=4) |
164.50±9.88 (n=4) |
−16.18±6.11 (n=4) |
−16.33±6.20 (n=4) |
| p1<0.0001 | p1=0.0002 | p1<0.0001 | p1=0.0248 | p1=0.0138 | |
| p2<0.0001 | p2=0.0588 | p2<0.0001 | p2=0.0013 | p2=0.0028 | |
| 60 | 31.23±10.83 (n=4) |
−55.90±11.11 (n=4) |
124.23±13.38 (n=4) |
−15.50±6.65 (n=4) |
−26.75±9.00 (n=4) |
| p1=0.0128 | p1=0.0003 | p1<0.0001 | p1=0.0315 | p1=0.0037 | |
| p2<0.0001 | p2=0.0093 | p2<0.0001 | p2<0.0001 | p2=0.0877 | |
| 100 | 15.03±7.23 (n=4) |
−31.50±9.18 (n=4) |
126.00±14.94 (n=4) |
−7.98±13.97 (n=4) |
10.20±4.24 (n=4) |
| p1=0.1635 | p1=0.0047 | p1=0.0001 | p1=0.3231 | p1=0.1764 | |
| p2=0.0001 | p2<0.0001 | p2<0.0001 | p2=0.0001 | p2=0.0038 | |
| 125 | 68.03±7.55 (n=4) |
41.50±11.56 (n=4) |
107.75±24.74 (n=4) |
−9.00±10.42 (n=4) |
9.10±3.33 (n=4) |
| p1=0.0001 | p1=0.0010 | p1=0.0005 | p1=0.2049 | p1=0.2229 | |
| p2=0.0002 | p2=0.0003 | p2=0.0038 | p2<0.0001 | p2=0.0001 | |
| 150 | 219.50±50.35 (n=4) |
169.50±19.54 (n=4) |
139.53±11.81 (n=4) |
13.33±6.40 (n=4) |
9.65±14.45 (n=4) |
| p1=0.0002 | p1<0.0001 | p1<0.0001 | p1=0.0888 | p1=0.4368 | |
| p2=0.0016 | p2=0.0001 | p2=0.0047 | p2=0.0001 | p2<0.0001 | |
| 200 | 167.75±22.10 (n=4) |
145.25±11.03 (n=4) |
128.25±16.32 (n=4) |
9.73±2.58 (n=4) |
4.35±10.70 (n=4) |
| p1<0.0001 | p1<0.0001 | p1=0.0001 | p1=0.1531 | p1=0.8058 | |
| p2=0.0027 | p2=0.0006 | p2=0.4167 | p2<0.0001 | p2<0.0001 | |
| (4) | |||||
|---|---|---|---|---|---|
| day | TLR1 | TLR2 | TLR5 | TLR6 | TLR7 |
| 0 | 5.67±8.62 (n=3) |
3.33±13.58 (n=3) |
6.20±4.53 (n=3) |
−1.13±16.56 (n=3) |
8.00±10.82 (n=3) |
| p2=0.5923 | p2=0.9499 | p2=0.8718 | p2=0.5165 | p2=0.9663 | |
| 2 | 299.67±30.11 (n=3) |
−17.67±7.02 (n=3) |
149.67±23.44 (n=3) |
357.67±19.01 (n=3) |
404.33±7.02 (n=3) |
| p1=0.0001 | p1=0.0760 | p1=0.0005 | p1<0.0001 | p1<0.0001 | |
| p2=0.0903 | p2=0.5022 | p2=0.9622 | p2=0.0298 | p2=0.3076 | |
| 14 | 68.03±10.87 (n=3) |
−50.00±17.52 (n=3) |
160.67±13.80 (n=3) |
504.33±8.50 (n=3) |
158.00±29.51 (n=3) |
| p1=0.0015 | p1=0.0141 | p1=0.0001 | p1<0.0001 | p1=0.0012 | |
| p2=0.1898 | p2=0.7993 | p2=0.9321 | p2=0.3809 | p2=0.7595 | |
| 28 | 116.67±26.35 (n=3) |
3.00±9.54 (n=3) |
122.00±18.68 (n=3) |
8.63±5.08 (n=3) |
116.33±11.02 (n=3) |
| p1=0.0023 | p1=0.9739 | p1=0.0005 | p1=0.3841 | p1=0.0003 | |
| p2=0.8070 | p2=0.7163 | p2=0.9185 | p2=0.1873 | p2=0.5793 | |
| 60 | 192.33±22.74 (n=3) |
−35.33±10.97 (n=3) |
80.67±7.02 (n=3) |
484.00±23.26 (n=3) |
9.33±17.79 (n=3) |
| p1=0.0002 | p1=0.0185 | p1=0.0001 | p1<0.0001 | p1=0.9170 | |
| p2=0.4617 | p2=0.4008 | p2=0.4881 | p2=0.1460 | p2=0.6895 | |
| 100 | 181.33±63.89 (n=3) |
−55.00±12.77 (n=3) |
26.33±8.33 (n=3) |
9.87±4.20 (n=3) |
191.67±7.64 (n=3) |
| p1=0.0092 | p1=0.0056 | p1=0.0212 | p1=0.3273 | p1<0.0001 | |
| p2=0.7475 | p2=0.6364 | p2=0.4169 | p2=0.5263 | p2=0.1705 | |
| 125 | 326.33±17.50 (n=3) |
227.00±20.95 (n=3) |
122.00±13.00 (n=3) |
16.00±8.54 (n=3) |
242.67±22.05 (n=3) |
| p1<0.0001 | p1=0.0001 | p1=0.0001 | p1=0.1865 | p1=0.0001 | |
| p2=0.6255 | p2=0.8907 | p2=0.8985 | p2=0.3273 | p2=0.4178 | |
| 150 | 140.33±36.35 (n=3) |
197.00±9.17 (n=3) |
285.33±17.16 (n=3) |
199.67±21.13 (n=3) |
902.00±23.30 (n=3) |
| p1=0.0034 | p1<0.0001 | p1<0.0001 | p1=0.0002 | p1<0.0001 | |
| p2=0.7930 | p2=0.2039 | p2=0.3052 | p2=0.6455 | p2=0.2888 | |
| 200 | 97.73±13.21 (n=3) |
216.33±8.08 (n=3) |
280.00±12.29 (n=3) |
220.00±21.63 (n=3) |
791.00±24.00 (n=3) |
| p1=0.0005 | p1<0.0001 | p1<0.0001 | p1=0.0001 | p1<0.0001 | |
| p2=0.5166 | p2=0.8663 | p2=0.5722 | p2=0.7440 | p2=0.6121 | |
| (5) | |||||
|---|---|---|---|---|---|
| day | Col1A | BRD1 | BRD2 | BRD3 | BRD4 |
| 0 | 6.50±8.81 (n=4) |
1.50±12.71 (n=4) |
0.48±13.10 (n=4) |
0.73±16.21 (n=4) |
1.50±10.14 (n=4) |
| p2=1.0000 | p2=0.2552 | p2=0.3639 | p2=0.4200 | p2=0.2706 | |
| 2 | 30.88±11.75 (n=4) |
55.03±6.41 (n=4) |
56.00±8.38 (n=4) |
62.61±9.30 (n=4) |
112.28±26.18 (n=4) |
| p1=0.0160 | p1=0.0003 | p1=0.0004 | p1=0.0006 | p1=0.0002 | |
| p2=0.0373 | p2<0.0001 | p2=0.0040 | p2<0.0001 | p2<0.0001 | |
| 14 | 14.60±5.97 (n=4) |
72.53±10.22 (n=4) |
69.38±8.06 (n=4) |
113.68±6.81 (n=4) |
142.65±12.76 (n=4) |
| p1=0.1789 | p1=0.0001 | p1=0.0001 | p1<0.0001 | p1<0.0001 | |
| p2=. | p2<0.0001 | p2=0.3589 | p2<0.0001 | p2<0.0001 | |
| 28 | 14.03±7.09 (n=4) |
64.25±5.84 (n=4) |
50.63±7.62 (n=4) |
56.98±7.20 (n=4) |
121.55±12.14 (n=4) |
| p1=0.2317 | p1=0.0001 | p1=0.0006 | p1=0.0007 | p1<0.0001 | |
| p2=0.0048 | p2<0.0001 | p2=0.1059 | p2<0.0001 | p2<0.0001 | |
| 60 | 16.63±6.20 (n=4) |
60.23±11.46 (n=4) |
63.13±10.22 (n=4) |
61.93±10.80 (n=4) |
111.43±10.64 (n=4) |
| p1=0.1092 | p1=0.0005 | p1=0.0003 | p1=0.0008 | p1<0.0001 | |
| p2=0.0027 | p2=0.6721 | p2=0.0001 | p2=0.3621 | p2<0.0001 | |
| 100 | 12.53±1.76 (n=4) |
62.80±15.01 (n=4) |
80.75±10.47 (n=4) |
89.75±16.60 (n=4) |
120.25±8.77 (n=4) |
| p1=0.2285 | p1=0.0008 | p1=0.0001 | p1=0.0003 | p1<0.0001 | |
| p2=0.2482 | p2<0.0001 | p2=0.0463 | p2=0.0038 | p2=0.6064 | |
| 125 | 15.53±3.35 (n=4) |
87.25±15.06 (n=4) |
61.05±7.76 (n=4) |
97.23±12.03 (n=4) |
130.75±21.23 (n=4) |
| p1=0.1041 | p1=0.0001 | p1=0.0002 | p1=0.0001 | p1<0.0001 | |
| p2=0.3618 | p2=0.0823 | p2=0.7967 | p2<0.0001 | p2=0.0001 | |
| 150 | 11.43±6.01 (n=4) |
72.18±9.19 (n=4) |
31.50±11.10 (n=4) |
52.50±16.01 (n=4) |
155.00±15.41 (n=4) |
| p1=0.3915 | p1=0.0001 | p1=0.0112 | p1=0.0039 | p1<0.0001 | |
| p2=0.2250 | p2<0.0001 | p2=0.0002 | p2<0.0001 | p2<0.0001 | |
| 200 | 5.05±15.35 (n=4) |
81.25±11.03 (n=4) |
70.25±20.42 (n=4) |
90.53±8.77 (n=4) |
143.50±15.80 (n=4) |
| p1=0.8753 | p1=0.0001 | p1=0.0012 | p1=0.0001 | p1<0.0001 | |
| p2<0.0001 | p2<0.0001 | p2=0.0013 | p2<0.0001 | p2<0.0001 | |
Data summary using mean±SD and group comparisons, where p1 is the p-value for the comparison of gene expression in lungs of C3H/HeNHsd mice between each day and day 0 for the corresponding gene, p2 is the p-value for the comparison between C57BL/6NHsd mice and C3H/HeNHsd mice at the corresponding day for the corresponding gene. All these p-values were calculated with the two-sided two sample t-test.
Pulmonary protein levels are concordant with gene transcript levels in thoracic irradiated C3H/HeNHsd and C57BL/6NHsd mice
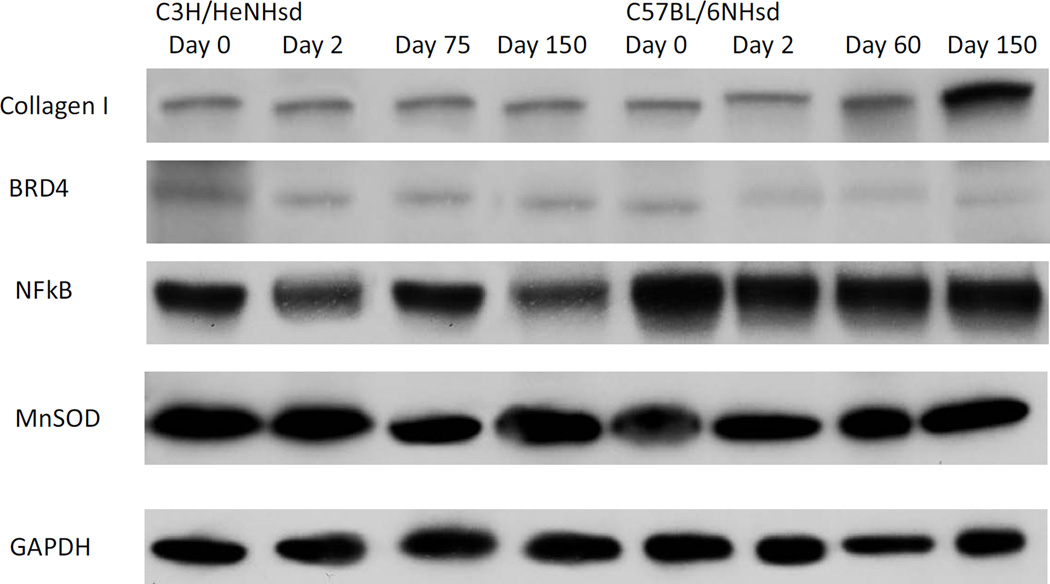
We next determined whether increased gene transcript levels correlated with increased levels of protein. Representative proteins tested included two that have been associated with the acute pulmonary radiation reaction between days 1 and 14, (a promoter binding protein associated with the oxidative stress response (NFkβ), a radiation protective antioxidant enzyme, SOD2 (MnSOD)), and a protein associated with pulmonary fibrosis (collagen1A). We also measured levels of Brd4 protein. Each protein was compared at times that corresponded to transcript levels in irradiated C57BL/6NHsd compared to C3H/HeNHsd mouse lungs (Fig. 3) (Table 5). In some cases, elevated RNA transcript levels were not concordant with elevated protein levels (NFkβ, MnSOD (SOD2)) at the times tested, but in other cases, there was concordance. In the C3H/HeNHsd mouse lung tissue at day 150, Collagen 1a protein (elevated in pulmonary fibrosis) was significantly lower than levels in C57BL/6NHsd irradiated mouse lungs, while Brd4 protein level was significantly higher than the levels in C57BL/6NHsd mouse lung (Fig. 3) (Table 5). The data with collagen 1a and Brd4 were concordant with RNA transcript levels at day 150 (Fig. 2D and 2F respectively).
Figure 3. Irradiation induced proteins in lungs of 20 Gy irradiated C57BL/6NHsd compared to C3H/HeNHsd mice.
To correlate levels of MnSOD, NFkβ, collagen 1a, and Brd4 RNA transcripts with protein in post irradiation lungs, tissue was removed from groups of 5 C3H/HeNHsd and C57BL/6NHsd female mice irradiated to 20Gy to the thoracic cavity at day 2, day 75, and day 150. Western Blot analysis was then performed using antibodies, and analyzed for band densities as described in the methods and in (Kalash et al. 2013a). Quantitative analysis of densitometry is in Table 5.
Table V.
Analysis of data from C57BL/6NHsd and C3H/HeNHsd mouse lung western blots.
| Mouse type | Day | MnSOD | NFKB | Collagen 1a | BRD4 |
|---|---|---|---|---|---|
| C57BL/6NHsd | 0 | 1±0 (n=4) | 1±0 (n=4) | 1±0 (n=3) | 1±0 (n=2) |
| 2 | 2.18±1.43 (n=4) |
0.89±0.30 (n=4) |
0.73±0.60 (n=3) |
0.84±0.51 (n=2) |
|
| p1=0.1977 | p1=0.5331 | p1=0.5157 | p1=0.7305 | ||
| 75 | 2.20±0.92 (n=4) |
1.19±0.80 (n=4) |
1.60±1.31 (n=3) |
0.31±0.22 (n=2) |
|
| p1=0.0814 | p1=0.6639 | p1=0.5076 | p1=0.1400 | ||
| 150 | 2.64±2.07 (n=4) |
2.20±1.15 (n=4) |
4.32±1.98 (n=3) |
0.69±0.16 (n=2) |
|
| p1=0.2126 | p1=0.1271 | p1=0.1011 | p1=0.2206 | ||
| C3H/HeNHsd | 0 | 1±0 (n=4) |
1±0 (n=4) |
1±0 (n=3) |
1±0 (n=2) |
| 2 | 0.94±0.34 (n=4) |
0.63±0.25 (n=4) |
0.77±0.61 (n=3) |
2.00±0.71 (n=2) |
|
| p1=0.7366 | p1=0.0611 | p1=0.5865 | p1=0.2952 | ||
| p2=0.1804 | p2=0.2281 | p2=0.9342 | p2=0.2005 | ||
| 60 | 1.15±0.39 (n=4) |
1.02±0.12 (n=4) |
0.64±0.74 (n=3) |
7.00±4.24 (n=2) |
|
| p1=0.5022 | p1=0.7486 | p1=0.4850 | p1=0.2952 | ||
| p2=0.0820 | p2=0.7006 | p2=0.3273 | p2=0.1559 | ||
| 150 | 1.27±0.54 (n=4) |
0.70±0.21 (n=4) |
0.62±0.55 (n=3) |
5.50±1.56 (n=2) |
|
| p1=0.3907 | p1=0.0638 | p1=0.3599 | p1=0.1526 | ||
| p2=0.2494 | p2=0.0767 | p2=0.0358 | p2=0.0489 | ||
Data are summarized with mean±SD.
P1 is the p-value for the comparison between each day and day 0 for each gene and each mouse type, using the two-sided one-sample t-test.
P2 is the p-value for the comparison between the two mouse strains for each gene at each day, using the two-sided two sample t-test.
Distinct lung histopathology in thoracic irradiated C3H/HeNHsd compared to C57BL/6NHsd mice
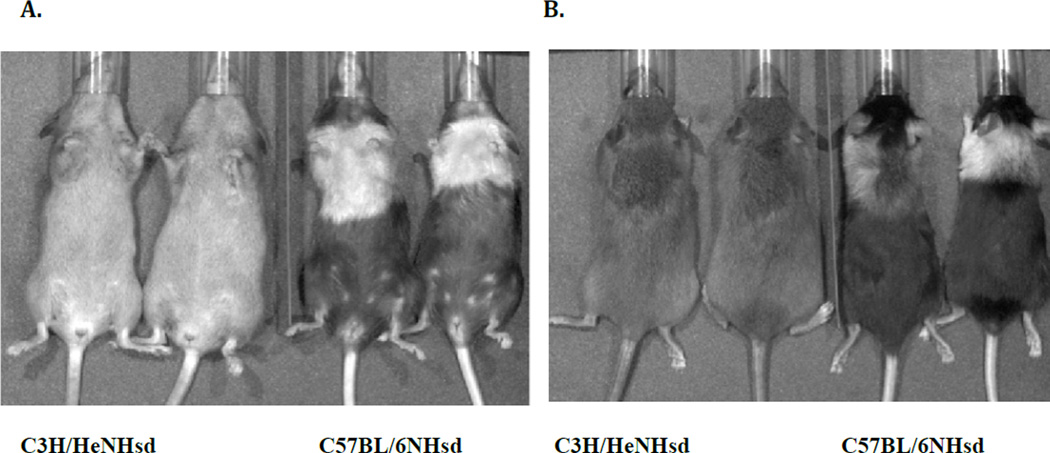
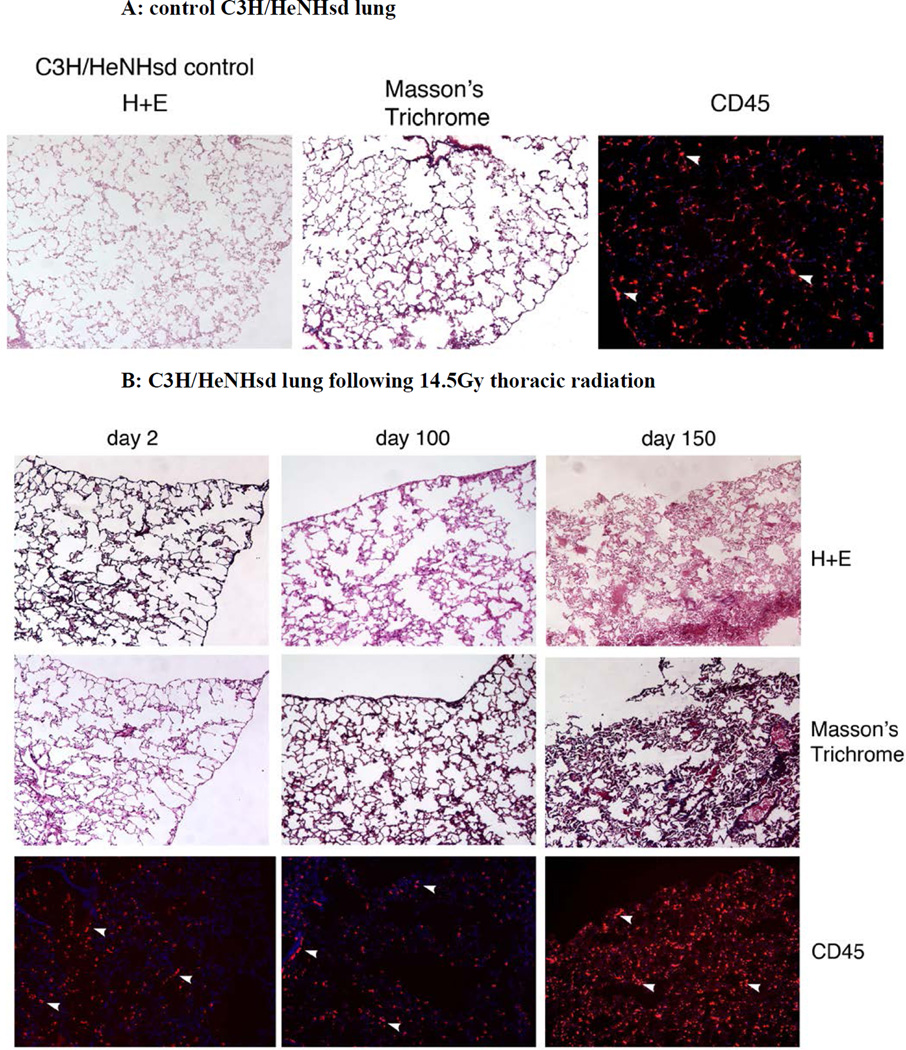
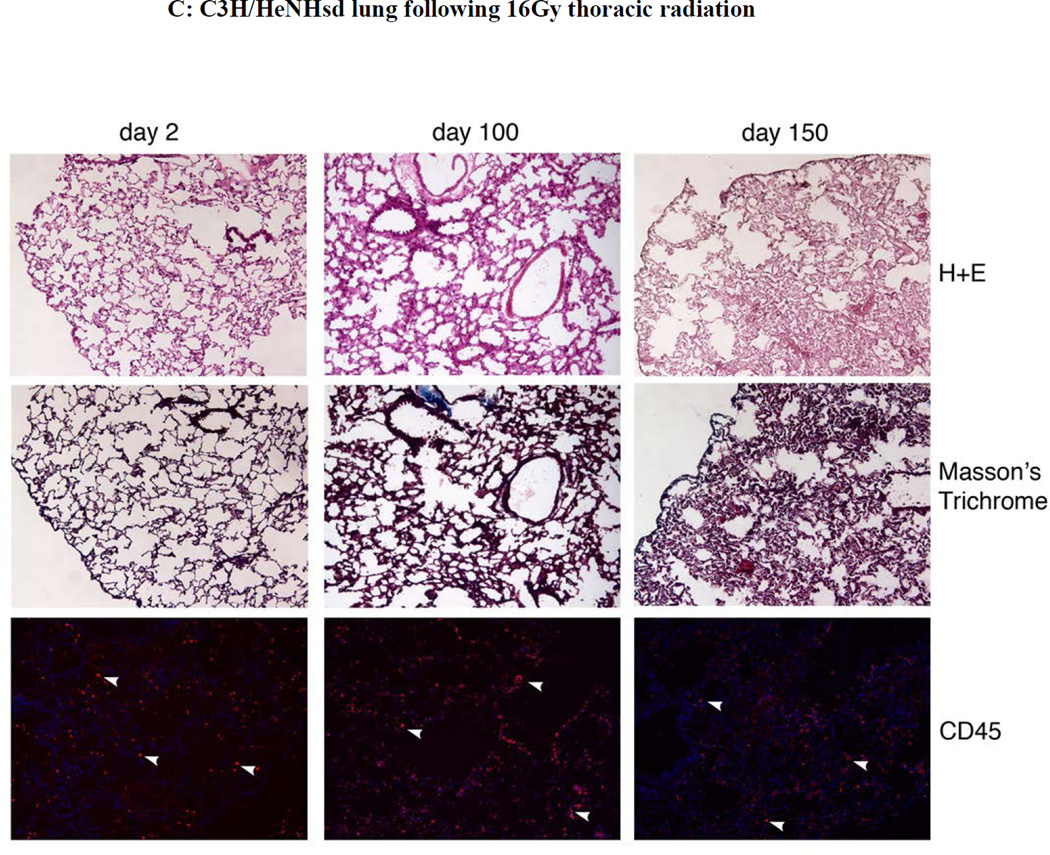
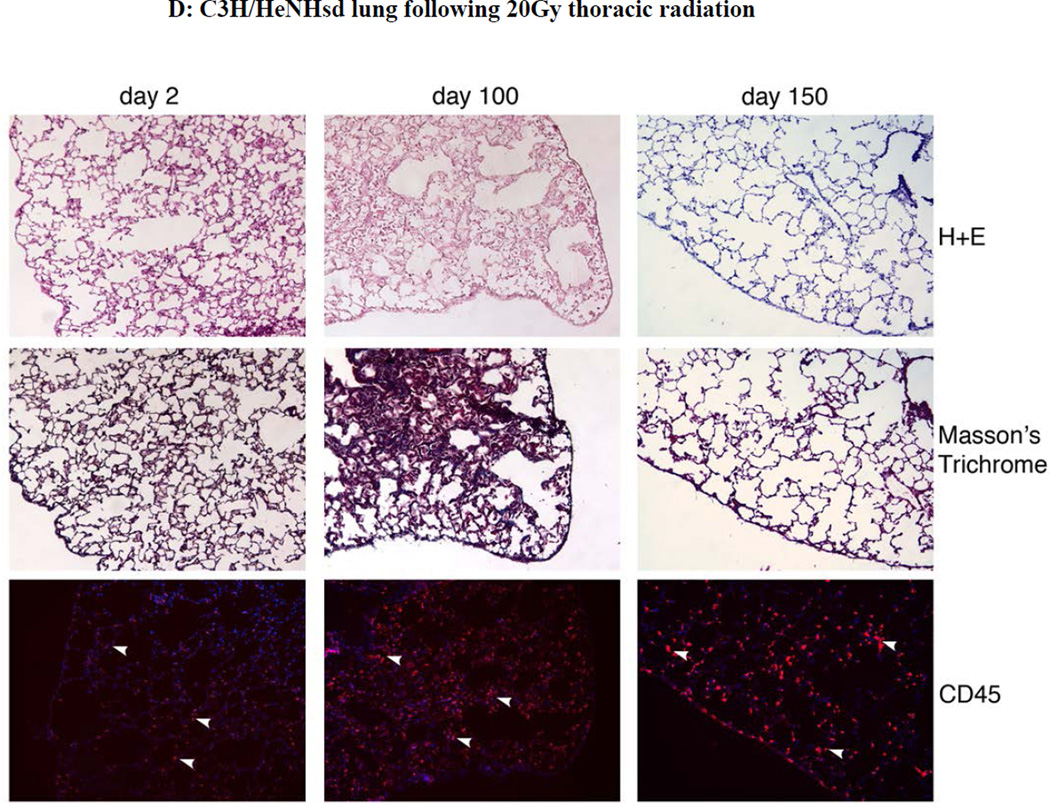
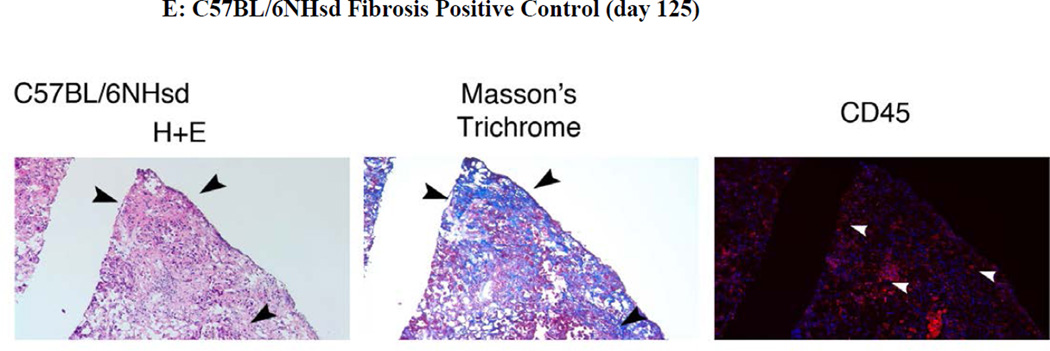
C3H/HeNHsd mice, showed no physical evidence of late coat greying (Fig. 4) and no histopathologic evidence of pulmonary fibrosis after any of the three radiation doses, and dying mice showed no detectable pulmonary fibrosis (Fig. 5A-D). By 150 days post irradiation, C57BL/6NHsd mice displayed pulmonary organizing alveolitis (fibrosis) (Fig. 5E). These results confirm and extend those in a prior publication (24).
Figure 4. C3H/HeNHsd mice display less coat color change than C57BL/6NHsd mice following 20Gy thoracic radiation.
C57BL/6NHsd and C3H/HeNHsd female mice were irradiated to 20 Gy to the thoracic cavity. The IVIS imaging system was used to take ventral (A) and dorsal (B) images at 47 days post irradiation for evaluation of coat changes.
Figure 5. Absence of pulmonary fibrosis in lungs of thoracic irradiated C3H/HeNHsd mice.
Frozen sections removed at day 2, 100, or 150 from lungs of: A) unirradiated C3H/HeNHsd control mice; B) C3H/HeNHsd mice thoracic - irradiated to 14.5; C)16 Gy; or D) 20Gy; or E) 20Gy thoracic-irradiated C57BL/6NHsd mice were stained with hematoxylin and eosin, Masson’s trichrome (for collagen) or immunostained for CD45 at serial times after irradiation. Sections were collected from C3H/HeNHsd mouse lungs at day 2 (acute phase), day 100 (latent period) and day 150 (late phase). No detectable fibrosis or increased collagen was observed in control unirradiated, acute, latent or late phase lung tissue from C3H/HeNHsd mice after any irradiation dose. C57BL/6NHsd mice showed late phase fibrosis at day 150 (E). Increased collagen (black arrows) in Masson’s trichrome stained sections (E) and increased numbers of red stained CD45+ inflammatory cells (white arrows) in peri-vascular distribution was seen in C57BL/6NHsd lungs in the late phase post-irradiation (E). Masson’s trichrome staining of lungs from irradiated C3H/HeNHsd mice at all times was similar to control unirradiated lungs, indicating no detectable fibrosis. Low level immunostaining for CD45 cells (white arrows) in C3H/HeNHsd lungs was similar in control unirradiated, and irradiated lungs at all phases. All images 10 x.
The histopathology of C57BL/6NHsd lung tissue showed an acute inflammatory reaction, a stable latent period, followed by a late fibrosis phase 150 days post irradiation. In contrast, 20 Gy irradiated C3H/HeNHsd lung tissue showed a robust acute inflammatory reaction following thoracic irradiation, but no late phase (day 150) fibrosis reaction (Fig. 5D).
At acute, latent period, and late time points, (days 2, 100, and 150 post irradiation), C57BL/6NHsd mice lungs were quantitated for fibrosis, collagen deposition, and inflammatory cell accumulation in the lungs, and results compared to that with C3H/HeNHsd mice irradiated to 14.5,16, or 20 Gy. Light microscopic quantitation of inflammation and percent fibrosis in H & E stained lung sections from the acute phase, latent period, and late fibrotic time points was performed. As shown in Figure 5, there was a pulmonary inflammatory infiltrate during the acute phase lungs of 20 Gy irradiated C57BL/6NHsd mice, and an inflammatory infiltrate in the acute phase lungs of C3H/HeNHsd mice after doses of 14.5, 16, and 20Gy. At day 100 the lungs of C3H/HeNHsd and C57BL/6NHsd mice showed little histopathological change. C57BL/6NHsd but not C3H/HeNHsd mouse lung histopathologic sections showed significant fibrosis at day 150 (Fig. 5E).
Lack of detectable bone marrow stromal cell homing to the lungs of thoracic irradiated C3H/HeNHsd mice
C57BL/6NHsd mice chimeric for luc+ bone marrow have been reported to display fibrosis at 150 – 200 days after 20 Gy thoracic irradiation, and coincident homing of Luciferase-positive (Luc+) bone marrow stromal cells to the lungs (24).
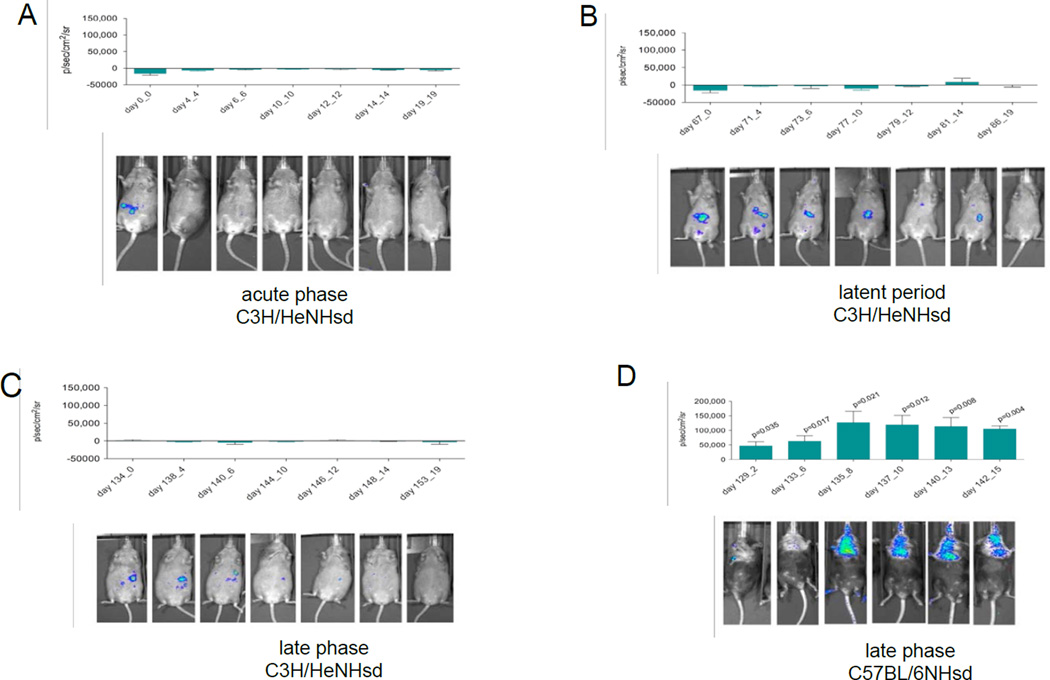
To determine whether luc+ marrow stromal cell homing occurred in C3H/HeNHsd mice in the absence of a detectable pulmonary fibrosis, mice were injected intraperitoneally with 1 × 10⁶ Luc+ bone marrow stromal cells prepared from C3H/HeNHsd mouse marrow according to published methods (24) using luciferase mouse gene transduced stromal cell lines derived from long term bone marrow cultures. Mice were injected at serial times for live imaging of lung migration of luc+ cells using published methods (24). At each of three time points after 20 Gy thoracic irradiation: immediately, 67 days, or 134 days post thoracic irradiation, C3H/HeNHsd demonstrated no detectable luc+ bone marrow stromal cell homing to the lungs (Fig. 6A-6D). In contrast, C57BL/6NHsd mice injected I.P. at day 129 after 20 Gy thoracic irradiation showed significant homing of luc+ stromal cells derived from luciferase gene transduced cells harvested from C57BL/6NHsd long term marrow cultures (Fig. 6E). The present results with C57BL/6NHsd mice confirm and extend other results from prior studies (24).
Figure 6. Absence of detectable bone marrow stromal cell homing to the irradiated lungs of C3H/HeNHsd mice.
Groups of 20 Gy thoracic irradiated C3H/HeNHsd and C57BL/6NHsd mice were injected intraperitoneally (I.P.) with 1 × 10⁶ syngeneic luc+ bone marrow stromal cells at each of four time points: 1) immediately, 2) at 67 days, 3) 129 days, or 4) 134 days post thoracic irradiation according to published methods (28, 30). In vivo imaging revealed no detectable migration of luc+ cells to the lungs of 20 Gy thoracic irradiated C3H/HeNHsd mice at any time point: A) acute phase; B) the latent period; or C) the late phase. In contrast, C57BL/6NHsd mice revealed significant late phase migration of luc+ BM cells to the lungs at day 129, D). Late phase bioluminescence in C3H/HeNHsd mice was compared to late phase bioluminescence in C57BL/6NHsd mouse lungs using a two-sided two-sample t-test. Pulmonary migration of luc+ cells was significantly increased (p<0.05) in C57BL/6NHsd compared C3H/HeNHsd mouse lungs (Fig. 3D).
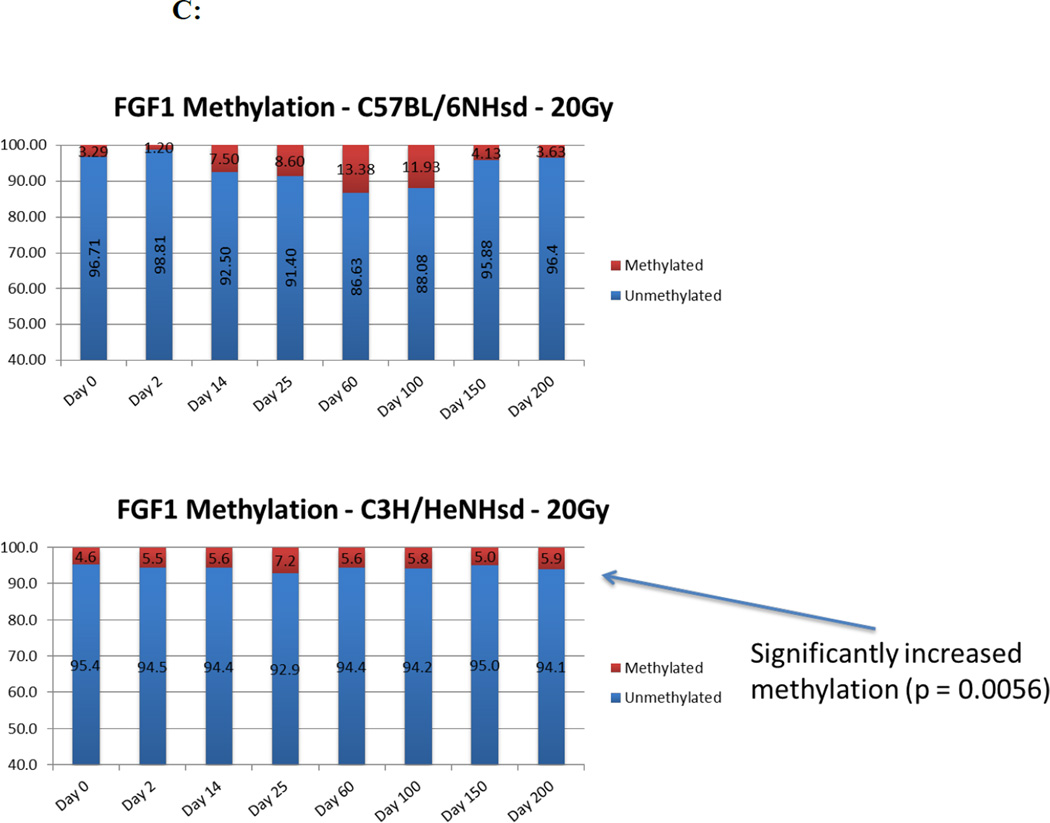
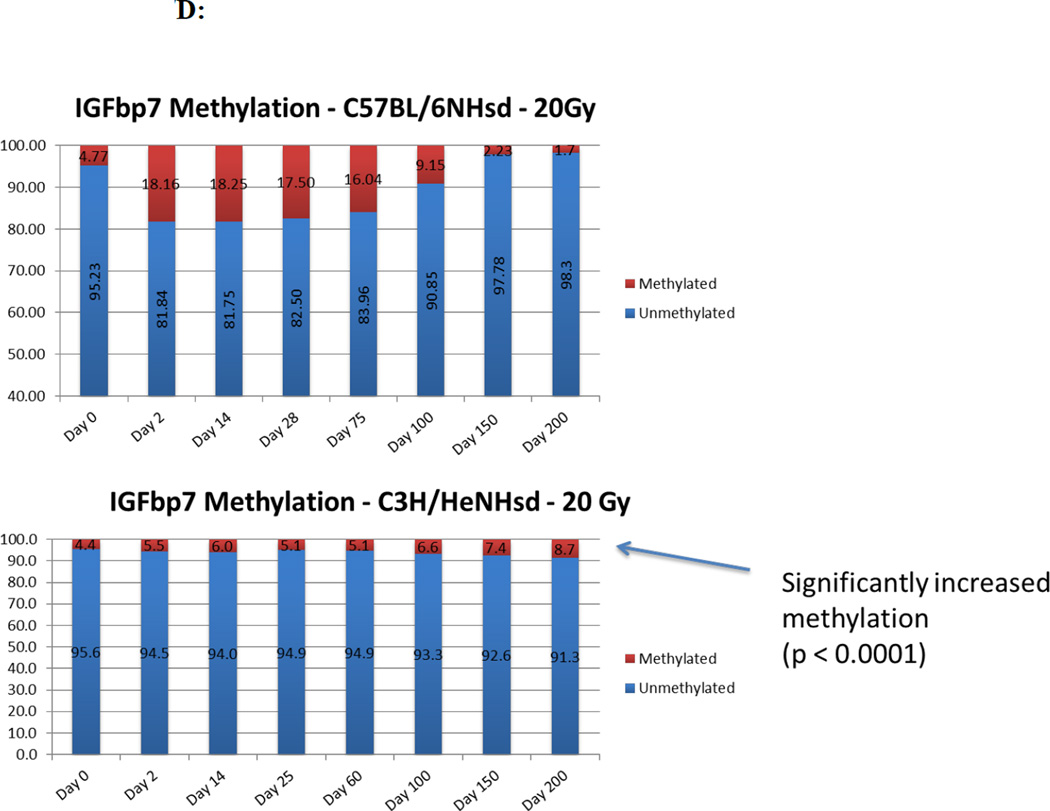
Changes in levels of CpG methylation in the gene promoter(s) for TGFβ, MnSOD (SOD2), FGF1, and, IGFbp7 correlate with levels of gene transcripts in irradiated mouse lungs
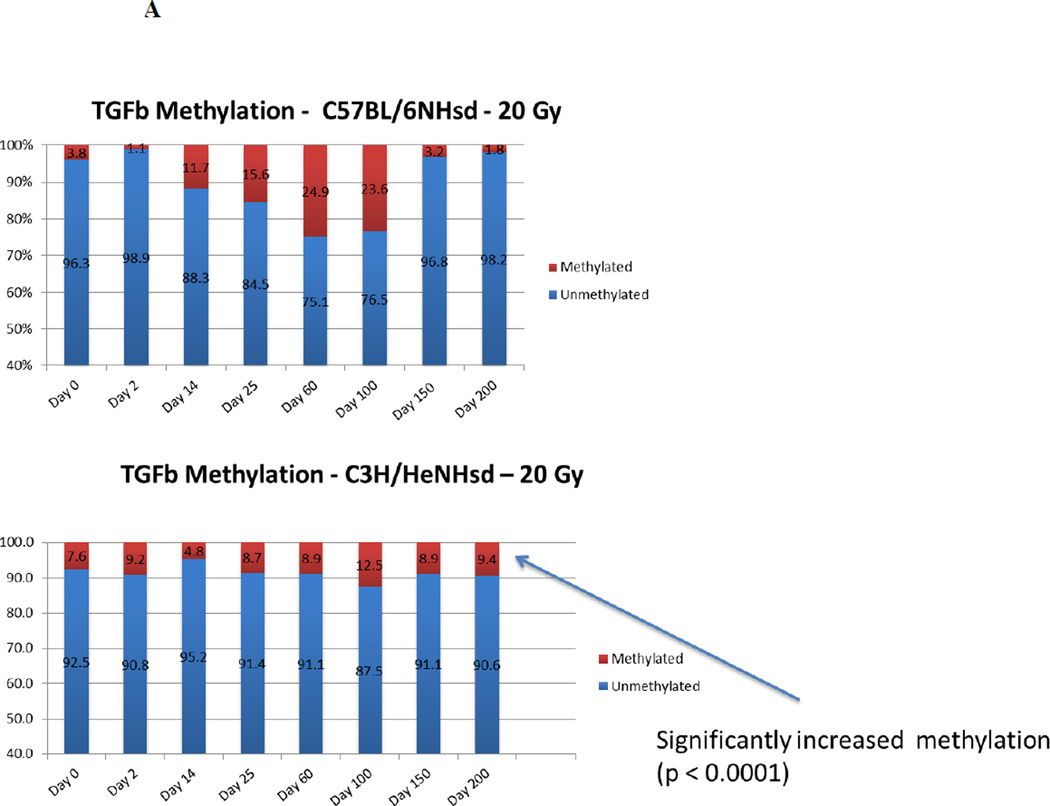
We next determined if the increases in specific gene transcript levels correlated with demethylation of the promoters for those genes. In 20 Gy thoracic irradiated C57BL/6NHsd mouse lung tissue, inflammation associated genes (TGF-β and MnSOD) showed significant promoter demethylation (<3% methylation) during both the acute and late stages, and increased methylation (25.67% and 20.67% respectively) during the latent period (Fig. 7). Demethylation of the TGFβ promoter in C57BL/6NHsd mouse lung was consistent with elevated levels of gene transcripts for TGFβ. In contrast, with C3H/HeNHsd mouse lung tissue, the promoter for the TGFβ gene showed significantly greater methylation during the late phase (days 150 and 200) concordant with lower levels of TGFβ transcript and absence of histopathologic evidence of pulmonary fibrosis (Fig 7) (Table 6).
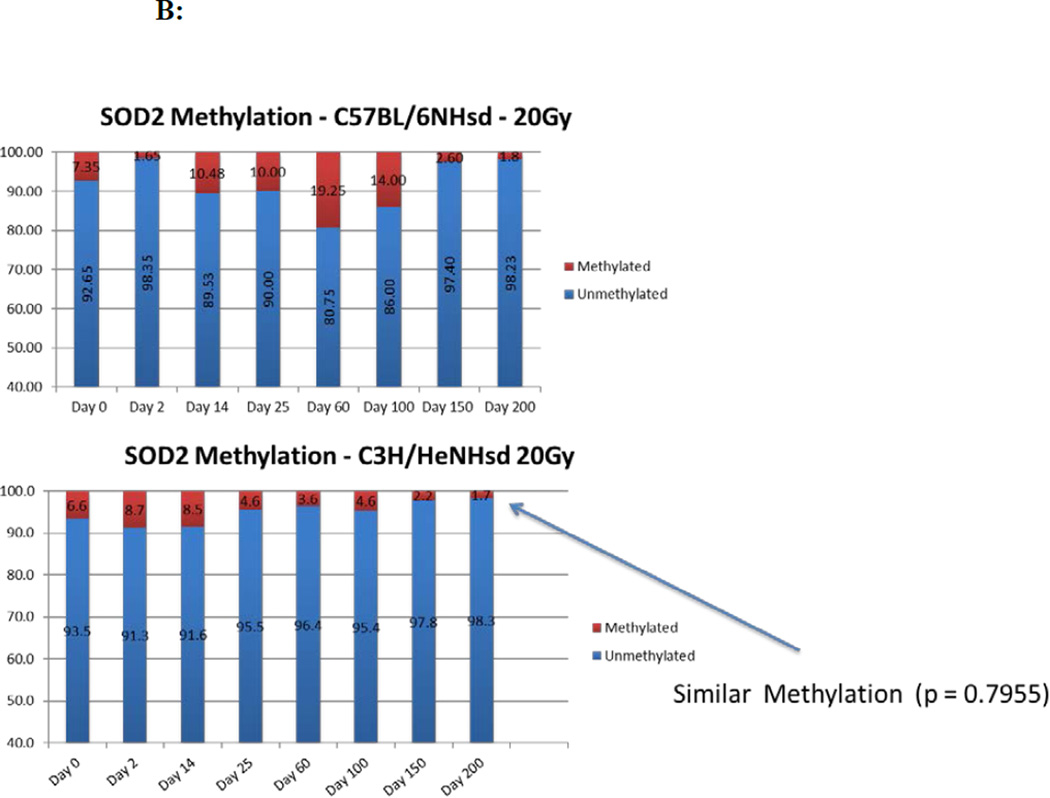
Figure 7. Different patterns in percentage CpG promoter methylation for specific genes in the lungs of 20 Gy thoracic irradiated C3H/HeNHsd compared to C57BL/6NHsd mice.
Lung tissue was removed from C57BL/6NHsd and C3H/HeNHsd female mice, DNA was extracted, and CpG promoter methylation status of genes related to fibrosis was evaluated for A) TGF-β, B) MnSOD (SOD2), C) FGF1, and D) IGFbp7). Each bar represents 100% of the promoter; the red portion represents percent methylation, and the blue portion represents percent unmethylated. There was concordance of increased methylation at respective time points where the corresponding gene transcript level was decreased. The pattern of data is shown in Table 2.
Table VI.
Percentage of DNA promoter methylation for 6 representative genes in the lungs of 20 Gy thoracic irradiated C57BL/6NHsd mice.
| day | TGFb | SOD2 | FGF1 | VEGFa | CTGF | IGFbp7 |
|---|---|---|---|---|---|---|
| 0 | 96.25±0.90 (n=4) |
92.65±1.18 (n=4) |
96.71±0.64 (n=4) |
95.10±0.77 (n=4) |
93.93±0.87 (n=4) |
95.23±0.73 (n=4) |
| 2 | 98.88±0.40 (n=4) |
98.35±0.54 (n=4) |
98.81±0.36 (n=4) |
98.50±0.84 (n=4) |
99.40±0.29 (n=4) |
81.84±1.68 (n=4) |
| p=0.0018 | p=0.0001 | p=0.0013 | p=0.0010 | p<0.0001 | p<0.0001 | |
| 14 | 88.28±2.39 (n=4) |
89.53±4.07 (n=4) |
92.50±2.38 (n=4) |
98.78±0.30 (n=4) |
97.80±0.55 (n=4) |
81.75±1.50 (n=4) |
| p=0.0008 | p=0.1908 | p=0.0143 | p=0.0001 | p=0.0003 | p<0.0001 | |
| 28 | 84.45±3.39 (n=4) |
90.00±2.16 (n=4) |
91.40±2.33 (n=4) |
98.70±0.55 (n=4) |
97.53±0.49 (n=4) |
82.50±2.38 (n=4) |
| p=0.0005 | p=0.0749 | p=0.0046 | p=0.0003 | p=0.0004 | p=0.0001 | |
| 75 | 75.08±3.15 (n=4) |
80.75±3.30 (n=4) |
86.63±0.97 (n=4) |
99.00±0.26 (n=4) |
97.00±0.92 (n=4) |
83.96±1.89 (n=4) |
| p<0.0001 | p=0.0005 | p<0.0001 | p=0.0001 | p=0.0028 | p<0.0001 | |
| 100 | 76.45±1.63 (n=4) |
86.00±1.88 (n=4) |
88.08±2.26 (n=4) |
98.30±0.48 (n=4) |
98.00±0.64 (n=4) |
90.85±1.74 (n=4) |
| p<0.0001 | p=0.0010 | p=0.0003 | p=0.0004 | p=0.0003 | p=0.0035 | |
| 150 | 96.83±0.64 (n=4) |
97.40±0.72 (n=4) |
95.88±1.17 (n=4) |
98.98±0.51 (n=4) |
99.43±0.43 (n=4) |
97.78±1.34 (n=4) |
| p=0.3378 | p=0.0005 | p=0.2582 | p=0.0002 | p<0.0001 | p=0.0156 | |
| 200 | 98.20±0.55 (n=4) |
98.23±0.53 (n=4) |
96.38±0.87 (n=4) |
98.43±0.46 (n=4) |
99.08±0.33 (n=4) |
98.30±0.39 (n=4) |
| p=0.0101 | p=0.0001 | p=0.5603 | p=0.0003 | p<0.0001 | p=0.0003 | |
Data summary using mean±SD and group comparisons for methylation data, where p is the p-value for the comparison of DNA promoter methylation percentage for the corresponding gene in lungs of C57BL/6NHsd mice between each day and day 0, using the two-sided two sample t-test.
The MnSOD (SOD2) CpG gene promoter methylation levels were similar in the lung tissues of both C57BL/6NHsd and C3H/HeNHsd mice irradiated to 20 Gy concordant with the observed similar levels of SOD2 transcripts (Fig. 7B).
Levels of demethylation of the CPG promoters for FGF1 (Fig. 7C) and IGFbp7 (Fig. 7D) were also concordant with the relative levels of transcripts. In C57BL/6NHsd mouse lung, the CpG promoter for the IGFbp7 gene showed stable methylation during the acute and latent period (19% and 17% respectively), followed by significant demethylation (<2% methylation) (Fig. 7D) during the late fibrosis stage consistent with increased transcript levels (Fig. 7C) (Table 6).
In C57BL/6NHsd mice, CpG promoters for the VEGF and CTGF gene showed significant demethylaton (<4% methylation) at day 150 following irradiation, consistent with levels of transcripts (Table 6). In contrast, lung tissue of C3H/HeNHsd mice irradiated to 20 Gy, showed VEGF and CTGF gene promoters had lower levels of demethylation consistent with the low levels of transcripts in these lung tissues. Therefore, levels of demethylation of specific gene promoters in lung tissue correlated with increased gene transcript levels for those same genes over 200 days after 20 Gy irradiation in both pulmonary fibrosis-prone C57BL/6NHsd and fibrosis-resistant C3H/HeNHsd mice.
Discussion
In the present studies, we measured levels of RNA transcript for 25 genes in the irradiated lungs of C3H/HeNHsd compared to C57BL/6NHsd mice. C57BL/6NHsd mice showed biphasic early and late increase in expression of NFkβ, Nrf2, SOD2, TGF-β, FGF1, SP1 and AP1 separated by a time period when levels were reduced. While C3H/HeNHsd mice also demonstrated irradiation-induced elevation of NFkβ, Sp1, and Ap1, levels of SOD2, TGF-β, and FGF1 were lower. Prior studies showed that relative levels of irradiated whole lung RNA transcripts correlated with levels in separated endothelial and epithelial cells (25); therefore, we did not separate these cell populations for the comparison of irradiation-induced lung transcripts between these two mouse strains. Twenty percent of C3H/HeNHsd mice irradiated to 20 Gy to the thoracic cavity died rapidly suggesting esophagitis or liver damage; however, no histopathologic evidence of injury to these organs was detected. Since gene transcript elevations in lower irradiation dose groups of C3H/HeNHsd mice were similar to the 20 Gy irradiation group, we compared the 80% lung irradiation survivors after 20 Gy in an attempt to detect differences in the response of the lung in this strain, which did not lead to the pulmonary fibrosis observed in 20 Gy irradiated C57BL/6NHsd mice.
There was prominent late elevation of RNA transcripts for toll-like receptor 4 (TLR4) and IGFbp7 in the irradiated C57BL/6NHsd lungs compared to low levels at the same late time points in C3H/HeNHsd mice. Macrophage TLR4 elevation occurs during lung inflammation (36–42), and promotes hepatic (43), and renal fibrosis (37). The low level of TLR4 expression in irradiated C3H/HeNHsd mouse lung is consistent with prior data showing that low TLR4 levels ameliorate pulmonary (41) and renal fibrosis (37, 44). However, other data report different patterns of TLR4 expression. One report showed that both TLR4 and TLR2 were required to induce pulmonary fibrosis (38). Another report showed that TLR4 elevation prevented bleomycin fibrosis (41). A mutation on exon 3 of the TLR4 gene in C3H/HeNHsd mice was associated with infection and aberrant Graft versus Host Disease responses, but these mice were still fibrosis-resistant (42). Since fibrosis-resistance in C3H/HeNHsd mice appears to be independent of levels of TLR4, it is unlikely that TLR4 is the single critical regulator of irradiation pulmonary fibrosis.
IGFbp7 transcript levels were increased in the irradiation-induced fibrotic lungs of C57BL/6NHsd mice. This cell adhesion molecule, promotes inflammation (45–46), is elevated in human scleroderma lungs and in lungs of patients with lung transplant rejection (28), is elevated in idiopathic pulmonary fibrosis (47), and abnormal wound repair. IGFbp7 downmodulates insulin-like growth factor 1 receptor, and inhibits cell growth and angiogenesis (8). IGFbp7 levels have been shown to correlate with slowed tumor progression suggesting that proliferating myofibroblasts in tumors and in fibrotic lungs of C57BL/6NHsd mice may also be examples of tissue responses in that strain (45–48).
A major observed difference between mouse strains was that involving pulmonary levels of transcripts for bromodomain epigenetic reader proteins Brd1, Brd2, Brd3, and Brd4. Bromodomain epigenetic reader proteins bind to the acetylated lysine group of Histone 4 (49) and modulate expression of genes including NFkβ (33, 50–56). These gene products can induce fibrosis (33) and alter cell cycle progression (57). Elevation of Brd1-4 transcripts in the lungs of C57BL/6NHsd mice during the period between the acute and fibrosis phases correlated with the time of decreased TGF-β, TNF-α, NFkβ, and Nrf-2. Decrease in bromodomain gene transcripts in C57BL/6NHsd mice at days 150 – 200 correlated with elevated levels of collagen1a, TGFβ, and TLR4, and in other studies (24) coincided with the time of both histopathologic lung fibrosis and bone marrow stromal cell homing to lungs. In contrast, stably elevated levels of Brd1-4 over 200 days post-irradiation in C3H/HeNHsd mice correlated with decreased levels of transcripts for vWF and VEGF.
BET bromodomain proteins, Brd2-4 are known to be associated with histones through mitotic divisions (32, 57). Our observation of low levels of Brd1-4 during fibrosis is inconsistent with prior publications showing that elevated Brd1-4 causes fibrosis (32–33). Our data are also inconsistent with that showing that low levels of Brd1-4 downregulate TLR4 (50–52, 58), which was elevated in irradiated C57BL/6NHsd mouse lungs as 150 days. Brd4 binds to and upregulates the promoter for the gene for the fibrogenic cytokine IL-6 (52, 55), and activates NFkβ, which is also upregulated during radiation fibrosis. Our data are consistent with a publication showing that Brd4 elevation inhibits bleomycin lung fibrosis in C57BL/6NHsd mice (33). This data is also consistent with our demonstration that Brd1-4 levels are elevated in irradiated fibrosis-resistant C3H/HeNHsd mice. Studies with a small molecule inhibitor of BRD proteins, should allow testing of the hypothesis that irradiation lung fibrosis can be initiated in C3H/HeNHsd mice by reducing Brd1-4 levels (59).
Irradiation pulmonary fibrosis has been linked to elevated levels of TGF- β1 (7, 60–61), interleukin 6 (IL-6) (9, 10) increased binding of NF-κB and AP-1 to the chemokine ligand 2 (CCL2) promoter (16), Insulin-Like Growth Factor Binding Protein (IGFBP)-3 (13), and to the induction of extracellular matrix protein Tenascin (TN)-C (14, 16). Irradiated C57BL/6NHsd mice are known to display increased lung levels of TGFβ (17, 24), but also showed greater levels of irradiation-induced apoptosis in thymocytes and intestinal crypts (62). C57BL/6NHsd mice are prone to bleomycin induced (18, 20, 22, 63) as well as irradiation-induced lung (31) and intestinal (62) fibrosis. In contrast, C3H/HeNHsd mice are known to resist not only irradiation pulmonary fibrosis (31), but also fibrosis caused by bleomycin (38), silica (64), ozone (65–66), and hyperoxia (67). Mouse strain specific propensity for radiation fibrosis could not be correlated with in vitro fibroblast radiosensitivity suggesting that a paracrine or indirect mechanism of cell signaling is involved in vivo (31). We did not detect differences in the histopathology of cardiac tissues between irradiated mouse strains, and injected luc+ stromal cell progenitors of fibrosis associated areas of the lung, did not home to the heart (25); however, differences in physiological cardiac response to thoracic irradiation may be involved in the etiology of both rapid death in C3H/HeNHsd mice and fibrous in lungs of C57BL/6NHsd mice.
While some molecular biologic pathways are common to multiple etiologies of pulmonary fibrosis (38, 52, 57), the present data revealed unique signatures associated with the onset of radiation pulmonary fibrosis in C57BL/6NHsd mice, prominently elevated TLR4 and a drop in transcripts and protein for the Brd4 epigenetic reader protein. Further studies will be required to elucidate the potential interactive role of these elevated or decreased gene transcripts in the mechanism of irradiation pulmonary fibrosis.
Table VII.
Percentage of DNA promoter methylation for 6 representative genes in the lungs of 20 Gy thoracic irradiated C3H/HeNHsd mice.
| day | TGFb | SOD2 | FGF1 | VEGFa | CTGF | IGFbp7 |
|---|---|---|---|---|---|---|
| 0 | 92.45±1.97 | 93.45±1.05 | 95.43±1.51 | 89.88±0.97 | 94.93±0.79 | 95.60±0.56 |
| (n=4) | (n=4) | (n=4) | (n=4) | (n=4) | (n=4) | |
| p2=0.0127 | p2=0.3512 | p2=0.1685 | p2=0.0002 | p2=0.1401 | p2=0.4542 | |
| 2 | 90.78±1.93 | 91.28±0.75 | 94.45±0.44 | 95.25±0.37 | 96.75±0.24 | 94.50±0.42 |
| (n=4) | (n=4) | (n=4) | (n=4) | (n=4) | (n=4) | |
| p1=0.2695 | p1=0.0153 | p1=0.2606 | p1<0.0001 | p1=0.0045 | p1=0.0197 | |
| p2=0.0027 | p2<0.0001 | p2<0.0001 | p2=0.0004 | p2<0.0001 | p2=0.0004 | |
| 14 | 95.23±0.86 | 91.55±0.60 | 94.40±0.61 | 95.95±0.26 | 97.45±0.37 | 94.00±0.62 |
| (n=4) | (n=4) | (n=4) | (n=4) | (n=4) | (n=4) | |
| p1=0.0415 | p1=0.0201 | p1=0.2536 | p1<0.0001 | p1=0.0012 | p1=0.0085 | |
| p2=0.0015 | p2=0.3948 | p2=0.2093 | p2<0.0001 | p2=0.3302 | p2<0.0001 | |
| 28 | 91.35±0.54 | 95.45±0.54 | 92.85±0.31 | 96.35±0.44 | 97.85±0.34 | 94.93±0.43 |
| (n=4) | (n=4) | (n=4) | (n=4) | (n=4) | (n=4) | |
| p1=0.3229 | p1=0.0150 | p1=0.0391 | p1<0.0001 | p1=0.0005 | p1=0.1037 | |
| p2=0.0251 | p2=0.0123 | p2=0.3016 | p2=0.0006 | p2=0.3156 | p2=0.0015 | |
| 75 | 91.05±0.83 | 96.43±0.42 | 94.40±0.43 | 96.28±0.44 | 97.63±0.53 | 94.88±0.33 |
| (n=4) | (n=4) | (n=4) | (n=4) | (n=4) | (n=4) | |
| p1=0.2383 | p1=0.0019 | p1=0.2387 | p1<0.0001 | p1=0.0013 | p1=0.0672 | |
| p2=0.0001 | p2=0.0022 | p2<0.0001 | p2<0.0001 | p2=0.2840 | p2=0.0011 | |
| 100 | 87.50±3.11 | 95.43±0.46 | 94.20±0.77 | 96.68±1.00 | 96.88±0.93 | 93.35±0.54 |
| (n=4) | (n=4) | (n=4) | (n=4) | (n=4) | (n=4) | |
| p1=0.0360 | p1=0.0138 | p1=0.1982 | p1=0.0001 | p1=0.0188 | p1=0.0012 | |
| p2=0.0007 | p2=0.0014 | p2=0.0021 | p2=0.0268 | p2=0.0928 | p2=0.0336 | |
| 150 | 91.10±2.11 | 97.83±0.91 | 94.98±1.01 | 97.20±0.70 | 96.28±0.81 | 92.60±0.95 |
| (n=4) | (n=4) | (n=4) | (n=4) | (n=4) | (n=4) | |
| p1=0.3853 | p1=0.0008 | p1=0.6372 | p1<0.0001 | p1=0.0551 | p1=0.0016 | |
| p2=0.0020 | p2=0.4908 | p2=0.2874 | p2=0.0063 | p2=0.0005 | p2=0.0007 | |
| 200 | 90.60±1.27 | 98.33±0.51 | 94.10±0.65 | 97.50±0.63 | 97.33±0.36 | 91.28±0.53 |
| (n=4) | (n=4) | (n=4) | (n=4) | (n=4) | (n=4) | |
| p1=0.1656 | p1=0.0002 | p1=0.1572 | p1<0.0001 | p1=0.0015 | p1<0.0001 | |
| p2<0.0001 | p2=0.7955 | p2=0.0056 | p2=0.0545 | p2=0.0004 | p2<0.0001 | |
Data summary using mean ± SD and group comparisons for percent methylation, where p1 is the p-value for the comparison of DNA promoter methylation percentage for the corresponding gene in the lungs of C3H/HeNHsd mice between each day and day 0, p2 is the p-value for the comparison of DNA promoter methylation percentage between C57BL/6NHsd mice and C3H/HeNHsd mice at the corresponding day for the corresponding gene. All p-values were calculated with the two-sided two sample t-test.
Acknowledgements
Supported by NIH Grants CA-R01-CA119927 and NIAID U19-A1068021.
Footnotes
Presented at the ASTRO 55th Annual Meeting, Atlanta, Georgia 9/22 – 9/25/2013
References
- 1.Kim TH, Cho KH, Pyo HR, Lee JS, Zo JI, Lee DH, Lee JM, Kim HY, Hwangbo B, Park SY, Kim JY, Shin KH, Kim DY. Dose-volumetric parameters for predicting severe radiation pneumonitis after three-dimensional conformal radiation therapy for lung cancer. Radiology. 2005;234:208–215. doi: 10.1148/radiol.2351040248. [DOI] [PubMed] [Google Scholar]
- 2.Dang J, Li G, Ma L, Diao R, Zang S, Han C, Zhang S, Yao L. Predictors of grade ≥2 and grade ≥3 radiation pneumonitis in patients with locally advanced non-small cell lung cancer treated with three-dimensional conformal radiotherapy. Acta Oncol. 2013;52(6):1175–1180. doi: 10.3109/0284186X.2012.747696. [DOI] [PubMed] [Google Scholar]
- 3.Parashar B, Edwards A, Mehta R, Pasmantier M, Wernicke AG, Sabbas A, Kerestez RS, Nori D, Chao KS. Chemotherapy significantly increases the risk of radiation pneumonitis in radiation therapy of advanced lung cancer. Am J Clin Oncol. 2011;34:160–164. doi: 10.1097/COC.0b013e3181d6b40f. [DOI] [PubMed] [Google Scholar]
- 4.Ruben P, Casarett GW. Clinical Radiation Pathology. Philadelphia: Saunders; 1968. [DOI] [PubMed] [Google Scholar]
- 5.Williams JP, Johnston CJ, Finkelstein JN. Treatment for radiation-induced pulmonary late effects: spoiled for choice or looking in the wrong direction? Curr Drug Targets. 2010;11:1386–1394. doi: 10.2174/1389450111009011386. [DOI] [PMC free article] [PubMed] [Google Scholar]
- 6.Movsas B, Raffin TA, Epstein AH, Link CJ., Jr Pulmonary radiation injury. Chest. 1997;111:1061–1076. doi: 10.1378/chest.111.4.1061. [DOI] [PubMed] [Google Scholar]
- 7.Anscher MS. Targeting the TGF-beta 1 pathway to prevent normal tissue injury after cancer therapy. Oncologist. 2010;15(4):350–359. doi: 10.1634/theoncologist.2009-S101. [DOI] [PMC free article] [PubMed] [Google Scholar]
- 8.Chen D, Yoo BK, Santhekadur PK, Gredler R, Bhutia SK, Das SK, Fuller C, Su ZZ, Fisher PB, Sarkar D. Insulin-like growth factor-binding protein-7 functions as a potential tumor suppressor in hepatocellular carcinoma. Clin Cancer Res. 2011;17(21):6693–6701. doi: 10.1158/1078-0432.CCR-10-2774. [DOI] [PMC free article] [PubMed] [Google Scholar]
- 9.Chen Y, Rubin P, Williams J, Hernady E, Smudzin T, Okunieff P. Circulating IL-6 as a predictor of radiation pneumonitis. Int J Radiat Oncol Biol Phys. 2001;49(3):641–648. doi: 10.1016/s0360-3016(00)01445-0. [DOI] [PubMed] [Google Scholar]
- 10.Arpin D, Perol D, Blay JY, Falchero L, Claude L, Vuillermoz-Blas S, Martel- Lafay I, Ginestet C, Alberti L, Nosov D, Etienne-Mastroianni B, Cottin V, Perol M, Guerin JC, Cordier JF, Carrie C. Early variations of circulating interleukin-6 and interleukin-10 levels during thoracic radiotherapy are predictive for radiation pneumonitis. J Clin Onc. 2005;23(34):8748–8756. doi: 10.1200/JCO.2005.01.7145. [DOI] [PubMed] [Google Scholar]
- 11.Mazeron R, Etienne-Mastroianni B, Perol D, Arpin D, Vincent M, Falchero L, Martel-Lafay I, Carrie C, Claude L. Predictive factors of late radiation fibrosis: a prospective study in non-small cell lung cancer. Int J Radiat Oncol Biol Phys. 2007;77(1):38–43. doi: 10.1016/j.ijrobp.2009.04.019. [DOI] [PubMed] [Google Scholar]
- 12.Moeller A, et al. Models of pulmonary fibrosis. Drug Discovery Today: disease models. 2006;3:243–249. [Google Scholar]
- 13.Brissett M, Veraldi KL, Pilewski JM, Medsger TA, Jr, Feghali-Bostwick CA. Localized expression of tenascin in systemic sclerosis-associated pulmonary fibrosis and its regulation by insulin-like growth factor binding protein 3. Arthritis Rheum. 2012;64(1):272–280. doi: 10.1002/art.30647. [DOI] [PMC free article] [PubMed] [Google Scholar]
- 14.Wehrhan F, Rodel F, Grabenbauer GG, Amann K, Bruckl W, Schultze-Mosgau S. Transforming growth factor beta 1 dependent regulation of tenascin-C in radiation impaired wound healing. Radiother Oncol. 2004;72:297–303. doi: 10.1016/j.radonc.2004.07.011. [DOI] [PubMed] [Google Scholar]
- 15.Rosiello RA, Merrill WW. Radiation-induced lung injury. Clin Chest Med. 1990;11(1):65–71. [PubMed] [Google Scholar]
- 16.Deng X, Xu M, Yuan C, Yin L, Chen X, Zhou X, Li G, Fu Y, Feghali-Bostwick CA, Pang L. Transcriptional regulation of increased CCL2 expression in pulmonary fibrosis involves nuclear factor-KB and activator protein-1. Int J Biochem Cell Biol. 2013;45(7):1366–1376. doi: 10.1016/j.biocel.2013.04.003. [DOI] [PubMed] [Google Scholar]
- 17.Johnston CJ, Piedboeuf B, Baggs R, Rubin P, Finkelstein JN. Differences in correlation of mRNA gene expression in mice sensitive and resistant to radiation-induced pulmonary fibrosis. Radiat Res. 1995;142(2):197–203. [PubMed] [Google Scholar]
- 18.Haston C, Travis E. Murine susceptibility to radiation-induced pulmonary fibrosis is influenced by a genetic factor implicated in susceptibility to bleomycininduced pulmonary fibrosis. Cancer Res. 1997;57:5286–5291. [PubMed] [Google Scholar]
- 19.Franko AJ, Sharplin J, Ward WF, Taylor JM. Evidence for two patterns of inheritance of sensitivity to induction of lung fibrosis in mice by radiation, one of which involves two genes. Radiat Res. 1996;146:68–74. [PubMed] [Google Scholar]
- 20.Haston CK, Zhou X, Gumbiner-Russo L, Irani R, Dejournett R, Gu X, Weil M, Amos CI, Travis EL. Universal and radiation-specific loci influence murine susceptibility to radiation-induced pulmonary fibrosis. Cancer Res. 2002;62(13):3782–3788. [PubMed] [Google Scholar]
- 21.Jackson IL, Xu P, Hadley C, Katz BP, McGurk R, Down JD, Vujaskovic Z. A preclinical rodent model of radiation-induced lung injury for medical countermeasure screening in accordance with the FDA animal rule. Health Phys. 2012;103(4):463–473. doi: 10.1097/HP.0b013e31826386ef. [DOI] [PMC free article] [PubMed] [Google Scholar]
- 22.Haston CK, Wang M, Dejournett RE, Zhou X, Ni D, Gu X, King TM, Weil MM, Newman RA, Amos CI, Travis EL. Bleomycin hydrolase and a genetic locus within the MHC affect risk for pulmonary fibrosis in mice. Hum Mol Genet. 2002;11(16):1855–1863. doi: 10.1093/hmg/11.16.1855. [DOI] [PubMed] [Google Scholar]
- 23.Epperly M, Guo H, Gretton JE, Greenberger JS. Bone marrow origin of myofibroblasts in irradiation pulmonary fibrosis. Am J Respir Cell Mol Biol. 2003;29:213–224. doi: 10.1165/rcmb.2002-0069OC. [DOI] [PubMed] [Google Scholar]
- 24.Kalash R, Epperly MW, Goff J, Dixon T, Sprachman MM, Zhang X, Shields D, Cao S, Franicola D, Wipf P, Berhane H, Wang H, Au J, Greenberger JS. Amelioration of irradiation pulmonary fibrosis by a water-soluble bi-functional Sulfoxide radiation mitigator (MMS350) Radiat Res. 2013;180(5):474–490. doi: 10.1667/RR3233.1. [DOI] [PMC free article] [PubMed] [Google Scholar]
- 25.Kalash R, Berhane H, Goff J, Houghton F, Epperly MW, Dixon T, Zhang X, Sprachman MM, Wipf P, Franicola D, Wang H, Greenberger JS. Thoracic irradiation effects on pulmonary endothelial compared to alveolar type II cells in fibrosis prone C57BL/6NTac mice. In Vivo. 2013;27:291–298. [PMC free article] [PubMed] [Google Scholar]
- 26.Paris F, Fuks Z, Kang A, Capodieci P, Juan G, Ehleiter D, Haimovitz-Freidman A, Cordon-Cardo C, Kolesnick R. Endothelial apoptosis as the primary lesion initiating intestinal radiation damage in mice. Science. 2001;293:293–297. doi: 10.1126/science.1060191. [DOI] [PubMed] [Google Scholar]
- 27.Epperly MW, Travis EL, Sikora C, Greenberger JS. Magnesium superoxide dismutase (MnSOD) plasmid/liposome pulmonary radioprotective gene therapy: Modulation of irradiation-induced mRNA for IL-1, TNF-α, and TGF-β correlates with delay of organizing alveolitis/fibrosis. Biology of Blood and marrow Transplantation. 1999;5:204–214. doi: 10.1053/bbmt.1999.v5.pm10465100. [DOI] [PubMed] [Google Scholar]
- 28.Hsu E, Shi H, Jordan RM, Lyons-Weiler J, Pilewski JM, Feghali-Bostwick CA. Lung tissues in patients with systemic sclerosis have gene expression patterns unique to pulmonary fibrosis and pulmonary hypertension. Arthritis Rheum. 2011;63(3):783–794. doi: 10.1002/art.30159. [DOI] [PMC free article] [PubMed] [Google Scholar]
- 29.Paun A, Fox J, Balloy V, Chignard M, Qureshi ST, Haston CK. Combined Tlr2 and Tlr4 deficiency increases radiation-induced pulmonary fibrosis in mice. Int J Radiat Oncol Biol Phys. 2010;77(4):1198–1205. doi: 10.1016/j.ijrobp.2009.12.065. [DOI] [PubMed] [Google Scholar]
- 30.Pulskens W, Rampanelli E, Teske GJ, Butter LM, Claessen N, Luirink IK, van der Poll T, Florquin S, Leemans JC. TLR4 promotes fibrosis but attenuates tubular damage in progressive renal injury. J Am Soc Nephrol. 2010;21(8):1299–1308. doi: 10.1681/ASN.2009070722. [DOI] [PMC free article] [PubMed] [Google Scholar]
- 31.Dileto CL, Travis EL. Fibroblast radiosensitivity in vitro and lung fibrosis in vivo: comparison between a fibrosis-prone and fibrosis-resistant mouse strain. Radiat Res. 1996;146(1):61–67. [PubMed] [Google Scholar]
- 32.Tang X, Peng R, Phillips JE, Deguzman J, Ren Y, Apparsundaram S, Luo Q, Bauer CM, Fuentes ME, DeMartino JA, Tyagi G, Garrido R, Hogaboam CM, Denton CP, Holmes AM, Kitson C, Stevenson CS, Bud DC. Assessment of Brd4 inhibition in idiopathic pulmonary fibrosis lung fibroblasts and in vivo models of lung fibrosis. Am J Pathol. 2013;183(2):470–479. doi: 10.1016/j.ajpath.2013.04.020. [DOI] [PubMed] [Google Scholar]
- 33.Tang X, Peng R, Ren Y, Apparsundaram S, Deguzman J, Bauer CM, Hoffman AF, Hamilton S, Liang Z, Zeng H, Fuentes ME, Demartino JA, Kitson C, Stevenson CS, Budd DC. BET bromodomain proteins mediate downstream signaling events following growth factor stimulation in human lung fibroblasts and are involved in bleomycininduced pulmonary fibrosis. Mol Pharmacol. 2013;83:283–293. doi: 10.1124/mol.112.081661. [DOI] [PubMed] [Google Scholar]
- 34.Rajagopalan MS, Stone B, Rwigema JC, Salimi U, Epperly MW, Goff J, Franicola D, Dixon T, Cao S, Zhang X, Buchholz BM, Bauer AJ, Choi S, Bakkenist C, Wang H, Greenberger JS. Intraesophageal manganese superoxide dismutase-plasmid liposomes ameliorates novel total body and thoracic irradiation sensitivity of homologous 33 deletion recombinant negative nitric oxide synthase-1 (NOS−/−) mice. Radiat Res. 2010;174:297–312. doi: 10.1667/RR2019.1. [DOI] [PMC free article] [PubMed] [Google Scholar]
- 35.He Z, Zhu Y, Jiang H. Inhibiting toll-like receptor 4 signaling ameliorates pulmonary fibrosis during acute lung injury induced by lipopolysaccharide: an experimental study. Respir Res. 2009;10:126. doi: 10.1186/1465-9921-10-126. [DOI] [PMC free article] [PubMed] [Google Scholar]
- 36.Stramer BM, Mori R, Martin P. The inflammation-fibrosis link? A Jekyll and Hyde role for blood cells during wound repair. J Invest Dermatol. 2007;127:1009–1017. doi: 10.1038/sj.jid.5700811. [DOI] [PubMed] [Google Scholar]
- 37.Wynn TA. Cellular and molecular mechanisms of fibrosis. The Journal of Pathology. 2008;214:199–210. doi: 10.1002/path.2277. [DOI] [PMC free article] [PubMed] [Google Scholar]
- 38.Paun A, Lemay AM, Haston CK. Gene expression profiling distinguishes radiation-induced fibrosing alevolitis from alveolitis in mice. Radiat Res. 2010;173(4):512–521. doi: 10.1667/RR1798.1. [DOI] [PubMed] [Google Scholar]
- 39.Imado T, Iwasaki T, Kitano S, Santake A, Kuroiwa T, Tsunemi S, Sano H. The protective role of host Toll-like receptor-4 in acute graft-versus-host disease. Transplantation. 2010;90(10):1063–1070. doi: 10.1097/TP.0b013e3181f86947. [DOI] [PubMed] [Google Scholar]
- 40.Margaritopoulos GA, Antoniou KM, Karagiannis K, Samara KD, Lasithiotaki I, Vassalou E, Lymbouridou R, Koutala H, Siafakas NM. Investigation of Toll-like receptors in the pathogenesis of fibrotic and granulomatous disorders: a bronchoalveolar lavage study. Fibrogenesis Tissue Repair. 2010;3:20. doi: 10.1186/1755-1536-3-20. [DOI] [PMC free article] [PubMed] [Google Scholar]
- 41.Yang H-Z, Wang JP, Mi S, Liu HZ, Cui B, Yan HM, Yan J, Li Z, Liu H, Hua F, Lu W, Hu ZW. TLR4 activity is required in the resolution of pulmonary inflammation and fibrosis after acute and chronic lung injury. Am J Pathol. 2012;180(1):274–292. doi: 10.1016/j.ajpath.2011.09.019. [DOI] [PubMed] [Google Scholar]
- 42.Poltorak A, He X, Smirnova I, Liu MY, Van Huffel C, Du X, Birdwell D, Alejos E, Silva M, Galanos C, Freudenberg M, Ricciardi-Castagnoli P, Layton B, Beutler B. Defective LPS signaling in C3H/HeJ and C57BL/10ScCr mice: mutations in Tlr4 gene. Science. 1998;282(5396):2085–2088. doi: 10.1126/science.282.5396.2085. [DOI] [PubMed] [Google Scholar]
- 43.Seki E, De Minicis S, Osterreicher CH, Kluwe J, Osawa Y, Brenner DA, Schwabe RF. TLR4 enhances TGF-beta signaling and hepatic fibrosis. Nat Med. 2007;13(11):1324–1332. doi: 10.1038/nm1663. [DOI] [PubMed] [Google Scholar]
- 44.LeBleu VS, Taduri G, O’Connell J, Teng Y, Cooke VG, Woda C, Sugimoto H, Kalluri R. Origin and function of myofibroblasts in kidney fibrosis. Nat Med. 2013;19(8):1047–1052. doi: 10.1038/nm.3218. [DOI] [PMC free article] [PubMed] [Google Scholar]
- 45.Herman JG, Baylin SB. Gene silencing in cancer in association with promoter hypermethylation. New England Journal of Medicine. 2003;349:2042–2054. doi: 10.1056/NEJMra023075. [DOI] [PubMed] [Google Scholar]
- 46.Darr J, Klochendler A, Isaac S, Eden A. Loss of IGFBP7 expression and persistent AKT activation contribute to SMARCB1/Snf5-mediated tumorigenesis. Oncogene Advance On-Line publication. 2013 doi: 10.1038/onc.2013.261. [DOI] [PubMed] [Google Scholar]
- 47.Allen JT, Knight RA, Bloor CA, Spiteri MA. Enhanced insulin-like growth factor binding protein-related protein 2 (connective tissue growth factor) expression in 35 patients with idiopathic pulmonary fibrosis and pulmonary sarcoidosis. American Journal Respiratory Cell Molecular Biology. 1999;21(6):693–700. doi: 10.1165/ajrcmb.21.6.3719. [DOI] [PubMed] [Google Scholar]
- 48.Chen Z, Lu F, Fang H, Huang H. Effect of mesenchymal stem cells on renal injury in rats with severe acute pancreatitis. Exp Biol Med. 2013;238:687–695. doi: 10.1177/1535370213490629. [DOI] [PubMed] [Google Scholar]
- 49.Zeng L, Ming-Ming Z. Bromodomain: an acetyl-lysine binding domain. FEBS Letters. 2002;513:124–128. doi: 10.1016/s0014-5793(01)03309-9. [DOI] [PubMed] [Google Scholar]
- 50.Zhang G, Liu R, Zhong Y, Plotnikov AN, Zhang W, Zeng L, Rusinova E, Gerona-Nevarro G, Moshkina N, Joshua J, Chuang PY, Ohlmeyer M, He JC, Zhou MM. Down-regulation of NF-kb transcriptional activity in HIV activity in HIV-associated kidney disease by BRD4 inhibition. J Biol Chem. 2012;287:28840–28851. doi: 10.1074/jbc.M112.359505. [DOI] [PMC free article] [PubMed] [Google Scholar]
- 51.Zhang W, Prakash C, Sum C, Gong Y, Li Y, Kwok JJ, Thiessen N, Pettersson S, Jones SJ, Knapp S, Yang H, Chin KC. Bromodomain-containing protein 4 (BRD4) regulates RNA polymerase II serine 2 phosphorylation in human CD4+ T cells. J Biol Chem. 2012;287(51):43137–43155. doi: 10.1074/jbc.M112.413047. [DOI] [PMC free article] [PubMed] [Google Scholar]
- 52.Belkina AC, Nikolajczyk BS, Denis GV. BET protein function is required for inflammation: Brd2 genetic disruption and BET inhibitor JQ1 impair mouse macrophage inflammatory responses. J Immunol. 2013;190(7):3670–3678. doi: 10.4049/jimmunol.1202838. [DOI] [PMC free article] [PubMed] [Google Scholar]
- 53.Belkina AC, Denis GV. BET domain co-regulators in obesity, inflammation, and cancer. Nature Review Cancer. 2012;12(7):465–477. doi: 10.1038/nrc3256. [DOI] [PMC free article] [PubMed] [Google Scholar]
- 54.Nicodeme E, Jeffrey KL, Schaefer U, Beinke S, Dewell S, Chung CW, Chandwani R, Marazzi I, Wilson P, Coste H, White J, Kirilovsky J, Rice CM, Lora JM, Prinjha RK, Lee K, Tarakhovsky A. Suppression of inflammation by a synthetic histone mimic. Nature. 2010;468:1119–1123. doi: 10.1038/nature09589. [DOI] [PMC free article] [PubMed] [Google Scholar]
- 55.Muller S, Filippakopoulos P, Knapp S. Bromodomains as therapeutic targets. Expert Rev Mol Med. 2011;13:e29. doi: 10.1017/S1462399411001992. [DOI] [PMC free article] [PubMed] [Google Scholar]
- 56.Huang B, Yang XD, Zhou MM, Ozato K, Chen LF. Brd4 coactivates transcriptional activation of NF-kappaB via specific binding to acetylated RE1A. Mol Cell Biol. 2009;29(5):1375–1387. doi: 10.1128/MCB.01365-08. [DOI] [PMC free article] [PubMed] [Google Scholar]
- 57.Tsukui T, Ueha S, Abe J, Hashimoto S, Shichino S, Shimaoka T, Shand FH, Arakawa Y, Oshima K, Hattori M, Inagaki Y, Tomura M, Matsushima K. Qualitative rather than quantitative changes are hallmarks of fibroblasts in bleomycin-induced pulmonary fibrosis. Am J Pathol. 2013;183(3):758–773. doi: 10.1016/j.ajpath.2013.06.005. [DOI] [PubMed] [Google Scholar]
- 58.Lockwood WW, Zejnullahu K, Bradner JE, Varmus H. Sensitivity of human lung adenocarcinoma cell lines to targeted inhibition of BET epigenetic signaling proteins. Proc Natl Acad Sci USA. 2012;109(47):19408–19413. doi: 10.1073/pnas.1216363109. [DOI] [PMC free article] [PubMed] [Google Scholar]
- 59.Floyd SR, Pacold ME, Huang Q, Clarke SM, Lam FC, Cannell IG, Bryson BD, Rameseder J, Lee MJ, Blake EJ, Fydrych A, Ho R, Greenberger BA, Chen GC, Maffa A, Del Rosario AM, Root DE, Carpenter AE, Hahn WC, Sabatini DM, Chen CC, White FM, Bradner JE, Yaffe MB. The bromodomain protein Brd4 insulates chromatin from DNA damage signaling. Nature. 2013;498:246–254. doi: 10.1038/nature12147. [DOI] [PMC free article] [PubMed] [Google Scholar]
- 60.Martin M, Lefaix J, Delanian S. TGF-beta1 and radiation fibrosis: a master switch and a specific therapeutic target? Int J Radiat Oncol Biol Phys. 2000;47(2):277–290. doi: 10.1016/s0360-3016(00)00435-1. [DOI] [PubMed] [Google Scholar]
- 61.Bhattacharyya S, Wu M, Fang F, Tourtellotte W, Feghali-Bostwick C, Varga J. Early growth response transcription factors: key mediators of fibrosis and novel targets for anti-fibrotic therapy. Matrix Biol. 2011;30(4):235–242. doi: 10.1016/j.matbio.2011.03.005. [DOI] [PMC free article] [PubMed] [Google Scholar]
- 62.Skwarchuk M, Travis E. Changes in histology and fibrogenic cytokines in irradiated colorectum of two murine strains. Int J Radiat Oncol Biol Phys. 1998;42:169–178. doi: 10.1016/s0360-3016(98)00201-6. [DOI] [PubMed] [Google Scholar]
- 63.Haston CK, Amos CI, King TM, Travis EL. Inheritance of susceptibility to bleomycin-induced pulmonary fibrosis in the mouse. Cancer Res. 1996;56:2596–2601. [PubMed] [Google Scholar]
- 64.Ohtsuka Y, Brunson KJ, Jedlicka AE, Mitzner W, Clarke RW, Zhang LY, Eleff SM, Kleeberger SR. Genetic linkage analysis of susceptibility to particle exposure in mice. Am J Respir Cell Mol Biol. 2000;22(5):574–581. doi: 10.1165/ajrcmb.22.5.3895. [DOI] [PubMed] [Google Scholar]
- 65.Kleeberger SR, Bassett DJ, Jakab GJ, Levitt RC. A genetic model for evaluation of susceptibility to ozone-induced inflammation. Am J Physiol. 1990;258:L313–L320. doi: 10.1152/ajplung.1990.258.6.L313. [DOI] [PubMed] [Google Scholar]
- 66.Kleeberger SR, Levitt RC, Zhang LY, Longphre M, Harkema J, Jedicka A, Eleff SM, DiSilvestre D, Holroyd KJ. Linkage analysis of susceptibility to ozone-induced lung inflammation in inbred mice. Nat Genet. 1997;17(4):475–478. doi: 10.1038/ng1297-475. [DOI] [PubMed] [Google Scholar]
- 67.Hudak BB, Zhang LY, Kleeberger SR. Inter-strain variation in susceptibility to hyperoxic injury of murine airways. Pharmacogenetics. 1993;3:135–143. doi: 10.1097/00008571-199306000-00003. [DOI] [PubMed] [Google Scholar]


