

Supplemental digital content is available in the text.
Key Words: exocrine pancreas, ZDF rats, high-fat diet, fat accumulation, fibrosis, acinar cell injury
Abstract
Objective
The histological alteration of the exocrine pancreas in obesity has not been clarified. In the present study, we investigated biochemical and histological changes in the exocrine pancreas of obese model rats.
Methods
Zucker lean rats were fed a standard diet, and Zucker diabetic fatty (ZDF) rats were divided into 2 groups fed a standard diet and a high-fat diet, respectively. These experimental groups were fed each of the diets from 6 weeks until 12, 18, 24 weeks of age. We performed blood biochemical assays and histological analysis of the pancreas.
Results
In the ZDF rats fed a high-fat diet, the ratio of accumulated pancreatic fat area relative to exocrine gland area was increased significantly at 18 weeks of age in comparison with the other 2 groups (P < 0.05), and lipid droplets were observed in acinar cells. Subsequently, at 24 weeks of age in this group, pancreatic fibrosis and the serum exocrine pancreatic enzyme levels were increased significantly relative to the other 2 groups (P < 0.01).
Conclusions
In ZDF rats fed a chronic high-fat diet, fat accumulates in pancreatic acinar cells, and this fatty change seems to be related to subsequent pancreatic fibrosis and acinar cell injury.
Obesity is strongly associated with type 2 diabetes (T2DM), being a major risk factor for this disease.1 Excess food energy is stored as triglyceride (TG) in adipose tissue, but chronic overnutrition above the storage capacity of adipose tissue causes TG to become deposited in the internal organs, leading to steatosis and organ dysfunction,2 a condition referred to as metabolic syndrome (MS). Furthermore, accumulation of TG within cells, including pancreatic islets, is thought to be a significant determinant of peripheral insulin resistance and β-cell failure, resulting in the development of T2DM.
Previous studies have demonstrated deterioration of insulin secretion and reduction of β-cell mass in Zucker diabetic fatty (ZDF) rats, an animal model of T2DM.3–6 Other studies have reported a relationship between elevated levels of nonesterized fatty acids (NEFAs) and β-cell dysfunction.7,8 Similarly, it has been reported that infiltration of macrophages into islets,9 increased oxidative stress,10 and lipoapoptosis of β cells reduce the sensitivity of insulin secretion and lead to β-cell failure, leading to so-called “lipotoxicity” in the animal model of T2DM.3 Also, in human patients with T2DM, several studies have demonstrated a decrease in both the mass and secretory function of insulin-producing β cells.11–13 These previous studies have yielded a comprehensive picture of the endocrine pancreas, particularly β cells, in obesity and T2DM.
Pancreatic lipomatosis is a condition characterized by infiltration of fat into and around the pancreas in human patients with T2DM,14 and a number of investigations have focused on the interlobular pancreatic fat accumulation in animals fed a high-fat diet15,16 and the influence of diet on the exocrine secretion of pancreatic enzymes.17–19 Recently, 1 study of pancreatic injury in an animal model of hyperlipidemia using comparative proteomic analysis has suggested that α-amylase may be a putative biomarker of hyperlipidemia-mediated pancreatic injury.20 However, much remains unclear about the histological changes associated with obesity, including fat accumulation, fibrosis, and functional changes in the exocrine pancreas.
The objective of the present study, therefore, was to evaluate the biochemical and histological changes in pancreatic tissue, particularly the exocrine glands, in obese and T2DM model rats, and also to clarify the long-term changes in obesity and T2DM associated with 1 more additional factor, intake of a chronic high-fat diet.
MATERIALS AND METHODS
Animals and Diets
Fifty-two male ZDF rats (Leprfa/Leprfa) and 24 male ZDF lean rats (Leprfa/+) were purchased from Charles River (Cambridge, Mass). The ZDF rat, having a deficiency of the leptin receptor gene, is a classic model of insulin resistance and T2DM with features resembling human MS. All animals were housed 2 per cage and maintained under a 12-hour light-dark cycle with free access to food and water. All ZDF lean rats were fed with a standard diet (10% of calories from fat, 70% from carbohydrate, 20% from protein) (the LS group), 24 ZDF (fa/fa) rats were also fed with the standard diet (the FS group), and 28 ZDF (fa/fa) rats were fed with the high-fat diet (45% of calories from fat, 35% from carbohydrate, 20% from protein) (the FH group) from 6 weeks until 12, 18, or 24 weeks of age; the numbers in each experimental group were 8, except the FH group at 12 (n = 9) and 24 (n = 11) weeks of age. The type of fat in each diet was lard. To determine growth and dietary intake, we measured the animal body weight once a week and food intake for 1 week, then calculated an average daily intake. Caloric content of diet was determined based on 3.85 kcal/g for the standard diet and 4.73 kcal/g for the high-fat diet. All animal procedures were approved by the institutional animal care and use committee of the Yamagata University.
Blood and Tissue Collection
After a 12-hour fast with water allowed ad libitum, 8 to 11 rats per group were weighed and then dissected after being sedated by placing them in a 2000-cm3 glass jar containing an isoflurane-soaked gauze, subsequently anesthetized with an intraperitoneal injection of ketamine (50 mg/kg). All animals underwent laparotomy and total pancreatectomy. We took body-tail pancreatic tissue, because the pancreas head tissue of rodents is lobulated, and interlobular adipose tissue can be confused with peritoneal adipose tissue. Two samples of pancreatic tissue from each group were taken and fixed in 10% formaldehyde at room temperature for histological analysis, and the remaining specimens were frozen at −80°C for measurement of pancreatic tissue fat content. All visible adipose tissue adhering to pancreas samples was thoroughly removed. Blood samples were taken from the inferior vena cava, then centrifuged at 15,000 revolutions/min for separation of the serum, and stored at −80°C until use for several assays.
Blood Biochemical Analysis
Plasma levels of TG, total cholesterol (TCH), NEFAs, and glucose were measured using the TG E test, TCH E test, NEFA C test, and glucose test (Wako Pure Chemical Industries, Osaka, Japan), respectively. Serum amylase and lipase were measured using commercial kits on a Bio Majesty JCA-BM8060 autoanalyzer (Japan Electron Optics Laboratory, Tokyo, Japan). The following levels were determined with commercially available kits: plasma adiponectin levels using an adiponectin enzyme-linked immunosorbent assay (ELISA) kit (Otsuka, Tokyo, Japan), insulin levels using an insulin ELISA kit 010T (Shibayagi, Gunma, Japan), TNF-α levels using a TNF-α ELISA kit (R&D Systems, Minneapolis, Minn), and monocyte chemoattractant protein 1 (MCP-1) levels using an MCP-1 ELISA kit (Thermo Fisher Scientific, Rockford, Ill).
Histological Analysis
Each formalin-fixed and paraffin-embedded specimen was cut into sections 3 µm thick. Staining was performed with hematoxylin-eosin (H&E) and Masson trichrome (MT) for routine histological observations.
For lipid staining with oil red O (Sigma-Aldrich Japan, Tokyo, Japan), each sample of frozen pancreatic tissue was embedded in Optimal Cutting Temperature compound (Sakura Finetec Japan, Tokyo, Japan), then cryosectioning was performed at a temperature of −20°C to yield sections 5 µm thick, which were taken onto glass slides, and then air dried for 30 minutes. The oil red O solution was prepared as a stock solution (300 mg oil red O in 100 mL 99% isopropanol) before each staining session. A working solution consisting of 40 mL of stock solution diluted with 60 mL of distilled water was filtered to remove any crystallized oil red O. Slides were immersed in the working solution for 10 minutes and rinsed in distilled water, then rinsed for another 10 minutes in running tap water. The slides were counterstained with hematoxylin, then coverslipped using pure glycerol as an organic mounting medium.
Quantitative Image Analysis
Quantitative image analysis of the area of fat accumulation in exocrine pancreatic tissue was performed using an AxioObsever D1 (Carl Zeiss, Jena, Germany) and an AxioVision 4 AutoMeasure (Carl Zeiss) software. Eighty nonoverlapping fields of exocrine glands stained with H&E were randomly selected in each experimental group (n = 8) and examined at an original magnification of ×100. To evaluate exocrine pancreatic fat accumulation accurately, the percentage of fat accumulation area to pancreatic exocrine glands area was calculated. The percentage of the areas of accumulated fat, intralobular adipose cells, and lipid droplets in acinar cells, excluding interlobular adipose tissue and ductal lumina, was calculated using the following equation: total unstained area of fat accumulation / pink-stained area of exocrine glands.
Quantitative evaluation of the percentage of the fibrotic area in exocrine glands of the pancreas was performed using the same method as that for accumulated fat. Twenty-five nonoverlapping fields of exocrine glands stained with MT were randomly selected in each experimental group (n = 5) and examined at an original magnification of ×100. The area of red-stained exocrine glands, excluding fat and large ductal structures and the area of blue-stained fibrosis were determined using the AutoMeasure. The percentage of the fibrotic area in the exocrine glands of the pancreas was calculated using the equation: blue-stained area of fibrosis / red-stained area of islets or exocrine glands.
Measurement of Pancreatic Tissue Fat Content
Extraction of pancreatic lipid was performed by the method of Folch-Lees and Sloane-Stanley, as described in the previous report.21 Finally, the tissue lipid was dissolved in isopropyl alcohol, and the TG and NEFA contents of this solution were determined by the enzymatic method using the TG E test and NEFA C test (Wako Pure Chemical Industries), respectively.
Statistical Analysis
All the data are presented as means (SD). The significance of differences between the 2 experimental groups (12, 24 weeks of age) was analyzed using Student unpaired t test and that among 3 experimental groups (LS, FS, FH) using non–repeated-measures analysis of variance with Bonferroni correction. All statistical analyses were performed using SAS version 9.2 for Windows (The SAS Institute Japan, Tokyo, Japan). Differences at P < 0.05 were considered significant.
RESULTS
Animal Weight and Daily Food Intake
The FH group fed with the high-fat diet had larger fat pads, particularly epididymal fat, than did the FS group. The liver of the FH group appeared more whitish than that of the FS group (Figs. 1A–D), whereas the appearance of the pancreas showed no evident intergroup difference (Figs. 1E, F).
FIGURE 1.
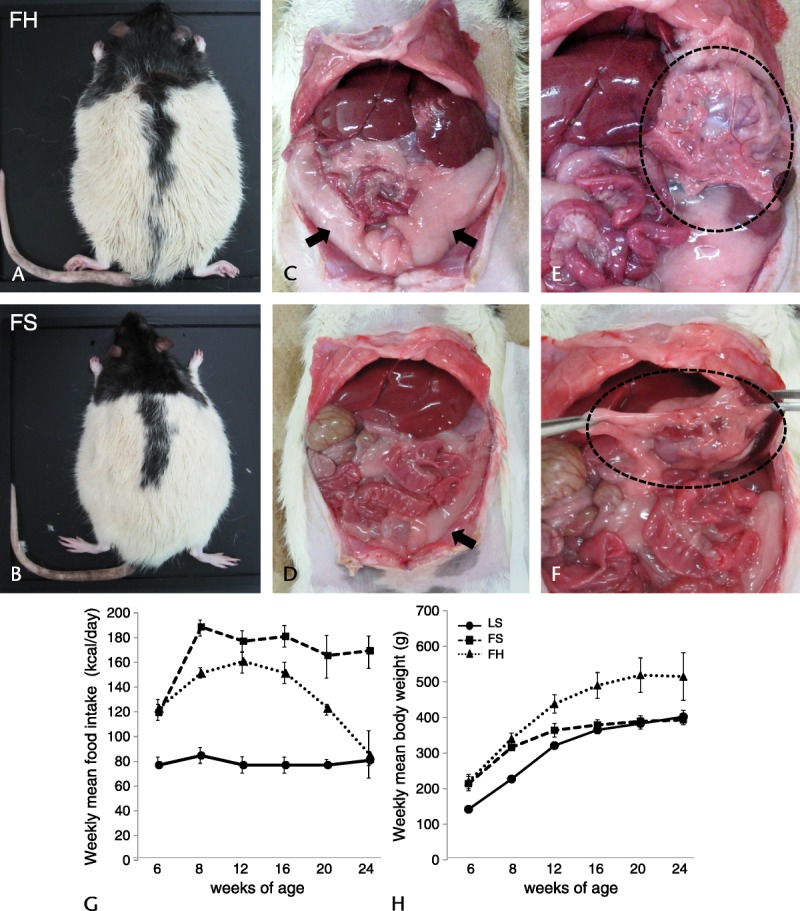
External and abdominal ventral views and weekly food intake and mean body weight of ZDF rats. External view of rats in the FH group (A) shows that they are larger than those in the FS group (B) and that rats in the FH group have larger fat pads, particularly epididymal fat (C), compared with rats in the FS group (D). The liver in the FH group has a more whitish pallor (C) than that in the FS group (D), whereas the appearance of the pancreas shows no obvious intergroup difference (E, F). Arrows indicate the epididymal fat pads; dotted circle area indicates the pancreas. Weekly mean food intake (G) and weekly mean body weight (H). Weekly food intake in the FH group was lower than that in the FS group and decreased from 12 weeks until the end of the observation period (G), whereas mean body weight in the FH group increased significantly, becoming about 100 g heavier than in the LS group at all time points (H). Values are means (SD).
Weekly food intake in the LS group was constant at about 20 g/rat per day. The FS group showed hyperphagia, and food intake was significantly greater than that in the LS group, whereas the FH group showed lower levels of food intake than did the FS group at all time points, and the amount decreased after 12 weeks until the end of the observation period (Fig. 1G). The mean body weight at the start of the experiment was at the same baseline in the FS and FH groups, being heavier than that in the LS group. Thereafter, the mean body weight in the LS group showed a continuous increase at all measured time points, and that in the FS group increased gradually up to 12 weeks, then remained steady until the end of the observation period. On the other hand, the mean body weight in the FH group was significantly increased, being about 100 g heavier than in the LS group at all time points (Fig. 1H).
Effect of a High-Fat Diet on Blood Biochemical Parameters
All blood biochemical data except the data of serum amylase and lipase are shown in Table 1, and data of individual rats at several weeks are in Supplemental Table, http://links.lww.com/MPA/A290. At 12 weeks of age, the levels of plasma glucose and insulin were significantly higher in the FH group compared with those in the LS group. At 24 weeks, the levels of glucose in the FH group were higher to a similar degree as those at 12 weeks, whereas the levels of insulin tended to be lower than those at 12 weeks. Mostly, the levels of serum TG, TCH, and NEFAs were significantly higher in the FH group relative to the other 2 groups.
TABLE 1.
Effect of High-Fat Diets on Blood Biochemical Parameters
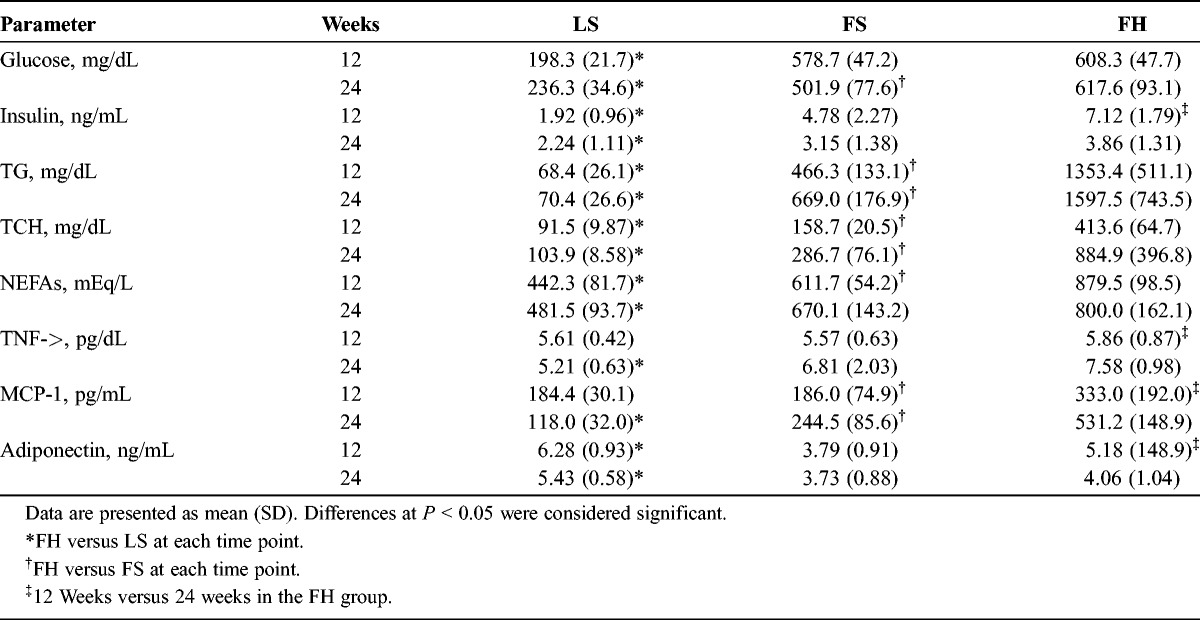
The serum levels of the both TNF-α and MCP-1 were higher significantly in the FH group relative to the LS group at 24 weeks of age, and the level of MCP-1 was significantly higher in the FH group than in the FS group. The level of adiponectin was significantly lower in the FH group relative to the LS group at 12 and 24 weeks of age. In the FH group, there were significant differences in the levels of these 3 serum cytokines between 12 and 24 weeks of age.
Fat Accumulation In pancreatic Tissue
Examination of H&E-stained sections of the pancreas in the LS group revealed no obvious changes after several weeks (Fig. 2A). On the other hand, in the FS group, the number of intralobular adipose cells increased with aging (Figs. 2B, C). Furthermore, only in the FH group, vacuoles were obvious in acinar cells at 12 weeks of age and were particularly prominent at 18 weeks (Fig. 2D). These vacuoles were stained by oil red O (Figs. 2G, H) and became subsequently decreased in number at 24 weeks of age (Fig. 2E).
FIGURE 2.
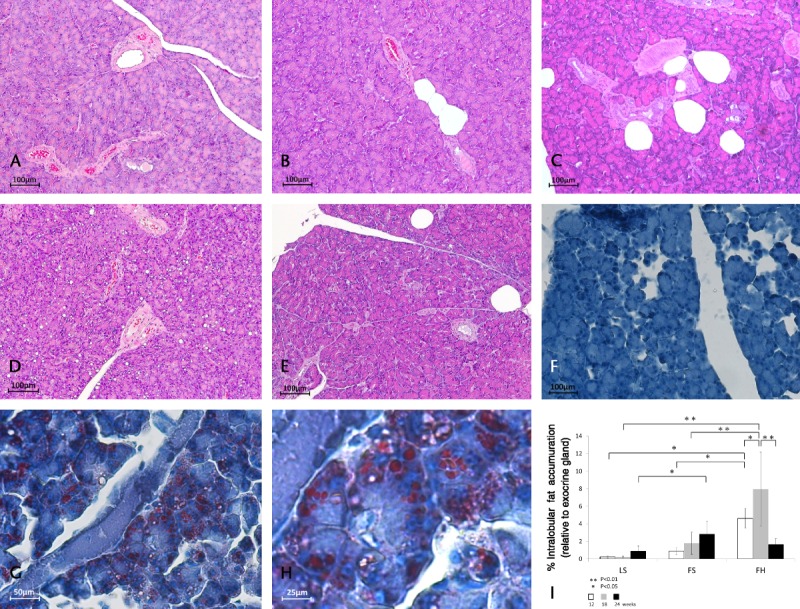
Histological changes in pancreatic tissues stained with H&E and oil red O and quantitative image analysis of pancreatic fat accumulation. Hematoxylin-eosin–stained sections of the pancreas in the LS group revealed no obvious changes after several weeks (A: 12 weeks). However, in the FS group, the number of intralobular adipose cells increased with aging (B: 12 weeks, C: 18 weeks). Furthermore, lipid droplets were obvious in acinar cells in the FH group at 18 weeks of age (D), but had subsequently decreased by 24 weeks of age (E). Oil red O staining revealed no changes in the LS group (F: at 18 weeks), whereas vacuoles in acinar cells were stained in the FH group (G, H: at 18 weeks). Original magnification: A–D, F, G: ×100, E, H: ×200, I: ×400. The percentage area of total fat accumulation relative to exocrine gland area in the FH group was increased relative to the other 2 groups at 12 and 18 weeks of age and was decreased at 24 weeks (I). Ten nonoverlapping exocrine gland fields stained with H&E were randomly selected in each experimental group (n = 8) and examined at an original magnification of ×100. Values are means (SD).
Quantitative image analysis of fat accumulation demonstrated that the percentage of the total area of fat accumulation relative to exocrine gland area in the FS group increased with aging, although not to a significant degree. While in the FH group, it was higher significantly relative to the other 2 groups at 12 (FS: 0.96% [SD, 0.36%], FH: 4.66% [SD, 1.16%], P < 0.05) and 18 weeks of age (FS: 1.88% [SD, 1.31%], FH: 7.97% [SD, 4.29%], P < 0.01), subsequently, at 24 weeks of age, it became lower significantly in comparison with that at 18 weeks of age (18 weeks: 7.97% [SD, 4.29%], 24 weeks: 1.71% [SD, 0.68%], P < 0.01), but did not decrease in the other 2 groups (Fig. 2I).
Fat Content of Pancreatic Tissue
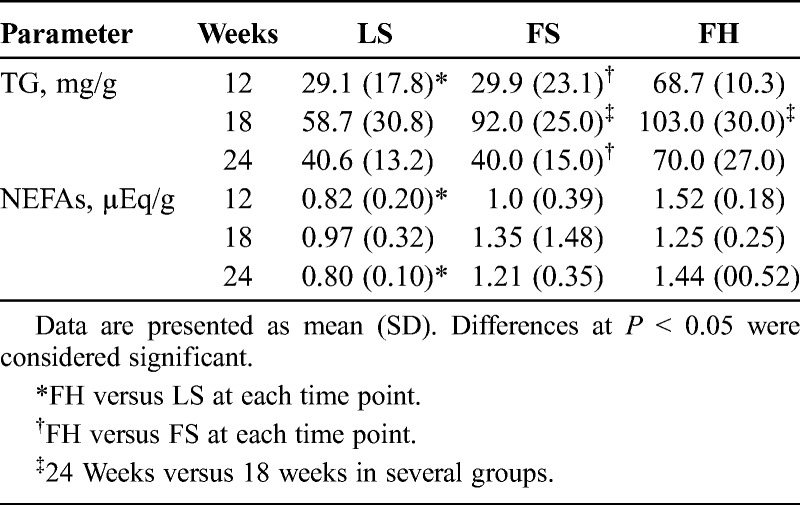
The TG and NEFA contents of pancreatic tissue are shown in Table 2.The TG content of the pancreas was higher in the FH group than in the other 2 groups, although the difference was not significant at 18 weeks of age. In both groups of fatty rats, the TG content of the pancreas was significantly increased at 18 weeks and then subsequently decreased at 24 weeks of age. The NEFA content of the pancreas was significantly higher in the FH group at 12 and 24 weeks of age relative to the LS group, but there were no significant differences between the FS and FH groups at several time points.
TABLE 2.
Fat Content of Pancreatic Tissue
Fibrosis in Pancreatic Tissue
In MT-stained sections at 12 weeks of age, the structure of the pancreatic tissue was normal, and fibrosis was rarely seen in the islets and interlobular and intralobular tissue. On the other hand, at 24 weeks of age, the area of fibrosis was marked in the FS and FH groups, particularly in the latter (Figs. 3A–F).
FIGURE 3.
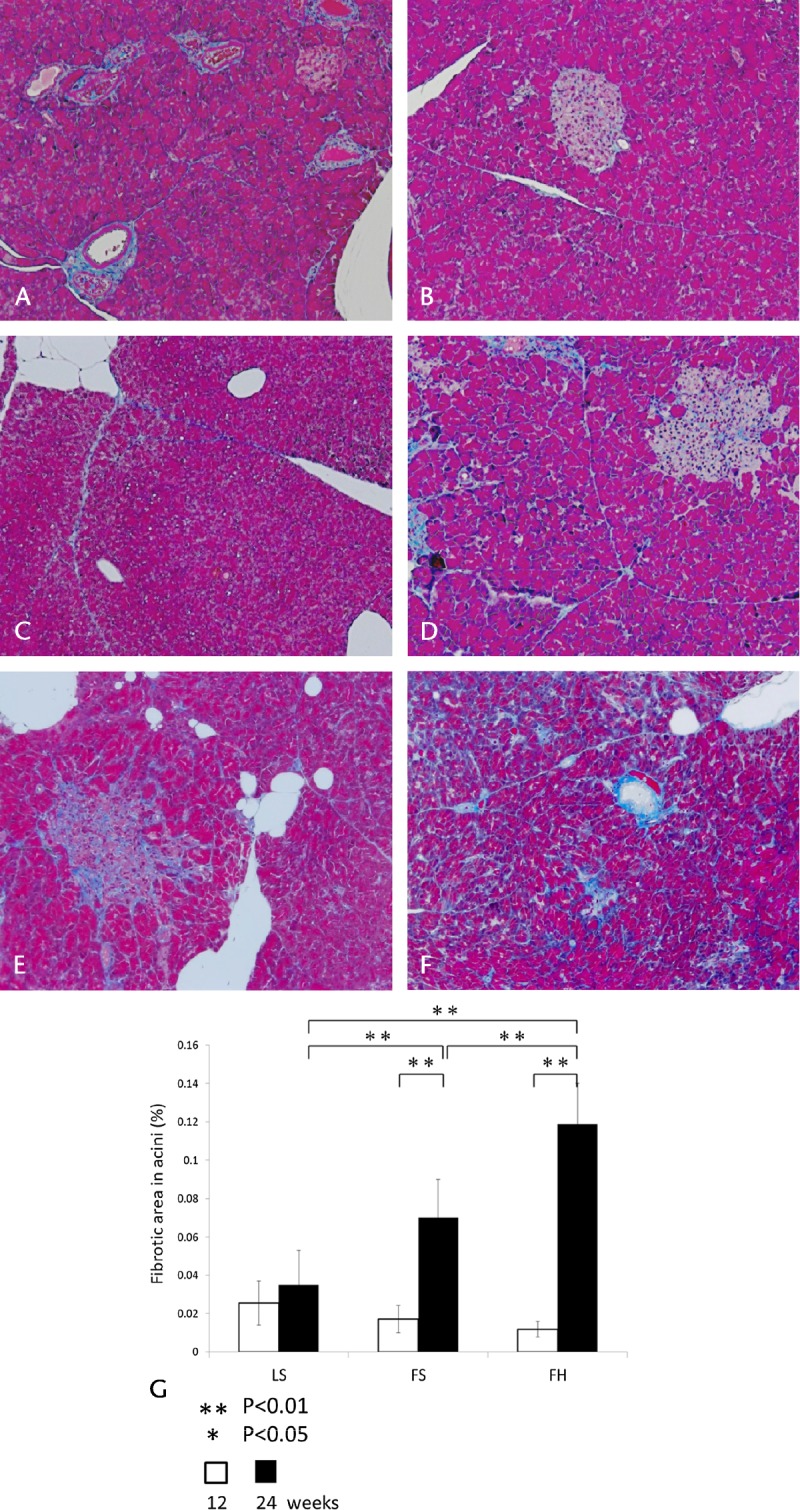
Histological changes in pancreatic tissues stained with MT and quantitative image analysis of pancreatic fibrosis. At 12 weeks of age, the pancreatic tissue structure was normal, and fibrosis was rarely evident in the islets and acini (A: LS, B: FS, C: FH, original magnification ×100). On the other hand, at 24 weeks, the area of fibrosis was remarkable in the FS and FH groups, particularly the latter (D: LS, E: FS, F: FH, original magnification ×100). The percentage of the fibrotic area in acini (G). There were no marked differences at 12 weeks of age, whereas at 24 weeks of age, the ratio was increased significantly in the FS and FH groups relative to the LS group. Significant differences between the FS and FH groups in the percentage of the fibrotic area in acini were evident at 24 weeks of age. Values are means (SD). Twenty-five nonoverlapping exocrine gland fields stained with MT were randomly selected in each experimental group (n = 5) at an original magnification ×100.
Quantitative image analysis of fibrosis demonstrated that, at 12 weeks of age, there were no marked differences in the percentage of the fibrotic area in acini relative to exocrine glands in each experimental group. Whereas at 24 weeks, the percentage of the fibrotic area in acini had been significantly higher in the FH group in comparison with the LS group (LS: 0.035% [SD, 0.021%], FH: 0.119% [SD, 0.021%], P < 0.01), and with the FS group (FS: 0.071% [SD, 0.018%], FH: 0.119% [SD, 0.021%], P < 0.01). In addition, the percentage of the fibrotic area in acini in the FH group was significantly higher at 24 weeks of age relative to that at 12 weeks (Fig. 3G). These results showed that, in the FH group, the degree of fibrosis in acini was markedly greater than that in the other 2 groups. Another common feature in the FH group was acinar cell atrophy, and a few lymphocytes were observed in perivascular areas and interlobular and intralobular spaces by H&E staining.
Effect of a High-Fat Diet on Serum Amylase and Lipase
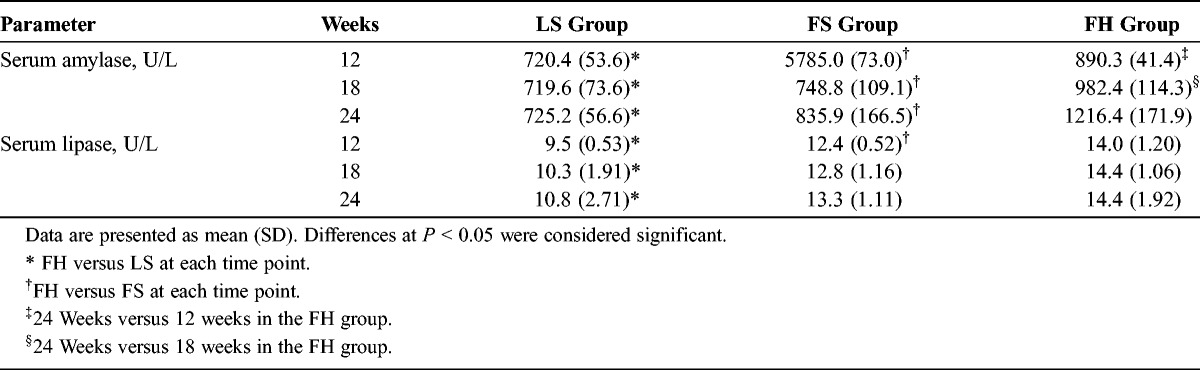
The data of serum amylase and lipase are shown in Table 3. The levels of serum amylase were significantly higher in the FH group compared with the LS and FS groups at several weeks of age. At 24 weeks of age, the serum amylase levels of the FH group were significantly higher than those of the other 2 groups. With regard to serum lipase, the data mostly paralleled those for amylase.
TABLE 3.
Effect of High-Fat Diets on Serum Amylase and Lipase
DISCUSSION
As the primary objective of our present study was to clarify the changes induced upon exposure of obese and T2DM model rats to a chronic high-fat diet, we selected ZDF rats as a representative experimental animal model of obesity and T2DM. We designated the LS group as a control, and the FS group as one having a hereditary predisposition—deficiency of the leptin receptor gene—resulting in obesity and T2DM. The FH group was considered to represent a situation in which a hereditary predisposition was exacerbated by chronic intake of a high-fat diet (45% of calories from fat). Many studies have investigated the effects of high-fat diets on animals without hereditary disorders, and it has been concluded that intake of such diets causes obesity and impaired glucose tolerance.15,18,22–25 Therefore, we considered that this represented a general consensus and consequently focused on the effects of a high-fat diet on lean rats.
Adipose tissue secretes numerous factors, namely, adipocytokines, known to markedly influence lipid and glucose/insulin metabolism, oxidative stress.26 Adiponectin and leptin are representative adipocytokines, the former having an anti-inflammatory function and playing an apparent role in the regulation of energy balance and peripheral tissue lipid metabolism.27 Leptin, on the other hand, is almost exclusively expressed and produced by white adipose tissue,28 regulating body weight and modulating insulin activity and sensitivity.29 Leptin also has an important hormonal role in the feedback regulation of lipogenesis, and any insufficiency of this function results in excessive production and reduced utilization of lipid.30 Under such conditions, any excessive ingested lipid appears to be underutilized and stored as excessive TG in adipose tissue. Consequently, the gain in body weight of ZDF rats might be dependent on the amount of fat ingested. This is considered to explain why body weight in the FH group at 24 weeks was higher, despite the fact that their calorie intake was about 50% less than that in the FS group.
We showed that the percentage area of total fat accumulation relative to the area of the exocrine pancreas was significantly larger in the FH group than in the other 2 groups. Also in the FH group, oil red O staining demonstrated marked deposition of lipid droplets in acinar cells at 18 weeks of age. Similarly, a previous study using immunolabeling for adipose differentiation-related protein had identified lipid droplets in acinar cells of mice fed a high-fat diet,31 and another study using electron microscopy had identified the location of lipid droplets in acinar cells of ZDF rats fed a standard diet.32 The present study is the first to have analyzed the area of fat accumulation in the exocrine pancreas quantitatively and to have revealed that this histological change is prominent at 18 weeks of age and subsequently decreases by 24 weeks.
We found that the TG content of pancreatic tissue increased in the FH group at 18 weeks of age and decreased at 24 weeks. This reflected the results of histological observations and quantitative image analysis, which showed that the percentage area of total fat accumulation and lipid droplets in acinar cells were maximally increased and then subsequently decreased at the same time points.
While nonalcoholic steatohepatitis (NASH) is one of the most important diseases associated with MS,33,34 recent studies of the relationship between nonalcoholic fatty liver disease, a precursor of NASH,35 and “pancreatic steatosis” in humans have indicated that nonalcoholic fatty liver disease and pancreatic steatosis are related and that this relationship is mediated by obesity.36 It is known that hepatic TG diminishes with the progression of NASH, a condition that has been designated “burned-out NASH,”37 and the present histological observations appeared similar to those occurring in NASH. Although a previous study has clarified that down-regulation of sterol regulatory element-binding protein 1c and lipogenic enzymes may be associated with the development of burned-out NASH,38 the mechanism has remained unclear.
One previous study showed that the pancreatic contents of TG and NEFAs were increased in congenitally obese mice (leptin-deficient mice, Lepob; hyperleptinemic mice, Lepdb), and it was concluded that increased NEFAs might play a significant role in exacerbating the local proinflammatory milieu,28 in agreement with previous studies.23,39,40 We also found that the pancreatic NEFA content was increased in the FH group relative to the LS group. However, the levels of serum MCP-1 and NEFAs in the FH group were lower than those observed in an animal model of acute pancreatitis41,42 and also in our study in the absence of acute pancreatitis histology. In relation to these observations, we assume that “chronic and low-grade inflammation” might occur in pancreatic tissue against a background of MS. Future studies seem warranted to clarify whether localized pancreatic inflammation, or a change in the energy and lipid metabolism of pancreatic acinar cells,29,43,44 might contribute to the marked reduction of fat accumulation in acinar cells we observed between 18 and 24 weeks.
It is known that pancreatic stellate cells (PSCs) are activated by ethanol and its metabolites, and also by cytokines and oxidant stress, in the process of pancreatic fibrosis.45 Only a few detailed studies of pancreatic fibrosis using obesity models or high-fat–fed animals have been reported.46,47 Although those studies demonstrated a relationship between pancreatic fibrosis and obesity and a high-fat diet, they did not address the issue of fatty change in the pancreas.
Using MT staining and quantitative image analysis, the present study showed that pancreatic fibrosis was increased by intake of a high-fat diet. Although we did not examine the process of PSC activation, our present results suggest that pancreatic fibrosis in ZDF rats occurs in a background of obesity and T2DM and that these changes seem to be increased by chronic intake of a high-fat diet. Moreover, it was shown that at 24 weeks of age, pancreatic fibrosis was significantly increased in the FH group, whereas fat accumulation appeared to be decreased.
A number of studies have already addressed the relationships between inflammation and pancreatic fat accumulation or fibrosis in animal models of obesity or diabetes.9,46 However, no previous study of either animal models or human patients has evaluated the histological changes that occur during the transition from pancreatic fat accumulation to fibrosis. In the only study to have used acinar cells isolated from Wistar rats, very low-density lipoprotein was shown to induce acinar cell injury in the absence of alcohol, with subsequent PSC proliferation and synthesis of extracellular matrix.45 In the present study, temporal histological changes in the pancreatic tissue of ZDF rats were evaluated for the first time, and it was found that fat accumulation in acinar cells and subsequent pancreatic fibrosis appeared to increase upon chronic exposure to a high-fat diet.
The serum levels of amylase and lipase were higher in the FH group relative to the LS and FS groups. Recently, 1 study using comparative proteomic analysis of pancreatic tissue obtained from hyperlipidemic rats to identify proteins that may mediate hyperlipidemia-associated pancreatic injury has suggested that α-amylase may be a putative biomarker of hyperlipidemia-mediated pancreatic injury.20 Therefore, our present observations might reflect the possibility that, in a background of obesity, hyperlipidemia, and T2DM, increased activity of exocrine pancreatic enzymes in serum reflects the presence of acinar cell injury.
In humans, it has been reported that pancreatic lipomatosis evident in autopsy material increases with aging and obesity14,48 and that fibrosis increases with aging49,50 and also with obesity and pancreatitis.51 Several recent studies have quantified the fat content of pancreatic tissue using magnetic resonance spectroscopy (MRS), a noninvasive method for quantification of organic compounds in various tissues. The results have suggested that the pancreatic lipid content may contribute to the dysfunction of β cells and possibly to the onset and subsequent development of T2DM.52,53 Moreover, nuclear MRS-based metabolomics analysis has demonstrated an excellent correlation between the results of thin-layer and gas chromatography and total fat in mice.54 Therefore, this new MRS strategy for evaluating the fat content of the human pancreas should be fully utilized to shed more light on the fibrosis and acinar cell injury caused by a fatty pancreas.
In conclusion, the present study has demonstrated that intralobular fat accumulation in exocrine pancreatic tissue and lipid droplets in acinar cells are increased in ZDF rats under chronic intake of a high-fat diet and that these conditions appear to lead to acinar cell injury and fibrosis. As the incidence of obesity and T2DM in the human population is growing rapidly, further clinical and experimental studies of the interrelationships among diabetes, MS, and pancreatic injury should be encouraged to elucidate the pathogenesis of “nonalcoholic fatty pancreatic disease.”
Supplementary Material
ACKNOWLEDGMENT
The authors thank Mr Junji Yokozawa, Mr Hitoshi Suzuki, and Ms Yayoi Sasaki for excellent technical assistance.
Footnotes
Author contribution: Conception and design: S.K.; provision of study material: T.H., A.M.; data collection and analysis: A.M., M.I., Y.K., M.A.; data interpretation: N.M., N.S., T.T., T.H., A.M., Y.I., H.S., Y.U.; writing of the manuscript: A.M.; final approval of manuscript: all authors.
The authors declare no conflict of interest.
Supplemental digital contents are available for this article. Direct URL citations appear in the printed text and are provided in the HTML and PDF versions of this article on the journal’s Web site (www.pancreasjournal.com).
REFERENCES
- 1. Field AE, Coasky EH, Must A, et al. Impact of overweight on the risk of developing common chronic disease during a 10-year period. Arch Intern Med. 2001; 161: 1581– 1586 [DOI] [PubMed] [Google Scholar]
- 2. Wang MY, Grayburn P, Chen S, et al. Adipogenic capacity and the susceptibility to type 2 diabetes and metabolic syndrome. Proc Natl Acad Sci U S A. 2008; 105: 6139– 6144 [DOI] [PMC free article] [PubMed] [Google Scholar]
- 3. Shimabukuro M, Higa M, Zhou YT, et al. Lipoapoptosis in beta-cells of obese prediabetic fa/fa rats. Role of serine palmitoyltransferase overexpression. J Biol Chem. 1998; 273: 32487– 32490 [DOI] [PubMed] [Google Scholar]
- 4. Zhou YP, Cockburn BN, Pugh W, et al. Basal insulin hypersecretion in insulin-resistant Zucker diabetic and Zucker fatty rats: role of enhanced fuel metabolism. Metabolism. 1999; 48: 857– 864 [DOI] [PubMed] [Google Scholar]
- 5. Pick A, Clark J, Kubstrup C, et al. Role of apoptosis in failure of beta-cell mass compensation for insulin resistance and beta-cell defects in the male Zucker diabetic fatty dat. Diabetes. 1998; 47: 358– 364 [DOI] [PubMed] [Google Scholar]
- 6. Topp BG, Atkinson LL, Finegood DT. Dynamics of insulin sensitivity, β-cell function, and β-cell mass during the development of diabetes in fa/fa rats. Am J Physiol Endocrinol Metab. 2007; 293: E1730– E1735 [DOI] [PubMed] [Google Scholar]
- 7. Lee Y, Hirose H, Ohneda M, et al. Beta-cell lipotoxicity in the pathogenesis of non-insulin-dependent diabetes mellitus of obese rat: impairment in adipocyte–beta-cell relationships. Proc Natl Acad Sci U S A. 1994; 91: 10878– 10882 [DOI] [PMC free article] [PubMed] [Google Scholar]
- 8. Nolan CJ, Madiraju MS, Deighingaro-Augusto V, et al. Fatty acid signaling in the beta-cell and insulin secretion. Diabetes. 2006; 55 (suppl 2): S16– S23 [DOI] [PubMed] [Google Scholar]
- 9. Ehses JA, Perren A, Eppler E, et al. Increased number of islet-associated macrophages in type 2 diabetes. Diabetes. 2007; 56: 2356– 2370 [DOI] [PubMed] [Google Scholar]
- 10. Ferreira L, Teixeira-de-Lemos E, Pinto F, et al. Effects of sitagliptin treatment on dysmetabolism, inflammation, and oxidative stress in an animal model of type 2 diabetes (ZDF rat). Mediators Inflamm. 2010; 2010: 592760. [DOI] [PMC free article] [PubMed] [Google Scholar]
- 11. Leahy JL. Natural history of beta-cell dysfunction in NIDDM. Diabetes Care. 1990; 13: 992– 1010 [DOI] [PubMed] [Google Scholar]
- 12. van Raalte DH, van der Zijl NJ, Diamant M. Pancreatic steatosis in humans: cause or marker of lipotoxicity? Curr Opin Clin Nutr Metab Care. 2010; 13: 478– 485 [DOI] [PubMed] [Google Scholar]
- 13. Sakuraba H, Mizukami H, Yagihashi N, et al. Reduced beta-cell mass and expression of oxidative stress-related DNA damage in the islet of Japanese type 2 diabetic patients. Diabetologia. 2002; 45: 85– 96 [DOI] [PubMed] [Google Scholar]
- 14. Schmitz-Moormann P, Pittner PM, Heinze W. Lipomatosis of the pancreas. A morphometrical investigation. Pathol Res Pract. 1981; 173: 45– 53 [DOI] [PubMed] [Google Scholar]
- 15. Fraulob JC, Ogg-Diamantino R, Fernandes-Santos C, et al. A mouse model of metabolic syndrome: insulin resistance, fatty liver and non-alcoholic fatty pancreas disease (NAFPD) in C57BL/6 mice fed a high fat diet. J Clin Biochem Nutr. 2010; 46: 212– 223 [DOI] [PMC free article] [PubMed] [Google Scholar]
- 16. Mathur A, Marine M, Lu D, et al. Nonalcoholic fatty pancreatic disease. HPB (Oxford). 2007; 9: 312– 318 [DOI] [PMC free article] [PubMed] [Google Scholar]
- 17. Yan MX, Li YQ, Meng M, et al. Long-term high fat diet induces pancreatic injuries via pancreatic microcirculatory disturbances and oxidative stress in rats with hyperlipidemia. Biochem Biophys Res Commun. 2006; 347: 192– 199 [DOI] [PubMed] [Google Scholar]
- 18. Chowdhury P, Nishikawa M, Blevins GW, Jr, et al. Response of rat exocrine pancreas to high-fat and high-carbohydrate diets. Proc Soc Exp Biol Med. 2000; 223: 310– 315 [DOI] [PubMed] [Google Scholar]
- 19. Lee KY, Ahn HC, Kim C, et al. Pancreatic exocrine response to long-term high-fat diets in rats. JOP. 2006; 7: 397– 404 [PubMed] [Google Scholar]
- 20. Zhang W, Wang XP, Yu ZW, et al. Hyperlipidemic versus healthy pancreases: a proteomic analysis using an animal model. IUBMB Life. 2010; 62: 781– 789 [DOI] [PubMed] [Google Scholar]
- 21. Folch J, Lees M, Sloane-Stanley GH. A simple method for the isolation and purification of total lipids from animal tissue. J Biol Chem. 1957; 226: 497– 509 [PubMed] [Google Scholar]
- 22. Buettner R, Schölmerich J, Bollheimer LC. High-fat diets: modeling the metabolic disorders of human obesity in rodents. Obesity (Silver Spring). 2007; 15: 798– 808 [DOI] [PubMed] [Google Scholar]
- 23. Cha MC, Chou CJ, Boozer CN. High-fat diet feeding reduces the diurnal variation of plasma leptin concentration in rats. Metabolism. 2000; 49: 503– 507 [DOI] [PubMed] [Google Scholar]
- 24. Ha SK, Kim J, Chae C. Role of AMP-activated protein kinase and adiponectin during development of hepatic steatosis in high-fat diet–induced obesity in rats. J Comp Pathol. 2011; 145: 88– 94 [DOI] [PubMed] [Google Scholar]
- 25. Xu ZJ, Fan JG, Ding XD, et al. Characterization of high-fat, diet-induced, non-alcoholic steatohepatitis with fibrosis in rats. Dig Dis Sci. 2010; 55: 931– 940 [DOI] [PMC free article] [PubMed] [Google Scholar]
- 26. Lowell BB. PPARγ: an essential regulator of adipogenesis and modulator of fat cell function. Cell. 1999; 99: 239– 242 [DOI] [PubMed] [Google Scholar]
- 27. Berg AH, Combs TP, Du X, et al. ACRP30/adiponectin; adipokine regulating glucose and lipid metabolism. Trends Endocrinol Metab. 2002; 13: 84– 89 [DOI] [PubMed] [Google Scholar]
- 28. Ahima RS, Prabakaran D, Flier JS. Leptin. Annu Rev Physiol. 2000; 62: 413– 437 [DOI] [PubMed] [Google Scholar]
- 29. Oral EA, Simha V, Ruiz E, et al. Leptin—replacement therapy for lipodystrophy. N Engl J Med. 2002; 346: 570– 578 [DOI] [PubMed] [Google Scholar]
- 30. Bassilian S, Ahmed S, Lim SKB, et al. Loss of regulation of lipogenesis in the Zucker diabetic rat. II. Changes in stearate and oleate synthesis. Am J Physiol Endocrinol Metab. 2002; 282: E507– E513 [DOI] [PubMed] [Google Scholar]
- 31. Pinnick KE, Collins SC, Londos C, et al. Pancreatic ectopic fat is characterized by adipocyte infiltration and altered lipid composition. Obesity. 2008; 16: 522– 530 [DOI] [PubMed] [Google Scholar]
- 32. Lee Y, Lingvay I, Szczepaniak LS, et al. Pancreatic steatosis: harbinger of type 2 diabetes in obese rodents. Int J Obes. 2010; 34: 396– 400 [DOI] [PubMed] [Google Scholar]
- 33. Te Sligte K, Bourass I, Sels JP, et al. Non-alcoholic steatohepatitis: review of a growing medical problem. Eur J Intern Med. 2004; 15: 10– 21 [DOI] [PubMed] [Google Scholar]
- 34. Day CP, James OF. Steatohepatitis: a tale of two “hits”? Gastroenterology. 1998; 114: 842– 845 [DOI] [PubMed] [Google Scholar]
- 35. Dixon JB, Bhathal PS, O’Brien PE. Nonalcoholic fatty liver disease: predictors of nonalcoholic steatohepatitis and liver fibrosis in the severely obese. Gastroenterology. 2001; 121: 91– 100 [DOI] [PubMed] [Google Scholar]
- 36. van Geenen EJ, Smits MM, Schreuder TC, et al. Nonalcoholic fatty liver disease is related to nonalcoholic fatty pancreas disease. Pancreas. 2010; 39: 1185– 1190 [DOI] [PubMed] [Google Scholar]
- 37. Nagaya T, Tanaka N, Komatsu M, et al. Development from simple steatosis to liver cirrhosis and hepatocellular carcinoma: a 27-year follow-up case. Clin J Gastroenterol. 2008; 1: 116– 121 [DOI] [PubMed] [Google Scholar]
- 38. Nagaya T, Tanaka N, Suzuki T, et al. Down-regulation of SREBP-1c is associated with the development of burned-out NASH. J Hepatol. 2010; 53: 724– 731 [DOI] [PubMed] [Google Scholar]
- 39. Fernández-Real JM, Broch M, Vendrell J, et al. Insulin resistance, inflammation, and serum fatty acid composition. Diabetes Care. 2003; 26: 1362– 1368 [DOI] [PubMed] [Google Scholar]
- 40. Lovejoy JC, Windhauser MM, Rood JC, et al. Effect of a controlled high-fat versus low-fat diet on insulin sensitivity and leptin levels in African-American and Caucasian women. Metabolism. 1998; 47: 1520– 1524 [DOI] [PubMed] [Google Scholar]
- 41. Ishibashi T, Zhao H, Kawabe K, et al. Blocking of monocyte chemoattractant protein-1 (MCP-1) activity attenuates the severity of acute pancreatitis in rats. J Gastroenterol. 2008; 43: 79– 85 [DOI] [PubMed] [Google Scholar]
- 42. Paye F, Chariot J, Molas G, et al. Nonesterified fatty acids in acute cerulein-induced pancreatitis in the rat. Are they really deleterious in vivo? Dig Dis Sci. 1995; 40: 540– 545 [DOI] [PubMed] [Google Scholar]
- 43. Sano T, Ozaki K, Matsuura T, et al. Giant mitochondria in pancreatic acinar cells of alloxan-induced diabetic rats. Toxicol Pathol. 2010; 38: 658– 665 [DOI] [PubMed] [Google Scholar]
- 44. Voronina SG, Barrow SL, Simpson AW, et al. Dynamic changes in cytosolic and mitochondrial ATP levels in pancreatic acinar cells. Gastroenterology. 2010; 138: 1976– 1987 [DOI] [PMC free article] [PubMed] [Google Scholar]
- 45. Siech M, Zhou Z, Zhou S, et al. Stimulation of stellate cells by injured acinar cells: a model of acute pancreatitis induced by alcohol and fat (VLDL). Am J Physiol Gastrointest Liver Physiol. 2009; 297: G1163– G1171 [DOI] [PubMed] [Google Scholar]
- 46. Otani M, Yamamoto M, Harada M, et al. Effect of long- and short-term treatments with pravastatin on diabetes mellitus and pancreatic fibrosis in the Otsuka-Long-Evans-Tokushima fatty rat. Br J Pharmacol. 2010; 159: 462– 473 [DOI] [PMC free article] [PubMed] [Google Scholar]
- 47. Zhang X, Cui Y, Fang L, et al. Chronic high-fat diets induce oxide injuries and fibrogenesis of pancreatic cells. Pancreas. 2008; 37: e31– e38 [DOI] [PubMed] [Google Scholar]
- 48. Olsen TS. Lipomatosis of the pancreas in autopsy material and its relation to age and overweight. Acta Pathol Microbiol Scand A. 1978; 86A: 367– 373 [DOI] [PubMed] [Google Scholar]
- 49. Noronha M, Salgadinho A, Ferreira de Almeida MJ, et al. Alcohol and the pancreas. I. Clinical associations and histopathology of minimal pancreatic inflammation. Am J Gastroenterol. 1981; 76: 114– 119 [PubMed] [Google Scholar]
- 50. Detlefsen S, Sipos B, Feyerabend B, et al. Pancreatic fibrosis associated with age and ductal papillary hyperplasia. Virchows Arch. 2005; 447: 800– 805 [DOI] [PubMed] [Google Scholar]
- 51. Saisho Y, Butler AE, Meier JJ, et al. Pancreas volumes in humans from birth to age one hundred taking into account sex, obesity, and presence of type-2 diabetes. Clin Anat. 2007; 20: 933– 942 [DOI] [PMC free article] [PubMed] [Google Scholar]
- 52. Lingvay I, Esser V, Legendre JL, et al. Noninvasive quantification of pancreatic fat in humans. J Clin Endocrinol Metab. 2009; 94: 4070– 4076 [DOI] [PMC free article] [PubMed] [Google Scholar]
- 53. Tushuizen ME, Bunck MC, Pouwels PJ, et al. Pancreatic fat content and beta-cell function in men with and without type 2 diabetes. Diabetes Care. 2007; 30: 2916– 2921 [DOI] [PubMed] [Google Scholar]
- 54. Zyromski NJ, Mathur A, Gowda GA, et al. Nuclear magnetic resonance spectroscopy–based metabolomics of the fatty pancreas: implicating fat in pancreatic pathology. Pancreatology. 2009; 9: 410– 419 [DOI] [PMC free article] [PubMed] [Google Scholar]