Abstract
The availability of nitrogen (N) to plants has a profound impact on carbohydrate and protein metabolism, but little is known about its effect on membrane lipid species. This study examines the changes in galactolipid and phospholipid species in soybean as affected by the availability of N, either supplied to soil or obtained through Bradyrhizobium japonicum nodulation. When N was limited in soil, the content of galactolipids, monogalactosyldiacylglycerol (MGDG) and digalactosyldiacyglycerol (DGDG), decreased drastically in leaves, while a smaller decrease of DGDG was observed in roots. In both leaves and roots, the overall content of different phospholipid classes was largely unchanged by N limitation, although some individual phospholipid molecular species did display significant changes. Nodulation with Bradyrhizobium of soybean grown in N-deficient soil resulted in a large increase in levels of plastidic lipid classes, MGDG, DGDG, and phosphatidylglycerol, along with smaller increases in non-plastidic phospholipids in leaves. Nodulation also led to higher levels of phospholipids in roots without changes in root levels of MGDG and DGDG. Overall, N availability alters lipid content more in leaves than roots and more in galactolipids than phospholipids. Increased N availability leads to increased galactolipid accumulation in leaves, regardless of whether N is supplied from the soil or symbiotic fixation.
Keywords: Soybean, Glycine max cv. Jack, Leguminosae, Bradyrhizobium japonicum, nitrogen starvation, nodulation, lipid profiling, plant response to nitrogen availability, legume, membrane lipids
1. Introduction
Nitrogen (N) is an essential element of key macromolecules such as proteins, nucleic acids, some lipids, and chlorophylls (Crawford and Forde, 2002; Peng et al., 2007), and N availability is critical for optimal growth and development of plants. In nature, numerous factors, including soil erosion, water leaching, plant growth, and microbial consumption, lead to N deficiency (Good et al., 2004). N deficiency also leads to alterations in root architecture, especially in lateral root initiation (Little et al., 2005; Orsel et al., 2006; Remans et al., 2006), and up-regulation of genes responsible for nitrate transporters for N uptake (Guo et al., 2001). These responses enhance N acquisition (Lawlor, 2002; Zheng, 2009). Meanwhile, N deprivation induces the catabolic process of vacuolar autophagy and increases N remobilization from older to younger leaves and reproductive organs (Hanaoka et al., 2002; Ono et al., 1996; Peng et al., 2007; Remans et al., 2006). The synthesis of amino acids, proteins, and nucleic acids are suppressed under N-limiting conditions (Scheible et al., 2004; Wang et al., 2003). It has been well documented that N deprivation decreases crop yield, particularly by decreasing photosynthesis (Boussadia et al., 2010; Zhao et al., 2003).
While N availability is known to impact carbohydrate and protein metabolism, its effect on lipid metabolism and membrane lipid remodeling remains poorly understood. N and phosphorus are components of the head group of the major glycerophospholipids, phosphatidylcholine (PC; 1–20) and phosphatidylethanolamine (PE; 21–43), as well as phosphatidylserine (PS; 44– 69). Membrane lipid remodeling during phosphate starvation in plants leads to decreases in phospholipids and increases in galactolipids, particularly digalactosyldiacylglycerol (DGDG; 70–85) (Gaude et al., 2008; Härtel et al., 1997; Li et al., 2006). This decrease in phospholipids allows phosphorus to be used for other critical cell functions and also makes diacylglycerol (DAG) available for galactolipid biosynthesis. In contrast, the level of galactolipids was decreased in N-deprived Arabidopsis seedlings (Gaude et al., 2007). The hydrolysis of phospholipids, such as PC to phosphatidic acid (PA; 86–97) by phospholipase Dε, has been implicated in Arabidopsis response to N availability, leading to an increase in root surface area and improved N uptake and utilization (Hong et al., 2009). However, little is known about how membrane lipid species change in response to N availability.
This study was undertaken to analyze the changes in molecular species of membrane phospholipids and galactolipids in soybean under N-deficient and N-sufficient conditions. Each membrane glycerolipid class is composed of various molecular species with varied fatty acid chain length and degree of unsaturation. To date, a detailed analysis of lipid molecular species alterations due to N limitation in a crop species has not been reported. The present study used soybean because leguminous plants have the ability to form nodules that fix nitrogen (N2) to ammonia through symbiotic association with Rhizobiaceae bacteria. Use of a leguminous species, therefore, offers an opportunity to analyze the effect of symbiotic N fixation on membrane lipid changes.
2. Results
2.1. N deficiency decreases galactolipid more than phospholipid content
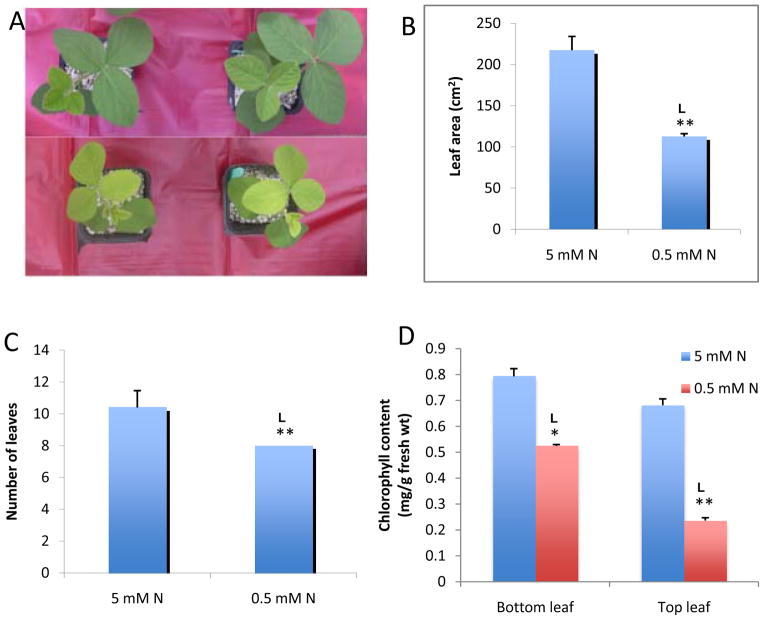
Soybean seedlings were grown in a mixture of vermiculite and perlite containing 5 mM or 0.5 mM N supplied as a combination of nitrate and ammonium. Compared with seedlings at 5 mM N, soybean seedlings grown at 0.5 mM N for 15 days displayed overt symptoms of N deficiency. The growth of the above ground portion of the seedlings was inhibited, with leaves turning yellow (Fig. 1A). The average leaf area was 50% smaller than that of seedlings grown at 5 mM N (Fig. 1B), while the number of leaves was reduced by 20% (Fig. 1C). The older leaves of N-deficient seedlings had 60% and the younger leaves 30% of the chlorophyll content of seedlings with sufficient N (Fig. 1D). At 5 mM N, soybean seedlings grew and developed normally; 5 mM N is referred to as the N-sufficient condition throughout the text.
Figure 1. Effect of nitrogen starvation on soybean growth.
a. Soybean seedlings exposed to sufficient nitrogen (5 mM; top panel) and deficient nitrogen (0.5 mM; bottom panel).
b to d. Growth parameters as affected by nitrogen starvation.
Surface sterilized soybean seeds were germinated on vermiculite and perlite mix (1:3) and grown for 15 days with 5 mM and 0.5 mM nitrogen. Leaf area (b), number of leaves (c) and chlorophyll content (d) were estimated. Values are means ± SE (n=5) from one representative of three independent experiments. Nitrogen was varied by varying levels of exogenously supplied ammonium nitrate.
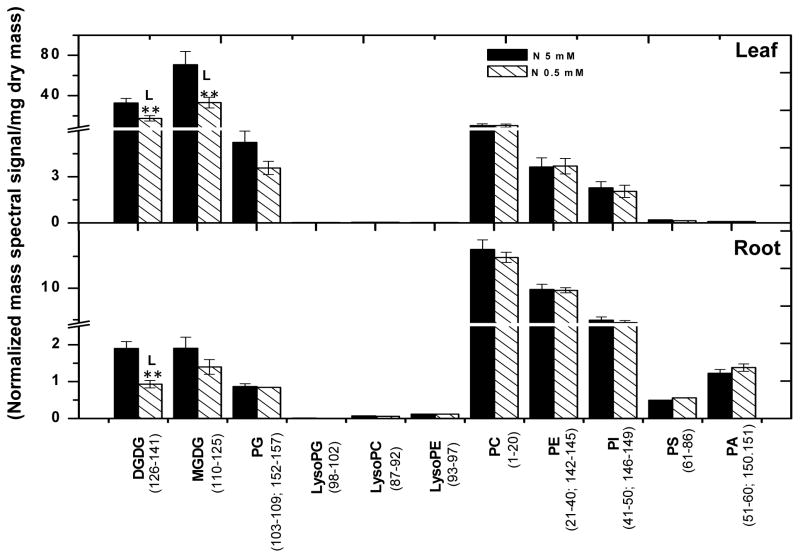
Lipids from leaves and roots grown under these conditions were quantitatively profiled using electrospray ionization triple quadrupole mass spectrometry (ESI-MS/MS). All the compounds analyzed are numbered and presented in Supplemental Table I and II. Representative structures of each lipid class are shown in Supplemental Fig. 1 and modified from Devaiah et al., (2006). The photosynthetic membranes of plants are rich in the non-nitrogenous galactolipids, MGDG (98–113) and DGDG (70–85). Under N-sufficient conditions, the mass spectral signals from MGDG (98–113) and DGDG (70–85) (normalized mass spectral signal/mg dry mass) in leaves were approximately five-fold greater than those from total phospholipids (Fig. 2; Supplemental Table 1). On the other hand, phospholipids are the major lipids in roots, and the mass spectral signals from root phospholipids were approximately ten-fold greater than those of galactolipids (Fig. 2; Supplemental Table 1). When soybean plants were deprived of N, the ratio of galactolipids to phospholipids in leaves decreased two-fold due primarily to a decline in the galactolipids MGDG (98–113) and DGDG (70–85) (Fig. 2; Supplemental Table 1). In roots, the ratio of galactolipids to phospholipids was also decreased, but the decrease was smaller than that in leaves. The decrease in roots came primarily from a 39% decrease in DGDG (70–85) whereas the content of MGDG (98–113) and phospholipids were not significantly changed (Fig. 2). These results show that N availability alters lipid content more in leaves than roots, with greater changes in galactolipids than phospholipids.
Figure 2. Total polar glycerolipids in organs of nitrogen sufficient (solid bars) and deficient (hatched bars) soybean seedlings.
Lipids were extracted from 15 days old soybean leaves and roots grown under nitrogen sufficient (5 mM) and deficient conditions (0.5 mM). The total polar glycerolipid amounts are expressed as normalized mass spectral signal/mg dry mass. The values are the mean ± SE (n = 15). P < 0.05 is indicated by * and P < 0.01 by **. The value for N-deficient seedlings is higher (represented by H) or lower (represented by L) than the value for N sufficient seedlings.
2.2. Polar glycerolipid species change differentially in N-deficient leaves and roots
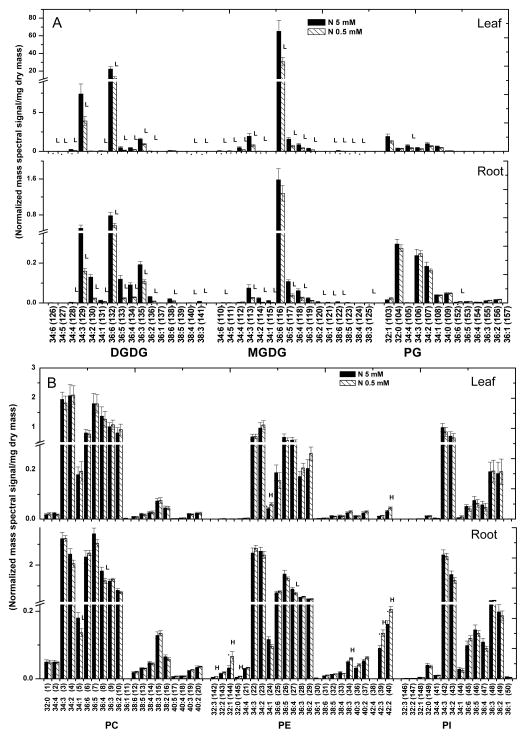
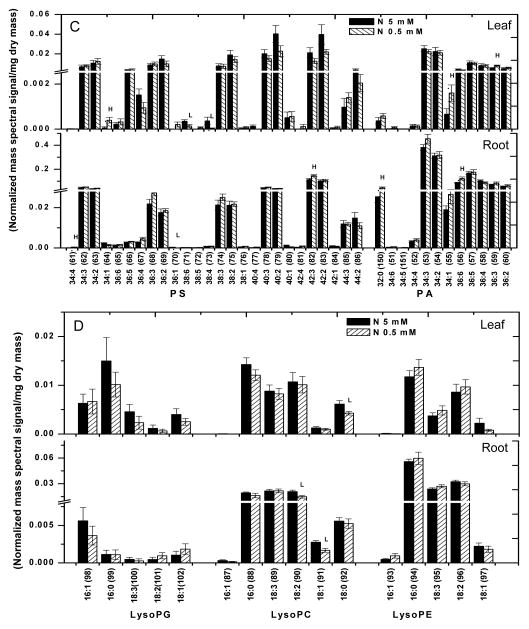
MGDG (98–113) is the most abundant glycerolipid in leaves and the highly polyunsaturated 36:6 (di18:3)-MGDG (104) accounts for more than 90% of MGDG (98–113) whereas DGDG (70–85) is composed mostly of 36:6 (76)- and 34:3-species (73) (Fig. 3A; Supplemental Table 1). All species of MGDG (98–113) and DGDG (70–85) were decreased in N-deficient leaves (Fig. 3; leaf). Although the total phospholipid content was unchanged, some species of PG (116), PE (28,43), PS (47,54,56), and PA (92,96) displayed significant differences under N deficiency (Fig. 3A & 3B; leaf). 34:4-PG (116) was lower in leaves whereas 34:1-PE (26) and 42:2-PE (43) were higher. Levels of PS (44–69) and PA (86–97) were rather low and several PS (44–69) species tended to decrease, whereas 34:1-PA (92) and 36:3-PA (96) increased (Fig. 3C; leaf). No significant difference in any PC and PI species was observed between N-sufficient and N- deficient leaves.
Figure 3. Molecular species of glycerolipids in soybean seedlings under 0.5 mM and 5 mM nitrogen conditions.
Lipids were extracted from leaves and roots of 15 days old soybean, grown under nitrogen sufficient (5 mM) and deficient conditions (0.5 mM). The values are the mean ± SE (n = 15). P < 0.05 is indicated by *. The value for nitrogen-deficient seedlings is higher (represented as H) or lower (represented as L) than the value for nitrogen sufficient seedlings.
In roots under N deficiency, the levels of 36:4-PC (8) and 34:1-PC (5) were lower. The level of 36:4-PE (31) was also decreased but several 32-carbon species, including 32:0-PE (24), and longer chained PE (39–43) species, including 42:3-PE (42), were increased in roots (Fig. 3B; root). Most PA and PS species were unchanged by N deficiency, but 42:3-PS (65), 36:6-PA (93), and 32:0-PA (86) were higher in roots (Fig. 3C, root; Supplemental Table 1). The levels of lysophospholipids were comparable between N-sufficient and deficient conditions, with significant decreases occurring only to 18:2-LPC (149) and 18:1-LPC (150) under N deficiency (Fig. 3D). Thus, while the content of total phospholipids remained relatively constant in N- sufficient and deficient growth conditions, quantitative profiling of lipid molecular species reveals that N deficiency differentially affected specific molecular species of galactolipids and phospholipids in leaves and roots.
2.3. Nodulation increases accumulation of galactolipids and phospholipids in leaves
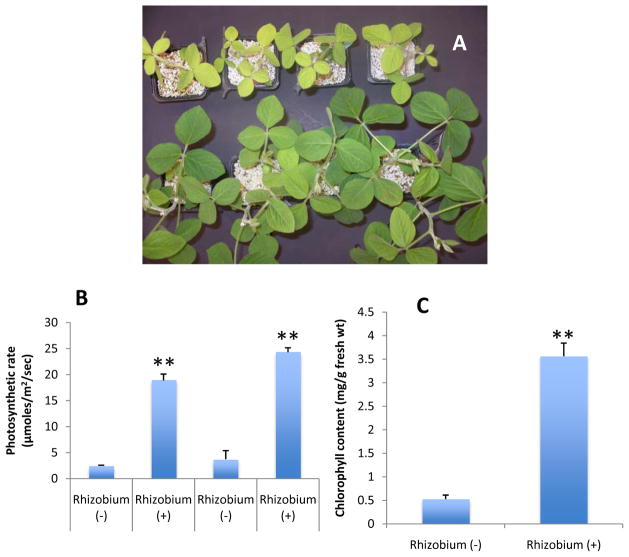
To study the effect of nodulation on polar lipid changes of soybean, one week-old seedlings were infected with Bradyrhizobium japonicum. The seedlings were given complete nutrition without N every two days for four weeks. The infected seedlings had more leaves and a normal phenotype (Fig. 4A, bottom panel) while seedlings grown without Bradyrhizobium nodulation showed stunted growth with fewer leaves (Fig. 4A, top panel). Leaves of Bradyrhizobium–nodulated seedlings displayed a significantly higher photosynthetic rate (Fig. 4B) and chlorophyll content (Fig. 4C). These results clearly indicate that the nodules produced by Bradyrhizobium are efficiently fixing atmospheric N, overcoming nitrogen deficiency.
Figure 4. Effect of Bradyrhizobium on N deficient soybean seedlings.
A. Seedlings showing recovery from nitrogen starvation upon Bradyrhizobium infection. The top panel represents the seedlings grown on nutrient solution devoid of nitrogen fertilizer and bottom panel represents the seedlings grown without nitrogen but inoculated with Bradyrhizobium japonicum.
B. Comparison of photosynthetic rate between soybean seedlings with and without Bradyrhizobium inoculation.
C. Chlorophyll content of soybean seedlings in response to Bradyrhizobium treatment. The chlorophyll content of leaves was measured four weeks after inoculation before harvesting the samples.
Values are means ± SE (n = 5). ** P < 0.01 compared with un-inoculated condition based on one-way ANOVA
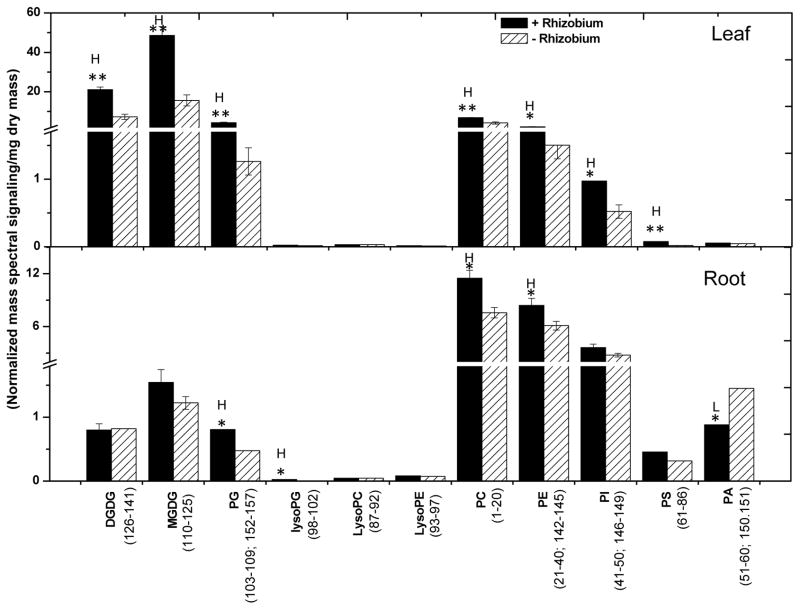
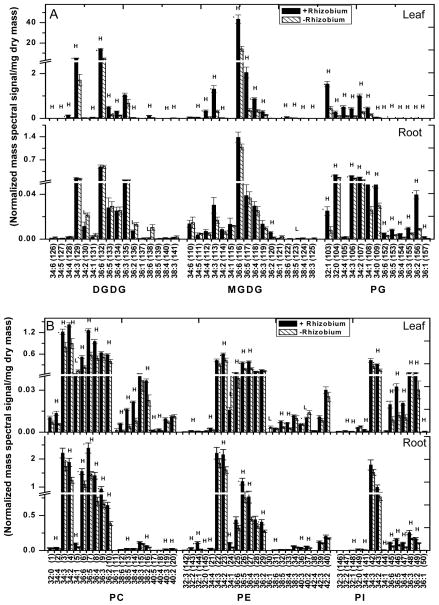
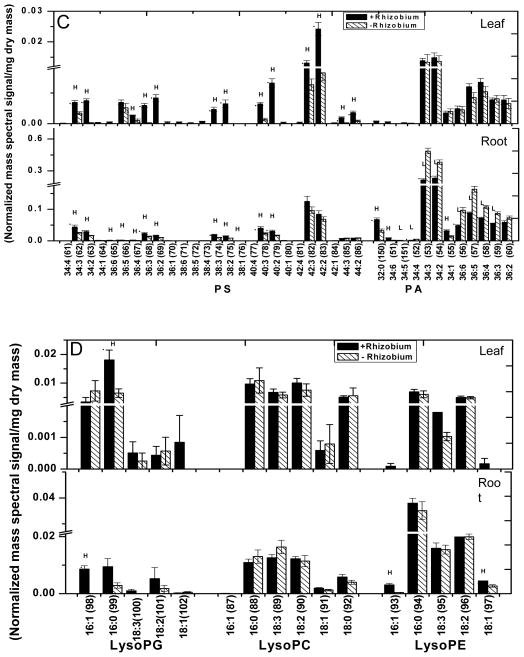
Lipids were extracted from the leaves and roots of Bradyrhizobium-infected and uninfected controls for comparative studies. Leaves of the nodulated seedlings had total lipid levels (compared to dry mass) more than 2.5 times those of non-nodulated seedlings; both galactolipids and phospholipids contributed to the higher levels (Fig. 5; Supplemental Table 2). The plastidic lipids DGDG (70–85), MGDG (98–113) and PG (114–125) levels were 2.9, 3.1, and 3.4-fold higher, respectively, than levels in leaves of uninfected seedlings. The leaf phospholipids PC (1–20), PE (21–43), PI (127–140) and PS (44–69) were 1.6, 1.5, 1.8, and 3.6 fold higher than non-nodulated seedlings (Fig. 5). Leaves of nodulated soybean seedlings exhibited increases in most galactolipid and phospholipid species analyzed (Fig. 6A, 6B and 6C; leaf). Leaves of nodulated seedlings had a major increase in 16:0-LPG (142) in leaves whereas the level of all other species of LPG (141–145), LPC (146–151), and LPE (152–156) remained comparable to that of leaves of non-nodulated seedlings (Fig. 6D; leaf).
Figure 5. Effect of Bradyrhizobium infection on lipid content of soybean seedlings.
Lipids were extracted from four week old soybean leaves and roots grown with (hatched bars) or without Bradyrhizobium infection (solid bars). Values are the mean ± SE (n=5). Total polar glycerolipids are expressed as normalized mass spectral signal/mg dry mass. P < 0.05 is represented by * and P <0.01 by **. The value for Bradyrhizobium inoculated seedlings is higher (represented as H) and lower (represented as L) than the value for non-inoculated seedlings.
Figure 6. Difference in molecular species of polar lipids between Bradyrhizobium inoculated (hatched) and un-inoculated (solid bars) soybean leaves and roots.
Soybean seedlings were germinated and maintained on nitrogen free plant nutrient solution. One week old seedlings were infected with Bradyrhizobium japonicum and seedlings were maintained for four weeks. Data are expressed as mean ± SE (n = 5). P < 0.05, represented as *. The value for Bradyrhizobium inoculated seedlings is higher (represented as H) and lower (represented as L) than the value for non-inoculated seedlings.
2.4. Nodulation increases phospholipids in roots
The change after nodulation of galactolipids vs. phospholipids in roots was distinctively different from that in leaves. Roots were sampled one to two centimeters from the root tip to avoid nodules and ensure that no nodule lipids were analyzed. The PG (114–126) (1.7 times that of control) and its derivative LPG (141–145) were the only plastidic lipid class with significantly higher levels in nodulated compared to non-nodulated roots (Fig. 5; Supplemental Table 2). In roots, a 35% increase in total lipids occurred mainly because of a higher amount of phospholipids (Fig. 5). Most species of PC (2,4–9,13,16,19,20), PE (22–25,27,28,30,31,33,35,39,40), PG (114,115,117–126), PI (129,131,134–139), and PS (45,46,48–52,57–59,61,62) were increased, but the major PA species, including 34:3- (90), 34:2- (91), 36:6- (93), 36:5- (94), 36:4- (95) and 36:3-(96) PA, were all decreased in nodulated roots (Fig. 6B and 6C; root). In roots, 16:0-LPG (142), 16:1-LPG (141), 16:1-LPE (152), and 18:1-LPE (156) were increased, but there was no change in the level of LPC in nodulated compared to non-nodulated roots (Fig. 6D; root). By comparison, roots of nodulated seedlings did not show increases in major DGDG (76) species or MGDG (104) 36:6 species (Fig. 6A; root).
2.5. Comparison of lipid changes as affected by added N and nodulation
Lipid changes as affected by 5 mM and 0.5 mM N were compared with those with and without nodulation (Table 1). Ratios of MGDG/DGDG (98–113/70–85), DGDG/PC (70–85/1–20), and DGDG/PE (70–85/21–43) indicate a similar pattern in the leaves between nitrogen-deficient and non-nodulated seedlings, even though in the nodulation study no N was added and seedlings were 2 weeks older than those in the supplementation study. Nodulated seedlings were able to fix N and grew like N-sufficient seedlings. Ratios of total galactolipids (MGDG (98–113) + DGDG (70–85)) to total phospholipids in leaves were remarkably similar between N-sufficient and nodulated plants (Table 1), in spite of seedling age differences between nodulation and N supplementation experiments. Ratios of MGDG/DGDG (98–113/70–85), DGDG/PC (70–85/1–20), and DGDG/PE (70–85/21–43) also show a similar pattern in the leaves between nitrogen-sufficient and nodulated seedlings. These results indicate that increased galactolipid biosynthesis in leaves is correlated with increased N availability, irrespective of N sources supplied by symbiotical fixation or soil. In roots, however, lipid compositions displayed distinctive differences between N-sufficient and nodulated seedlings (Table 1). The ratio of galactolipids to phospholipids increased in N-sufficient roots, but not in nodulated roots. This is more apparent when the ratios of DGDG (70–85) to PC (1–20), both of which are bilayer-forming lipids, were compared (0.12 for N-sufficient roots and 0.07 for nodulated roots). In addition, the ratio of MGDG (98–113) to DGDG (70–85) in nodulated roots was almost two-fold greater than that in N-sufficient roots.
Table 1.
Comparison of galactolipid and phospholipid changes as affected by added N and nodulation. Lipids were extracted from two week old soybean leaves and roots grown under nitrogen sufficient (5 mM) and deficient conditions (0.5 mM).
| Leaf | ||||||||
|---|---|---|---|---|---|---|---|---|
| Nitrogen | Rhizobium | |||||||
| 5 mM | SD | 0.5 mM | SD | + | SD | - | SD | |
| MGDG/DGDG (98–113/70–85) | 2.16 | 0.13 | 1.9 | 0.11 | 2.30 | 0.14 | 2.18 | 0.19 |
| DGDG/PC (70–85/1–20) | 3.19 | 0.36 | 1.71 | 0.19 | 3.10 | 0.15 | 1.74 | 0.26 |
| DGDG/PE (70–85/21–43) | 8.99 | 1.06 | 4.73 | 0.51 | 9.45 | 0.64 | 4.78 | 0.91 |
| GL/PL (70–85; 98–126)/(1–69,86–97,127–156) | 4.75 | 0.56 | 2.55 | 0.30 | 4.78 | 0.28 | 3.02 | 0.45 |
| Root | ||||||||
| Nitrogen | Rhizobium | |||||||
| 5 mM | SD | 0.5 mM | SD | + | SD | - | SD | |
| MGDG/DGDG (98–113/70–85) | 1.0 | 0.07 | 1.5 | 0.15 | 1.96 | 0.10 | 1.50 | 0.19 |
| DGDG/PC 70–85/1–20) | 0.12 | 0.01 | 0.06 | 0.002 | 0.07 | 0.002 | 0.11 | 0.01 |
| DGDG/PE (70–85/21–43) | 0.19 | 0.01 | 0.10 | 0.01 | 0.10 | 0.01 | 0.14 | 0.02 |
| GL/PL (70–85; 98–126)/(1–69,86–97,127–156) | 0.11 | 0.01 | 0.07 | 0.01 | 0.10 | 0.01 | 0.11 | 0.01 |
The values are the average of 15 replicates of three independent experiments with ±SD. For the nodulation experiment, four week old leaves and roots were used for lipid extraction. The values are average of 5 replicates with ±SD. ESI-MS/MS was used to analyze the lipids. GL, galactolipids; PL, phospholipids
3. Discussion
The results show that in spite of having N in their structure, the contents of major phospholipids, PC (1–20) and PE (21–43), are comparable between N-deficient and sufficient conditions in both leaves and roots of soybean. This lack of apparent phospholipid hydrolysis could be attributed to the fact that around 75–80% of leaf N is present in chloroplasts, mainly in photosynthetic proteins (Ishida and Wada, 2009) and that the amount of N present in N-containing phospholipids is low relative to total cellular N. For example, on a per gram fresh mass, Arabidopsis leaves contain approximately 1.7 μmol N in phospholipids, 6.0 μmol N in chlorophyll, and 100 μmol N in protein-component amino acids (Gaude et al., 2007). In comparison, phospholipids contain almost one third of cellular phosphates.
The largest quantitative impact on membrane lipids by N deprivation is cellular content of galactolipids MGDG (98–113) and DGDG (70–85) in leaves. MGDG (98–113) plays important roles in photosynthetic reactions, including photoprotection, regulation of non-photochemical quenching and pigment composition, and generation of proton motive force under high light across the thylakoid membrane (Aronsson et al., 2008). DGDG (70–85) is crucial for maintaining an optimal efficiency of photosynthetic electron flow by affecting both photosystem I (PSI) and PSII activities (Härtel et al., 1997; Holzl et al., 2009; Liu et al., 2004; Loll et al., 2005). More than half of the total leaf N is allocated to the photosynthetic apparatus, and photosynthetic capacities are positively correlated with the total amount of leaf N per unit leaf area (Walcroft et al., 1997). The large decrease in MGDG (98–113) and DGDG (70–85) in N deprived soybean could be a consequence of decreased biogenesis of chloroplasts and photosynthetic apparatus. On the other hand, decreases in galactolipids could in turn impede thylakoid and chloroplast proliferation, thereby decreasing cell division and plant growth.
The ratio of bilayer to non-bilayer-forming lipids is crucial for maintaining membrane stability and the functional activity of membrane proteins (Williams, 1998). Due to differences in head group size, MGDG (98–113) and DGDG (70–85) have propensities to form non-bilayer and bilayer structures, respectively. A decrease in MGDG/DGDG (98–113/70–85) ratio was observed in Arabidopsis and algae, and the change resulted mainly from an increase in DGDG (70–85) under N starvation (Gaude et al., 2007). The same study also showed that N deficiency compromised chloroplast ultrastructure and thylakoid membrane system, and there was increased accumulation of large starch granules and plastoglobules in the stroma. The increases in starch granules and plastoglobules associated with disrupted grana and stroma lamellae were also observed in N-starved citrus leaves (Bondada and Syvertsen, 2005). In this study, the ratio of MGDG/DGDG (98–113/70–85) decreased in leaves but increased in roots in response to N deprivation, suggesting the two classes of galactolipids change differentially in leaves and roots. In soybean cotyledons, the level of MGDG (98–113) was reported to parallel plastid ultrastructure more closely than the level of DGDG (70–85) does (Huber and Newman, 1976). The decrease in MGDG (98–113) in leaves under N deficiency could mean that the chloroplast membrane structure is compromised by N deficiency in the present study.
PG (114–126) is the major phospholipid present at significant levels in thylakoid membrane of higher plants (Wada and Murata, 1998). It is involved in photosynthetic electron transport in PSII, the assembly of PSII complexes and LHCII trimer formation that is required for granal stacking and development of thylakoid membrane (Babiychuk et al., 2003; Droppa et al., 1995; Sakurai eti. al., 2003; Sakurai et al., 2007). However, the level of PG (114–126) was not significantly changed, despite the large decrease in galactolipids, under N deprivation. The change in PG (114–126) content is more in line with extraplastidic phospholipids than plastidic galactolipids. The results indicate that N deprivation affects phospholipid metabolism differently from galactolipid metabolism. Unlike N deprivation conditions, however, the PG (114–126) levels in nodulated plants are significantly higher than unnodulated plants, and this increase may be associated with increased plastid membrane biogenesis with increased availability of N fixed by nodulation.
Whereas most lipid species were decreased or not changed, some PE (28,43) species increased under N deficiency. Unique to PE (21–43) is its involvement in autophagy and, potentially, N remobilization. N remobilization is a critical process for survival, growth, and development under stress conditions, such as N deprivation. Vacuolar autophagy is a process by which bulk of cytoplasmic components including macromolecules are degraded by resident enzymes (Chen et al., 1994; Hanaoka et al., 2002). This recycling system involves a number of autophagy related (ATG) proteins, with PE being covalently attached to ATG8. The ATG8-PE adduct play a role in promoting the expansion of autophagosomal membrane and fusion of this membrane with the vacuolar membrane (Nakatogawa et al., 2007). The ATG8-PE adduct is used as an indicator of crop nutritional status as the levels of the adduct increases during senescence and N deficiency. Whether the increase in some PE (28,43) species under N deficiency is related to ATG-PE adduct formation and how the change in PE (21–43) levels affects autophagal process requires further investigation.
PA (86,97) is another class of phospholipids displaying increases in some species under N deficiency. It has been implicated in mediating plant sensing and response to N deprivation (Hong et al., 2009). Analyses of AtPLDε knockout and over-expression in Arabidopsis suggest that PLDε hydrolyzes PE (21–43) to produce PA (86–97) and promotes root growth and root hair elongation in Arabidopsis (Hong et al., 2009). The present study shows that PA is increased under N deprivation but decreased in nodulated plant roots. The increase could be associated with increased phospholipid hydrolysis in response to N starvation, but whether the PA (86–97) increase plays a role in plant response to N deficiency requires further investigation.
4. Concluding remarks
Unlike in phosphate deprivation, when phospholipids are hydrolyzed to produce phosphorus for cell metabolism and diacylglycerol for galactolipid synthesis, in N-deprivation the content of membrane phospholipids in soybean tissues is stable. During N deficiency, there is a large decrease in plastidic galactolipids. Increased galactolipid levels in leaves result from increased N availability irrespective of N sources supplied by symbiotic fixation or supplementation, in spite of the fact that the seedlings in the nodulation studies were two weeks older than the N-supplementation experiments. In roots, however, the lipid compositions displayed distinctive differences between N levels supplied in soil vs nodulation. Whether the difference in seedling age between the nodulation and N-supplementation contributed to the difference remains to be determined. Nodulated roots accumulate more phospholipids and more MGDG (98–113) to DGDG (70–85) than roots supplied with sufficient N. The results suggest elevated glycerophospholipid biosynthesis in nodulated roots.
5. Experimental
5.1. Plant growth and nitrogen treatments
Soybean (Glycine max cv Jack) seeds were surface sterilized by treating with 8% Clorox for 5 min followed by a EtOH –H2O (70:30, V/V) wash for 5 min. The seeds were thoroughly rinsed three to four times with sterilized distilled H2O. Seeds were sown in a mixture of vermiculite and perlite (1:3 ratio; Hummert International, St. Louis, MO) and watered with plant nutrient solution (PNS; (Subramanian et al., 2006) with varied nitrogen content. The nitrogen sufficient condition for soybean was created by adding 5 mM nitrogen (2.5 mM NH4NO3) and the nitrogen deficient condition by 0.5 mM nitrogen (0.25 mM NH4NO3). The induction of nitrogen starvation was confirmed by measuring leaf area and chlorophyll content 15 days after beginning N limitation. Leaf area was calculated as maximum length multiplied by maximum breadth in centimeters. Chlorophyll content was estimated as reported (Hiscox and Israelstam, 1979). In brief, leaf tissues (100mg) were incubated in 3 mL or 10 mL of acetone:DMSO (1:1) mixture in dark overnight or until the tissue was completely bleached. Chlorophyll was estimated spectrophotometrically at 663, 645 and 653 nm and content was calculated using the formulae: 20.2*(A645) + 8.02*(A663)*(V(mL)/(1000*fresh mass in g*path length of light). Leaves and roots were harvested from 15-day-old seedlings grown under normal and nitrogen starved conditions for lipid profiling.
5.2. Bradyrhizobium japonicum treatment
Glycine max cv. Jack seeds were surface sterilized and then sown on a potting mixture consisting of sterilized vermiculite and perlite (1:3 ratio) and watered with N free plant nutrient solution (N-PNS). Bradyrhizobium japonicum cells (USDA110; a kind gift from Dr. Oliver Yu, Danforth Plant Science Center) were cultured in Vincent’s rich medium (Vincent, 1970). Cells were collected after centrifugation at 3000g x 10 min and suspended at a final concentration of 108 cells per mL (OD600 = 0.08) in N-PNS medium. One-week-old seedlings were treated with Bradyrhizobium japonicum by flooding the pots with the cell suspension (10 mL/4″ pot) while sufficient care was taken to avoid run-off mainly by maintaining the required H2O status of the potting mixture. Seedlings without inoculation of Bradyrhizobium japonicum were the controls. The seedlings were watered every 2 days with PNS medium without N for three weeks before they were harvested by pulling the roots out of the vermiculite:perlite mix and washing with H2O. Four week old leaves and roots were sampled for lipid analysis. For root sampling, 1 to 2 cm was cut from the root tip, and nodules were not included. Similarly, non-nodulated control plant roots were cut 1 to 2 cm from the root tip. Chlorophyll content and photosynthetic rate were documented as indicative parameters of nodule formation. Photosynthetic rate was recorded on fully expanded leaf using a portable gas exchange system (LICOR6400-XT; LICOR Biosciences).
5.3. Lipid extraction and profiling
Lipids were extracted from leaves and roots (1 to 2 cm from the root tip) of soybean as described for Arabidopsis (Welti et al., 2002). In brief, five replicates of leaves and roots were excised from soybean seedlings and immediately immersed in iPrOH (3mL) containing 0.01% butylated hydroxytoluene at 75°C with each replicate incubated at 75°C for 15 min to inhibit lipolytic activities. CHCl3 (1.5 mL) and H2O (0.6 mL) were individually added to samples, which were placed on a shaker for 1 h, after which each solvent was transferred to a new tube. Samples were re-extracted with CHCl3: CH3OH (2:1) at least 4 times with 30 min of agitation each time. Extracts for each replicates were combined and washed with 1 M KCl followed by sterile H2O (1 mL). Each solvent was evaporated under N2 in order to concentrate the lipids, with each lipid sample finally dissolved in CHCl3 (1 mL). Each tissue was oven dried at 100°C overnight and weighed with a precision balance to determine dry weight.
Lipid samples were analyzed using an electrospray ionization triple quadrupole mass spectrometer (API 4000; Applied Biosystems, Foster City, CA) as described by Xiao et al. (2010). The molecular species of phospholipids and galactolipids were quantified in comparison to the two internal standards. The internal standards for galactolipids were 2.01 nmol 16:0–18:0- MGDG, 0.39 nmol di18:0-MGDG, 0.49 nmol 16:0–18:0- DGDG, and 0.71 nmol di18:0-DGD, purchased from Matreya, Inc. (State College, PA). The internal standards for phospholipids were 0.66 nmol di14:0-PC, 0.66 nmol di24:1- PC, 0.66 nmol 13:0-LPC, 0.66 nmol 19:0-LPC, 0.36 nmol di14:0-PE, 0.36 nmol di24:1-PE, 0.36 nmol 14:0-LPE, 0.36 nmol 18:0-LPE, 0.36 nmol di14:0- PG, 0.36 nmol di24:1-PG, 0.36 nmol 14:0-LPG, 0.36 nmol 18:0-LPG, 0.36 nmol di14:0-PA, 0.36 nmol di20:0 (phytanoyl)-PA, 0.24 nmol di14:0-PS, 0.24 nmol di20:0 (phytanoyl)-PS, 0.20 nmol 16:0–18:0-PI and 0.16 nmol di18:0-PI. All phospholipid standards were obtained from Avanti Polar Lipids, Inc. (Alabaster, AL), except for di24:1-PE and di24:1-PG, which were prepared by transphosphatidylation of di24:1-PC. The quantity of each lipid was determined as a normalized mass spectral signal (i.e., normalized to the two internal standards of that class), as described by Maatta et al. (2012). The normalized signal was divided either by extracted dry mass (to produce normalized mass spectral (MS) signal/mg extracted dry mass) or by total normalized signal (to produce percentage of normalized MS signal). This approach allows comparison of quantities of lipid species and classes among samples. Five replicates of each treatment for each phenotype were processed and analyzed. Paired values were subjected to the one-way ANOVA test to determine the statistical significance.
Supplementary Material
Amounts of polar lipid molecular species as affected by nitrogen deficiency. Leaves and roots of 15-day-old seedling exposed to nitrogen sufficient (5 mM) and deficient (0.5 mM) conditions were used to analyze the lipids. Five biological replications were maintained for each experiment and the experiment was repeated three times. Lipids were analyzed by ESI-MS/MS and the intensities in each spectrum were normalized to those two internal standards of the same class; a signal of 1 is the same amount of intensity as 1 nmol of the standards. The data represent the average of 15 replicates. The data of nitrogen sufficient and deficient conditions were compared using one-way ANOVA and the p values are reported. p values of <0.05 are presented in bold. The reduction in lipid species content under nitrogen starvation is denoted with negative (−) values.
Amounts of polar lipid molecular species as affected by Bradyrhizobium inoculation. Leaves and roots of four week old seedlings inoculated with Bradyrhizobium (+) and uninoculated (−) were used to analyze the lipids. Five biological replications were maintained for the experiment. The lipids were analyzed by ESI-MS/MS and the intensities in each spectrum were normalized to those two internal standards of the same class; a signal of 1 is the same amount of intensity as 1 nmol of the standards. The data represent the average of 5 replicates. The data from Bradyrhizobium inoculated seedlings were compared with those from un-inoculated seedlings, using one-way ANOVA and the p values are reported. The p value <0.05 is presented in bold. A reduction in lipid species content upon Bradyrhizobium inoculation is denoted by a minus (−) sign.
Acknowledgments
This work was supported by the US Department of Agriculture Grant 2007-35318-18393. Equipment acquisition and method development at the Kansas Lipidomics Research Center were funded by the National Science Foundation (EPS 0236913, MCB 0455318 and 0920663, DBI 0521587), Kansas Technology Enterprise Corporation, Kansas IDeA Network of Biomedical Research Excellence (K-INBRE) of National Institutes of Health (P20RR16475), and Kansas State University.
Abbreviations
- DGDG
digalactosyldiacylglycerol
- MGDG
monogalactosyldiacyglycerol
- PA
phosphatidic acid
- PC
phosphatidylcholine
- PE
phosphatidylethanolamine
- PG
phosphatidylglycerol
- PI
phosphatidylinositol
- PLD
phospholipase D
- PS
phosphatidylserine
References
- Aronsson H, Schottler MA, Kelly AA, Sundqvist C, Dormann P, Karim S, Jarvis P. Monogalactosyldiacylglycerol deficiency in Arabidopsis affects pigment composition in the prolamellar body and impairs thylakoid membrane energization and photoprotection in leaves. Plant Physiol. 2008;148:580–592. doi: 10.1104/pp.108.123372. [DOI] [PMC free article] [PubMed] [Google Scholar]
- Babiychuk E, Muller F, Eubel H, Braun HP, Frentzen M, Kushnir S. Arabidopsis phosphatidylglycerophosphate synthase 1 is essential for chloroplast differentiation, but is dispensable for mitochondrial function. Plant J. 2003;33:899–909. doi: 10.1046/j.1365-313x.2003.01680.x. [DOI] [PubMed] [Google Scholar]
- Bondada BR, Syvertsen JP. Concurrent changes in net CO2 assimilation and chloroplast ultrastructure in nitrogen deficient citrus leaves. Environ Exp Bot. 2005;25:41–48. [Google Scholar]
- Boussadia O, Steppe K, Zgallai H, Ben EHS, Braham M, Lemeur R, Van LM. Effects of nitrogen deficiency on leaf photosynthesis, carbohydrate status and biomass production in two olive cultivars ‘Meski’ and ‘Koroneiki’. Sci Hortic. 2010;123:336–342. [Google Scholar]
- Chen M-H, Liu L-F, Chen Y-R, Wu H-K, Yu S-M. Expression of α-amylases, carbohydrate metabolism, and autophagy in cultured rice cells is coordinately regulated by sugar nutrient. Plant J. 1994;6:625–636. doi: 10.1046/j.1365-313x.1994.6050625.x. [DOI] [PubMed] [Google Scholar]
- Crawford N, Forde B. Molecular and developmental biology of inorganic nitrogen nutrition. In: Meyerowitz E, Somerville C, editors. Arabidopsis Book. Rockville, MD: American Society of Plant Biologists; 2002. [DOI] [PMC free article] [PubMed] [Google Scholar]
- Devaiah SP, Roth MR, Baughman E, Li M, Tamura P, Jeannotte R, Welti R, Wang X. Quantitative profiling of polar glycerolipid species from organs of wild-type Arabidopsis and a PHOSPHOLIPASE Da1 knockout mutant. Phytochemistry. 2006;67:1907–1924. doi: 10.1016/j.phytochem.2006.06.005. [DOI] [PubMed] [Google Scholar]
- Droppa M, Horváth G, Hideg É, Farkas T. The role of phospholipids in regulating photosynthetic electron transport activities: Treatment of thylakoids with phospholipase C. Photosynth Res. 1995;46:287–293. doi: 10.1007/BF00020442. [DOI] [PubMed] [Google Scholar]
- Gaude N, Brehelin C, Tischendorf G, Kessler F, Dormann P. Nitrogen deficiency in Arabidopsis affects galactolipid composition and gene expression and results in accumulation of fatty acid phytyl esters. Plant J. 2007;49:729–739. doi: 10.1111/j.1365-313X.2006.02992.x. [DOI] [PubMed] [Google Scholar]
- Gaude N, Nakamura Y, Scheible W-R, Ohta H, Dörmann P. Phospholipase C5 (NPC5) is involved in galactolipid accumulation during phosphate limitation in leaves of Arabidopsis. Plant J. 2008;56:28–39. doi: 10.1111/j.1365-313X.2008.03582.x. [DOI] [PubMed] [Google Scholar]
- Good AG, Shrawat AK, Muench DG. Can less yield more? Is reducing nutrient input into the environment compatible with maintaining crop production? Trends Plant Sci. 2004;9:597–605. doi: 10.1016/j.tplants.2004.10.008. [DOI] [PubMed] [Google Scholar]
- Guo FQ, Wang R, Chen M, Crawford NM. The Arabidopsis dual-affinity nitrate transporter gene AtNRT1.1 (CHL1) is activated and functions in nascent organ development during vegetative and reproductive growth. Plant cell. 2001;13:1761–1777. doi: 10.11054/TPC.010126. [DOI] [PMC free article] [PubMed] [Google Scholar]
- Hanaoka H, Noda T, Shirano Y, Kato T, Hayashi H, Shibata D, Tabata S, Ohsumi Y. Leaf senescence and starvation-induced chlorosis are accelerated by the disruption of an Arabidopsis autophagy gene. Plant Physiol. 2002;129:1181–1193. doi: 10.1104/pp.011024. [DOI] [PMC free article] [PubMed] [Google Scholar]
- Härtel H, Lokstein H, Dörmann P, Grimm B, Benning C. Changes in the composition of the photosynthetic apparatus in the galactolipid-deficient dgd1 mutant of Arabidopsis thaliana. Plant Physiol. 1997;115:1175–1184. doi: 10.1104/pp.115.3.1175. [DOI] [PMC free article] [PubMed] [Google Scholar]
- Israelstam Hiscox. Different methods of chlorophyll extraction. Can J Bot. 1979;57:1332–1334. [Google Scholar]
- Holzl G, Witt S, Gaude N, Melzer M, Schottler MA, Dormann P. The role of diglycosyl lipids in photosynthesis and membrane lipid homeostasis in Arabidopsis. Plant Physiol. 2009;150:1147–1159. doi: 10.1104/pp.109.139758. [DOI] [PMC free article] [PubMed] [Google Scholar]
- Hong Y, Devaiah SP, Bahn SC, Thamasandra BN, Li M, Welti R, Wang X. Phospholipase Dε and phosphatidic acid enhance Arabidopsis nitrogen signaling and growth. Plant J. 2009;58:376–387. doi: 10.1111/j.1365-313X.2009.03788.x. [DOI] [PMC free article] [PubMed] [Google Scholar]
- Huber DJ, Newman DH. Relationships between lipid changes and plastid ultra-structural changes in senescing and regreening soybean cotyledons. J Exp Bot. 1976;27:490–511. [Google Scholar]
- Ishida H, Wada S. Autophagy of whole and partial chloroplasts in individually darkened leaves: a unique system in plants? Autophagy. 2009;5:736–737. doi: 10.4161/auto.5.5.8568. [DOI] [PubMed] [Google Scholar]
- Lawlor DW. Carbon and nitrogen assimilation in relation to yield: mechanisms are the key to understanding production systems. J Exp Bot. 2002;53:773–787. [PubMed] [Google Scholar]
- Li M, Qin C, Welti R, Wang X. Double knockouts of phospholipases Dς1 and Dς2 in Arabidopsis affect root elongation during phosphate-limited growth but do not affect root hair patterning. Plant Physiol. 2006;140:761–770. doi: 10.1104/pp.105.070995. [DOI] [PMC free article] [PubMed] [Google Scholar]
- Little DY, Rao H, Oliva S, Daniel-Vedele F, Krapp A, Malamy JE. The putative high-affinity nitrate transporter NRT2.1 represses lateral root initiation in response to nutritional cues. Proc Natl Acad Sci U S A. 2005;102:13693–13698. doi: 10.1073/pnas.0504219102. [DOI] [PMC free article] [PubMed] [Google Scholar]
- Liu Z, Yan H, Wang K, Kuang T, Zhang J, Gui L, An X, Chang W. Crystal structure of spinach major light-harvesting complex at 2.72 Å resolution. Nature. 2004;428:287–292. doi: 10.1038/nature02373. [DOI] [PubMed] [Google Scholar]
- Loll B, Kern J, Saenger W, Zouni A, Biesiadka J. Towards complete cofactor arrangement in the 3.0 Å resolution structure of photosystem II. Nature. 2005;438:1040–1044. doi: 10.1038/nature04224. [DOI] [PubMed] [Google Scholar]
- Maatta S, Scheu B, Roth MR, Tamura P, Li M, Williams TD, Wang X, Welti R. Levels of Arabidopsis thaliana leaf phosphatidic acids, phosphatidylserines, and most trienoate-containing polar lipid molecular species increase during the dark period of the diurnal cycle. Front Plant Sci. 2012;3:1–12. doi: 10.3389/fpls.2012.00049. [DOI] [PMC free article] [PubMed] [Google Scholar]
- Nakatogawa H, Ichimura Y, Ohsumi Y. Atg8, a ubiquitin-like protein required for autophagosome formation, mediates membrane tethering and hemifusion. Cell. 2007;130:165–178. doi: 10.1016/j.cell.2007.05.021. [DOI] [PubMed] [Google Scholar]
- Ono K, Terashima I, Watanabe A. Interaction between nitrogen deficit of a plant and nitrogen content in the old leaves. Plant Cell Physiol. 1996;37:1083–1089. [Google Scholar]
- Orsel M, Chopin F, Leleu O, Smith SJ, Krapp A, Daniel-Vedele F, Miller AJ. Characterization of a two-component high-affinity nitrate uptake system in Arabidopsis. Physiology and protein-protein interaction Plant Physiol. 2006;142:1304–1317. doi: 10.1104/pp.106.085209. [DOI] [PMC free article] [PubMed] [Google Scholar]
- Peng M, Hannam C, Gu H, Bi Y-M, Rothstein SJ. A mutation in NLA, which encodes a RING-type ubiquitin ligase, disrupts the adaptability of Arabidopsis to nitrogen limitation. Plant J. 2007;50:320–337. doi: 10.1111/j.1365-313X.2007.03050.x. [DOI] [PubMed] [Google Scholar]
- Remans T, Nacry P, Pervent M, Girin T, Tillard P, Lepetit M, Gojon A. A central role for the nitrate transporter NRT2.1 in the integrated morphological and physiological responses of the root system to nitrogen limitation in Arabidopsis. Plant Physiol. 2006;140:909–921. doi: 10.1104/pp.105.075721. [DOI] [PMC free article] [PubMed] [Google Scholar]
- Sakurai I, Hagio M, Gombos Z, Tyystjarvi T, Pakkarinen V, Aro E, Wada H. Requirement of phosphatidylglycerol for maintenance of photosynthetic machinery. Plant Physiol. 2003;133:1376–1384. doi: 10.1104/pp.103.026955. [DOI] [PMC free article] [PubMed] [Google Scholar]
- Sakurai I, Mizusawa N, Ohashi S, Kobayashi M, Wada H. Effects of the lack of phosphatidylglycerol on the donor side of photosystem II. Plant Physiol. 2007;144:1336–1346. doi: 10.1104/pp.107.098731. [DOI] [PMC free article] [PubMed] [Google Scholar]
- Scheible WR, Morcuende R, Czechowski T, Fritz C, Osuna D, Palacios-Rojas N, Schindelasch D, Thimm O, Udvardi MK, Stitt M. Genome-wide reprogramming of primary and secondary metabolism, protein synthesis, cellular growth processes, and the regulatory infrastructure of Arabidopsis in response to nitrogen. Plant Physiol. 2004;136:2483–2499. doi: 10.1104/pp.104.047019. [DOI] [PMC free article] [PubMed] [Google Scholar]
- Subramanian S, Stacey G, Yu O. Endogenous isoflavones are essential for the establishment of symbiosis between soybean and Bradyrhizobium japonicum. Plant J. 2006;48:261–273. doi: 10.1111/j.1365-313X.2006.02874.x. [DOI] [PubMed] [Google Scholar]
- Vincent M. A manual for the practical study of root nodule bacteria. Blackwell scientific publication; Oxford: 1970. [Google Scholar]
- Wada H, Murata N. Membrane lipids in cyanobacteria. In: Siegenthaler P, Murata N, editors. Lipids in photosynthesis: Structure, Function and Genetics. Kluwer Academic; Dordrecht, Netherlands: 1998. [Google Scholar]
- Walcroft AS, Whitehead D, Silvester WB, Kelliher FM. The response of photosynthetic model parameters to temperature and nitrogen concentration in Pinus radiata D. Don Plant, Cell Environ. 1997;20:1338–1348. [Google Scholar]
- Wang R, Okamoto M, Xing X, Crawford NM. Microarray analysis of the nitrate response in Arabidopsis roots and shoots reveals over 1,000 rapidly responding genes and new linkages to glucose, trehalose-6-phosphate, iron, and sulfate metabolism. Plant Physiol. 2003;132:556–567. doi: 10.1104/pp.103.021253. [DOI] [PMC free article] [PubMed] [Google Scholar]
- Welti R, Li W, Li M, Sang Y, Biesiada H, Zhou H-E, Rajashekar CB, Williams TD, Wang X. Profiling membrane lipids in plant stress responses. J Biol Chem. 2002;277:31994–32002. doi: 10.1074/jbc.M205375200. [DOI] [PubMed] [Google Scholar]
- Williams W. The physical properties of thylakoid membrane lipids and their relation to photosynthesis. In: Siegenthaler PA, Murata N, editors. Lipid in Photosynthesis: Structure, Function and Genetics. Kluwer Academic Publishers; Dordrecht: 1998. pp. 103–118. [Google Scholar]
- Xiao S, Gao W, Chen QF, Chan SW, Zheng SX, Ma J, Wang M, Welti R, Chye ML. Overexpression of Arabidopsis acyl-CoA binding protein ACBP3 promotes starvation-induced and age-dependent leaf senescence. Plant cell. 2010;22:1463–1482. doi: 10.1105/tpc.110.075333. [DOI] [PMC free article] [PubMed] [Google Scholar]
- Zhao D, Raja Reddy K, Kakani VG, Read JJ, Carter GA. Corn (Zea mays L.) growth, leaf pigment concentration, photosynthesis and leaf hyperspectral reflectance properties as affected by nitrogen supply. Plant Soil. 2003;257:205–218. [Google Scholar]
- Zheng ZL. Carbon and nitrogen nutrient balance signaling in plants. Plant Signaling Behav. 2009;4:584–591. doi: 10.4161/psb.4.7.8540. [DOI] [PMC free article] [PubMed] [Google Scholar]
Associated Data
This section collects any data citations, data availability statements, or supplementary materials included in this article.
Supplementary Materials
Amounts of polar lipid molecular species as affected by nitrogen deficiency. Leaves and roots of 15-day-old seedling exposed to nitrogen sufficient (5 mM) and deficient (0.5 mM) conditions were used to analyze the lipids. Five biological replications were maintained for each experiment and the experiment was repeated three times. Lipids were analyzed by ESI-MS/MS and the intensities in each spectrum were normalized to those two internal standards of the same class; a signal of 1 is the same amount of intensity as 1 nmol of the standards. The data represent the average of 15 replicates. The data of nitrogen sufficient and deficient conditions were compared using one-way ANOVA and the p values are reported. p values of <0.05 are presented in bold. The reduction in lipid species content under nitrogen starvation is denoted with negative (−) values.
Amounts of polar lipid molecular species as affected by Bradyrhizobium inoculation. Leaves and roots of four week old seedlings inoculated with Bradyrhizobium (+) and uninoculated (−) were used to analyze the lipids. Five biological replications were maintained for the experiment. The lipids were analyzed by ESI-MS/MS and the intensities in each spectrum were normalized to those two internal standards of the same class; a signal of 1 is the same amount of intensity as 1 nmol of the standards. The data represent the average of 5 replicates. The data from Bradyrhizobium inoculated seedlings were compared with those from un-inoculated seedlings, using one-way ANOVA and the p values are reported. The p value <0.05 is presented in bold. A reduction in lipid species content upon Bradyrhizobium inoculation is denoted by a minus (−) sign.


