

Significance
The activities of the fusion proteins that mediate virus–cell fusion are an absolute requirement for virus entry and infectivity of enveloped viruses such as HIV, influenza virus, measles virus, and respiratory syncytia virus, among others. Viral fusion proteins are translated initially in a metastable prefusion state and, upon triggering, undergo an extensive and irreversible refolding process. Membrane fusion is coupled to the energy released by the fusion proteins adopting a stable, low-energy postfusion state. Here we use oxidative footprinting of the parainfluenza virus 5 fusion protein to reveal new details of this critical event in the viral lifecycle. A greater understanding of the dynamic nature of these metastable proteins may reveal novel opportunities for the development of targeted therapeutics.
Keywords: protein refolding, viral fusion protein, mass spectroscopy
Abstract
To infect a cell, the Paramyxoviridae family of enveloped viruses relies on the coordinated action of a receptor-binding protein (variably HN, H, or G) and a more conserved metastable fusion protein (F) to effect membrane fusion and allow genomic transfer. Upon receptor binding, HN (H or G) triggers F to undergo an extensive refolding event to form a stable postfusion state. Little is known about the intermediate states of the F refolding process. Here, a soluble form of parainfluenza virus 5 F was triggered to refold using temperature and was footprinted along the refolding pathway using fast photochemical oxidation of proteins (FPOP). Localization of the oxidative label to solvent-exposed side chains was determined by high-resolution MS/MS. Globally, metastable prefusion F is oxidized more extensively than postfusion F, indicating that the prefusion state is more exposed to solvent and is more flexible. Among the first peptides to be oxidatively labeled after temperature-induced triggering is the hydrophobic fusion peptide. A comparison of peptide oxidation levels with the values of solvent-accessible surface area calculated from molecular dynamics simulations of available structural data reveals regions of the F protein that lie at the heart of its prefusion metastability. The strong correlation between the regions of F that experience greater-than-expected oxidative labeling and epitopes for neutralizing antibodies suggests that FPOP has a role in guiding the development of targeted therapeutics. Analysis of the residue levels of labeled F intermediates provides detailed insights into the mechanics of this critical refolding event.
The Paramyxoviridae family of enveloped viruses includes many medically and economically important pathogens (1). This large family of negative-sense, single-stranded RNA viruses includes measles virus (MeV), mumps virus, human parainfluenza viruses 1–4 (hPIV1–4), parainfluenza virus 5 (PIV5, formerly known as simian virus 5, SV5), human respiratory syncytial virus (hRSV), human metapneumovirus (hMPV), Newcastle disease virus (NDV), Sendai virus, and canine distemper virus (CDV). Newly discovered and highly pathogenic paramyxoviruses include the zoonotic Nipah and Hendra viruses. The recent discovery of 66 unique mammalian paramyxovirus sequences from bats and rodents (2) suggests that the impact of this virus family on human health will continue to grow.
Paramyxoviruses, like all enveloped viruses, possess a lipid bilayer that is derived from the host cell during viral egress. Paramyxovirus particles must fuse their membrane with the membrane of a target host cell for successful infection to occur. Embedded in the viral envelope are the viral spike glycoproteins necessary for receptor binding and fusion with a target cell. The receptor-binding and fusion activities are carried out by a variable attachment protein, known as “HN,” “H,” or “G” protein, and a more conserved fusion (F) protein, respectively (3–5). Coexpression of HN, H, or G and the F protein in the same cell is required to activate the F protein, and coimmunoprecipitation data indicate F and HN, H, or G interact physically through the HN, H, or G stalk region (5–13). Receptor specificity of the attachment protein (14–19) ensures that the F protein is activated at the correct time and place for a successful invasion of a target cell. Although F protein activation is mediated naturally via interaction with the HN, H, or G stalk domain in most paramyxovirus species (20–27), increased temperature can be used as a surrogate trigger for PIV5, CDV, and MeV F proteins (24, 28–32). F proteins from different paramyxoviruses have different energy requirements for activation (24, 29, 33, 34).
Paramyxovirus F proteins, together with influenza virus HA, Ebola virus GP, and HIV Env, among others, are classified as class I viral fusion proteins (35). Class I fusion proteins share the following characteristics: all are trimers, all initially fold in the endoplasmic reticulum into a metastable “prefusion” conformation, and all are synthesized as a precursor that must be cleaved to generate a new N terminus that is hydrophobic and known as the “fusion peptide” (FP). Cleavage usually is required for membrane fusion, viral infectivity, and pathogenicity (36–39).
The current model of class I fusion protein function posits that the metastable F protein, upon activation by HN, H, or G, undergoes a series of large-scale refolding events, going down an energy gradient from a metastable prefusion form to a final, stable postfusion form (reviewed in refs. 3, 5, and 40). The work done in refolding brings the lipid bilayers in close proximity so that membrane merger (fusion) can occur. Atomic structures have been obtained for PIV5 and hRSV F proteins in the prefusion form (41–43) and for hPIV3, NDV, and hRSV F proteins in the postfusion form (44–47). Together with biochemical data and EM images (11, 48, 49), these data give insight into the refolding process. However, detailed information derived directly from experimental data is lacking for the intermediate states.
It is thought that the heptad repeat B (HRB) region of the F protein (Fig. 1A), which comprises the prefusion stalk (Fig. 1B), opens upon triggering by receptor-bound HN, H, or G (48). This change allows the rearrangement and extension of the heptad repeat A (HRA) region at the top of the protein into an extended α-helical coiled-coil. The HRA coiled-coil inserts its attached N-terminal hydrophobic FP into the target membrane, extending 22 nm between the virus and the target cell (49) to give a transient intermediate structure of F, which is called the “prehairpin intermediate.” The F trimer then begins to fold back on itself, drawing the viral and host cell membranes together. The energy required to desolvate the membranes and then subsequently fuse them together is provided by the formation of the highly stable six-helix bundle (6HB) structure (Fig. 1C) (50, 51). Once the viral membrane has fused with the membrane of the target cell, the viral genome can enter the cytoplasm, and replication can begin. However, with the exception of the starting point (prefusion) and endpoint (postfusion) atomic structures for a handful of viral fusion proteins, little is known about the structural details of the intermediates in this critical process.
Fig. 1.
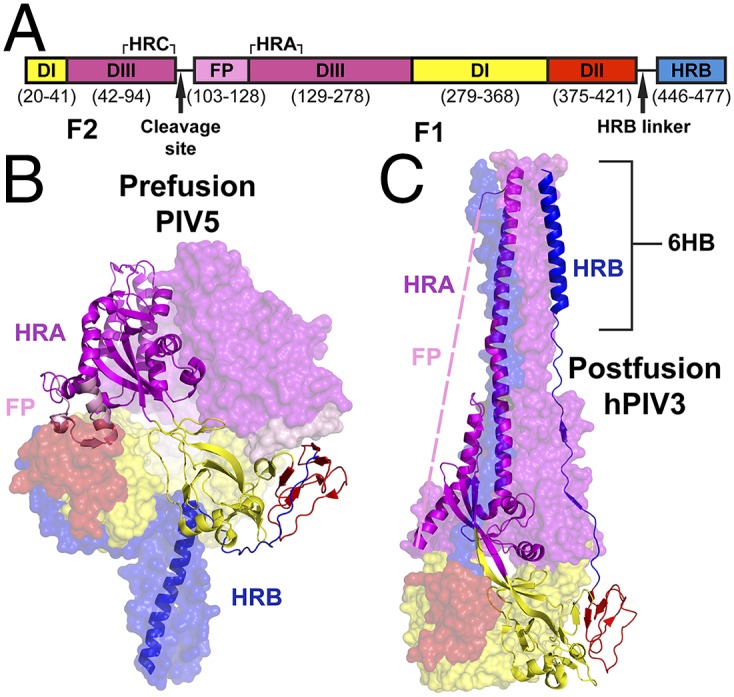
Organization of the trimeric, soluble PIV5 F protein. (A) The domain organization of PIV5 F-GCNt, with a unique color for each domain. Corresponding amino acid residues are noted below each segment. (B and C) The prefusion crystal structure of PIV5 F (PDB ID code 2B9B) (B) and the postfusion crystal structure of hPIV3 F (PDBID code 1ZTM) (C), colored as in A. In both B and C, two of the protomers are represented as semitransparent surfaces; the third protomer is depicted as a ribbon cartoon. Highlighted structural elements include HRA and HRB, the 6HB, and the hydrophobic FP, which is disordered in the postfusion crystal structure.
To determine the solvent exposure of different regions of the prefusion F protein, we oxidatively labeled a soluble form of the PIV5 F protein (F-GCNt) during its transition along the fusion-refolding pathway using fast photochemical oxidation of proteins (FPOP). FPOP uses a pulsed 248-nm wavelength laser to generate •OH free radicals from molecular H2O2 to create a brief (∼1 μs) but intense oxidizing pulse around the protein of interest (52). The short-lived free radicals covalently react with and modify solvent-exposed side chains of the protein, which subsequently are detected by high-resolution MS. The duration of the oxidizing pulse is modulated through a carefully titrated amount of a free radical scavenger (e.g., glutamine) so that native surfaces exposed through protein “breathing” are labeled but surfaces exposed by oxidation-induced unfolding are not labeled because the radicals are quenched within 1 μs. Location of the oxidative modifications follows tryptic digestion of the protein and analysis of the resulting peptides by high performance liquid chromatography and tandem mass spectrometry (HPLC-MS/MS). We show here the regions of PIV5 F-GCNt (as represented by tryptic peptides) that are more susceptible to free radical oxidation in the prefusion state than in the postfusion protein, likely reflecting the less stable, less compact nature of the prefusion state. The F refolding process was monitored at the peptide and residue levels, permitting the creation of a detailed model of the refolding event and enabling the detection of solvent-accessible and likely flexible regions of the prefusion F trimer that may lie at the heart of the F protein metastability.
Additionally, values for the theoretical solvent-accessible surface area (SASA) were calculated for each residue from 10-ns molecular dynamics (MD) simulations of the static prefusion PIV5 F state [Protein Data Bank (PDB) ID code 2B9B] (Fig. 1B) and of a model based on the postfusion hPIV3 crystal structure (PDB ID code 1ZTM) (Fig. 1C). A comparison of the calculated SASA values and experimental FPOP oxidation prefusion-to-postfusion trends highlights regions of the protein with enhanced solvent exposure not predicted by analysis of static crystal structures alone. The strong correlation between peptides exhibiting greater-than-predicted FPOP oxidation in the prefusion state and neutralizing antibody epitopes may highlight functionally significant regions of the prefusion viral fusion protein and thus may guide the development of novel antiviral therapeutics. The work presented here also illustrates how FPOP can be used to study the dynamics of proteins and complexes that are difficult or impossible to study by X-ray crystallography, NMR, or hydrogen-deuterium exchange MS (HDX-MS).
Results
Oxidative Footprinting of PIV5 F Protein.
We purified F-GCNt, a soluble form of prefusion PIV5 F, that had been used previously to determine the atomic structures of both the uncleaved (41) and the cleavage-activated (42) prefusion states of PIV5 F. Postfusion PIV5 F-GCNt was prepared by heating prefusion protein to 60 °C for 10 min and then storing the protein at 4 °C until needed, as described previously (28). All prefusion and postfusion F-GCNt samples were oxidatively labeled at 21 °C using a modification of a previously described FPOP protocol (52, 53) (see Fig. S1 for a diagram of the FPOP setup and Fig. S2 for an example of the data analysis).
Differences in FPOP labeling between the pre- and postfusion states of PIV5 F were readily apparent from the oxidation data (Fig. 2A), which showed more extensive oxidation of F-GCNt in the prefusion state. The changes in FPOP labeling are more clearly illustrated by mapping the oxidation data onto the atomic structures of prefusion PIV5 F (Fig. 2B) and a homology model based on the structure of postfusion hPIV3 F (Fig. 2C). Although an atomic structure for postfusion PIV5 F is not available, a structural alignment of NDV F (45), RSV F (47), and hPIV3 F (44) proteins in their postfusion states suggests that the postfusion state is highly conserved among paramyxoviruses (Fig. S3). Thus, the atomic structure of hPIV3 F in the postfusion state was used as a template to create a homology model of postfusion PIV5 F (see Materials and Methods for further details of homology model construction).
Fig. 2.

FPOP labeling of prefusion and postfusion PIV5 F-GCNt. (A) Comparison of the extent of oxidative modification observed in the tryptic peptides of PIV5 F-GCNt labeled in either the prefusion (red bars) or postfusion (blue bars) conformation. Error bars represent ±1 SEM. P values were calculated using an unpaired Student t test and corrected for multiple hypothesis testing using the Benjamini–Hochberg method (*P < 0.05; **P < 0.01; ***P < 0.001; otherwise, P > 0.05). (B and C) The FPOP oxidation data mapped onto the prefusion PIV5 F crystal structure (B) and postfusion homology structure (C). B factor values in the .pdb files were replaced by the corresponding background-subtracted FPOP oxidation values for each tryptic peptide, and one protomer for each was modeled using the Pymol preset “B factor putty.” Peptides with the highest oxidation are depicted with thick red tubing; peptides with low oxidation are depicted with thin blue tubing. The other two protomers in each trimer are represented as ghosted surfaces for clarity. The hydrophobic FP is indicated in B and C by a black arrow. Peptides in the center of the globular head that undergo a dramatic decrease in oxidation between the prefusion and postfusion states are indicated by black arrowheads.
In 14 of 22 tryptic peptides detected in F-GCNt (representing 68% of the primary sequence) the extent of oxidation differs significantly in the prefusion and postfusion states (Fig. 2A, starred peptides; significance determined by a two-tailed Student t test corrected for multiple hypothesis testing). Of these 14 peptides with different levels of oxidation, nine peptides (representing 47% of the total primary sequence) were more extensively oxidized in the prefusion state. The decrease in oxidation going from prefusion to postfusion is highlighted by peptides that form a strap-like structure connecting Domain I (DI) and Domain III (DIII) (peptides 37–52, 273–308, and 309–334, marked by arrowheads in Fig. 2 B and C). In contrast, the hydrophobic FP, consisting of overlapping peptides 102–129 and 103–129, exhibited an increase in FPOP oxidation consistent with a transition from being sequestered in the prefusion state (Fig. 2B, black arrow) to being exposed in the postfusion state (Fig. 2C, black arrow). Similar results obtained for the two overlapping peptides add credence to the approach.
A comparison of peptide SASA values calculated from 10-ns MD simulations of the prefusion and homology postfusion PIV5 F-GCNt structures suggests that the solvent accessibility of most regions of the protein, as represented by its tryptic peptides, does not change dramatically between the states (Fig. S4). This observation is in contrast to the experimental FPOP data, which show that the prefusion state is more accessible to solvent than the postfusion state. However, because of protein size and computational constraints, the backbone of F-GCNt was partially restricted in its movement over the course of the 10-ns simulation (see Movies S1 and S2). Thus, the calculated SASA values may underestimate the solvent accessibility of peptides in regions of the protein where the backbone is either particularly mobile or significantly different in conformation than observed in the pre- or postfusion atomic structures. Differences in FPOP oxidation between the prefusion and postfusion states suggest that, in general, regions of prefusion PIV5 F-GNCt are more dynamic and flexible than predicted by simulations based on crystal structure, especially in the central portion of the globular head (Fig. 2 B and C, black arrowheads).
Triggering the Refolding Reaction Using Temperature.
To use heat as a surrogate for receptor-dependent triggering by HN, we modified the FPOP experimental setup (53) to include a heating chamber (Fig. S1). The fused silica capillary carrying the FPOP reaction mixture to the excimer laser was extended and passed through the heating chamber so that the protein solution was heated for 20 s before encountering the pulsed beam of the laser. Although the total duration of F protein-mediated refolding is not known, a 20-s heat pulse was selected based on the kinetics of previous fluorescence dye transfer assays with PIV5 F (33, 54) and the timing of single-particle fusion events of influenza virions (55–57). To trigger F protein refolding, the intermediate temperatures of 45 °C, 55 °C, and 65 °C were chosen based on EM observation of F prefusion and postfusion states after heating (28), indicating that PIV5 F-GCNt can be triggered by temperatures between 50–55 °C.
To confirm that F-GCNt was converted to the postfusion conformation in the modified FPOP setup, electron micrographs were taken of negatively stained protein from control samples that were run through the FPOP apparatus but not exposed to the laser (Fig. 3 A–E). More than 300 trimers from four to eight fields of view for each condition were visually determined to be in either the prefusion or postfusion state and were counted (Fig. 3F). The percentage of postfusion trimers observed increased dramatically between 45 °C (12% postfusion trimers) and 55 °C (86% postfusion trimers), indicating that the chosen temperature range and duration of temperature exposure were sufficient for F-GCNt triggering.
Fig. 3.

EM of PIV5 F-GCNt samples subjected to 21 °C, 45 °C, 55 °C, or 65 °C temperatures for 20 s. (A–E) Prefusion F-GCNt protein was exposed to heating in the presence of H2O2 for 20 s, as in the FPOP labeling experiment, but without laser exposure. The prefusion and postfusion samples were both exposed to 21 °C (room temperature). (F) Approximately 300 trimers were counted from four to eight fields of view for each sample condition and plotted as the percentage of total trimers that were postfusion trimers. Error bars represent ±1 SD. P values were calculated using a two-tailed Student t test (**P < 0.01; ***P < 0.001; n.s., not significant).
Monitoring F-GNCt Refolding from the Prefusion to Postfusion State.
To analyze the conversion of F-GCNt from the prefusion to the postfusion state, the percentage of FPOP oxidation of protein regions represented by tryptic peptides was calculated for prefusion F-GCNt exposed to a range of temperatures: 21 °C prefusion, 45 °C, 55 °C, and 65 °C. F-GCNt that previously had been converted to the postfusion state also was labeled at 21 °C for comparison. Nine peptides (comprising almost 40% of the primary sequence) predicted to be involved in the refolding process were analyzed (Fig. 4). These peptides include the HRA/HRC segments and the hydrophobic FP in DIII (Fig. 4A), the HRB segment of the protein stalk (Fig. 4B), and the Ig-like Domain II (DII) (Fig. 4C).
Fig. 4.

Tracking changes in peptide FPOP oxidation over the prefusion to postfusion refolding event. The FPOP oxidative modification of multiple regions of PIV5 F-GCNt at 21 °C, 45 °C, 55 °C, and 65 °C was determined. (Left) Wide views of the prefusion crystal structure. (Right) Postfusion homology model. For each structure, one protomer is represented as a wheat-colored cartoon, and the other two protomers are represented as gray ghosted surfaces for clarity. Insets with the peptides under analysis are colored according to the center column and are located immediately to the left and right of the data (prefusion and postfusion, respectively). (A) Analysis of four peptides in DIII: a portion of HRC (peptide 79–91, blue triangles), the FP (peptide 103–129, red diamonds), and HRA [peptides 130–141 (green squares) and 147–186 (purple circles)]. A dramatic increase in FP oxidation is observed between 45 °C and 55 °C, corresponding to temperature-induced protein triggering. (B) Melting of the prefusion stalk is seen primarily in peptide 436–458 (blue triangles), which comprises the top of HRB. The stabilizing influence of the C-terminal GCN trimerization domain is seen in the minimal change in oxidation values for peptide 459–480 (red diamonds). (C) Three peptides comprise almost all the Ig-like DII. Peptides 369–381 (blue triangles) and 410–419 (green squares) exhibit very little change in FPOP labeling over the temperature range, whereas peptide 387–409 (red diamonds) on the outside of DII exhibits a dramatic decrease in oxidation. Because there is very little change in overall domain conformation between the two states, the decrease in FPOP labeling for peptide 387–409 suggests a decrease in flexibility for this peptide. Error bars represent ±1 SEM.
The exposure and extension of the FP toward the target membrane is a critical and irreversible step in the F protein-refolding event. The hydrophobic character of the FP, combined with its accessibility upon triggering, makes it an ideal target for FPOP labeling because of the increased reactivity of the free radicals with aliphatic side chains (58). Thus, we predicted that triggering F-GCNt would result in an increase in oxidation of the FP. Indeed, FP FPOP oxidation increased dramatically in samples heated for 20 s at 55 °C as compared with samples heated for 20 s at 45 °C (Fig. 4A, peptide 103–129 in red). A triggering temperature between 45 °C and 55 °C matches the transition from predominantly prefusion trimers to predominantly postfusion trimers observed in the electron micrographs (Fig. 3 B, C, and F). Taken together, these data suggest that the changes in the oxidation of the FP between 45 °C and 55 °C accurately reflect the triggering of the F protein.
Peptides 79–91, 130–141, and 147–186 are located in DIII of the globular head of PIV5 F and, along with the FP, participate extensively in the refolding event. Peptide 147–186 (Fig. 4A, in purple) comprises a large portion of HRA and exhibits labeling patterns that differ remarkably from the FP oxidation trend. The oxidation of peptide 147–186 decreased significantly, from ∼9% in the prefusion and 45 °C samples to 2.8% in the postfusion samples. This decrease in oxidation reflects the decreased side-chain solvent accessibility as the peptide refolds from a broken series of α-helices, β- strands, and loops (Fig. 4A, Prefusion Inset) to the extended α-helix that forms the core of the very stable postfusion 6HB (Fig. 4A, Postfusion Inset and Fig. 1C). Notably, after correcting the false discovery rate from multiple hypothesis testing, peptide 79–91 (Fig. 4A, in blue) along with a part of heptad repeat C (HRC) and peptide 130–141 (Fig. 4A in green) are the only peptides analyzed that exhibited a statistically significant pretriggering increase in oxidation upon heating to 45 °C. Although small in magnitude because of peptide size and amino acid composition, this increase in oxidation suggests that these regions experience a change in solvent accessibility in their immediate environment before the nearby FP is released and the refolding event commences. However, after this initial change, peptides 79–91 and 130–141 show no change in oxidation from 45 °C → 55 °C → 65 °C, suggesting that their helical conformations are maintained throughout the refolding process.
Previous data from peptide inhibition studies suggested that, in the presence of HN, the stalk of PIV5 F melts before the FP is extended (48). However, no significant increase in the oxidation of HRB peptides 436–458 and 459–480 (Fig. 4B, in blue and red, respectively) occurred upon heating the prefusion protein to 45 °C. Peptide 436–458 exhibited a progressive increase in oxidation from 45 °C to 65 °C, consistent with temperature-dependent stalk melting, but the FPOP oxidation decreased as the final postfusion structure formed. The stabilizing effect of GCNt was observed in the oxidation trend of HRB peptide 459–480, which is closest to the C-terminal trimerization tag and did not experience significant changes in oxidation over the temperature range. Unlike soluble F-GCNt, WT PIV5 F is anchored to the membrane via a transmembrane domain and can be triggered to refold by heating to 42 °C in transfected tissue culture cells (24). Because 42 °C is lower than the triggering temperature of 45–55 °C observed in this study for soluble F-GCNt, these observations suggest that the GCN tag has a greater stabilizing effect on the prefusion state than do the transmembrane domain and cytoplasmic tail of WT PIV5 F. Therefore, the apparent lack of increased stalk flexibility in F-GCNt cannot be assumed to be true for WT PIV5 F protein.
The Ig-like DII domain was predicted previously to move through the refolding event as a rigid module (41). Surprisingly, peptide 387–409, on the outer surface of DII, exhibited a notable decrease in oxidation upon F triggering (Fig. 4C, in red). Mutagenesis studies have implicated this region as being important for the interactions of both PIV5 F (59) and MeV F (60) proteins with their attachment proteins, HN and H, respectively, suggesting that this change in the flexibility of peptide 387–409 in PIV5 F protein has functional significance for interacting with the attachment protein. The inner surface of DII, created by residues contained in peptides 369–381 and 410–419, provides the hydrophobic surface that sequesters the FP between DII of one protomer and DIII of the neighboring protomer (Fig. S5). Exposure of this hydrophobic surface to solvent during the refolding event would be expected to result in an increase in oxidative labeling for these peptides, similar to that observed for the FP. However, oxidation of these two peptides remained constant over all labeling conditions (Fig. 4C, in blue and red), suggesting that their solvent accessibility does not change significantly during F protein refolding.
The crystal structures of hPIV3 (44), RSV (46, 47), and NDV (45) F proteins in their postfusion conformations all show DII interacting with the strap peptides that connect DI and DIII. The strap of PIV5 F, which includes peptides 20–36, 37–52, and 273–308 (shown in cyan, green, and yellow, respectively, in Fig. 5), showed a notable decrease in oxidation over the tested temperature range, suggesting stabilization upon protein refolding. In particular, peptide 37–52, which transitions from being exposed in the prefusion state (Fig. 5B, Inset, colored as in Fig. 5A) to being covered by the HRB linker of a neighboring protomer in the postfusion state (Fig. 5C, Inset), highlights this decrease. DI strap stabilization through contact with DII is supported further by analysis of the oxidation of DII residue D416 (Fig. 5A, in black), which mirrored the decrease in FPOP labeling observed in the strap peptides. The oxidation values for D416 are significantly lower than those of the strap peptides for two reasons: (i) peptides contain many more sites of potential modification, and (ii) the specific modification observed (−27.99 Da loss of CO) occurs less frequently than the more common modifications. However, the overall trend of the oxidation of D416 is the same as observed in the strap peptides.
Fig. 5.

Domain II collapses inward to fill the space vacated by the FP and interacts with the strap peptides of Domain I. (A) FPOP oxidation values for three peptides of DI that comprise the strap connecting DI and DIII: peptide 20–36 (cyan triangles), peptide 37–52 (green diamonds), and peptide 273–308 (yellow squares). The colors are maintained for the cartoon representations in B and C. The FPOP oxidation value for residue D416 located in DII of the neighboring protomer is shown as a black line without markers and is depicted in black stick representation in B and C. Error bars for FPOP oxidation data represent ±1 SEM. (B and C) Prefusion (B) and postfusion (C) structures highlighting the peptides and residue from A. The strap peptides (in cyan, green, and yellow), the FP (pink), and HRA (purple) are from one protomer; DII (red), the HRB linker (orange), and HRB (dark blue) are from the neighboring protomer. The remainder of the structure is ghosted for clarity. (B, Inset) Zoomed view showing the up-and-out movement of the FP and HRA (purple arrow) upon triggering, creating a void that is filled by the inward collapse of DII from the neighboring protomer (red arrow). Stick representations of residue side chains in peptide 37–52 (green cartoon) are colored according to atom [carbon, green or orange (colored by peptide); oxygen, red; nitrogen, blue]. These residues form an extensive series of hydrogen bonds with the HRB linker in the postfusion conformation (C, Inset, blue dashes), suggesting a mechanism for driving the resolution of the prehairpin intermediate.
The simplest interpretation of these data is that, upon triggering and FP release, DII collapses inward to fill the space vacated by the FP (Fig. 5B, Inset) and interacts with the extended β-strands of the strap peptides. This collapse would keep the inner face of DII protected from solvent, avoiding the energetically unfavorable step of solvating such a highly hydrophobic surface. The inward collapse of DII also permits the initiation of hydrogen bond formation between the HRB linker and the DI/DIII strap (Fig. 5C, Inset, blue dashes, shown in more detail in Movie S3). This initial contact would nucleate a “zippering up” of the HRB linker backbone along the side of the globular head through the formation of hydrogen bonds, suggesting a mechanism to drive the resolution of the prehairpin intermediate state. Additionally, these data suggest that the trimeric structure of PIV5 F is maintained throughout the refolding process, in contrast to observations for vesicular stomatitis virus G (61, 62), a class III viral fusion protein.
Residue-Level Oxidative Footprinting of Early Changes Along the F Protein-Refolding Pathway.
When the prefusion F-GCNt protein was heated from 21 °C to 45 °C, only two regions, represented by peptides 79–91 and 130–141, demonstrated statistically significant increases in oxidation at the peptide level. In addition to being localized to DIII of the globular head, these two peptides occupy the space immediately surrounding the FP (Fig. 6A; peptides are colored as in Fig. 4A). To ensure high reliability, we performed a manual analysis of the MS/MS fragmentation data for these peptides (see Fig. S2 for a detailed example) as well as for the FP (Fig. 6 B–D).
Fig. 6.

Residue-level oxidative footprinting of peptides involved in early changes along the F protein-refolding pathway. (A) A trimer of PIV5 F-GCNt, with one protomer depicted as a cartoon ribbon. Peptides 79–91 (blue), 103–129 (red), and 130–141 (green) are highlighted. The zoomed and rotated views show the residues analyzed as sticks colored according to atom (carbon, gray; nitrogen, blue; oxygen, red) and labeled. (B–D) Traces show background-subtracted percent of FPOP oxidation for resolvable residues in each peptide as well as the sum of the individual residue oxidations (“total”). Error bars represent ±1 SEM.
Within peptide 79–91, residues P82 and E88/R91 showed a similar decreasing pattern of oxidation over the temperature range, whereas residues L87, T89, and I90 showed increasing oxidation. The dramatic increase in the oxidation levels of residue I90 (Fig. 6B), in particular, reflects the increased solvent accessibility in that local region upon triggering-induced FP release (Fig. 6A, Insets). Within region 130–141, the oxidation values decreased for E132 and L140, both of which are located on the same face of the α-helix (Fig. 6 A, Inset and D). The similar oxidation trend over the temperature range for E132 and L140 provides further evidence that the α-helical character of HRA in this region is maintained over the course of the refolding event. I137 and L138, on the undersurface of the α-helix, exhibited an increase in oxidation over the temperature range, consistent with their exposure upon the release of the FP and the extension of HRA toward the target membrane. In contrast to peptides 79–91 and 130–141, the oxidation patterns of all individual residues in the FP (Fig. 6C) showed the same overall trend as the peptide-level data, indicating that all these residues become more exposed to solvent as the FP is released from its sequestered, prefusion conformation and is extended toward the target membrane.
Analysis of these three peptides at the residue level revealed that the oxidation patterns of individual amino acids can either mirror the peptide-level pattern, as in peptide 103–129 (Fig. 6C), or vary dramatically from the peptide-level pattern, as in peptides 79–91 (Fig. 6B) and 130–141 (Fig. 6 D). The dramatic variation occurs when the microenvironment of individual residues differs from the “average” value for a peptide region. For the F protein, which is large and protease-resistant, FPOP can provide higher-resolution dynamic structural information than could be obtained with NMR or HDX-MS.
Discussion
Here we have demonstrated the ability to track conformational changes of the soluble form of a metastable viral fusion protein using FPOP oxidative labeling and MS. Upon initiation of the refolding process, the hydrophobic FP is released from its sequestered location behind the Ig-like DII of the neighboring protomer. As the HRA segment refolds from a series of broken α-helices and β-strands into a single, extended α-helix, it propels the newly solvated FP toward the target membrane for insertion. As soon as the FP is released, DII collapses inwards to fill the void left by the FP, interacting with and stabilizing the strap peptides of the neighboring protomer. At this extended, prehairpin intermediate stage of the refolding process, DI, DII, and DIII of the globular head have adopted their postfusion conformations. The interaction of DII with the strap peptides initiates a hydrogen bond-driven zippering action between the HRB linker and the strap peptides of the globular head, leading to a resolution of the prehairpin intermediate to the final, stable postfusion state.
The use of heat as a surrogate trigger of the PIV5 F refolding event allowed the monitoring of the refolding event at a previously unattainable level of structural detail. EM analysis of negatively stained control samples established that F-GCNt activation from prefusion to postfusion occurs between 45 °C and 55 °C (Fig. 3). A successful refolding event requires that the FP transition from a sequestered prefusion conformation to an extended and solvated postfusion conformation. The hydrophobic character of the FP makes it an ideal target for FPOP labeling, and its triggering-induced exposure between 45 °C and 55 °C was shown (Fig. 4A). The absence of increased oxidation for peptides 369–381 and 410–419 (Fig. 4C), which sequester the FP in the prefusion state, indicates that the inner surface of DII is not exposed to solvent upon triggering, suggesting that dissociation of the trimer is not required for the successful refolding of PIV5 F-GCNt. Further analysis of residue D416 in DII revealed a decrease in oxidation that mirrored the decreased oxidation in the strap peptides connecting DI and DIII (Fig. 5A). This decreased oxidation is consistent with the interprotomer interaction of these two parts of the protein in the postfusion state and suggests that DII collapses inward to interact with the strap peptides as soon as the FP is released upon protein triggering. The contact between DII and the strap peptides upon activation brings the N-terminal end of the HRB linker into close proximity with the strap peptides, permitting the initiation of a hydrogen bond zippering event of the linker up the side of the globular head and leading to the resolution of the prehairpin intermediate state. Ultimately this process leads to the juxtaposition of HRB with the extended HRA coiled-coil and provides a mechanism for the events immediately prior to the formation of the 6HB and membrane fusion.
We also show that global oxidation levels of PIV5 F-GCNt decrease upon refolding from the prefusion to the postfusion state. Additionally, the SASA for tryptic peptides of PIV5 F-GCNt in the prefusion and postfusion conformations were calculated from MD simulations of available crystal structure data. By comparing the changes in FPOP modification with the calculated SASA, we can localize changes in the protein between the prefusion and postfusion states. Differences in free radical reactivities among amino acids make comparisons of both interpeptide and oxidation/SASA raw values difficult. We limit our comparison to the net change from prefusion to postfusion for individual peptides, making the reasonable assumption that the total reactivities of each peptide are the same across the analysis. When the net change in FPOP oxidation (percent oxidation in prefusion − percent oxidation in postfusion) is compared with the net change in SASA (SASA prefusion − SASA postfusion), different trends emerge for many of the peptides.
Of the tryptic peptides contained in both models, 10 of the 17 peptides (Fig. 7A, highlighted in pink) demonstrate a change in FPOP labeling different from that predicted by changes in the side-chain SASA of the static crystal structures alone (e.g., prefusion > postfusion vs. prefusion = postfusion). Experimental FPOP values that deviate from the values predicted from the side-chain SASA calculations suggest that the static crystal structure data do not accurately reflect the flexibility of one or both of the states. Nine of these 10 peptides have larger, more positive (i.e., prefusion > postfusion) experimental ΔFPOP values, suggesting that the solvent accessibility calculated from the MD simulations either underestimates the prefusion SASA or overestimates the postfusion SASA. Given that (i) there is very little structural variation between the postfusion structures of multiple paramyxovirus F proteins; (ii) the postfusion state is a highly stable conformation that represents an energy minimum for the protein; and (iii) there is variation in the two prefusion crystal structures of paramyxovirus fusion proteins (PIV5 F and RSV F), we attribute most of the disagreement in the ΔFPOP/ΔSASA trend to an underestimation of the prefusion SASA calculation. Thus, the lopsided distribution of these nine peptides likely reflects the global decrease in flexibility of the postfusion state relative to the prefusion state. Further, FPOP labeling that deviates from expected SASA trends may highlight regions of greatest solvent accessibility and protein movement.
Fig. 7.

Changes in peptide FPOP oxidation and side-chain SASA between the prefusion and postfusion states. (A) Postfusion FPOP or SASA values are subtracted from the corresponding prefusion FPOP or SASA values for the tryptic peptides that are common between the two states and graphed. The data represent the change in FPOP oxidation or side-chain SASA between the prefusion and postfusion states. Peptides that exhibit a different ΔFPOP trend compared with ΔSASA are highlighted by pink backgrounds. The backbone of the cartoon trimer in B is colored similarly. At the bottom of A, the epitopes of prefusion-specific, neutralizing antibodies against various paramyxoviruses and the HN-interacting surface of PIV5 F are assigned to their homologous PIV5 F tryptic peptides. These important epitopes and interaction surfaces are represented as semitransparent surfaces in B, colored according to the ovals at the bottom of A. The distribution of epitopes and surfaces to peptides that show greater-than-expected ΔFPOP values (relative to ΔSASA) is not random (P = 0.0023, one-tailed Fisher’s exact test), suggesting a correlation between regions of increased prefusion FPOP oxidation and functionally important parts of the metastable prefusion trimer.
Interestingly, most of the nine peptides that show ΔFPOP values differing from the ΔSASA values contain the epitopes of prefusion-specific neutralizing antibodies that have been discovered for a range of paramyxovirus F proteins (Fig. 7 A and B). The epitopes of D25 (α-RSV F Fab) (43), MPE8 (broadly neutralizing against hRSV and hMPV) (63), DS7 (α-hMPV F Fab) (64), F1a (α-PIV5 F Mab) (65), and 05D (α-PIV5 F Fab) are colored according to the ovals at the bottom of Fig. 7A and mapped onto their homologous sequences in the prefusion PIV5 F atomic structure (Fig. 7B). Peptide 387–409 of PIV5 F (Fig. 7 A and B, cyan surface) contains residues that have been implicated in the interactions between PIV5 F and HN proteins (59) and between MeV F and H proteins (60) as well as being homologous with antigenic site IV of the RSV F protein. The extensive overlap between antigenically or functionally significant regions of paramyxovirus fusion proteins and PIV5 F-GCNt peptides with greater-than-predicted levels of FPOP oxidation in the prefusion state is not random (P = 0.0023, one-tailed Fisher’s exact test) and suggests that there is a correlation between flexibility and functionality for these metastable proteins. Binding of neutralizing antibodies to these regions in paramyxovirus F proteins could stabilize the flexibility of these dynamic regions in the prefusion state or sterically interfere with the refolding event.
This study highlights the need to view paramyxovirus F proteins as highly dynamic molecular machines. Correlation with the reported epitopes of neutralizing antibodies against other paramyxoviruses suggests that regions of viral fusion proteins experiencing larger changes in FPOP labeling than would be predicted from the static crystal structure data may be important for proper protein function and thus make good targets for the development of neutralizing antibodies or small-molecule inhibitors. FPOP is shown to be useful as a medium resolution technique for the study of transient protein conformations along a complex refolding event as well as a method for probing the dynamic movement of a protein under physiologic conditions. We suggest that FPOP results can provide the dynamic structural insights necessary for guiding more targeted and efficient approaches to antiviral therapeutic development. Furthermore, FPOP can provide dynamic structural information for proteins and complexes that would not be amenable to study by other structural techniques and thus is of interest to the broader scientific community.
Materials and Methods
Cells.
Insect High Five cells (Invitrogen) were maintained in Express 5 serum-free medium (Gibco) supplemented with 10% (vol/vol) GlutaMax (Gibco) and 1% penicillin/streptomycin. Insect Sf9 cells used for generating baculovirus stocks were maintained in SF900 II medium (Invitrogen) supplemented with 10% (vol/vol) FBS and 1% penicillin/streptomycin.
Protein Purification.
Soluble PIV5 F-GCNt was purified from High Five insect cells expressing F-GCNt as described previously (41, 42). Briefly, High Five insect cells were infected at a multiplicity of infection of ∼2 pfu per cell with a recombinant baculovirus that expresses F-GCNt. At 48 h postinfection, the medium was harvested, and soluble F-GCNt protein was purified by affinity chromatography using Ni-NTA resin (Qiagen). The purified F-GCNt was >90% pure by SDS/PAGE gel analysis and silver staining. The protein was buffer exchanged into 300 mM NaCl, 10 mM sodium phosphate (pH 7.4) using 10-kDa molecular weight cut off (MWCO) Amicon Ultra concentrator centrifuge tubes (Millipore). F-GCNt was concentrated to a final concentration of 10 mg/mL and stored at 4 °C until use. The time elapsed between protein purification and oxidative labeling was minimized to reduce the stochastic conversion of prefusion F-GCNt to the postfusion state.
EM.
EM images were prepared as described previously (27).
FPOP.
Hydrogen peroxide (H2O2) (30%), formic acid, PBS, l-glutamine, and l-methionine were obtained from Sigma-Aldrich. The FPOP labeling protocol was modified from that previously described (52, 53, 66–69). The FPOP method uses a KrF excimer laser to generate 248-nm wavelength laser pulses to photolyze molecular H2O2 into •OH radicals that covalently modify solvent-exposed side chains of amino acids (described in refs. 52, 53, and 66–70). Unlike the deuterium incorporation in HDX-MS, the rate of free radical modification in FPOP varies among amino acids (reviewed in ref. 58), with 14–16 of the 20 amino acids being irreversibly modified on the time-scale of most FPOP experiments (53). Aliphatic side chains have been shown to be the most reactive (58). The covalent nature of the hydroxyl radical footprinting label permits label localization down to the peptide, subpeptide, and even amino acid level of resolution using commonly available MS peptide fragmentation modalities such as collision-induced dissociation (CID) and higher-energy C-trap dissociation used in proteomics studies. FPOP has an additional advantage over HDX-MS because the covalent modifications do not suffer from the back-exchange and label scrambling that occurs with deuterium labeling and collisional activation in MS/MS. Thus, FPOP permits delayed and careful sample workup before MS analysis, including deglycosylation and in-gel proteolysis of difficult-to-digest proteins.
In this modified protocol, 1 μM F-GCNt and 20 mM glutamine in a total volume of 150 μL PBS in 1.5-mL Eppendorf tubes were kept on ice until use. Immediately before labeling, 0.5 M H2O2 was added to a final concentration of 60 mM, and the samples were vortexed briefly, spun down, and loaded into a 250-μL Hamilton syringe. Samples with a 20% exclusion volume fraction (the volume not irradiated) were infused through fused silica tubing (150-μm i.d.) at a rate of 30.4 μL/min and irradiated using an excimer laser pulse frequency of 15 Hz and a laser power of 47.24 mJ (Fig. S1). Labeled samples were collected in Eppendorf tubes containing 30 μL of 200 mM l-methionine and 3 μL of 1 mg/mL catalase to eliminate any residual free radicals and unreacted molecular H2O2.
Five independently mixed protein samples were labeled for each temperature condition. Three control samples for each condition were made with H2O2 but were not exposed to laser irradiation. Final FPOP percent oxidation values were calculated by subtracting the averaged oxidation value of the control samples from those of the labeled samples exposed to the laser. All prefusion and postfusion F-GCNt samples were FPOP-labeled at 21 °C. To perform the temperature labeling experiments, the length of the fused silica capillary was increased so that 57 cm of capillary lay within a heating chamber that was contiguous with the laser window (Fig. S1). Based on flow rate and capillary i.d., the solution flowing through the capillary was exposed to the temperature for ∼20 s before passing the laser window. The stated temperatures within the heating chamber were maintained at ±1 °C for the duration of the labeling experiment.
Sample Preparation and MS.
Samples were concentrated using 0.5-mL 10-kDa MWCO Amicon Ultra concentrator tubes (Millipore) to reduce the total volume to ∼20–30 μL. Samples then were deglycosylated using Peptide-N-Glycosidase F (New England BioLabs) according to the manufacturer’s protocol. Briefly, 10X Glycoprotein Denaturing Buffer (5% SDS, 0.4 M DTT) was added according to sample volume. The samples were heated briefly (3 min.) at 90 °C to encourage denaturing while minimizing heating-induced oxidation. Then 10X G7 Reaction Buffer [500 mM sodium phosphate (pH 7.5) at 25 °C] and 10% Nonidet P-40 were added in amounts scaled to the total volume of each sample, and 2 μL (1,000 U) of PNGase F enzyme was added. Samples were incubated overnight at 37 °C to maximize deglycosylation. Note: Because deglycosylation with PNGase F results in the conversion of asparagine to aspartic acid and because not all asparagine residues in N-linked glycosylation sites are glycosylated, the values for the percent of FPOP oxidation were calculated for both species of peptide and were added together.
Deglycosylated samples were denatured and size fractionated using a reducing 15% SDS/PAGE gel. Deglycosylated protomers of F-GCNt migrate at ∼50 kDa. The dye front of the gel was run ∼3 cm into the resolving gel to separate the residual PNGase F (∼36 kDa) and the catalase (∼60 kDa per monomer). Linearized F-GCNt then was excised as a gel band and subjected to overnight in-gel trypsin digestion (Worthington) according to the University of California, San Francisco in-gel digest protocol (http://msf.ucsf.edu/ingel.html). The collected tryptic peptides for each sample were collected in LoBind Eppendorf tubes, and the total volume was reduced to ∼20 μL using a speed vac (Savant). Samples were acidified to 5% formic acid.
Samples were analyzed on an LTQ Orbitrap XL operated in data-dependent acquisition mode controlled by Xcalibur 2.0.7 software (Thermo Fisher). Samples were in-line desalted for 5 min using a 100 μm × 2 cm Acclaim PepMap100 C18 nano trap column (5 μm, 100 Å) (Thermo Scientific) with a Dionex UltiMate 3000 liquid chromatograph (Thermo Scientific) at 8 μL/min. After desalting, the peptides were eluted onto and separated using a custom-packed C18 reverse-phase column (Magic, 0.075 mm × 100 mm, 5 μm, 120 Å; Michrom Bioresources, Inc.). Peptides were eluted at 260 nL/min using the following gradient: 0–60% solvent B (20% water, 80% acetonitrile, 0.1% formic acid) for 110 min., then to 90% solvent B for 10 min., and then re-equilibrated to solvent A (water, 0.1% formic acid) for 10 min. Blank injections were run between each sample to minimize carryover between runs. Peptide mass spectra were acquired over an m/z range of 350–2,000 at high mass resolving power (60,000 for ions of m/z 400). The six most abundant ions with a charge of at least +2 and with a minimum signal intensity of 500 were subjected to CID in the linear ion trap, with data-dependent scanning. Ions with a charge-state of +1 were rejected. Tryptic digestion of F-GCNt and MS analysis showed a minimum of 94% sequence coverage of F protein for each sample.
Data Analysis.
The oxidation of each tryptic peptide was calculated as a percentage of the total peptide by area under the curve (AUC) analysis of the extracted ion chromatograms using the ProtMapMS analysis software (NeoProteomics). (See Fig. S2 for a detailed example.)
The .raw files were imported into ProtMapMS, converted to .mzXML files, and analyzed. The following program settings were used: retention time, 20–140 min; peptide mass range, 500–8,000 Da; charge states,1–6; protease, trypsin; missed cleavages, 1; MS1 error tolerance, 8 ppm; MS2 error tolerance, 0.45 Da; m/z width for SIC integration, 10 ppm. Identified oxidation species were validated manually using custom Microsoft Excel macros written in Visual Basic. The areas under validated selected ion chromatogram curves were exported into Excel and used to calculate percent oxidations by adding up the AUC of all identified oxidized products, dividing them by the total AUC of oxidized+unmodified products, and then multiplying by 100. Only values normalized against the unmodified peptide intensities were compared between samples to correct for differences in the concentrations of injected sample. FPOP labeling was done in biological quintuplicate (five independent laser reactions) and analyzed in technical duplicate (two separate injections per biological replicate) on the mass spectrometer. Control samples were labeled in biological triplicates (except for the postfusion control condition, which was run in duplicate), but only a single injection per biological replicate was run on the mass spectrometer because of instrument time constraints. AUC analysis was carried out independently for all biological and technical replicates. Technical replicate values were averaged, and then biological replicates were averaged and SDs and SEMs were calculated. Python and R were used to calculate P values from an unpaired Student's t test, and these values were adjusted using the Benjamini–Hochberg method (71) to control the false discovery rate caused by multiple hypothesis testing. Comparisons were made between conditions but never directly between different peptides because of variations in peptide amino acid composition (and, thus, peptide free radical reactivity). Error bars in all FPOP graphs represent ±1 SEM unless otherwise specified.
Because of the metastable nature of prefusion F-GCNt, a small amount of every prefusion F-GCNt protein preparation always converts to the postfusion state. The EMs of the prefusion condition were used to determine that ∼7% of the “prefusion” sample actually was postfusion protein. The percent oxidation values of the prefusion samples were corrected for this postfusion “contamination.”
Molecular Dynamics Simulation and Calculations of SASA.
Preparation of pre- and postfusion protein structures.
A crystal structure of the PIV5 F protein in its prefusion conformation (PDB ID code 2B9B) was reported at 2.85-Å resolution and was used in this analysis. All the crystallized ligands (N-acetyl-d-glucosamine) and water molecules were removed. All histidine residues were considered as neutral with a hydrogen atom on the epsilon nitrogen. Because no structure for the postfusion state of PIV5 F is available, a homology model was generated using the SWISS-MODEL (72) homology modeling server with the hPIV3 postfusion crystal structure (PDB ID code 1ZTM) as template (22% identity, 65% similarity, and Evalue = 3 × 10−115). A sequence 41 residues long and consisting of the hydrophobic FP was unresolved in the hPIV3 F structure, indicating that it does not adopt a defined conformation. To avoid biasing the model by introducing this peptide in a single, possibly irrelevant, conformation, this sequence also was omitted from the homology model, necessitating the use of backbone restraints in subsequent simulations. The terminal residues at the location of the missing loop were capped with N-methyl (NME) and N-acetyl (ACE) groups as appropriate. To check the quality of the modeled and template structures, z-scores of the backbone conformations were calculated using WHATIF (73). Both the template and the model received acceptable z-scores of 1.2 and 0.7, respectively. It is well established that class I fusion proteins share structural features without having high sequence similarity; therefore, the model generated was accepted as is and was used for further analysis.
Energy minimization.
Each protein structure was solvated in a truncated octahedral box of TIP3P water molecules (74), with counter ions (Na+) added to neutralize the charge, using the tLEAP module of AMBER. For the prefusion structure, 97,332 water molecules were required, whereas the postfusion required 110,360. The simulations were performed using AMBER12 force field (75) with ff99SB parameters (76), with a cutoff for nonbonded interactions of 10 Å. To remove bad contacts, the system was minimized in two steps. First, the energy of the water and ions was minimized while keeping all protein atoms restrained (500 kcal−1⋅mol−1⋅Å2). This step was followed by energy minimization of the entire system. Each minimization comprised an initial phase of steepest descent method for 5,000 steps, followed by conjugate gradient for 20,000 steps. The resulting minimized structures were subjected to MD simulation performed with the pmemd.cuda version of AMBER12 (77).
MD simulation.
All the bonds involving hydrogen were constrained using the SHAKE algorithm, enabling an integration time step of 2 fs. Long-range electrostatic interactions were treated with the Particle-Mesh Ewald algorithm (78), with a long-range nonbonded interaction cutoff set to 10 Å. The systems were heated from 5–300 K over a span of 50 ps, under constant number, volume, and temperature conditions using the Berendsen thermostat with a coupling time constant of 1 ps. The simulation then was continued for 10 ns under base pressure and temperature conditions with weak restraints on the backbone atoms (100 kcal−1⋅mol−1⋅Å2). The first 1 μs of this trajectory was discarded before analysis of the equilibrated data.
Data analysis.
SASA values were computed with the NACCESS (79) program for snapshots collected every 10 ps. Average values were computed from the total 900 snapshots. Error bars on SASA data graphs represent ±1 SD.
Modeling of the Data.
The B factor values in the prefusion PIV5 F (PDB ID code 2B9B) and the postfusion homology structure were replaced by percent oxidation values for the corresponding peptides. Protein images were created using the Pymol modeling program (80).
Supplementary Material
Acknowledgments
T.A.P. thanks Prajwal Ciryam and Hao Zhang for helpful discussions concerning data analysis and statistical rigor. This research was supported by National Institutes of Health Research Grants R01-AI-23173 (to R.A.L.), R01-GM-61050 (to T.S.J.), R01-GM-094919 (EUREKA) (to R.J.W.), P41-GM-103390 (to R.J.W.), and 8 P41 GM103422 (to L.M.J. and M.L.G.) and by Science Foundation of Ireland Grant 08/IN.1/B2070 (to R.J.W.). T.A.P. was supported in part by National Institutes of Health Training Programs Cell and Molecular Basis of Disease Grant T32-GM008061 and Viral Replication Grant T32-AI-060523. G.P.L. is a Research Specialist and R.A.L. is an Investigator of the Howard Hughes Medical Institute.
Footnotes
The authors declare no conflict of interest.
This article contains supporting information online at www.pnas.org/lookup/suppl/doi:10.1073/pnas.1408983111/-/DCSupplemental.
References
- 1.Lamb RA, Parks GD. Paramyxoviridae: The viruses and their replication. In: Knipe DM, Howley PM, editors. Fields Virology. 5th Ed. Philadelphia: Lippincott Williams & Wilkins; 2007. pp. 1449–1496. [Google Scholar]
- 2.Drexler JF, et al. Bats host major mammalian paramyxoviruses. Nat Commun. 2012;3:796. doi: 10.1038/ncomms1796. [DOI] [PMC free article] [PubMed] [Google Scholar]
- 3.Lamb RA, Jardetzky TS. Structural basis of viral invasion: Lessons from paramyxovirus F. Curr Opin Struct Biol. 2007;17(4):427–436. doi: 10.1016/j.sbi.2007.08.016. [DOI] [PMC free article] [PubMed] [Google Scholar]
- 4.Russell CJ, Luque LE. The structural basis of paramyxovirus invasion. Trends Microbiol. 2006;14(6):243–246. doi: 10.1016/j.tim.2006.04.004. [DOI] [PMC free article] [PubMed] [Google Scholar]
- 5.Bossart KN, Fusco DL, Broder CC. Paramyxovirus entry. Adv Exp Med Biol. 2013;790:95–127. doi: 10.1007/978-1-4614-7651-1_6. [DOI] [PMC free article] [PubMed] [Google Scholar]
- 6.Hu XL, Ray R, Compans RW. Functional interactions between the fusion protein and hemagglutinin-neuraminidase of human parainfluenza viruses. J Virol. 1992;66(3):1528–1534. doi: 10.1128/jvi.66.3.1528-1534.1992. [DOI] [PMC free article] [PubMed] [Google Scholar]
- 7.Heminway BR, Yu Y, Galinski MS. Paramyxovirus mediated cell fusion requires co-expression of both the fusion and hemagglutinin-neuraminidase glycoproteins. Virus Res. 1994;31(1):1–16. doi: 10.1016/0168-1702(94)90066-3. [DOI] [PubMed] [Google Scholar]
- 8.Bousse T, Takimoto T, Gorman WL, Takahashi T, Portner A. Regions on the hemagglutinin-neuraminidase proteins of human parainfluenza virus type-1 and Sendai virus important for membrane fusion. Virology. 1994;204(2):506–514. doi: 10.1006/viro.1994.1564. [DOI] [PubMed] [Google Scholar]
- 9.Sergel T, McGinnes LW, Peeples ME, Morrison TG. The attachment function of the Newcastle disease virus hemagglutinin-neuraminidase protein can be separated from fusion promotion by mutation. Virology. 1993;193(2):717–726. doi: 10.1006/viro.1993.1180. [DOI] [PubMed] [Google Scholar]
- 10.Lamb RA. Paramyxovirus fusion: A hypothesis for changes. Virology. 1993;197(1):1–11. doi: 10.1006/viro.1993.1561. [DOI] [PubMed] [Google Scholar]
- 11.Russell CJ, Kantor KL, Jardetzky TS, Lamb RA. A dual-functional paramyxovirus F protein regulatory switch segment: Activation and membrane fusion. J Cell Biol. 2003;163(2):363–374. doi: 10.1083/jcb.200305130. [DOI] [PMC free article] [PubMed] [Google Scholar]
- 12.Ader N, et al. Mechanism for active membrane fusion triggering by morbillivirus attachment protein. J Virol. 2013;87(1):314–326. doi: 10.1128/JVI.01826-12. [DOI] [PMC free article] [PubMed] [Google Scholar]
- 13.Mühlebach MD, et al. Adherens junction protein nectin-4 is the epithelial receptor for measles virus. Nature. 2011;480(7378):530–533. doi: 10.1038/nature10639. [DOI] [PMC free article] [PubMed] [Google Scholar]
- 14.Dörig RE, Marcil A, Chopra A, Richardson CD. The human CD46 molecule is a receptor for measles virus (Edmonston strain) Cell. 1993;75(2):295–305. doi: 10.1016/0092-8674(93)80071-l. [DOI] [PubMed] [Google Scholar]
- 15.Naniche D, et al. Human membrane cofactor protein (CD46) acts as a cellular receptor for measles virus. J Virol. 1993;67(10):6025–6032. doi: 10.1128/jvi.67.10.6025-6032.1993. [DOI] [PMC free article] [PubMed] [Google Scholar]
- 16.Yanagi Y, Ono N, Tatsuo H, Hashimoto K, Minagawa H. Measles virus receptor SLAM (CD150) Virology. 2002;299(2):155–161. doi: 10.1006/viro.2002.1471. [DOI] [PubMed] [Google Scholar]
- 17.Negrete OA, et al. EphrinB2 is the entry receptor for Nipah virus, an emergent deadly paramyxovirus. Nature. 2005;436(7049):401–405. doi: 10.1038/nature03838. [DOI] [PubMed] [Google Scholar]
- 18.Bonaparte MI, et al. Ephrin-B2 ligand is a functional receptor for Hendra virus and Nipah virus. Proc Natl Acad Sci USA. 2005;102(30):10652–10657. doi: 10.1073/pnas.0504887102. [DOI] [PMC free article] [PubMed] [Google Scholar]
- 19.Tatsuo H, Ono N, Tanaka K, Yanagi Y. SLAM (CDw150) is a cellular receptor for measles virus. Nature. 2000;406(6798):893–897. doi: 10.1038/35022579. [DOI] [PubMed] [Google Scholar]
- 20.Aguilar HC, et al. N-glycans on Nipah virus fusion protein protect against neutralization but reduce membrane fusion and viral entry. J Virol. 2006;80(10):4878–4889. doi: 10.1128/JVI.80.10.4878-4889.2006. [DOI] [PMC free article] [PubMed] [Google Scholar]
- 21.Bishop KA, et al. Residues in the stalk domain of the hendra virus g glycoprotein modulate conformational changes associated with receptor binding. J Virol. 2008;82(22):11398–11409. doi: 10.1128/JVI.02654-07. [DOI] [PMC free article] [PubMed] [Google Scholar]
- 22.Plemper RK, Hammond AL, Gerlier D, Fielding AK, Cattaneo R. Strength of envelope protein interaction modulates cytopathicity of measles virus. J Virol. 2002;76(10):5051–5061. doi: 10.1128/JVI.76.10.5051-5061.2002. [DOI] [PMC free article] [PubMed] [Google Scholar]
- 23.Melanson VR, Iorio RM. Amino acid substitutions in the F-specific domain in the stalk of the newcastle disease virus HN protein modulate fusion and interfere with its interaction with the F protein. J Virol. 2004;78(23):13053–13061. doi: 10.1128/JVI.78.23.13053-13061.2004. [DOI] [PMC free article] [PubMed] [Google Scholar]
- 24.Bose S, et al. Fusion activation by a headless parainfluenza virus 5 hemagglutinin-neuraminidase stalk suggests a modular mechanism for triggering. Proc Natl Acad Sci USA. 2012;109(39):E2625–E2634. doi: 10.1073/pnas.1213813109. [DOI] [PMC free article] [PubMed] [Google Scholar]
- 25.Bose S, et al. Structure and mutagenesis of the parainfluenza virus 5 hemagglutinin-neuraminidase stalk domain reveals a four-helix bundle and the role of the stalk in fusion promotion. J Virol. 2011;85(24):12855–12866. doi: 10.1128/JVI.06350-11. [DOI] [PMC free article] [PubMed] [Google Scholar]
- 26.Welch BD, et al. Structure of the parainfluenza virus 5 (PIV5) hemagglutinin-neuraminidase (HN) ectodomain. PLoS Pathog. 2013;9(8):e1003534. doi: 10.1371/journal.ppat.1003534. [DOI] [PMC free article] [PubMed] [Google Scholar]
- 27.Yuan P, Paterson RG, Leser GP, Lamb RA, Jardetzky TS. Structure of the ulster strain newcastle disease virus hemagglutinin-neuraminidase reveals auto-inhibitory interactions associated with low virulence. PLoS Pathog. 2012;8(8):e1002855. doi: 10.1371/journal.ppat.1002855. [DOI] [PMC free article] [PubMed] [Google Scholar]
- 28.Connolly SA, Leser GP, Yin HS, Jardetzky TS, Lamb RA. Refolding of a paramyxovirus F protein from prefusion to postfusion conformations observed by liposome binding and electron microscopy. Proc Natl Acad Sci USA. 2006;103(47):17903–17908. doi: 10.1073/pnas.0608678103. [DOI] [PMC free article] [PubMed] [Google Scholar]
- 29.Ader N, et al. Structural rearrangements of the central region of the morbillivirus attachment protein stalk domain trigger F protein refolding for membrane fusion. J Biol Chem. 2012;287(20):16324–16334. doi: 10.1074/jbc.M112.342493. [DOI] [PMC free article] [PubMed] [Google Scholar]
- 30.Chan YP, et al. Biochemical, conformational, and immunogenic analysis of soluble trimeric forms of henipavirus fusion glycoproteins. J Virol. 2012;86(21):11457–11471. doi: 10.1128/JVI.01318-12. [DOI] [PMC free article] [PubMed] [Google Scholar]
- 31.Wharton SA, Skehel JJ, Wiley DC. Temperature dependence of fusion by sendai virus. Virology. 2000;271(1):71–78. doi: 10.1006/viro.2000.0280. [DOI] [PubMed] [Google Scholar]
- 32.Brindley MA, Takeda M, Plattet P, Plemper RK. Triggering the measles virus membrane fusion machinery. Proc Natl Acad Sci USA. 2012;109(44):E3018–E3027. doi: 10.1073/pnas.1210925109. [DOI] [PMC free article] [PubMed] [Google Scholar]
- 33.Paterson RG, Russell CJ, Lamb RA. Fusion protein of the paramyxovirus SV5: Destabilizing and stabilizing mutants of fusion activation. Virology. 2000;270(1):17–30. doi: 10.1006/viro.2000.0267. [DOI] [PubMed] [Google Scholar]
- 34.Avila M, et al. Molecular determinants defining the triggering range of prefusion F complexes of canine distemper virus. J Virol. 2014;88(5):2951–2966. doi: 10.1128/JVI.03123-13. [DOI] [PMC free article] [PubMed] [Google Scholar]
- 35.Harrison SC. Viral membrane fusion. Nat Struct Mol Biol. 2008;15(7):690–698. doi: 10.1038/nsmb.1456. [DOI] [PMC free article] [PubMed] [Google Scholar]
- 36.Scheid A, Choppin PW. Identification of biological activities of paramyxovirus glycoproteins. Activation of cell fusion, hemolysis, and infectivity of proteolytic cleavage of an inactive precursor protein of Sendai virus. Virology. 1974;57(2):475–490. doi: 10.1016/0042-6822(74)90187-1. [DOI] [PubMed] [Google Scholar]
- 37.Homma M, Ouchi M. Trypsin action on the growth of Sendai virus in tissue culture cells. 3. Structural difference of Sendai viruses grown in eggs and tissue culture cells. J Virol. 1973;12(6):1457–1465. doi: 10.1128/jvi.12.6.1457-1465.1973. [DOI] [PMC free article] [PubMed] [Google Scholar]
- 38.Nagai Y, Klenk H-D, Rott R. Proteolytic cleavage of the viral glycoproteins and its significance for the virulence of Newcastle disease virus. Virology. 1976;72(2):494–508. doi: 10.1016/0042-6822(76)90178-1. [DOI] [PubMed] [Google Scholar]
- 39.Jardetzky TS, Lamb RA. Virology: A class act. Nature. 2004;427(6972):307–308. doi: 10.1038/427307a. [DOI] [PubMed] [Google Scholar]
- 40.Plattet P, Plemper RK. Envelope protein dynamics in paramyxovirus entry. MBio. 2013;4(4):e00413. doi: 10.1128/mBio.00413-13. [DOI] [PMC free article] [PubMed] [Google Scholar]
- 41.Yin HS, Wen X, Paterson RG, Lamb RA, Jardetzky TS. Structure of the parainfluenza virus 5 F protein in its metastable, prefusion conformation. Nature. 2006;439(7072):38–44. doi: 10.1038/nature04322. [DOI] [PMC free article] [PubMed] [Google Scholar]
- 42.Welch BD, et al. Structure of the cleavage-activated prefusion form of the parainfluenza virus 5 fusion protein. Proc Natl Acad Sci USA. 2012;109(41):16672–16677. doi: 10.1073/pnas.1213802109. [DOI] [PMC free article] [PubMed] [Google Scholar]
- 43.McLellan JS, et al. Structure of RSV fusion glycoprotein trimer bound to a prefusion-specific neutralizing antibody. Science. 2013;340(6136):1113–1117. doi: 10.1126/science.1234914. [DOI] [PMC free article] [PubMed] [Google Scholar]
- 44.Yin H-S, Paterson RG, Wen X, Lamb RA, Jardetzky TS. Structure of the uncleaved ectodomain of the paramyxovirus (hPIV3) fusion protein. Proc Natl Acad Sci USA. 2005;102(26):9288–9293. doi: 10.1073/pnas.0503989102. [DOI] [PMC free article] [PubMed] [Google Scholar]
- 45.Swanson K, et al. Structure of the Newcastle disease virus F protein in the post-fusion conformation. Virology. 2010;402(2):372–379. doi: 10.1016/j.virol.2010.03.050. [DOI] [PMC free article] [PubMed] [Google Scholar]
- 46.Swanson KA, et al. Structural basis for immunization with postfusion respiratory syncytial virus fusion F glycoprotein (RSV F) to elicit high neutralizing antibody titers. Proc Natl Acad Sci USA. 2011;108(23):9619–9624. doi: 10.1073/pnas.1106536108. [DOI] [PMC free article] [PubMed] [Google Scholar]
- 47.McLellan JS, Yang Y, Graham BS, Kwong PD. Structure of respiratory syncytial virus fusion glycoprotein in the postfusion conformation reveals preservation of neutralizing epitopes. J Virol. 2011;85(15):7788–7796. doi: 10.1128/JVI.00555-11. [DOI] [PMC free article] [PubMed] [Google Scholar]
- 48.Russell CJ, Jardetzky TS, Lamb RA. Membrane fusion machines of paramyxoviruses: Capture of intermediates of fusion. EMBO J. 2001;20(15):4024–4034. doi: 10.1093/emboj/20.15.4024. [DOI] [PMC free article] [PubMed] [Google Scholar]
- 49.Kim YH, et al. Capture and imaging of a prehairpin fusion intermediate of the paramyxovirus PIV5. Proc Natl Acad Sci USA. 2011;108(52):20992–20997. doi: 10.1073/pnas.1116034108. [DOI] [PMC free article] [PubMed] [Google Scholar]
- 50.Baker KA, Dutch RE, Lamb RA, Jardetzky TS. Structural basis for paramyxovirus-mediated membrane fusion. Mol Cell. 1999;3(3):309–319. doi: 10.1016/s1097-2765(00)80458-x. [DOI] [PubMed] [Google Scholar]
- 51.Lamb RA, Paterson RG, Jardetzky TS. Paramyxovirus membrane fusion: Lessons from the F and HN atomic structures. Virology. 2006;344(1):30–37. doi: 10.1016/j.virol.2005.09.007. [DOI] [PMC free article] [PubMed] [Google Scholar]
- 52.Hambly DM, Gross ML. Laser flash photolysis of hydrogen peroxide to oxidize protein solvent-accessible residues on the microsecond timescale. J Am Soc Mass Spectrom. 2005;16(12):2057–2063. doi: 10.1016/j.jasms.2005.09.008. [DOI] [PubMed] [Google Scholar]
- 53.Gau BC, Sharp JS, Rempel DL, Gross ML. Fast photochemical oxidation of protein footprints faster than protein unfolding. Anal Chem. 2009;81(16):6563–6571. doi: 10.1021/ac901054w. [DOI] [PMC free article] [PubMed] [Google Scholar]
- 54.Connolly SA, Lamb RA. Paramyxovirus fusion: Real-time measurement of parainfluenza virus 5 virus-cell fusion. Virology. 2006;355(2):203–212. doi: 10.1016/j.virol.2006.07.021. [DOI] [PubMed] [Google Scholar]
- 55.Floyd DL, Harrison SC, van Oijen AM. Method for measurement of viral fusion kinetics at the single particle level. J Vis Exp. 2009 doi: 10.3791/1484. [DOI] [PMC free article] [PubMed] [Google Scholar]
- 56.Floyd DL, Ragains JR, Skehel JJ, Harrison SC, van Oijen AM. Single-particle kinetics of influenza virus membrane fusion. Proc Natl Acad Sci USA. 2008;105(40):15382–15387. doi: 10.1073/pnas.0807771105. [DOI] [PMC free article] [PubMed] [Google Scholar]
- 57.Ivanovic T, Choi JL, Whelan SP, van Oijen AM, Harrison SC. Influenza-virus membrane fusion by cooperative fold-back of stochastically induced hemagglutinin intermediates. eLife. 2013;2:e00333. doi: 10.7554/eLife.00333. [DOI] [PMC free article] [PubMed] [Google Scholar]
- 58.Xu G, Chance MR. Hydroxyl radical-mediated modification of proteins as probes for structural proteomics. Chem Rev. 2007;107(8):3514–3543. doi: 10.1021/cr0682047. [DOI] [PubMed] [Google Scholar]
- 59.Bose S, et al. Mutations in the parainfluenza virus 5 fusion protein reveal domains important for fusion triggering and metastability. J Virol. 2013;87(24):13520–13531. doi: 10.1128/JVI.02123-13. [DOI] [PMC free article] [PubMed] [Google Scholar]
- 60.Apte-Sengupta S, et al. Base of the measles virus fusion trimer head receives the signal that triggers membrane fusion. J Biol Chem. 2012;287(39):33026–33035. doi: 10.1074/jbc.M112.373308. [DOI] [PMC free article] [PubMed] [Google Scholar]
- 61.Baquero E, et al. Intermediate conformations during viral fusion glycoprotein structural transition. Curr Opin Virol. 2013;3(2):143–150. doi: 10.1016/j.coviro.2013.03.006. [DOI] [PMC free article] [PubMed] [Google Scholar]
- 62.Albertini AA, et al. Characterization of monomeric intermediates during VSV glycoprotein structural transition. PLoS Pathog. 2012;8(2):e1002556. doi: 10.1371/journal.ppat.1002556. [DOI] [PMC free article] [PubMed] [Google Scholar]
- 63.Corti D, et al. Cross-neutralization of four paramyxoviruses by a human monoclonal antibody. Nature. 2013;501(7467):439–443. doi: 10.1038/nature12442. [DOI] [PubMed] [Google Scholar]
- 64.Wen X, et al. Structure of the human metapneumovirus fusion protein with neutralizing antibody identifies a pneumovirus antigenic site. Nat Struct Mol Biol. 2012;19(4):461–463. doi: 10.1038/nsmb.2250. [DOI] [PMC free article] [PubMed] [Google Scholar]
- 65.Randall RE, Young DF, Goswami KKA, Russell WC. Isolation and characterization of monoclonal antibodies to simian virus 5 and their use in revealing antigenic differences between human, canine and simian isolates. J Gen Virol. 1987;68(Pt 11):2769–2780. doi: 10.1099/0022-1317-68-11-2769. [DOI] [PubMed] [Google Scholar]
- 66.Jones LM, B Sperry J, A Carroll J, Gross ML. Fast photochemical oxidation of proteins for epitope mapping. Anal Chem. 2011;83(20):7657–7661. doi: 10.1021/ac2007366. [DOI] [PMC free article] [PubMed] [Google Scholar]
- 67.Zhang H, Gau BC, Jones LM, Vidavsky I, Gross ML. Fast photochemical oxidation of proteins for comparing structures of protein-ligand complexes: The calmodulin-peptide model system. Anal Chem. 2011;83(1):311–318. doi: 10.1021/ac102426d. [DOI] [PMC free article] [PubMed] [Google Scholar]
- 68.Gau BC, Chen J, Gross ML. Fast photochemical oxidation of proteins for comparing solvent-accessibility changes accompanying protein folding: Data processing and application to barstar. Biochim Biophys Acta. 2013;1834(6):1230–1238. doi: 10.1016/j.bbapap.2013.02.023. [DOI] [PMC free article] [PubMed] [Google Scholar]
- 69.Jones LM, et al. Complementary MS methods assist conformational characterization of antibodies with altered S-S bonding networks. J Am Soc Mass Spectrom. 2013;24(6):835–845. doi: 10.1007/s13361-013-0582-4. [DOI] [PMC free article] [PubMed] [Google Scholar]
- 70.Gau B, Garai K, Frieden C, Gross ML. Mass spectrometry-based protein footprinting characterizes the structures of oligomeric apolipoprotein E2, E3, and E4. Biochemistry. 2011;50(38):8117–8126. doi: 10.1021/bi200911c. [DOI] [PMC free article] [PubMed] [Google Scholar]
- 71.Benjamini Y, Hochberg Y. Controlling the false discovery rate: A practical and powerful approach to multiple testing. J R Stat Soc, B. 1995;57(1):289–300. [Google Scholar]
- 72.Arnold K, Bordoli L, Kopp J, Schwede T. The SWISS-MODEL workspace: A web-based environment for protein structure homology modelling. Bioinformatics. 2006;22(2):195–201. doi: 10.1093/bioinformatics/bti770. [DOI] [PubMed] [Google Scholar]
- 73.Vriend G. WHAT IF: A molecular modeling and drug design program. J Mol Graph. 1990;8(1):52–56, 29. doi: 10.1016/0263-7855(90)80070-v. [DOI] [PubMed] [Google Scholar]
- 74.Jorgensen WL, Madura JD. Solvation and conformation of methanol in water. J Am Chem Soc. 1983;105(6):1407–1413. [Google Scholar]
- 75.Case DA, et al. Assisted model building with energy refinement. AMBER. 2008;10:32. Available at http://ambermd.org. Accessed May 28, 2014. [Google Scholar]
- 76.Hornak V, et al. Comparison of multiple Amber force fields and development of improved protein backbone parameters. Proteins. 2006;65(3):712–725. doi: 10.1002/prot.21123. [DOI] [PMC free article] [PubMed] [Google Scholar]
- 77.Götz AW, et al. Routine microsecond molecular dynamics simulations with AMBER on GPUs. 1. Generalized Born. J Chem Theory Comput. 2012;8(5):1542–1555. doi: 10.1021/ct200909j. [DOI] [PMC free article] [PubMed] [Google Scholar]
- 78.Darden T, Darrin Y, Pedersen L. Particle mesh Ewald: An N⋅log(N) method for Ewald sums in large systems. J Chem Phys. 1993;98(12):10089. [Google Scholar]
- 79.Hubbard SJ, Thornton JM. 1993. NACCESS, Computer Program. Available at http://opencitations.net/doc/expression/WkRdrvqFPHnRLsqn.html. Accessed May 28, 2014.
- 80.Schrodinger L. 2010. The PyMOL molecular graphics system, Version 1.3r1. Available at http://pymol.org/educational. Accessed May 28, 2014.