Abstract
In the absence of exogenous glucocorticoids, decreasing media pH (from 7.4 to 6.8) for 24 hours increased the Na+/H+ exchanger 3 (NHE3) activity in opossum kidney (OKP) cells. 10–7 M and 10–8 M hydrocortisone increased NHE3 activity, and in their presence, acid incubation further increased NHE3 activity. Hydrocortisone (10–9 M) had no effect on NHE3 activity, but in its presence, the effect of acid incubation on NHE3 activity increased twofold. Aldosterone (10–8 M) had no effect. In the absence of hydrocortisone, acid incubation increased NHE3 protein abundance by 47%; in the presence of 10–9 M hydrocortisone, acid incubation increased NHE3 protein abundance by 132%. The increase in NHE3 protein abundance was dependent on protein synthesis. However, 10–9 M hydrocortisone did not modify the effect of acid incubation to cause a twofold increase in NHE3 mRNA abundance. In the absence of protein synthesis, 10–9 M hydrocortisone did potentiate an effect of acid on NHE3 activity, which was due to trafficking of NHE3 to the apical membrane. These results suggest that glucocorticoids and acid interact synergistically at the level of NHE3 translation and trafficking.
Introduction
Chronic metabolic acidosis elicits a series of homeostatic responses that serve to return blood pH and serum [HCO3–] toward normal levels. One component of this response involves an increase in the activity of the proximal tubule apical membrane Na/H antiporter encoded by the Na+/H+ exchanger 3 (NHE3) (1, 2). Glucocorticoid hormones have been suggested to play an important role in this response. Metabolic acidosis causes an increase in circulating glucocorticoid levels (3, 4), and glucocorticoid agonists directly increase proximal tubule apical membrane Na/H antiporter activity (5) and renal cortical NHE3 mRNA abundance (6). Most importantly, adrenalectomy prevents the acidosis-induced increases in Na/H antiporter activity and renal NH4+ excretion (7).
However, adrenalectomy and glucocorticoid administration lead to changes in systemic and renal hemodynamics, which may complicate interpretation of results obtained in vivo. OKP cells are an opossum kidney cell line that expresses NHE3, and in which incubation in acid media or addition of glucocorticoids increases NHE3 activity (8–10). However, the effect of acid incubation in OKP cells did not require the presence of glucocorticoids in the media (8). The purpose of the present studies was to examine the nature of the interaction between acid and glucocorticoids in OKP cells. Results demonstrate that low concentrations of hydrocortisone are synergistic with media acidification in stimulating NHE3 activity, an effect resulting from increased NHE3 protein abundance and trafficking to the apical membrane.
Methods
Materials and supplies.
All chemicals were obtained from Sigma Chemical Co. (St. Louis, Missouri, USA) unless otherwise noted as follows: penicillin and streptomycin from Whittaker M.A. Bioproducts (Walkersville, Maryland, USA); acetoxymethyl derivative of 2′7′-bis(2-carboxyethyl)-5-(and-6)-carboxyfluorescein from Molecular Probes Inc. (Eugene, Oregon, USA); NHS-ss-biotin and immobilized streptavidin from Pierce Chemical Co. (Rockford, Illinois, USA); and culture media from GIBCO BRL (Grand Island, New York, USA).
Cell culture.
OKP cells (11) were passaged in high glucose (450 mg/dl) DMEM supplemented with 10% FBS, penicillin (100 U/ml), and streptomycin (100 μg/ml). For study, confluent cells were rendered quiescent by removal of serum, and media were changed to a 1:1 mixture of low glucose (100 mg/dl) DMEM and Ham's F12.
Measurement of intracellular pH and Na/H antiporter activity.
Continuous measurement of cytoplasmic pH (pHi) was accomplished using the intracellularly trapped pH-sensitive dye BCECF, as described previously (12). Cells were loaded with 10 μM acetoxymethyl ester of BCECF for 35 min at 37°C, and pHi was estimated from the ratio of fluorescence with excitation at wavelengths of 500 and 450 nm, with 530 nm emission in a computer-controlled spectrofluorometer (8000C; SLM Instruments Inc., Urbana, Illinois, USA). The BCECF excitation fluorescence ratio was calibrated intracellularly using K/nigericin as described (13).
Na/H antiporter activity was assayed as the initial rate of Na+-dependent pHi increase after an acid load in the absence of CO2/HCO3, as described previously (12). Cells were acidified with 13 μM nigericin in Na+-free solution. The initial rate of pHi increase (dpHi/dt) upon Na+ addition was calculated by drawing a line tangent to the initial deflection. Changes in media pH and glucocorticoids have no effect on buffer capacity (8, 9). Results are therefore reported as dpHi/dt. Because Na/H antiporter activity varies depending on passage number, level of confluence, and other poorly understood factors, in all studies comparisons are made between cells of the same passage studied on the same day.
Immunoblot.
Cells were rinsed with ice-cold PBS three times and Dounce-homogenized in isotonic Tris-buffered saline (150 mM NaCl, 50 mM Tris-HCl [pH 7.5], 5 mM EDTA) containing proteinase inhibitors (100 μg/ml PMSF, 4 μg/ml aprotinin, 4 μg/ml leupeptin). Nuclei were removed by centrifugation at 13,000 g at 4°C. Membranes were pelleted by centrifugation at 109,000 g for 20 min (TLA 100.3 rotor, 50,000 rpm) (Beckman TLX; Beckman Coulter Inc., Fullerton, California, USA). The resulting pellet was resuspended in Tris-buffered saline, and total protein content was determined by the method of Bradford. 15 μg of protein was diluted 1:5 in 5× SDS loading buffer (1 mM Tris-HCl [pH 6.8], 1% SDS, 10% glycerol, 1% 2-mercaptoethanol), size fractionated by SDS-PAGE (7.5% gel), and electrophoretically transferred to nitrocellulose. After blocking with 5% nonfat milk and 0.05% Tween-20 in PBS for 1 h, blots were probed in the same buffer for 1 h with a polyclonal anti–opossum NHE3 antibody (antiserum 5683, generated against a maltose binding protein/NHE3 [aa 484–839] fusion protein) at a dilution of 1:300 (14). Blots were washed in 0.05% Tween-20 in PBS one time for 15 min and two times for 5 min, incubated with a 1:10,000 dilution of peroxidase-labeled sheep anti–rabbit IgG in 5% nonfat milk and 0.05% Tween-20 in PBS for 1 h, washed as above, and then visualized by enhanced chemiluminescence. NHE3 protein abundance was quantitated by densitometry (ImageQuant Software version 3.3; Molecular Dynamics Inc., Sunnyvale, California, USA). This procedure labeled a 90-kDa band that was not seen when antibody was preincubated with fusion protein or when preimmune serum replaced the anti-NHE3 antiserum (14).
To measure plasma membrane NHE3, we used surface biotinylation. Monolayers were rinsed with ice-cold PBS-Ca-Mg (PBS with 0.1 mM CaCl2, 1.0 mM MgCl2) three times. Membrane proteins were then biotinylated by incubation of cells in 1.5 mg/ml NHS-ss-biotin in 10 mM triethanolamine (pH 7.4), 2 mM CaCl2, and 150 mM NaCl for 90 min at 4°C. After labeling, plates were washed with 6 ml quenching buffer (PBS-Ca-Mg, with 100 mM glycine) for 20 min at 4°C. Cells were then lysed in radioimmunoprecipitation assay (RIPA) buffer (150 mM NaCl, 50 mM Tris-HCl [pH 7.4], 5.0 mM EDTA, 1% Triton X-100, 0.5% deoxycholate, 0.1% SDS, 100 μg/ml PMSF, 5 μg/ml aprotinin, and 5 μg/ml leupeptin). Extracts were rocked for 30 min at 4°C, centrifuged at 12,000 rpm at 2°C for 10 min, and the supernatant diluted to 3 mg/ml with RIPA buffer. Biotinylated proteins were then precipitated with streptavidin-conjugated agarose, and the precipitate was subjected to SDS-PAGE and blotting with anti-NHE3 antisera as above.
RNA blotting.
RNA was extracted using RNeasy (QIAGEN Inc., Valencia, California, USA). 15 μg of total RNA was size-fractionated by agarose-formaldehyde gel electrophoresis and transferred to nylon membranes. The radiolabeled NHE3 probe was synthesized from a full-length OKP NHE3 cDNA (8) and the 18S probe from a 752-base SphI/BamHI fragment of the mouse 18S rRNA (No. 63178; American Type Culture Collection, Rockville, Maryland, USA) by the random hexamer method. Prehybridization, hybridization, and washing were performed as described previously (15). Filters were exposed to film overnight at –70°C and labeling was quantitated by densitometry. Changes in NHE3 abundance were normalized for changes in 18S rRNA abundance.
Statistics.
Statistical analysis was performed using ANOVA or paired t test, as appropriate. “n” refers to the number of plates studied.
Results
Glucocorticoids enhance the stimulatory effect of acid incubation on Na/H antiporter activity.
When confluent, OKP cells were removed from serum and incubated in either serum-free media or serum-free media with hydrocortisone added for 24 hours. Cells then were incubated in the same media at pH 7.4 or 6.8 for an additional 24 hours. Thus, after removal of serum, cells were incubated in the presence or absence of hydrocortisone for 48 hours, and during the last 24 hours were exposed to media pH of 7.4 or 6.8. Na/H antiporter activity was then measured at pH 7.4.
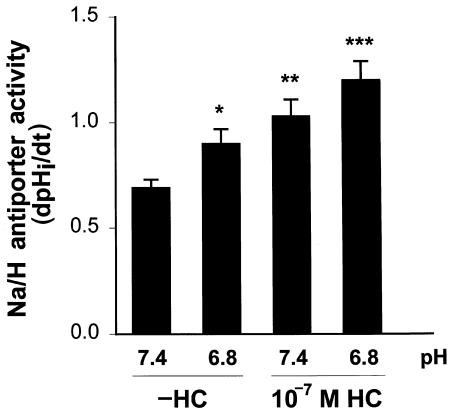
Figure 1 shows results with 10–7 M hydrocortisone. This concentration of hydrocortisone caused a 49% increase in Na/H antiporter activity (P < 0.005). In the absence of hydrocortisone, incubation in acid media caused a 30% increase in antiporter activity (P < 0.03). Incubation in acid media with 10–7 M hydrocortisone caused antiporter activity to increase 74% above control levels (pH 7.4, –HC; P < 0.02) and 17% above the activity in the presence of hydrocortisone alone (pH 7.4, +HC; P < 0.05). These results suggest that the effects of acid and hydrocortisone on Na/H antiporter activity are additive, but do not clearly delineate whether hydrocortisone modifies the effect of acid.
Figure 1.
Effect of 10–7 M hydrocortisone and media pH on Na/H antiporter activity. Cells were incubated in the presence or absence of 10–7 M hydrocortisone for 48 h, and at pH 7.4 or 6.8 for the last 24 h. Na/H antiporter activity was then measured at pH 7.4 and is reported as dpHi/dt. *P < 0.03 vs. pH 7.4 (–HC); **P < 0.005 vs. pH 7.4 (–HC); ***P < 0.01 vs. pH 6.8 (–HC), P < 0.05 vs. pH 7.4 (+HC), P < 0.02 vs. pH 7.4 (–HC). n = 7 (–HC/7.4, +HC/6.8), n = 8 (–HC/6.8, +HC/7.4). HC, hydrocortisone.
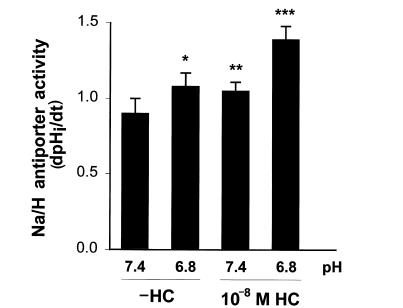
To further examine this, we used a similar protocol with a lower concentration of hydrocortisone: 10–8 M (Fig. 2). 10–8 M hydrocortisone caused only a 17% increase in Na/H antiporter activity (P < 0.02). In the absence of hydrocortisone, acid incubation caused a 20% increase in Na/H antiporter activity (P < 0.03), while in the presence of hydrocortisone, acid incubation caused an increase of 54% compared with control (pH 7.4, –HC; P < 0.001), and an increase of 32% compared with hydrocortisone alone (pH 7.4, +HC; P < 0.005). These results suggest that hydrocortisone may enhance the effect of acid but are also consistent with additive independent effects of acid and hydrocortisone.
Figure 2.
Effect of 10–8 M hydrocortisone and media pH on Na/H antiporter activity. Cells were incubated in the presence or absence of 10–8 M hydrocortisone for 48 h, and at pH 7.4 or 6.8 for the last 24 h. Na/H antiporter activity was then measured at pH 7.4 and is reported as dpHi/dt. *P < 0.03 vs. pH 7.4 (–HC); **P < 0.02 vs. pH 7.4 (–HC); ***P < 0.005 vs. pH 6.8 (–HC), P < 0.005 vs. pH 7.4 (+HC), P < 0.001 vs. pH 7.4 (–HC). n = 7 (–HC/7.4), n = 8 (–HC/6.8, +HC/6.8, +HC/7.4).
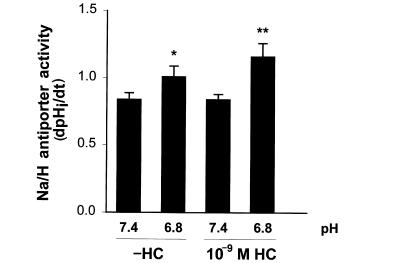
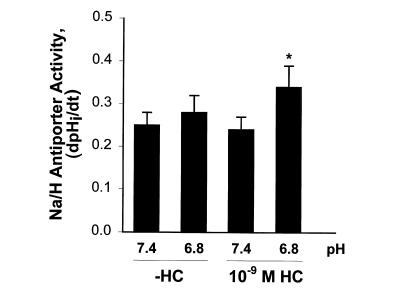
We therefore examined 10–9 M hydrocortisone (Fig. 3). This concentration of hydrocortisone had no effect on Na/H antiporter activity. In the absence of hydrocortisone, acid incubation caused a 20% increase in Na/H antiporter activity (P < 0.01), which was significantly larger in the presence of hydrocortisone (38% increase vs. control [pH 7.4, –HC; P < 0.002] or vs. hydrocortisone alone [pH 7.4, +HC; P < 0.003]). In addition, antiporter activity with acid and hydrocortisone was 15% greater than with acid in the absence of hydrocortisone (P < 0.02). Thus, at low concentrations of hydrocortisone, where there is no effect of hydrocortisone on Na/H antiporter activity, hydrocortisone synergistically increases the effect of acid incubation on antiporter activity twofold.
Figure 3.
Effect of 10–9 M hydrocortisone and media pH on Na/H antiporter activity. Cells were incubated in the presence or absence of 10–9 M hydrocortisone for 48 h, and at pH 7.4 or 6.8 for the last 24 h. Na/H antiporter activity was then measured at pH 7.4 and is reported as dpHi/dt. *P < 0.01 vs. pH 7.4 (–HC); **P < 0.02 vs. pH 6.8 (–HC), P < 0.003 vs. pH 7.4 (+HC), P < 0.002 vs. pH 7.4 (–HC). n = 9.
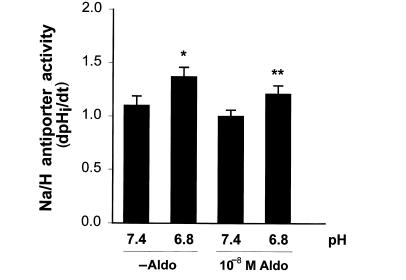
To address whether this synergism is due to a mineralocorticoid effect of hydrocortisone, we performed similar experiments with a high concentration of aldosterone (Fig. 4). 10–8 M aldosterone had no effect on Na/H antiporter activity. In addition, the effect of acidosis was not increased in the presence of aldosterone. In the absence of aldosterone, acid incubation increased Na/H antiporter activity by 25% (P < 0.03), while in the presence of aldosterone acid incubation increased antiporter activity by 21% (P < 0.02). Thus, the effect of hydrocortisone to synergize acid activation of the Na/H antiporter is a glucocorticoid effect.
Figure 4.
Effect of 10–8 M aldosterone and media pH on Na/H antiporter activity. Cells were incubated in the presence or absence of 10–8 M aldosterone for 48 h, and at pH 7.4 or 6.8 for the last 24 h. Na/H antiporter activity was then measured at pH 7.4 and is reported as dpHi/dt. *P < 0.03, 6.8 vs. 7.4; **P < 0.02, 6.8 vs. 7.4. n = 8.
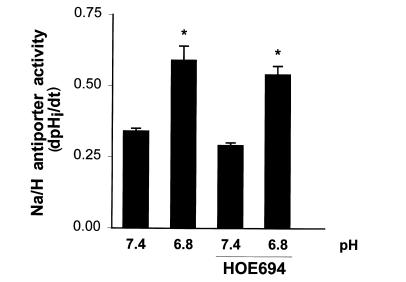
OKP cells express an EIPA-resistant Na/H antiporter that is encoded by NHE3 (8). In addition, glucocorticoids and acid incubation, applied separately, increase NHE3 activity (8, 9). It is therefore likely that the effect of acid incubation in the presence of glucocorticoids is on NHE3. To confirm this, studies were performed in the absence or presence of 100 μM HOE694, which should inhibit NHE1 or NHE2, but not NHE3 (16). As shown in Fig. 5, HOE694 did not inhibit Na/H antiporter activity and did not inhibit the effect of acid incubation in the presence of hydrocortisone. Thus, again the regulated isoform is NHE3.
Figure 5.
HOE694 does not inhibit the effect of 10–9 M hydrocortisone and media pH on Na/H antiporter activity. Cells were incubated in the presence of 10–9 M hydrocortisone for 48 h, and at pH 7.4 or 6.8 for the last 24 h. Na/H antiporter activity was then measured at pH 7.4 in the absence or presence of 100 μM HOE694 and is reported as dpHi/dt. *P < 0.01 vs. pH 7.4. n = 8.
Glucocorticoids enhance the stimulatory effect of acid incubation on NHE3 protein abundance.
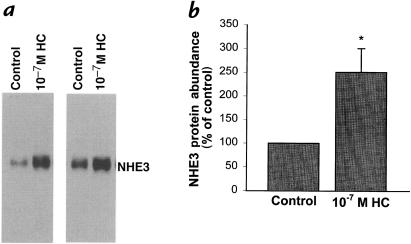
Glucocorticoids increase NHE3 activity and mRNA abundance (6, 9, 10). Application of 10–7 M hydrocortisone for 48 hours caused a 151% increase in NHE3 protein abundance (P < 0.05; Fig. 6).
Figure 6.
Effect of 10–7 M hydrocortisone on NHE3 protein abundance. Cells were incubated in the presence or absence of 10–7 M hydrocortisone for 48 h at pH 7.4. NHE3 protein abundance was measured by Western blot. (a) Typical blot. (b) Summary of data. *P < 0.05. n = 4. NHE, Na+/H+ exchanger.
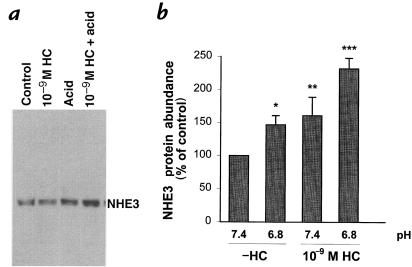
To examine the interaction between hydrocortisone and acid incubation at the level of NHE3 protein abundance, we used 10–9 M hydrocortisone and performed Western blotting (Fig. 7). In the absence of hydrocortisone, acid incubation caused a 47% increase in NHE3 protein abundance (P < 0.003). 10–9 M hydrocortisone caused a 61% increase in NHE3 protein abundance (P = 0.05). In the presence of 10–9 M hydrocortisone, acid incubation increased NHE3 abundance by 132% compared with that in the absence of hydrocortisone at pH 7.4 (P < 0.001). Thus, in the absence of hydrocortisone, acid incubation causes a small increase in NHE3 abundance, while in the presence of 10–9 M hydrocortisone, acid incubation causes a large increase in NHE3 abundance.
Figure 7.
Effect of 10–9 M hydrocortisone and media pH on NHE3 protein abundance. Cells were incubated in the presence or absence of 10–9 M hydrocortisone for 48 h, and at pH 7.4 or 6.8 for the last 24 h. NHE3 protein abundance was measured by Western blot. All groups were paired to cells studied in the absence of hydrocortisone at pH 7.4, and NHE3 abundance is expressed as the percent increase over this condition. (a) Typical blot. (b) Summary of data. *P < 0.003, n = 18; **P = 0.05, n = 11; ***P < 0.001, n = 6.
Cycloheximide blocks the acid-induced increase in NHE3 protein abundance.
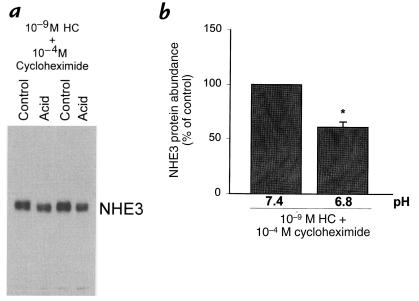
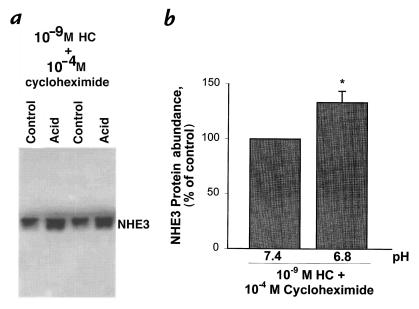
An effect of acid to increase NHE3 protein abundance could be due to an increase in protein synthesis or a decrease in protein degradation. To examine NHE3 protein stability, we measured the effect of a 24-hour acid incubation on NHE3 protein abundance in the presence of 10–9 M hydrocortisone and 10–4 M cycloheximide. Cycloheximide was added for the last 24 hours of control and acid incubation to allow hydrocortisone 24 hours to induce gene expression and protein synthesis before control or acid incubation. As shown in Fig. 8, in this setting, acid incubation decreased NHE3 protein abundance by 39% (P < 0.05). Thus, in the absence of protein synthesis, acid incubation decreases NHE3 abundance, demonstrating a decrease rather than an increase in NHE3 protein stability. The increase in NHE3 protein abundance seen in the absence of cycloheximide therefore is likely due to enhanced NHE3 synthesis.
Figure 8.
Effect of media pH on NHE3 protein abundance in the presence of 10–9 M hydrocortisone and 10–4 M cycloheximide. Cells were incubated in the presence of 10–9 M hydrocortisone for 48 h, and at pH 7.4 or 6.8 for the last 24 h. 10–4 M cycloheximide was added for the last 24 h. NHE3 protein abundance was measured by Western blot. (a) Typical blot. (b) Summary of data. *P < 0.05. n = 6.
Glucocorticoids do not enhance the stimulatory effect of acid on NHE3 mRNA abundance.
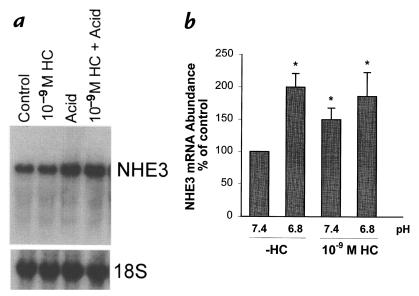
An increase in NHE3 protein synthesis can be due to an increase in NHE3 mRNA abundance. Both acid incubation and glucocorticoids have been demonstrated to increase NHE3 mRNA abundance in OKP cells (8, 10). To examine if there is synergism at this level, we again used a low concentration of hydrocortisone: 10–9 M (Fig. 9). Even this low dose of hydrocortisone caused a 50% increase in NHE3 mRNA abundance (P < 0.05). However, there was no synergism between hydrocortisone and acid incubation. Acid incubation caused a 100% increase in NHE3 mRNA abundance in the absence of hydrocortisone (P < 0.05), and an 86% increase in the presence of hydrocortisone (compared with pH 7.4 and no hydrocortisone; P < 0.05). Thus, the synergism between hydrocortisone and acid incubation occurs at the level of NHE3 activity and protein abundance, but not at the level of NHE3 mRNA abundance.
Figure 9.
Effect of 10–9 M hydrocortisone and media pH on NHE3 mRNA abundance. Cells were incubated in the presence or absence of 10–9 M hydrocortisone for 48 h, and at pH 7.4 or 6.8 for the last 24 h. NHE3 mRNA abundance was measured by Northern blot. (a) Typical blot. (b) Summary of data. *P < 0.05. n = 5 (–HC/6.8), n = 6 (–HC/7.4, +HC/6.8, +HC/7.4).
Glucocorticoids enhance acid-induced increases in NHE3 activity in the absence of protein synthesis.
We next examined whether the synergism between hydrocortisone and acid also involved posttranslational regulation. Once again, cells were incubated in the absence or presence of 10–9 M hydrocortisone for 24 hours before, and then during, control or acid incubation. Again, 10–4 M cycloheximide was added only during the last 24 hours of the control or acid incubation to allow hydrocortisone 24 hours to induce gene expression and protein synthesis. The low Na/H antiporter activities seen in these experiments are likely due to inhibition of synthesis of new antiporters and are similar to that which we have reported previously (9, 12) (Fig. 10). As expected, 10–9 M hydrocortisone had no effect on Na/H antiporter activity. In the absence of hydrocortisone, acid incubation did not significantly increase activity, while in the presence of hydrocortisone, acid incubation caused a 36% increase in Na/H antiporter activity (P < 0.005 vs. control or hydrocortisone). Thus, the synergism between hydrocortisone and acid involves, at least in part, a posttranslational process.
Figure 10.
Effect of 10–9 M hydrocortisone and media pH on Na/H antiporter activity: cycloheximide. Cells were incubated in the presence or absence of 10–9 M hydrocortisone for 48 h, and at pH 7.4 or 6.8 for the last 24 h. 10–4 M cycloheximide was added for the last 24 h. Na/H antiporter activity was then measured at pH 7.4 and is reported as dpHi/dt. *P < 0.005 vs. 7.4 (–HC and +HC). n = 9 (–HC/7.4), n = 10 (–HC/6.8, +HC/6.8, +HC/7.4).
Given that NHE3 protein abundance is decreased by acid incubation in the presence of cycloheximide (Fig. 8), the increase in activity must be related to a process downstream from changes in protein abundance. One possible mechanism is that acid incubation induces net trafficking of NHE3 from an intracellular storage pool to the apical membrane. To examine this, we biotinylated apical membrane proteins as described in Methods. After precipitation with streptavidin-linked agarose beads, NHE3 was identified by Western blot. Figure 11 shows that in the presence of 10–9 M hydrocortisone and cycloheximide, acid incubation increased apical membrane NHE3 abundance by 33% (P < 0.05). Because this condition is associated with a decrease in total cell NHE3, this result clearly demonstrates net trafficking of NHE3 to the apical membrane.
Figure 11.
Effect of media pH on apical membrane NHE3 protein abundance in the presence of 10–9 M hydrocortisone and 10–4 M cycloheximide. Cells were incubated in the presence of 10–9 M hydrocortisone for 48 h, and at pH 7.4 or 6.8 for the last 24 h. 10–4 M cycloheximide was added for the last 24 h. Apical membrane NHE3 protein abundance was measured by biotinylation followed by precipitation with streptavidin and Western blotting with anti-NHE3 antisera. (a) Typical blot. (b) Summary of data. *P < 0.05. n = 6.
Discussion
Glucocorticoids increase proximal tubule apical membrane Na/H antiporter activity in vivo and in cell culture (5, 9, 17). The present studies also demonstrate that glucocorticoids increase NHE3 protein abundance. This is associated with increases in NHE3 mRNA abundance in renal cortex and in OKP cells (6, 10). In OKP cells, the increase in NHE3 mRNA is related to increased NHE3 transcription with no change in NHE3 mRNA stability (10). Metabolic acidosis causes an increase in glucocorticoid levels (3, 4), which could then mediate the observed increase in NHE3.
In support of an important role for glucocorticoids in the acid response, it has been demonstrated that adrenalectomized rats fail to respond to acidosis with an increase in renal NH4+ excretion and proximal tubule apical membrane Na/H antiporter activity (7). However, because of significant hemodynamic effects of glucocorticoids, these results are difficult to interpret. Administration of dexamethasone to these adrenalectomized rats increases Na/H antiporter activity, but acidosis does not further increase antiporter activity. This lack of a further acid effect suggests that glucocorticoids mediate the effect of acidosis rather than synergistically increase the acid effect. However, these studies may also be difficult to interpret given the large dose of dexamethasone administered and the possibility that a maximal antiporter activity had been achieved. Thus, in vivo studies have suggested an important role for glucocorticoids in mediating the effect of acidosis on the antiporter, but the exact role played remains unclear from these studies.
The present studies demonstrate that in addition to directly activating NHE3 transcription, glucocorticoids synergistically increase the effect of acidosis on NHE3. In the absence of glucocorticoids, incubation of OKP cells in acid media for 24 hours caused increases in NHE3 activity, protein abundance, and mRNA abundance. In this setting, the magnitude of the effect on mRNA abundance (twofold increase) was quantitatively greater than the magnitude of the effect on protein abundance (47% increase). This differs somewhat from results in rats, where chronic metabolic acidosis increases NHE3 protein abundance twofold with no measurable effect on mRNA abundance (1). The lack of an effect on mRNA abundance compared with results in cell culture may reflect the much smaller magnitude of pH change achieved in rats. However, this would not then explain why the effect on NHE3 protein abundance was larger in intact rats. One difference is that glucocorticoids were present in the rat studies but not in the cell culture studies (1).
In the present studies, glucocorticoids significantly enhanced the effects of acid incubation on NHE3 protein abundance and activity, but had no effect on the increase in NHE3 mRNA abundance. In the presence of glucocorticoids, acid incubation had a threefold greater effect on NHE3 protein abundance and a twofold greater effect on NHE3 activity. These effects were seen with a low concentration of hydrocortisone that had no direct effect on NHE3 activity. These results suggest that glucocorticoids enhance the ability of acid to increase NHE3 protein synthesis or stability.
To address the mechanism further, we examined NHE3 protein stability. In the presence of cycloheximide and hydrocortisone, acid incubation decreased rather than increased NHE3 protein abundance. This suggests that in this setting, acid decreases NHE3 protein stability. Thus with protein synthesis intact, acid directly increases NHE3 protein synthesis, an effect that is greater in magnitude than the decrease in protein stability, resulting in a net increase in NHE3 protein abundance. It is possible, but less likely, that acid increases synthesis of a second protein, which functions to increase NHE3 stability; inhibition of synthesis of this second protein would then inhibit this effect, leaving unopposed a direct effect to decrease NHE3 protein stability.
Although acid did not increase NHE3 protein abundance in the presence of cycloheximide, there was still an increase in NHE3 activity. This suggests an additional posttranslational mechanism of regulation by acid. In the present studies, we demonstrated that acid incubation caused an increase in apical membrane NHE3 in the presence of cycloheximide. Given that total cellular NHE3 is decreased in this condition, these results demonstrate acid-induced trafficking of NHE3 to the apical membrane. It is also possible that acid incubation induces NHE3 phosphorylation or binding of a regulatory protein to NHE3.
Glucocorticoids have been shown to play an important role in acidosis-induced increases in protein degradation in rats. Adrenalectomy inhibited this effect of acidosis, but provision of low or high doses of dexamethasone to adrenalectomized rats once again allowed acidosis to stimulate protein degradation (4). Similar results were found for acidosis-stimulated muscle leucine oxidation (18), and for acidosis-induced increases in the abundance of mRNAs encoding polyubiquitin and the C2 and C9 subunits of the 26S proteosome (19), all of which contribute to acidosis-induced protein breakdown. Similarly, in cultured BC3H1 cells maintained in 1% serum, increased protein degradation was not seen with media acidification or dexamethasone alone, but was seen with media acidification and dexamethasone together (20). By contrast, in these cells, media acidification increased mRNA abundance for ubiquitin and the C2 proteosome subunit in the absence of dexamethasone. In cultured LLC-PK1 cells, activation of branched-chain α-ketoacid dehydrogenase activity by acid media occurred in cells that do not express glucocorticoid receptors (21). These results suggest, similar to the present results, that while acidosis may exert glucocorticoid-independent effects on protein degradation, a significant component of regulation by acidosis involves synergism with glucocorticoids.
In summary, glucocorticoids play an important role in the response of the Na/H antiporter to acidosis. Acidosis increases adrenal glucocorticoid secretion (3, 4). Glucocorticoids then exert three effects on NHE3. First, they directly increase NHE3 transcription. Second, glucocorticoids synergistically enhance the ability of acidosis to increase NHE3 protein abundance, likely through enhanced NHE3 protein synthesis. Lastly, glucocorticoids synergistically enhance the ability of acidosis to induce NHE3 trafficking to the apical membrane.
Acknowledgments
The authors gratefully acknowledge discussions with Bill Mitch. Technical assistance was provided by Martha Ferguson. HOE694 was generously provided by Shmuel Muallem (University of Texas Southwestern). These studies were supported by grants from the National Institutes of Health (DK39298 and DK48482), the Veterans Administration (to O.W. Moe), and the Swiss National Foundation.
References
- 1.Ambühl PM, et al. Chronic metabolic acidosis increases NHE3 protein abundance in rat kidney. Am J Physiol. 1996;271:F917–F925. doi: 10.1152/ajprenal.1996.271.4.F917. [DOI] [PubMed] [Google Scholar]
- 2.Wu MS, Biemesderfer D, Giebisch G, Aronson P. Role of NHE3 in mediating renal brush border Na+-H+ exchange. Adaptation to metabolic acidosis. J Biol Chem. 1996;271:32749–32752. doi: 10.1074/jbc.271.51.32749. [DOI] [PubMed] [Google Scholar]
- 3.Welbourne TC. Acidosis activation of the pituitary-adrenal-renal glutaminase I axis. Endocrinology. 1976;99:1071–1079. doi: 10.1210/endo-99-4-1071. [DOI] [PubMed] [Google Scholar]
- 4.May RC, Kelly RA, Mitch WE. Metabolic acidosis stimulates protein degradation in rat muscle by a glucocorticoid-dependent mechanism. J Clin Invest. 1986;77:614–621. doi: 10.1172/JCI112344. [DOI] [PMC free article] [PubMed] [Google Scholar]
- 5.Kinsella JL, Freiberg JM, Sacktor B. Glucocorticoid activation of Na/H exchange in renal brush border vesicles: kinetic effects. Am J Physiol. 1985;248:F233–F239. doi: 10.1152/ajprenal.1985.248.2.F233. [DOI] [PubMed] [Google Scholar]
- 6.Baum M, Moe OW, Gentry DL, Alpern RJ. Effect of glucocorticoids on renal cortical NHE-3 and NHE-1 mRNA. Am J Physiol. 1994;267:F437–F442. doi: 10.1152/ajprenal.1994.267.3.F437. [DOI] [PubMed] [Google Scholar]
- 7.Kinsella JL, Cujkit T, Sactor B. Na-H exchange activity in renal brush border membrane vesicles in response to metabolic acidosis: the role of glucocorticoids. Proc Natl Acad Sci USA. 1984;81:630–634. doi: 10.1073/pnas.81.2.630. [DOI] [PMC free article] [PubMed] [Google Scholar]
- 8.Amemiya M, Yamaji Y, Cano A, Moe OW, Alpern RJ. Acid incubation increases NHE-3 mRNA abundance in OKP cells. Am J Physiol. 1995;269:C126–C133. doi: 10.1152/ajpcell.1995.269.1.C126. [DOI] [PubMed] [Google Scholar]
- 9.Baum M, Cano A, Alpern RJ. Glucocorticoids stimulate Na/H antiporter in OKP cells. Am J Physiol. 1993;264:F1027–F1031. doi: 10.1152/ajprenal.1993.264.6.F1027. [DOI] [PubMed] [Google Scholar]
- 10.Baum M, Amemiya M, Dwarakanath V, Alpern RJ, Moe OW. Glucocorticoids regulate NHE-3 transcription in OKP cells. Am J Physiol. 1996;270:F164–F169. doi: 10.1152/ajprenal.1996.270.1.F164. [DOI] [PubMed] [Google Scholar]
- 11.Cole JA, Forte LR, Krause WJ, Thorne PK. Clonal sublines that are morphologically and functionally distinct from parental OK cells. Am J Physiol. 1989;256:F672–F679. doi: 10.1152/ajprenal.1989.256.4.F672. [DOI] [PubMed] [Google Scholar]
- 12.Cano A, Preisig P, Alpern RJ. Cyclic adenosine monophosphate acutely inhibits and chronically stimulates Na/H antiporter in OKP cells. J Clin Invest. 1993;92:1632–1638. doi: 10.1172/JCI116748. [DOI] [PMC free article] [PubMed] [Google Scholar]
- 13.Alpern RJ. Mechanism of basolateral membrane H/OH/HCO3 transport in the rat proximal convoluted tubule. J Gen Physiol. 1985;86:613–636. doi: 10.1085/jgp.86.5.613. [DOI] [PMC free article] [PubMed] [Google Scholar]
- 14.Ambühl P, Amemiya M, Preisig PA, Moe OW, Alpern RJ. Chronic hyperosmolality increases NHE3 activity in OKP cells. J Clin Invest. 1998;101:170–177. doi: 10.1172/JCI62. [DOI] [PMC free article] [PubMed] [Google Scholar]
- 15.Moe OW, et al. Differential regulation of Na/H antiporter by acid in renal epithelial cells and fibroblasts. J Clin Invest. 1991;88:1703–1708. doi: 10.1172/JCI115487. [DOI] [PMC free article] [PubMed] [Google Scholar]
- 16.Kelly MP, Quinn PA, Davies JE. Activity and expression of Na+-H+ exchanger isoforms 1 and 3 in kidney proximal tubules of hypertensive rats. Circ Res. 1997;80:853–860. doi: 10.1161/01.res.80.6.853. [DOI] [PubMed] [Google Scholar]
- 17.Bidet M, Merot J, Tauc M, Poujeol P. Na-H exchanger in proximal cells isolated from kidney. II. Short-term regulation by glucocorticoids. Am J Physiol. 1987;253:F945–F951. doi: 10.1152/ajprenal.1987.253.5.F945. [DOI] [PubMed] [Google Scholar]
- 18.May RC, Bailey JL, Mitch WE, Masud T, England BK. Glucocorticoids and acidosis stimulate protein and amino acid catabolism in vivo. Kidney Int. 1996;49:679–683. doi: 10.1038/ki.1996.96. [DOI] [PubMed] [Google Scholar]
- 19.Price SR, England BK, Bailey JL, Van Vreede K, Mitch WE. Acidosis and glucocorticoids concomitantly increase ubiquitin and proteasome subunit mRNAs in rat muscle. Am J Physiol. 1994;267:C955–C960. doi: 10.1152/ajpcell.1994.267.4.C955. [DOI] [PubMed] [Google Scholar]
- 20.Isozaki Y, Mitch WE, England BK, Price SR. Protein degradation and increased mRNAs encoding proteins of the ubiquitin-proteasome proteolytic pathway in BC3H1 myocytes require an interaction between glucocorticoids and acidification. Proc Natl Acad Sci USA. 1996;93:1967–1971. doi: 10.1073/pnas.93.5.1967. [DOI] [PMC free article] [PubMed] [Google Scholar]
- 21.Wang X, Jurkovitz C, Price SR. Regulation of branched-chain ketoacid dehydrogenase flux by extracellular pH and glucocorticoids. Am J Physiol. 1997;272:C2031–C2036. doi: 10.1152/ajpcell.1997.272.6.C2031. [DOI] [PubMed] [Google Scholar]


