

Abstract
Background
A wealth of genome sequences has provided thousands of genes of unknown function, but identification of functions for the large numbers of hypothetical genes in phytopathogens remains a challenge that impacts all research on plant-microbe interactions. Decades of research on the molecular basis of pathogenesis focused on a limited number of factors associated with long-known host-microbe interaction systems, providing limited direction into this challenge. Computational approaches to identify virulence genes often rely on two strategies: searching for sequence similarity to known host-microbe interaction factors from other organisms, and identifying islands of genes that discriminate between pathogens of one type and closely related non-pathogens or pathogens of a different type. The former is limited to known genes, excluding vast collections of genes of unknown function found in every genome. The latter lacks specificity, since many genes in genomic islands have little to do with host-interaction.
Result
In this study, we developed a supervised machine learning approach that was designed to recognize patterns from large and disparate data types, in order to identify candidate host-microbe interaction factors. The soft rot Enterobacteriaceae strains Dickeya dadantii 3937 and Pectobacterium carotovorum WPP14 were used for development of this tool, because these pathogens are important on multiple high value crops in agriculture worldwide and more genomic and functional data is available for the Enterobacteriaceae than any other microbial family. Our approach achieved greater than 90% precision and a recall rate over 80% in 10-fold cross validation tests.
Conclusion
Application of the learning scheme to the complete genome of these two organisms generated a list of roughly 200 candidates, many of which were previously not implicated in plant-microbe interaction and many of which are of completely unknown function. These lists provide new targets for experimental validation and further characterization, and our approach presents a promising pattern-learning scheme that can be generalized to create a resource to study host-microbe interactions in other bacterial phytopathogens.
Electronic supplementary material
The online version of this article (doi:10.1186/1471-2164-15-508) contains supplementary material, which is available to authorized users.
Keywords: Pattern recognition, Data mining, Plant pathogen, Genome scale analysis, Enterobacteria
Background
Interactions between plant-associated microbes and their eukaryotic hosts are complex biological processes involving hundreds, if not thousands, of genes from each organism. Understanding the molecular mechanisms of such complex processes at the systems-scale is seriously hampered by the lack of a comprehensive list of gene products that contribute for even a single bacterial or fungal pathogen. Variation in lifestyles and pathogenic potential between organisms makes the challenge all the greater. Genome sequencing has dramatically increased the potential for large-scale screens to identify genes involved with host-microbe interactions. Direct experimental evidence is the obvious gold standard, but not all significant pathogens are experimentally tractable, and selection of experimental conditions and convenient hosts for high-throughput screens can limit discovery. More targeted experiments can be designed to probe function more completely, but these are time consuming and generally limited to a smaller number of candidate genes. Further, it is unclear what experiments to conduct if a candidate gene is of completely unknown function. Importantly, genes of unknown function make up a substantial fraction of each sequenced genome, and it is likely that among these lie some of the greatest potential for discovery of truly novel aspects of host-microbe interaction (as well as many other complex biological processes).
Computational approaches to identify potential host-microbe interaction factors and predict their specific functions can be a valuable way to guide experimentation, and may be the only option for some recalcitrant organisms. Typical bioinformatics strategies include searching for sequence similarity to gene products known to contribute to host-microbe interaction in other organisms, and comparing genomes to identify gene islands that discriminate between pathogens of one type and closely related non-pathogens or pathogens of a different type. Both strategies are useful, but the former is limited to known genes and detectable levels of sequence similarity, and thus excludes the vast collections of genes of unknown function. The latter lacks specificity, since many genes in genomic islands may have little to do with host interactions, and the definition of rules for the distribution across organisms can be arbitrary. There are no simple rules to define the relevant distribution for the set of orthologous genes across genomes, especially when there are a large number of genomes being compared. Further, it is preferable in many situations to factor in other features such as genome context or gene expression data as additional evidence sources to predict whether a gene is associated with host-microbe interaction processes.
More sophisticated computational prediction strategies can introduce a variety of other types of evidence, but integration of diverse data types remains a challenge. Machine learning techniques are ideally suited for pattern recognition tasks to accommodate diverse biological data sources into a single predictive analysis to achieve superior performance over any individual type of data, especially where (1) data sets are large, (2) with heterogeneous sources, and (3) patterns are not easily described by a compact set of rules, all of which are true for the task of genome-scale identification of host-microbe interaction factors. Supervised machine learning schemes have been receiving increasing attention recently as a promising approach to study diverse biomedical problems [1–5], but no previous study focused on host-microbe interaction factors. In this study, we developed a supervised machine learning strategy to identify the gene inventory involved with host-microbe interaction from two soft rot-associated enterobacteria, Dickeya dadantii (aka. Erwinia chrysanthemi) 3937 [6], and Pectobacterium carotovorum (aka. Erwinia carotovorum) WPP14 [7]. Our approach allows us to incorporate a wide variety of input data, including homology information, genome context, predicted transcription factor binding sites, and microarray transcript profiles. It has achieved promising results with precision rate over 90% with recall rate over 80%. Further, our study generates an extended list of roughly 200 candidate interaction factors and provides experimentally testable hypotheses to stimulate further research on the molecular mechanisms of soft rot pathogenesis and survival in plant hosts. This study represents a promising application of pattern-recognition methods for identification of factors involved in complex biological processes, which can be generalized to study other plant-associated organisms.
Methods
Target genome selection
Soft rot-associated enterobacteria are economically important pathogens that infect a broad range of plant species [8–11]. Soft rot bacterial pathogenesis is characterized by rapid necrosis of parenchymatous tissues, mainly due to the action of secreted enzymes that degrade the middle lamellae and the primary cell wall [12]. Continuing discovery of additional genes involved in survival in a plant host or which contribute directly to pathogenesis [13–19] suggests that even for well-studied organism such as Dd3937, we have not yet achieved a comprehensive list of host-microbe interaction factors or a complete understanding of their precise roles. In this study, we target two soft rot-associated phytopathogens for genome-wide identification of host interaction factors (Table 1). One, Dickeya dadantii 3937 (Dd3937) was originally isolated from Saintpaulia ionantha [20, 21], and is a long-standing model system for this group of organisms [6]; the other, Pectobacterium carotovorum carotovorum WPP14 was isolated from infected potato in Wisconsin [7, 22].
Table 1.
Genome-wide target class label assignment to each protein coding gene as a data point for Dickeya didantii 3937 and Pectobacterium carotovorum WPP14
| Total # CDS* | IF** | CF** | Training data set | Testing data set | Pseudogene | |
|---|---|---|---|---|---|---|
| Dd3937 | 4520 | 267 | 1264 | 1531 | 2989 | 28 |
| WPP14 | 4590 | 233 | 1111 | 1344 | 3246 | 174 |
*we only use protein coding genes and pseudogenes are not included.
**IF stands for host-microbe interaction factor; CF stands for genes involved in core biological processes
Colonization and survival in plants requires numerous factors including proteins involved with iron assimilation, protein secretion, exopolysaccharide synthesis, motility, and stress-resistance [23, 24]. Five Gene Ontology terms were identified that partition the majority of the positive class training set data into distinct aspects of host-microbe interactions (Table 2). We included all data points in most of our analyses, but also conducted analyses on the partitions defined by these GO annotations (Additional file 1a and 1b). This allows us to test whether different subsystems contain distinct patterns that can be recognized by our learning schemes, while avoiding subsystems with too few genes to provide sufficient information to train the learning schemes.
Table 2.
Ontology for host-microbe interaction, and category assignment genome-wide for data points in Dickeya dadantii (Dd3937) and Pectobacterium carotovora (WPP14)
| GO term and name | Dd3937 | WPP14 |
|---|---|---|
| GO:0052192 movement in environment of other organism involved in symbiotic interaction; | 41 | 41 |
| GO:0052048 interaction with host via secreted substance involved in symbiotic interaction | 54 | 53 |
| GO:0051816 acquisition of nutrients from other organism during symbiotic interaction | 103 | 81 |
| GO:0044413 avoidance of host defenses | 43 | 34 |
| GO:0043903 regulation of symbiosis, encompassing mutualism through parasitism | 13 | 9 |
| *GO:0044403 symbiosis, encompassing mutualism through parasitism | 13 | 15 |
| Total | 267 | 233 |
*this term is a parent term for all others listed in this table and is used as a generic catch all for host-microbe interaction factors lacking more specific GO term annotations.
Assembling training datasets
The data set for each target genome is assembled separately. Genome sequences, predicted proteins and annotations for both genomes were obtained from the ASAP database [25, 26]. Each protein-coding gene in a target genome is considered a data point. The target class label in this specific learning task indicates whether or not a data point has an association with the biological processes involved in host-microbe interaction. A positive class label means the data point is related to host-microbe interaction. A negative class label indicates the data point is not likely to be directly involved in host-microbe interaction, rather it is associated with core biological processes such as transcription and translation or central pathways of metabolism. Positive and negative class labels were assigned by human experts.
For each data point, we assemble a vector of features (or attributes), to characterize it. In our preliminary analyses, we sought to be inclusive in construction of the data matrix. We included 606 attributes for Dd3937 and 598 attributes for WPP14, and these attributes fall roughly into four different categories listed in Table 3. (1) Sequence homology data was obtained from BLASTP searches of the proteins from the target genomes against 239 gamma-proteobacteria from 14 bacterial orders and 58 genomes from other bacterial families outside of gamma-proteobacteria (details in Additional file 2a and 2b). 2) We further summarized sequence homology information by classifying organisms based on phenotypes (e.g.., strict anaerobe), taxonomy (e.g.., the order of Enterobacteriales), habitat (e.g., aquatic), and host type (e.g. plant-associated). Based on this information, we calculated a series of attributes summarizing the homology data. For instance, for each gene, we calculate the number of genomes with a homolog, the fraction of genomes with homologs that are plant-associated, the average similarity scores between homologs, the ratio of the similarity score of plant-associated versus animal-associated homologs, the percentage of hits in the order of Enterobacteriales, and the percentage in facultative anaerobic organisms, etc. Additional file 2c shows the number of genomes in each category used to generate summary attributes. 3) Information related to function and regulation including transcriptome and proteome profiles was incorporated into the attribute vectors (details in Additional file 3a), including microarray experiments with a pecS mutant strain [27], exposure to phenolic acids [28], and growth on potato tuber and stem [29]. For Dd3937, we also integrated the presence of predicted binding sites for 32 transcriptional regulators, including ones related to gene regulation during infection such as PecS [17, 27], KdgR [30], H-NS [31, 32], and CRP [33, 34]. We did not include binding site data for WPP14 because the large number of contigs complicates prediction. 4) Finally, we incorporated over 20 basic gene or protein features (Table 3), such as GC content, amino acid composition and computed structural and physiochemical features of proteins and peptides [35], operon prediction [36], COG functional category [37], and codon adaptation index [38, 39]. Other gene features are derived from more complex analyses, including: (a) the phylogenetic profile method [40], which is based on the theoretical framework that co-occurrence of functionally linked proteins will be preserved by natural selection [41]; (b) Phylogenetic conservation which classifies genes according to distribution at different branching depths based on our phylogenetic framework for enterobacteria [11]; (c) PSORTb v3.0 [42] which predicts localization as cytoplasmic, cytoplasmic membrane, periplasmic, extracellular, or unknown; (d) Protein fingerprint scanning (a similarity search technique able to identify distantly related proteins) against identified fingerprints associated with virulence factors in PRINTS database [43, 44]; and (e) the gene neighbor method which identifies gene physical adjacency on a chromosome [45], based on the theory that neutral evolution tends to shuffle gene orders while functionally associated genes have conserved gene order. We employ both 150 bp and 300 bp as a threshold distance to define gene neighbors using ad hoc code.
Table 3.
List of all attributes categories used in data set formation in this study, and number of attributes in each categories for all data points in training data set for Dickeya dadantii (Dd3937) and Pectobacterium carotovorum (WPP14)
| Category | Subcategory | Dd3937 | WPP14 | Reference |
|---|---|---|---|---|
| Sequence homology | Subtotal | 297 | 297 | |
| Gamma strains | 239 | 239 | Additional file 2a | |
| Non-gamma strains | 58 | 58 | Additional file 2b | |
| Phenotypes of interest | Subtotal | 194 | 194 | |
| Taxonomy Statistics | 76 | 76 | Additional file 2c, d | |
| Lifestyle Statistics | 118 | 118 | Additional file 2c, d | |
| Gene characteristics | Subtotal | 23 | 21 | |
| GC content | 1 | 1 | This study | |
| subcellular localization | 1 | 1 | [42, 46] | |
| phylogenetic profile | 6 | 6 | [40, 41] | |
| fingerprints scanning | 3 | 3 | [43, 44] | |
| codon adaptation index (CAI) | 3 | 3 | [47, 48] | |
| physical adjacency (gene neighbor) | 2 | 2 | [49, 50] | |
| Operon prediction | 1 | 1 | [36, 51] | |
| phylogenetic conservation | 1 | 1 | This study | |
| COG functional category | 1 | 1 | [52] | |
| Genomic island | 4 | 1 | [53, 54] | |
| computed structural and physicochemical features of proteins and peptides | 40 | 66 | [35, 55] | |
| Functional genomics | Subtotal | 52 | 3 | |
| binding site prediction | 32 | 0 | Additional file 3b | |
| Gene expression | 14 | 3 | Additional file 3a | |
| proteomics | 6 | 0 | Additional file 3a | |
| Total | 606 | 581 |
Overview of supervised machine learning procedures
The learning procedure is illustrated in Figure 1. (1) First training and testing data sets are assembled by assigning target class labels and forming attribute vectors. (2) Data preprocessing is performed to improve representation and quality, including attribute selection and data transformation, as well as data partitioning according to GO annotations. (3) Both data preprocessing and pattern learning schemes were implemented in Weka package version 3.5.6. [56, 57]. Both base and ensemble classifiers were trained to recognize classification patterns. Seven base classifiers were employed in this study including decision tree [58], support vector machine (SVM) using sequential minimal optimization [59–61], Bayesian probabilistic approaches including Bayesian network [62, 63] and naive bayes [64], instance based learner k nearest neighbor [65], and propositional rule learner using repeated incremental pruning to produce error reduction (RIPPER) [66]. On top of base classifiers, ensemble classifiers, such as bagging and boosting classifiers, combine multiple models by either sub-sampling a given dataset to achieve greater predictive accuracy and reduce overfitting bias [67–70] or combining of probability estimates from different methods [71–73]. Detailed algorithm descriptions and specific settings are described in Additional file 4. (4) Classifier training is followed by classifier performance evaluation, comparison, and selection. Cross-validation is a technique to assess how accurately a predictive model will perform on an independent data set and whether the model recognizes a pattern that is generalized enough to apply to unseen data [74, 75]. (5) Based on performance on the training set, we selected the best classifiers to build models and make predictions for the genes that were not part of the training sets.
Figure 1.
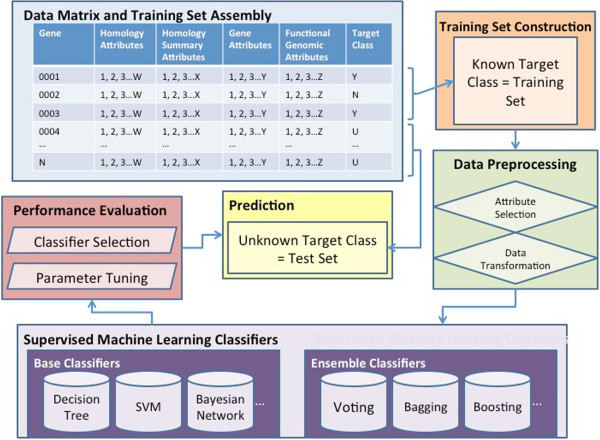
Flow chart of the procedures in performing supervised machine learning tasks of host-microbe interaction factor prediction.
Data preprocessing
Attribute extraction, or data transformation, was used to improve the representation of the data sets. Data transformation techniques create extracted attributes from the original attributes, in order to normalize so different attributes are on the same approximate scale, transform all numeric attributes in the dataset to have zero mean and unit variance [76], perform linear mapping of the data to a lower dimensional space in such a way that the variance of the data is maximized using principal components analysis (PCA) [77], or combine attributes where the aggregate feature is more useful than keeping them separate. Since many attributes used in our analysis are continuous data, we also employed data discretization techniques that convert continuous features to discretized or nominal ones to accommodate both data types in the same analysis [78, 79]. Another important component in data preprocessing is attribution selection, which is removal of uninformative data since excessive dimensionality can reduce the effectiveness of learning tasks. It includes two steps: an initial clean-up step where the attributes of each type (as listed in Table 3) are tested individually in order to remove the ones with insignificant contribution to classification, which is especially useful for the data types with highest dimensionality. The second step is to evaluate the importance of an attribute passed on from the initial step, and to remove the ones with low importance measurement scores. We used random forest attribute importance measures in this step, which are based on the decrease of classifier performance when values of a variable in a bifurcating tree node are permuted randomly [80], implemented in the extended version of weka 3.5.1 [81, 82] (More details in Additional file 4). Furthermore, we performed data decay analysis to define compact attribute sets that maintain informativeness. This involved ranking all attributes based on importance measures from 100 runs using random forest classifiers, gradually decreasing the number of attributes by window size 10 based on their rank, recording the performance of all decayed data sets, and defining the essential set as the point where the overall performance score began to drop.
Evaluating the performance of different learning schemes
We used 10-fold cross-validation analyses to evaluate the learned classifiers on random subsets of data withheld from the training sets and averaged across multiple replicates. We recorded a variety of performance statistics for each run including accuracy, true positive rate (TPR or recall), and precision for the positive target class. We also used ROC (Receiver Operating Characteristic) curves, PR (Precision-Recall) curves, and the AUC (area under the curve) to evaluate the performance of each constructed classifier. In this particular learning task, we value precision rate as the most important statistic. Precision specifies the proportion of relevant objects being retrieved among all retrieved ones, a factor that is particularly important to define a candidate list with high confidence for downstream experimental validation. On the other hand, recall is the proportion of relevant objects that are retrieved. When a situation does not allow both precision and recall rates to be high at the same time, we give the precision rate precedence over the recall rate. ROC and PR curves are widely regarded as more appropriate than any individual statistic in evaluating classification algorithms [83]. A ROC curve is a graphical technique that plots the correlation of correctly classified data points with falsely classified ones, in order to characterize the tradeoff between true positive and false positive rates. PR curves depict the correlation of how precisely the algorithm identifies the data points in their class with how many “true” data points are retrieved and provide a good complement to ROC curves which can be overly optimistic [84].
Results and discussion
Many computational methods have been used to identify gene functions involved in host-microbe interaction, and most of them rely primarily on homology-based searches using known interaction determinants as bait to identify new candidate genes. These methods are often successful, but neglect many genes of unknown function and strain/clade-specific genes, which could play an important role in host-microbe interactions and bacterial niche adaptations [85, 86]. Overcoming these limitations with the current methodologies is critical to expanding our understanding of the complex molecular mechanisms underlying host-microbe interactions. The value of machine learning not only lies in deriving knowledge based on pattern recognition, but also providing an automated alternative to having a human expert repeatedly sift through large and complex datasets.
Some attributes are more useful than others to predict host-microbe interaction
Our results indicate that although all categories outperform randomized data, different major categories of attributes contribute differently to learning scheme performance as shown in the ROC curve for Dd3937 in Figure 2 and Additional file 4. Gene features and summarized homology information were most useful in classifying host-microbe interaction factors, while data related to computed structural or physiochemical characteristics, and gene functionality data, including gene expression, binding site predictions, and proteomics profiles, performed less well. Further analysis of the gene functionality attributes using random forest importance measurement scores indicates that the data corresponding to many of these attributes are relatively noisy and do not correlate well with the target class, though a subset, such as KdgR binding site predictions, do correlate well. Some of our attributes are themselves the results of other pattern recognition methods. For example, phylogenetic profiles, one of the most useful attributes, are based on an unsupervised learning approach, where no prior information is given to the learner regarding the output or class label. Our analysis is a good example of how supervised and unsupervised learning algorithms can be combined to make better inference.
Figure 2.
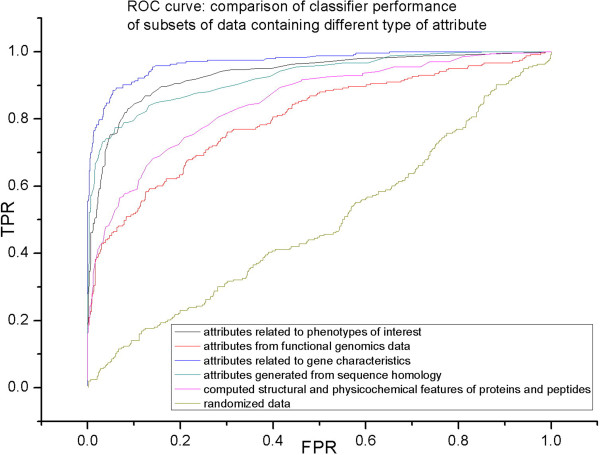
ROC curve to compare classifier performance of different data sets containing various types of attributes as listed in Table 3 . (TPR: True Positive Rate; FPR: False Positive Rate).
We conducted data decay analysis to obtain additional insight into the most informative attributes. The size of the final compact attribute sets is 45 and 31 for Dd3937 and WPP14, respectively, as shown in Additional file 5b. The majorities of attributes in the compact sets are summaries of homology data according to phenotypes or computed gene features, and many of the retained attributes are shared between both strains despite the independent machine learning analyses. The common list includes five gene feature attributes including phylogenetic profile, gene cluster from operon prediction, gene neighbor, cellular localization, and amino acid composition. The most informative homology attributes include percentage, average value, or sum value of a given gene having homologous hits with organisms having different pathogenicity and habitat phenotypes. In addition, the homology data summarized by phenotypes related to growth condition and taxonomic groups is also informative including having homologs in anaerobic organisms, facultative anaerobes and their ratio, and having homologs in other gamma-proteobacteria, and enterobacteria, all of which appear in the selected attribute list for both strains.
Overall, these results suggest that attributes which are relatively simple to assemble from standard BLASTP searches, coupled with a handful of additional easily computed features are sufficient to achieve good performance in this machine learning task. This is particularly encouraging for development of a generalized approach for future applications to predict host-interaction factors across a broad range of bacterial phytopathogens.
Preprocessing and partitioning can improve performance
The PR curve shown in Figure 3 illustrates the improvement in performance that we achieved through attribute selection, data discretization, and data partitioning according to GO terms. 1) Attribute selection generates more cost-effective learning schemes by reducing data set dimensionality by removing uninformative attributes, in order to improve the overall performance of the learning schemes [87, 88]. After benchmarking different attribute selection techniques such as filter (e.g., subset attribute selection [89]) and wrapper methods (e.g., Naive Bayes with forward selection algorithm) as well as attribute ranking (e.g., SVM Attribute evaluator [90] and information gain), we chose random forest importance measures in this study because it is robust to noise, relatively computationally efficient, and is suitable for data sets with high dimensionality hence reducing the risk of overfitting [81]. After feature selection, our data sets contain 105 and 122 attributes, which are 17.3% and 21% of the original data size of Dd3937 and WPP14, respectively. 2) By comparing different data transformation techniques (Additional file 6a), supervised data discretization was shown to be substantially better for improving classifier performance than other methods. Supervised discretization techniques are suitable for high dimensional data as they significantly reduce the number of possible values of continuous features, and also discretize an attribute according to its class label [91, 92]. 3) We also saw an improvement when we coupled the preprocessing with partitioning the learning task into several separate tasks based on assigning genes in the training set according to GO terms. This result suggests that some subsystems, such as localization in host and secretion of host interaction proteins, are substantially more informative and suitable for our learning task (Additional file 6b). Other subsystems, such interaction with host defense systems and transcriptional regulation of host interaction genes, performed less convincingly, possibly because these subsystems are involved in host-microbe interaction but also include other genes not implicated in this biological process. For example, the global DNA-binding regulator hns gene also modulates flagella genes and lipopolysaccharide production that are important for initial bacterial attachment to host cell surfaces [93, 94]. These data points were removed from subsequent analysis. Our result suggests that our learning schemes hold predictive power for the subsystems involved with complex biological processes during host-microbe interaction, but do not accurately distinguish the patterns for some subsystems that are closely intertwined with other cellular processes.
Figure 3.
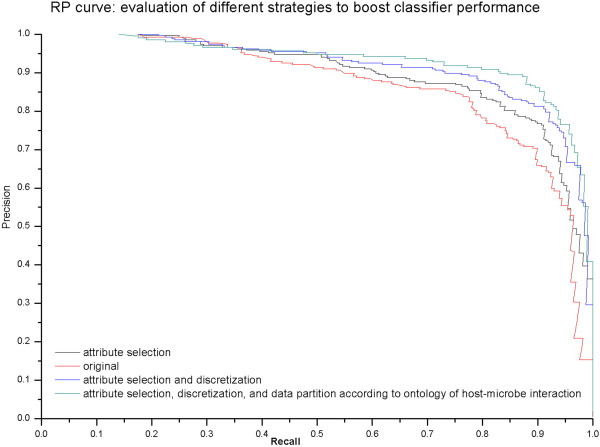
PR (Precision-Recall) curve to evaluate strategies for boosting classifier performance.
The performance of machine learning schemes is statistically encouraging
In this study, we employed several strategies to mitigate the potential overfitting issues that are important for effective supervised machine learning tasks. Simply put, overfitting occurs when the predictive model learns a pattern that is overly specific to the training data but not generalized enough to perform equally well on unseen data [95]. We strived to maximize inclusion of relevant attributes to mitigate the problem of overfitting to increase model replicability [96], while excluding unimportant attributes that may be detrimental to pattern recognition schemes performance. Additionally, we hold out pristine examples for testing, integrated result over multiple classifiers retaining only predictions that show a high degree of consensus, chose classifier parameters based on the cross-validation tests, and used a simpler predictor where possible, to address the overfitting issue.
Overall the results of using supervised machine learning schemes on host-microbe interaction factor prediction are statistically encouraging, achieving over 84% precision rate and 75% recall rate from 10-fold cross validation evaluation. We used a nested 10-fold cross-validation that includes an “outer” 10-round cross-validation, which averages data variability from 10 different data partitions. Each data partition sets aside 10% of the data set (outer test set) to measure the performance of the predictive model generated from the other 90% of the data (outer training set). Each outer training set is used to choose the value of tuning parameters for this model in order to achieve optimal performance. The parameter-tuning step is especially important for SVM and K-nearest neighbor learning schemes which are particularly sensitive to parameter settings (Stone 1977). Performance statistics for different classifiers are listed in Table 4, excluding classifiers with precision rates < 80%. ROC curves of selected classifiers for WPP14 are shown in Figure 4.
Table 4.
Statistics for positive class object prediction and parameters used in selected learning schemes for both Dickeya dadantii 3937 and Pectobacterium carotovorum WPP14
| Classifiers | Precision | TPR/recall/sensitivity | specificity/TNR | accuracy | F-measure | AUC |
|---|---|---|---|---|---|---|
| Dd3937 | ||||||
| Random Forest | 0.93 | 0.81 | 0.98 | 0.94 | 0.87 | 0.97 |
| Bayesian Network | 0.91 | 0.85 | 0.97 | 0.94 | 0.88 | 0.97 |
| SMO using RBF kernels | 0.93 | 0.85 | 0.98 | 0.95 | 0.89 | 0.92 |
| SMO using polynormial kernels | 0.91 | 0.87 | 0.97 | 0.95 | 0.95 | 0.89 |
| Adaptive Boosting (Naïve Bayes)* | 0.84 | 0.89 | 0.95 | 0.93 | 0.87 | 0.96 |
| Adaptive Boosting (Decision Tree)* | 0.96 | 0.91 | 0.99 | 0.97 | 0.93 | 0.98 |
| Adaptive Boosting (IBK)* | 0.96 | 0.84 | 0.99 | 0.95 | 0.90 | 0.99 |
| Adaptive Boosting (Decision Stump)* | 0.92 | 0.87 | 0.98 | 0.95 | 0.89 | 0.97 |
| Multi-Boosting (Decision Tree)* | 0.97 | 0.91 | 0.99 | 0.97 | 0.94 | 0.98 |
| Multi-Boosting (IBK)* | 0.91 | 0.77 | 0.98 | 0.93 | 0.84 | 0.93 |
| Multi-Boosting (Naïve Bayes)* | 0.90 | 0.91 | 0.97 | 0.95 | 0.91 | 0.96 |
| Logit-Boosting (Decision Stump)* | 0.91 | 0.90 | 0.97 | 0.96 | 0.91 | 0.98 |
| WPP14 | ||||||
| Random Forest | 0.89 | 0.81 | 0.97 | 0.93 | 0.85 | 0.97 |
| Bayesian Network | 0.90 | 0.83 | 0.97 | 0.94 | 0.87 | 0.97 |
| SMO using RBF kernels | 0.94 | 0.84 | 0.98 | 0.95 | 0.89 | 0.91 |
| SMO using polynormial kernels | 0.93 | 0.86 | 0.98 | 0.95 | 0.95 | 0.89 |
| Adaptive Boosting (Naïve Bayes)* | 0.89 | 0.89 | 0.97 | 0.95 | 0.89 | 0.96 |
| Adaptive Boosting (Decision Tree)* | 0.95 | 0.86 | 0.99 | 0.96 | 0.90 | 0.98 |
| Adaptive Boosting (IBK)* | 0.87 | 0.83 | 0.96 | 0.93 | 0.85 | 0.92 |
| Logit-Boosting (Decision Stump)* | 0.90 | 0.85 | 0.97 | 0.94 | 0.88 | 0.97 |
| Multi-Boosting (Decision Tree)* | 0.94 | 0.86 | 0.98 | 0.96 | 0.90 | 0.98 |
| Multi-Boosting (Decision Stump)* | 0.91 | 0.75 | 0.98 | 0.93 | 0.82 | 0.97 |
| Multi-Boosting (Naïve Bayes)* | 0.90 | 0.89 | 0.97 | 0.95 | 0.89 | 0.96 |
| Logit-Boosting (Decision Stump)* | 0.90 | 0.87 | 0.97 | 0.95 | 0.89 | 0.97 |
*: denote ensemble classifiers, with base learner being shown within parenthesis.
Abbr: SMO: Support Vector Machine using Sequential Minimal Optimization; IBK: instance based learner with K-nearest neighbor classifier; RBF: Radial Basis Function kernels.
Figure 4.
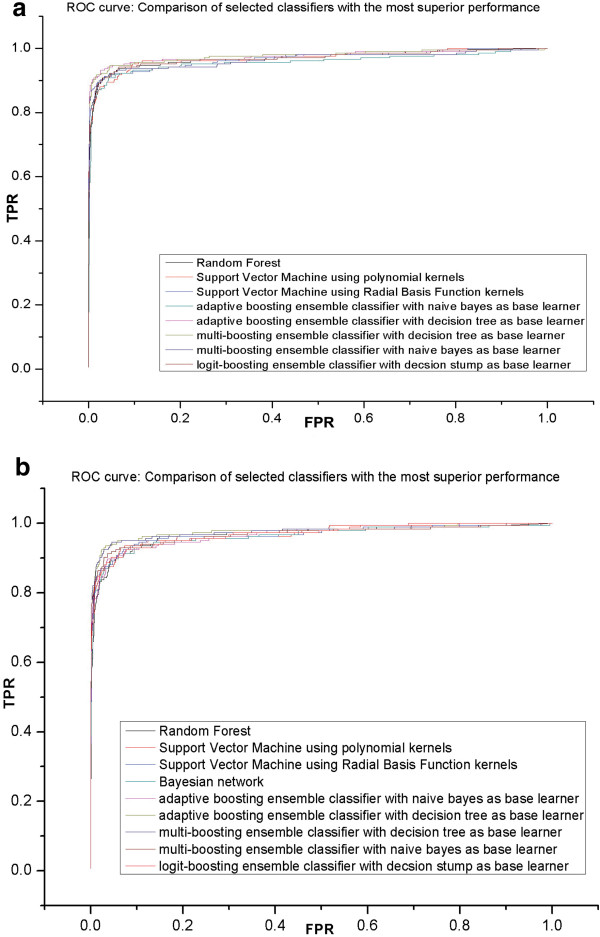
Comparison of the selected learning schemes. (a) ROC curve for Dickeya dadantii 3937, (b) ROC curve for Pectobacterium carotovorum WPP14. (TPR: True Positive Rate; FPR: False Positive Rate).
The comparison of base classifier performances indicates SVM and random forest outperforms other base classifiers (data not shown), and ensemble classifiers generally perform better than base classifiers, especially the boosting algorithms using decision trees as the base learner. The ensemble classifiers integrate results over multiple classifiers in order to average out the “classifier effect”. For example, some classifiers such as Naïve Bayes can be overly optimistic with a lower precision rate [97], and adaptive boosting ensemble classifiers with Naïve Bayes as the base learner can optimize precision and total accuracy rate through incrementally iterative learning processes [98]. The performance curves of selected classifiers are shown in Figure 4a and 4b for Dd3937 and WPP14 respectively. The best performing classifier for Dd3937 is the adaptive boosting ensemble classifier [70] with decision trees as the base learner, which achieved a precision rate above 97% with over 87% recall rate. The best performing classifier for WPP14 is the multi-boosting ensemble classifier [69] with decision trees as the base learner, which reached a precision above 94% with over 82% recall rate. Using the constructed predictive models from selected classifiers, we are able to make predictions for data points with previously unknown relation to host-microbe interactions.
A significantly extended list of host-microbe interaction factors is revealed
Application of different learned classifiers to the target genomes as a whole allows us to generate a conservative set of predictions for downstream experimentation. We pay the most attention to precision to ensure the retrieved data points are most relevant to host-microbe interaction to facilitate subsequent experimental validation. In order to call a gene a “predicted host-interaction factor”, we required strict consensus across the different classifiers with an average precision score in excess of thresholds defined by the ROC curves (92% and 89% for Dd3937 and WPP14, respectively). The selected classifiers generally agree with each other, and about two thirds of all unknown genes are unanimously predicted by all classifiers to be either host-microbe interaction factors or genes involved in core biological processes. Using these criteria, a total of 1726 genes (57.7% of Dd3937 genes) in Dd3937 and 2180 genes (67.2% of WPP14 genes) in WPP14 are predicted not to involved in host-microbe interactions. There are 211 genes (7.1% of Dd3937 genes) in Dd3937 and 216 genes (6.7% of WPP14 genes) in WPP14 classified as putative interaction factors. The remaining 1052 genes (35.1% of Dd3937 genes) and 850 genes (26.2% of WPP14 genes) are left as unclassified. The top 50 predicted host-microbe interaction factors for Dickeya dadantii 3937 and Pectobacterium carotovorum WPP14 are listed in Tables 5, 6 and 7, and the entire list of predicted host-microbe interaction factors for both strains are in Additional file 7a and 7b. These lists partially overlap, with 56 orthologs identified as interaction factors in both organisms. Given the phylogenetic relationship between these two phytopathogens and the similarity of their pathogenic phenotypes, we did expect this result; however, the learning tasks were executed independently and agreement across organisms was not a given.
Table 5.
Top 50 predicted host-microbe interaction factors from Dickeya dadantii 3937
| FeatureID | Prob | Name | Annotation |
|---|---|---|---|
| ABF-0018715 | 0.922 | virB8 | Inner membrane protein forms channel for type IV secretion of T-DNA complex (VirB8) |
| ABF-0020188 | 0.922 | Predicted cell-wall-anchored protein SasA (LPXTG motif) this is up-regulated by hrpY; we have a mutation in this gene. | |
| ABF-0019950 | 0.922 | Putative multicopper oxidase | |
| ABF-0019360 | 0.922 | hypothetical protein | |
| ABF-0019151 | 0.922 | chrysobactin synthetase cbsF | |
| ABF-0019124 | 0.922 | Biopolymer transport protein ExbD/TolR | |
| ABF-0019122 | 0.922 | MotA/TolQ/ExbB proton channel family protein | |
| ABF-0019117 | 0.922 | sftP | TonB-dependent receptor |
| ABF-0019116 | 0.922 | hypothetical protein | |
| ABF-0018783 | 0.922 | putative transmembrane protein | |
| ABF-0018775 | 0.922 | Holin | |
| ABF-0018724 | 0.922 | putative ATP/GTP-binding protein remnant | |
| ABF-0018722 | 0.922 | virB2 | Major pilus subunit of type IV secretion complex (VirB2) |
| ABF-0047137 | 0.922 | hypothetical protein | |
| ABF-0018717 | 0.922 | virB6 | Integral inner membrane protein of type IV secretion complex (VirB6) |
| ABF-0018716 | 0.922 | virB7 | TriF protein |
| ABF-0018713 | 0.922 | virB10 | Inner membrane protein forms channel for type IV secretion of T-DNA complex (VirB10) |
| ABF-0018712 | 0.922 | virB11 | ATPase provides energy for both assembly of type IV secretion complex and secretion of T-DNA complex (VirB11) |
| ABF-0018601 | 0.922 | hypothetical protein | |
| ABF-0018207 | 0.922 | hypothetical protein | |
| ABF-0018199 | 0.922 | ganC | putative truncated PTS system EIIBC component |
| ABF-0017777 | 0.922 | hecA2 | Putative member of ShlA/HecA/FhaA exoprotein family |
| ABF-0015606 | 0.922 | ABC transporter permease protein | |
| ABF-0015604 | 0.922 | Amino acid ABC transporter, periplasmic amino acid-binding protein | |
| ABF-0015543 | 0.922 | hypothetical protein 15544 is up-regulated by hrpY. Is 15543 in the same operon? We have a mutation in 15544 | |
| ABF-0015387 | 0.922 | nipE | necrosis-inducing protein |
| ABF-0014838 | 0.922 | putative exported protein | |
| ABF-0014623 | 0.922 | Type IV pilus biogenesis protein PilN | |
| ABF-0018720 | 0.922 | virB4 | ATPase provides energy for both assembly of type IV secretion complex and secretion of T-DNA complex (VirB4) |
| ABF-0018714 | 0.922 | virB9 | VirB9 |
| ABF-0047204 | 0.922 | hypothetical protein | |
| ABF-0015913 | 0.921 | ppdA | Prepilin peptidase dependent protein A |
| ABF-0017252 | 0.921 | Conjugative transfer protein TrbG | |
| ABF-0018195 | 0.921 | ganG | galactan ABC transport system, permease component |
| ABF-0016407 | 0.921 | hypothetical protein | |
| ABF-0018205 | 0.921 | Pirin | |
| ABF-0019418 | 0.921 | Cellulose 1, 4-beta-cellobiosidase precursor | |
| ABF-0019468 | 0.921 | hypothetical protein | |
| ABF-0019566 | 0.921 | hypothetical protein | |
| ABF-0016680 | 0.921 | Iron utilization protein | |
| ABF-0020727 | 0.921 | sttG | General secretion pathway protein G |
| ABF-0019115 | 0.921 | hypothetical protein | |
| ABF-0015381 | 0.921 | avrM | Avirulence protein |
| ABF-0018723 | 0.921 | virB1 | VirB1 |
| ABF-0015598 | 0.921 | hypothetical protein | |
| ABF-0015609 | 0.921 | Branched-chain amino acid aminotransferase | |
| ABF-0018193 | 0.921 | ganF | galactan ABC transport system, permease component |
| ABF-0017097 | 0.921 | Methyl-accepting chemotaxis protein | |
| ABF-0020433 | 0.921 | hypothetical protein | |
| ABF-0019153 | 0.921 | cbsH | chrysobactin oligopeptidase CbsH |
Table 6.
Top 50 predicted host-microbe interaction factors from Pectobacterium carotovorum WPP14
| ID | Prob | Name | Product |
|---|---|---|---|
| ADT-0001591 | 0.912 | hypothetical protein | |
| ADT-0003750 | 0.912 | putative exported protein | |
| ADT-0000805 | 0.912 | dltB | peptidoglycan biosynthesis protein |
| ADT-0003928 | 0.911 | pectate lyase | |
| ADT-0003247 | 0.911 | methyl-accepting chemotaxis protein | |
| ADT-0000806 | 0.911 | dltD | poly(glycerophosphate chain) D-alanine transfer protein |
| ADT-0003745 | 0.911 | ABC transporter ATP binding protein | |
| ADT-0002063 | 0.911 | hypothetical protein | |
| ADT-0000400 | 0.911 | hasE | HlyD family secretion protein |
| ADT-0003089 | 0.911 | N-terminal fragment of a diguanylate cyclase (pseudogene) | |
| ADT-0003418 | 0.910 | methyl-accepting chemotaxis protein | |
| ADT-0000941 | 0.910 | methyl-accepting chemotaxis protein | |
| ADT-0006368 | 0.910 | hypothetical protein | |
| ADT-0005582 | 0.910 | hypothetical protein | |
| ADT-0000983 | 0.910 | methyl-accepting chemotaxis protein | |
| ADT-0001252 | 0.910 | ABC transporter permease protein | |
| ADT-0003245 | 0.910 | methyl-accepting chemotaxis protein | |
| ADT-0000027 | 0.910 | methyl-accepting chemotaxis protein | |
| ADT-0003542 | 0.909 | putative type IV pilus protein | |
| ADT-0001195 | 0.909 | LysR-family transcriptional regulator | |
| ADT-0004315 | 0.909 | astB | sulfate ester ABC transporter permease protein |
| ADT-0003152 | 0.909 | methyl-accepting chemotaxis protein | |
| ADT-0002357 | 0.908 | methyl-accepting chemotaxis protein | |
| ADT-0000543 | 0.908 | ABC transporter, substrate binding protein | |
| ADT-0001392 | 0.908 | putative exported protein | |
| ADT-0002087 | 0.908 | putative signaling protein | |
| ADT-0001868 | 0.908 | LysR-family transcriptional regulator | |
| ADT-0000803 | 0.908 | acyl carrier protein | |
| ADT-0000571 | 0.908 | putative cellulase | |
| ADT-0000535 | 0.908 | putative lipoprotein | |
| ADT-0001404 | 0.907 | hypothetical protein | |
| ADT-0004320 | 0.907 | sftP | TonB-dependent receptor |
| ADT-0001744 | 0.907 | putative exported protein | |
| ADT-0003391 | 0.907 | putative membrane protein | |
| ADT-0003535 | 0.907 | hypothetical protein | |
| ADT-0003563 | 0.907 | LysR-family transcriptional regulator | |
| ADT-0001980 | 0.907 | hypothetical protein | |
| ADT-0000804 | 0.907 | dltA | putative D-alanine--poly(phosphoribitol) ligase subunit 1 |
| ADT-0001616 | 0.906 | putative transport system membrane protein | |
| ADT-0001394 | 0.906 | hypothetical protein | |
| ADT-0001320 | 0.906 | methyl-accepting chemotaxis protein | |
| ADT-0001567 | 0.906 | putative exported protein | |
| ADT-0005614 | 0.906 | hypothetical protein | |
| ADT-0001436 | 0.906 | putative component of polysulfide reductase | |
| ADT-0004253 | 0.906 | occQ | octopine transport system permease protein |
| ADT-0001493 | 0.905 | hypothetical protein | |
| ADT-0001492 | 0.905 | putative lipoprotein | |
| ADT-0002704 | 0.905 | putative lipoprotein | |
| ADT-0002584 | 0.905 | ABC transporter, membrane spanning protein |
Table 7.
List of 56 genes predicted host-microbe interaction factors in both Dickeya dadantii 3937 and Pectobacterium carotovorum WPP14
| Dd3937 | WPP14 | ||||
|---|---|---|---|---|---|
| FeatureID | Name | Product | FeatureID | Name | Product |
| ABF-0019117 | sftP | TonB-dependent receptor | ADT-0004320 | sftP | TonB-dependent receptor |
| ABF-0019116 | hypothetical protein | ADT-0004318 | unknown | ||
| ABF-0018207 | hypothetical protein | ADT-0001980 | hypothetical protein | ||
| ABF-0015604 | Amino acid ABC transporter | ADT-0000748 | putative extracellular solute-binding protein | ||
| ABF-0015387 | nipE | necrosis-inducing protein | ADT-0000781 | putative exported protein | |
| ABF-0014838 | putative exported protein | ADT-0002655 | putative exported protein | ||
| ABF-0019124 | Biopolymer transport protein ExbD/TolR | ADT-0002263 | putative biopolymer transport protein | ||
| ABF-0019115 | hypothetical protein | ADT-0002265 | hypothetical protein | ||
| ABF-0017097 | Methyl-accepting chemotaxis protein | ADT-0003418 | methyl-accepting chemotaxis protein | ||
| ABF-0019566 | hypothetical protein | ADT-0001832 | putative exported protein | ||
| ABF-0016407 | hypothetical protein | ADT-0001404 | hypothetical protein | ||
| ABF-0015906 | 6-phosphogluconolactonase | ADT-0003106 | putative exported protein | ||
| ABF-0019118 | atsR | Alkanesulfonates-binding protein | ADT-0001174 | atsR | putative sulfate ester binding protein |
| ABF-0019125 | astB | Alkanesulfonates transport system permease protein | ADT-0004315 | astB | sulfate ester ABC transporter permease protein |
| ABF-0017125 | inh | Alkaline proteinase inhibitor precursor | ADT-0001911 | inh | protease inhibitor |
| ABF-0019002 | hypothetical protein | ADT-0001744 | putative exported protein | ||
| ABF-0019205 | ABC transporter | ADT-0002584 | ABC transporter | ||
| ABF-0014642 | hypothetical protein | ADT-0000571 | putative cellulase | ||
| ABF-0019092 | Transcriptional activator protein lysR | ADT-0001195 | LysR-family transcriptional regulator | ||
| ABF-0016585 | Methyl-accepting chemotaxis protein | ADT-0001320 | methyl-accepting chemotaxis protein | ||
| ABF-0019383 | D-alanyl transfer protein DltB | ADT-0000805 | dltB | peptidoglycan biosynthesis protein | |
| ABF-0019855 | Methyl-accepting chemotaxis protein II (aspartate chemoreceptor protein) | ADT-0001887 | putative methyl-accepting chemotaxis protein | ||
| ABF-0015168 | chmX | Methyl-accepting chemotaxis protein III (ribose and galactose chemoreceptor protein) | ADT-0003152 | methyl-accepting chemotaxis protein | |
| ABF-0018737 | DNA-binding protein | ADT-0003335 | putative regulatory protein | ||
| ABF-0019933 | hypothetical protein | ADT-0003354 | hypothetical protein | ||
| ABF-0014645 | Paraquat-inducible protein A | ADT-0002701 | putative membrane protein | ||
| ABF-0017674 | Methyl-accepting chemotaxis protein | ADT-0003245 | methyl-accepting chemotaxis protein | ||
| ABF-0020681 | hypothetical protein | ADT-0002418 | RES domain-containing protein | ||
| ABF-0015907 | TonB-dependent hemin | ADT-0002398 | TonB-dependent hemin | ||
| ABF-0018934 | 4-aminobutyrate aminotransferase | ADT-0002845 | putative class-III aminotransferase | ||
| ABF-0014824 | Methyl-accepting chemotaxis protein II (aspartate chemoreceptor protein) | ADT-0002104 | methyl-accepting chemotaxis protein | ||
| ABF-0018178 | Iron(III) dicitrate-binding protein | ADT-0002009 | putative periplasmic substrate-binding transport protein | ||
| ABF-0019391 | Pectate lyase | ADT-0003928 | pectate lyase | ||
| ABF-0015887 | hypothetical protein | ADT-0002063 | hypothetical protein | ||
| ABF-0016115 | Methyl-accepting chemotaxis protein | ADT-0000027 | methyl-accepting chemotaxis protein | ||
| ABF-0019101 | atsB | Alkanesulfonates transport system permease protein | ADT-0003749 | atsB | putative sulfate ester transporter |
| ABF-0019214 | Glucosamine kinase GpsK | ADT-0003604 | hypothetical protein | ||
| ABF-0016752 | Ferric siderophore transport system | ADT-0003559 | TonB-like protein | ||
| ABF-0016218 | Fosmidomycin resistance protein | ADT-0001196 | MFS efflux transporter | ||
| ABF-0046571 | Putative DNA-binding transcriptional regulatory family of the TetR family | ADT-0003719 | TetR-family transcriptional regulator | ||
| ABF-0014644 | Probable lipoprotein | ADT-0000406 | putative lipoprotein | ||
| ABF-0015918 | ppdC | Putative prepilin peptidase dependent protein | ADT-0002557 | ppdC | putative prepilin peptidase dependent protein c precursor |
| ABF-0018572 | ABC transporter | ADT-0001164 | putative iron (III) ABC transporter | ||
| ABF-0017527 | Lysophospholipase | ADT-0001494 | putative lipoprotein | ||
| ABF-0047106 | putative lipoprotein | ADT-0002704 | putative lipoprotein | ||
| ABF-0016810 | Drug resistance transporter | ADT-0001435 | putative membrane protein | ||
| ABF-0019088 | Dihydrodipicolinate synthase | ADT-0002292 | putative dihydrodipicolinate synthetase | ||
| ABF-0014868 | Ferrichrome-iron receptor | ADT-0004187 | TonB dependent receptor | ||
| ABF-0017095 | hypothetical protein | ADT-0000555 | putative exported protein | ||
| ABF-0018540 | Oxidoreductase | ADT-0000962 | probable short-chain dehydrogenase | ||
| ABF-0014948 | hypothetical protein | ADT-0002252 | putative exported protein | ||
| ABF-0020431 | Methyl-accepting chemotaxis protein I (serine chemoreceptor protein) | ADT-0000661 | methyl-accepting chemotaxis protein | ||
| ABF-0019851 | Methyl-accepting chemotaxis protein III (ribose and galactose chemoreceptor protein) | ADT-0001602 | methyl-accepting chemotaxis protein | ||
| ABF-0020368 | hypothetical protein | ADT-0002020 | putative exported protein | ||
| ABF-0016058 | Poly(glycerophosphate chain) D-alanine transfer protein DltD | ADT-0000806 | dltD | poly(glycerophosphate chain) D-alanine transfer protein | |
| ABF-0019212 | N-Acetyl-D-glucosamine ABC transport system | ADT-0002138 | extracellular solute-binding protein | ||
One striking observation is the large number of genes of unknown function from the predicted list of host-microbe interaction factors. Among all predicted interaction factors, over 30% of them currently have no or very little annotated information, and many of them are ORFans [99–102] without any homolog to 297 bacterial genomes inspected. Among the 56 genes found in interaction factor lists for both strains, roughly one third have no clear functional assignment. 13 hypothetical proteins in both strain lists are “unknown unknowns”, a term used to indicate there is no information at all available for that gene [103]. The other 9 of them are so-called “known unknown” proteins, meaning they only have information in general biological terms, such as putative exported protein, putative transmembrane protein, and probable lipoprotein. This result suggests a substantial portion of the genome cannot be screened using conventional similarity-based searches, and our more sophisticated pattern recognition approach was able to identify candidate interaction factors that would be missed using homology-based methods.
The remaining two-thirds of predicted interaction factors are annotated with various (at least partially) informative functions. The lists include genes with previously characterized roles in host-microbe interaction in these or very closely related organisms that were overlooked by the human experts who assembled the training set. For example, Dd3937 secretes plant cell wall degrading enzymes through a type II secretion system for plant host cell wall degradation in turn using the released nutrients as carbon sources for growth [104], and a group of genes related to this process are predicted with high confidence including predicted proteins previously reported to play an accessory role in utilization of galactose, a major component of pectin, in Dd3937 [105]. A knockout mutant of a necrosis-inducing protein included in the prediction list has been experimentally shown to have reduced virulence in a Pectobacterium strain [106]. Further, our lists also include genes with homologs implicated in host-microbe interaction in more distantly related organisms. There are 9 genes that were shown with direct or indirect evidence to be involved with metal homeostasis in different bacteria, including exbB, exbD, and tonB genes which are essential for ferric iron uptake in Escherichia coli [107], Xanthomonas campestris [108], Pseudomonas putida [109], and Photorhabdus temperate [110], as well as ferric siderophore transporter and ferrichrome-iron receptor genes, and a cytochrome b gene (cybC) that is positively regulated by Fur and others that encode iron-dependent proteins in Salmonella enterica [111]. The predicted lists also include orthologs of the dltB gene implicated in cell surface adhesion in Staphylococcus aureus [112], the srfA gene that encodes secreted effect or protein in Pantoea ananatis [113], a LysR-family regulator associated with quorum sensing in Pseudomonas aeruginosa [114], the cell-wall-anchored protein SasA suggested to play a role in adhesion to host in Staphylococcus aureus [115], and the ppdC gene involved in extracellular secretion machinery in Pseudomonas aeruginosa [116]. Additionally, we also observed many predicted interaction factors that are physically clustered together on the chromosome. For instance, our prediction list includes an 11-gene cluster for a general secretion system, and a 12-gene cluster that may be associated with type IV secretion complex formation. This result agrees with previous studies that many virulence properties of microbes are a collaborative effort of multiple genes and their physical clustering (and/or co-expression as operons) is under functional and evolutionary constraints [117, 118].
Interestingly, our predicted host-microbe interaction factor lists include at least 17 chemotaxis or motility associated proteins for each organism, including putative methyl-accepting chemotaxis receptors and one type IV pilus biogenesis protein involved in bacterial motility and adhesion to a solid surface [119]. Previous studies have indicated the chemotactic responses with specific cellular localization are critical for biofilm formation and interaction with hosts in a variety of pathogenic bacteria [120–124]. The hypergeometric distribution was used to assess the statistical significance of enrichment of a given functional group in the target list relative to the genome as a whole [125, 126]. Interpro family annotations were uniformly assigned across both genomes and we conducted enrichment tests based on assignment to the Interpro chemotaxis family. The highly significant p-values for both Dd3937 (p = 3.42e-11) and WPP14 (p = 3.36e-12) strongly suggest methyl-accepting chemotaxis genes are highly enriched among the predicted host-microbe interaction factors.
Our learning strategy was explicitly designed to separate genes likely to be involved in host-microbe interaction from genes involved with core biological processes. The evidence above strongly suggests that the method is effective at recognizing host-microbe interaction factors, but it is important to keep in mind that it does not directly address the possibility that some genes associated with core biological processes may also contribute to interaction with hosts. Direct experimental testing of a relatively large number of genes from both the positive and negative classes is underway and will illuminate the power of this machine learning approach to guide discovery.
Conclusion
Although bacterial pathogen genome sequencing has become routine, the large number of unknown genes has been, and still is, a major obstacle to understanding the mechanisms of infection and adaptive evolution of microbial pathogens overall. We successfully employed supervised machine learning to identify candidate host interaction factors and we are able to predict host-microbe interaction factors from among genes of entirely unknown function, for two important agricultural pathogens Dickeya dadantii Dd3937 and Pectobacterium carotovorum WPP14, achieving promising results with a precision rate over 90% with a recall rate over 80%. The predictions made in this study include many genes that have not previously been linked to host microbe interaction, a result not achievable with homology-based search strategies, providing an expanded list of appealing targets for further experimental validation. Our results indicate the learning schemes used in this study can recognize the complex patterns of host-microbe interaction factors and yield biologically meaningful results. Because of the powerful and intelligent models supervised machine learning schemes are capable of constructing, their future application to studying additional complex biological processes is likely to be a productive research approach.
Availability of supporting data
The data sets supporting the results of this article are available in the LabArchives repository, [https://mynotebook.labarchives.com/share/plantpath/MjAuOHwyNTc2OC8xNi9UcmVlTm9kZS8yNjQ4MTE0NTE0fDUyLjg=].
Electronic supplementary material
Additional file 1: List of individual protein-coding genes from Dd3937 (a) and WPP14 (b) assigned host-microbe interaction GO annotations corresponding to Table 2 . (ZIP 33 KB)
Additional file 2: (a) Strain information of all gamma-proteobacteria with complete or nearly complete genomes used in this study and their associations with various phenotypes of interest (as listed in Additional file 2: Table S1). (b) List of all non gamma-proteobacteria with complete or nearly complete genomes used in this study. (c) List of attribute categories used to generate summary taxonomic and phenotypic attributes based on sequence homology, the count of genomes in each category used as BLASTP search databases, and the number of proteins in Dickeya dadantii (Dd3937) and Pectobacterium carotovorum (WPP14) with hits to target organisms in those categories. (d) List of attributes used in the category of phenotypes of interest, including taxonomic groups and lifestyle statistics. (ZIP 223 KB)
Additional file 3: Functional genomics data sets used in this study. (a) Data sets generated from microarray or proteomics studies. (b) Binding sites prediction of 32 putative transcriptional factors that may be related with host-microbe interactions. (ZIP 34 KB)
Additional file 4: Description of selected supervised machine learning schemes. (DOCX 150 KB)
Additional file 5: (a) List of selected attributes with importance measurement score and subsets of attributes defined to be used in data decay analysis for Dickeya dadantii 3937 and Pectobacterium carotovorum WPP14, (b) probability score plot used to define a compact set of attributes for both strains. (ZIP 1 MB)
Additional file 6: (a) RP curve to compare strategies of data transformation for boosting classifier performance. (b) PR curve to compare classifier performance using five data sets partitioned according to GO terms for different aspects of host-microbe interaction (refer to Table 2). (ZIP 223 KB)
Additional file 7: The list of predicted host-microbe interaction factors. (a) List of 211 genes predicted to be host-microbe interaction factors for Dickeya dadantii 3937, (b) list of 216 genes predicted to be host-microbe interaction factors for Pectobacterium carotovorum WPP14. (c) list of top 300 genes that could not be confidently classified as host-microbe interaction factors for both Dickeya dadantii 3937 and Pectobacterium carotovorum WPP14. (ZIP 17 KB)
Acknowledgement
We would like to thank Dr. Pablo Rodriquez-Palenzuela from Technical Univ. of Madrid for assisting with assignment of annotations and assembling the training set, Dr. C. David Page Jr. from UW-Madison for providing advice on machine learning analyses, and Andrew Tritt for help in setting up the transcriptional regulation factor prediction analysis. BM was supported by Morgridge Institute for Research (MIR) funds in the Computation & Informatics in Biology & Medicine (CIBM) Training Program.
Abbreviations
- RF
Random forest
- SMO
Support Vector Machine using Sequential Minimal Optimization
- poly
SMO using polynomial kernels
- rbf
SMO using Radial Basis Function (RBF) kernels
- ab
Adaptive boosting
- j48
C4.5 algorithm in decision tree
- mb
Multi-boosting
- nb
Naive bayes
- lb
Logitboost
- ds
Decision stump
- BN
Bayesian network.
Footnotes
Competing interest
The authors declare that there are no competing interests.
Authors’ contributions
BM, NTP, JDG designed the study. BM performed the analyses. AOC and NTP assigned the category of target class. BM, AOC, and NTP interpret the data. BM, AOC, JDG, and NTP wrote the manuscript. All authors read and approved the final manuscript.
Contributor Information
Bing Ma, Email: bma@som.umaryland.edu.
Amy O Charkowski, Email: amyc@plantpath.wisc.edu.
Jeremy D Glasner, Email: jglasner@wisc.edu.
Nicole T Perna, Email: ntperna@wisc.edu.
References
- 1.Hayes WS, Borodovsky M. How to interpret an anonymous bacterial genome: machine learning approach to gene identification. Genome Res. 1998;8(11):1154–1171. doi: 10.1101/gr.8.11.1154. [DOI] [PubMed] [Google Scholar]
- 2.Hamady M, Betterton MD, Knight R. Using the nucleotide substitution rate matrix to detect horizontal gene transfer. BMC Bioinform. 2006;7:476. doi: 10.1186/1471-2105-7-476. [DOI] [PMC free article] [PubMed] [Google Scholar]
- 3.Lewis DP, Jebara T, Noble WS. Support vector machine learning from heterogeneous data: an empirical analysis using protein sequence and structure. Bioinformatics. 2006;22(22):2753–2760. doi: 10.1093/bioinformatics/btl475. [DOI] [PubMed] [Google Scholar]
- 4.Matukumalli LK, Grefenstette JJ, Hyten DL, Choi IY, Cregan PB, Van Tassell CP. Application of machine learning in SNP discovery. BMC Bioinform. 2006;7:4. doi: 10.1186/1471-2105-7-4. [DOI] [PMC free article] [PubMed] [Google Scholar]
- 5.Brown MPS, Grundy WN, Lin D, Cristianini N, Sugnet CW, Furey TS, Ares M, Haussler D. Knowledge-based analysis of microarray gene expression data by using support vector machines. Proc Natl Acad Sci U S A. 2000;97(1):262–267. doi: 10.1073/pnas.97.1.262. [DOI] [PMC free article] [PubMed] [Google Scholar]
- 6.Hugouvieux-Cotte-Pattat N, Condemine G, Nasser W, Reverchon S. Regulation of pectinolysis in Erwinia chrysanthemi. Annu Rev Microbiol. 1996;50:213–257. doi: 10.1146/annurev.micro.50.1.213. [DOI] [PubMed] [Google Scholar]
- 7.Glasner JD, Marquez-Villavicencio M, Kim HS, Jahn CE, Ma B, Biehl BS, Rissman AI, Mole B, Yi X, Yang CH, Dangl JL, Grant SR, Perna NT, Charkowski AO. Niche-specificity and the variable fraction of the Pectobacterium pan-genome. Mol Plant Microbe Interact. 2008;21(12):1549–1560. doi: 10.1094/MPMI-21-12-1549. [DOI] [PubMed] [Google Scholar]
- 8.Barras F, Vangijsegem F, Chatterjee AK. Extracellular Enzymes and Pathogenesis of Soft-Rot Erwinia. Annu Rev Phytopathol. 1994;32:201–234. doi: 10.1146/annurev.py.32.090194.001221. [DOI] [Google Scholar]
- 9.Lakso JU, Starr MP. Comparative injuriousness to plants of Erwinia spp. and other enterobacteria from plants and animals. J Appl Bact. 1970;33:692–707. doi: 10.1111/j.1365-2672.1970.tb02252.x. [DOI] [PubMed] [Google Scholar]
- 10.Gardan L, Gouy C, Christen R, Samson R. Elevation of three subspecies of Pectobacterium carotovorum to species level: Pectobacterium atrosepticum sp nov., Pectobacterium betavasculorum sp nov and Pectobacterium wasabiae sp nov. Int J Syst Evol Microbiol. 2003;53:381–391. doi: 10.1099/ijs.0.02423-0. [DOI] [PubMed] [Google Scholar]
- 11.Ma B, Hibbing ME, Kim HS, Reedy RM, Yedidia I, Breuer J, Breuer J, Glasner JD, Perna NT, Kelman A, Charkowski AO. Host range and molecular Phylogenies of the soft rot enterobacterial genera Pectobacterium and dickeya. Phytopathology. 2007;97(9):1150–1163. doi: 10.1094/PHYTO-97-9-1150. [DOI] [PubMed] [Google Scholar]
- 12.Ried JL, Collmer A. Comparison of pectic enzymes produced by Erwinia chrysanthemi, Erwinia carotovora subsp. carotovora, and Erwinia carotovora subsp. atroseptica. Appl Environ Microbiol. 1986;52(2):305–310. doi: 10.1128/aem.52.2.305-310.1986. [DOI] [PMC free article] [PubMed] [Google Scholar]
- 13.Yang C-H, Gavilanes-Ruiz M, Okinaka Y, Vedel R, Berthuy I, Boccara M, Chen JWT, Perna NT, Keen NT. hrp genes of Erwinia chrysanthemi 3937 are important virulence factors. Mol Plant Microbe Interact. 2002;15(5):472–480. doi: 10.1094/MPMI.2002.15.5.472. [DOI] [PubMed] [Google Scholar]
- 14.Gloux K, Touze T, Pagot Y, Jouan B, Blanco C. Mutations of ousA alter the virulence of Erwinia chrysanthemi. Mol Plant Microbe Interact. 2005;18(2):150–157. doi: 10.1094/MPMI-18-0150. [DOI] [PubMed] [Google Scholar]
- 15.Venkatesh B, Babujee L, Liu H, Hedley P, Fujikawa T, Birch P, Toth I, Tsuyumu S. The Erwinia chrysanthemi 3937 PhoQ sensor kinase regulates several virulence determinants. J Bacteriol. 2006;188(8):3088–3098. doi: 10.1128/JB.188.8.3088-3098.2006. [DOI] [PMC free article] [PubMed] [Google Scholar]
- 16.Lopez-Solanilla E, Llama-Palacios A, Collmer A, Garcia-Olmedo F, Rodriguez-Palenzuela P. Relative effects on virulence of mutations in the sap, pel, and hrp loci of Erwinia chrysanthemi. Mol Plant Microbe Interact. 2001;14(3):386–393. doi: 10.1094/MPMI.2001.14.3.386. [DOI] [PubMed] [Google Scholar]
- 17.Rouanet C, Reverchon S, Rodionov DA, Nasser W. Definition of a consensus DNA-binding site for PecS, a global regulator of virulence gene expression in Erwinia chrysanthemi and identification of new members of the PecS regulon. J Biol Chem. 2004;279(29):30158–30167. doi: 10.1074/jbc.M403343200. [DOI] [PubMed] [Google Scholar]
- 18.Yap M-N, Yang CH, Barak JD, Jahn CE, Charkowski AO. The Erwinia chrysanthemi type III secretion system is required for multicellular behavior. J Bacteriol. 2005;187:639–648. doi: 10.1128/JB.187.2.639-648.2005. [DOI] [PMC free article] [PubMed] [Google Scholar]
- 19.Herault E, Reverchon S, Nasser W. Role of the LysR-type transcriptional regulator PecT and DNA supercoiling in the thermoregulation of pel genes, the major virulence factors in Dickeya dadantii. Environ Microbiol. 2013;16:3. doi: 10.1111/1462-2920.12198. [DOI] [PubMed] [Google Scholar]
- 20.Bradbury JF. Guide to plant pathogenic bacteria. Wallingford, UK: CAB International; 1986. Erwinia; pp. 61–79. [Google Scholar]
- 21.Knauss JF, Miller JW. Bacterial blight of Saintpaulia ionantha caused by Erwinia chrysanthemi. Phytopathol. 1974;64:1046–1047. doi: 10.1094/Phyto-64-1046. [DOI] [Google Scholar]
- 22.Yap MN, Barak JD, Charkowski AO. Genomic diversity of Erwinia carotovora subsp. carotovora and its correlation with virulence. Appl Environ Microbiol. 2004;70(5):3013–3023. doi: 10.1128/AEM.70.5.3013-3023.2004. [DOI] [PMC free article] [PubMed] [Google Scholar]
- 23.Perombelon MCM. Potato diseases caused by soft rot erwinias: an overview of pathogenesis. Plant Pathol. 2002;51(1):1–12. doi: 10.1046/j.0032-0862.2001.Shorttitle.doc.x. [DOI] [Google Scholar]
- 24.Toth IK, Bell KS, Holeva MC, Birch PRJ. Soft rot erwiniae: from genes to genomes. Mol Plant Pathol. 2003;4(1):17–30. doi: 10.1046/j.1364-3703.2003.00149.x. [DOI] [PubMed] [Google Scholar]
- 25.Glasner JD, Liss P, Plunkett G, III, Darling A, Prasad T, Rusch M, Byrnes A, Gilson M, Biehl B, Blattner FR, Perna NT. ASAP, a systematic annotation package for community analysis of genomes. Nucleic Acids Res. 2003;31(1):147–151. doi: 10.1093/nar/gkg125. [DOI] [PMC free article] [PubMed] [Google Scholar]
- 26.Glasner JD, Rusch M, Liss P, Plunkett G, 3rd, Cabot EL, Darling A, Anderson BD, Infield-Harm P, Gilson MC, Perna NT. ASAP: a resource for annotating, curating, comparing, and disseminating genomic data. Nucleic Acids Res. 2006;34(Database issue):D41–D45. doi: 10.1093/nar/gkj164. [DOI] [PMC free article] [PubMed] [Google Scholar]
- 27.Hommais F, Oger-Desfeux C, Van Gijsegem F, Castang S, Ligori S, Expert D, Nasser W, Reverchon S. PecS Is a Global Regulator of the Symptomatic Phase in the Phytopathogenic Bacterium Erwinia chrysanthemi 3937. J Bacteriol. 2008;190(22):7508–7522. doi: 10.1128/JB.00553-08. [DOI] [PMC free article] [PubMed] [Google Scholar]
- 28.Ravirala RS, Barabote RD, Wheeler DM, Reverchon S, Tatum O, Malouf J, Liu H, Pritchard L, Hedley PE, Birch PR, Toth IK, Payton P, San Francisco MJ. Efflux pump gene expression in Erwinia chrysanthemi is induced by exposure to phenolic acids. Mol Plant Microbe Interact. 2007;20(3):313–320. doi: 10.1094/MPMI-20-3-0313. [DOI] [PubMed] [Google Scholar]
- 29.Mattinen L, Somervuo P, Nykyri J, Nissinen R, Kouvonen P, Corthals G, Auvinen P, Aittamaa M, Valkonen JP, Pirhonen M. Microarray profiling of host-extract-induced genes and characterization of the type VI secretion cluster in the potato pathogen Pectobacterium atrosepticum. Microbiology. 2008;154(Pt 8):2387–2396. doi: 10.1099/mic.0.2008/017582-0. [DOI] [PubMed] [Google Scholar]
- 30.Rodionov DA, Gelfand MS, Hugouvieux-Cote-Pattat N. Comparative genomics of the KdgR regulon in Erwinia chrysanthemi 3937 and other gamma-proteobacteria. Microbiol. 2004;150:3571–3590. doi: 10.1099/mic.0.27041-0. [DOI] [PubMed] [Google Scholar]
- 31.Nasser W, Faelen M, Hugouvieux-Cotte-Pattat N, Reverchon S. Role of the nucleoid-associated protein H-NS in the synthesis of virulence factors in the phytopathogenic bacterium Erwinia chrysanthemi. Mol Plant Microbe Interact. 2001;14(1):10–20. doi: 10.1094/MPMI.2001.14.1.10. [DOI] [PubMed] [Google Scholar]
- 32.Nasser W, Reverchon S. H-NS-dependent activation of pectate lyases synthesis in the phytopathogenic bacterium Erwinia chrysanthemi is mediated by the PecT repressor. Mol Microbiol. 2002;43(3):733–748. doi: 10.1046/j.1365-2958.2002.02782.x. [DOI] [PubMed] [Google Scholar]
- 33.Rodionov DA, Mironov AA, Rakhmaninova AB, Gelfand MS. Transcriptional regulation of transport and utilization systems for hexuronides, hexuronates and hexonates in gamma purple bacteria. Mol Microbiol. 2000;38(4):673–683. doi: 10.1046/j.1365-2958.2000.02115.x. [DOI] [PubMed] [Google Scholar]
- 34.Zheng D, Constantinidou C, Hobman JL, Minchin SD. Identification of the CRP regulon using in vitro and in vivo transcriptional profiling. Nucleic Acids Res. 2004;32(19):5874–5893. doi: 10.1093/nar/gkh908. [DOI] [PMC free article] [PubMed] [Google Scholar]
- 35.Li ZR, Lin HH, Han LY, Jiang L, Chen X, Chen YZ. PROFEAT: a web server for computing structural and physicochemical features of proteins and peptides from amino acid sequence. Nucleic Acids Res. 2006;34(Web Server issue):W32–W37. doi: 10.1093/nar/gkl305. [DOI] [PMC free article] [PubMed] [Google Scholar]
- 36.Price MN, Huang KH, Alm EJ, Arkin AP. A novel method for accurate operon predictions in all sequenced prokaryotes. Nucleic Acids Res. 2005;33(3):880–892. doi: 10.1093/nar/gki232. [DOI] [PMC free article] [PubMed] [Google Scholar]
- 37.Tatusov RL, Natale DA, Garkavtsev IV, Tatusova TA, Shankavaram UT, Rao BS, Kiryutin B, Galperin MY, Fedorova ND, Koonin EV. The COG database: new developments in phylogenetic classification of proteins from complete genomes. Nucleic Acids Res. 2001;29(1):22–28. doi: 10.1093/nar/29.1.22. [DOI] [PMC free article] [PubMed] [Google Scholar]
- 38.Gouy M, Gautier C. Codon usage in bacteria: correlation with gene expressivity. Nucleic Acids Res. 1982;10(22):7055–7074. doi: 10.1093/nar/10.22.7055. [DOI] [PMC free article] [PubMed] [Google Scholar]
- 39.Bennetzen JL, Hall BD. Codon selection in yeast. J Biol Chem. 1982;257(6):3026–3031. [PubMed] [Google Scholar]
- 40.Pellegrini M, Marcotte EM, Thompson MJ, Eisenberg D, Yeates TO. Assigning protein functions by comparative genome analysis: protein phylogenetic profiles. Proc Natl Acad Sci U S A. 1999;96(8):4285–4288. doi: 10.1073/pnas.96.8.4285. [DOI] [PMC free article] [PubMed] [Google Scholar]
- 41.Eisenberg D, Marcotte EM, Xenarios I, Yeates TO. Protein function in the post-genomic era. Nature. 2000;405(6788):823–826. doi: 10.1038/35015694. [DOI] [PubMed] [Google Scholar]
- 42.Yu NY, Wagner JR, Laird MR, Melli G, Rey S, Lo R, Dao P, Sahinalp SC, Ester M, Foster LJ, Brinkman FS. PSORTb 3.0: improved protein subcellular localization prediction with refined localization subcategories and predictive capabilities for all prokaryotes. Bioinformatics. 2010;26(13):1608–1615. doi: 10.1093/bioinformatics/btq249. [DOI] [PMC free article] [PubMed] [Google Scholar]
- 43.Attwood TK, Avison H, Beck ME, Bewley M, Bleasby AJ, Brewster F, Cooper P, Degtyarenko K, Geddes AJ, Flower DR, Kelly MP, Lott S, Measures KM, Parry-Smith DJ, Perkins DN, Scordis P, Scott D, Worledge C. The PRINTS database of protein fingerprints: A novel information resource for computational molecular biology. J Chem Inf Comput Sci. 1997;37(3):417–424. doi: 10.1021/ci960468e. [DOI] [PubMed] [Google Scholar]
- 44.Attwood TK, Blythe MJ, Flower DR, Gaulton A, Mabey JE, Maudling N, McGregor L, Mitchell AL, Moulton G, Paine K, Scordis P. PRINTS and PRINTS-S shed light on protein ancestry. Nucleic Acids Res. 2002;30(1):239–241. doi: 10.1093/nar/30.1.239. [DOI] [PMC free article] [PubMed] [Google Scholar]
- 45.Demerec M, Hartman PE. Complex loci in microorganisms. Annu Rev Microbiol. 1959;13:377–406. doi: 10.1146/annurev.mi.13.100159.002113. [DOI] [Google Scholar]
- 46.Rey S, Gardy JL, Brinkman FS. Assessing the precision of high-throughput computational and laboratory approaches for the genome-wide identification of protein subcellular localization in bacteria. BMC Genomics. 2005;6:162. doi: 10.1186/1471-2164-6-162. [DOI] [PMC free article] [PubMed] [Google Scholar]
- 47.Sharp PM, Li WH. The codon Adaptation Index–a measure of directional synonymous codon usage bias, and its potential applications. Nucleic Acids Res. 1987;15(3):1281–1295. doi: 10.1093/nar/15.3.1281. [DOI] [PMC free article] [PubMed] [Google Scholar]
- 48.Grote A, Hiller K, Scheer M, Munch R, Nortemann B, Hempel DC, Jahn D. JCat: a novel tool to adapt codon usage of a target gene to its potential expression host. Nucleic Acids Res. 2005;33(Web Server issue):W526–W531. doi: 10.1093/nar/gki376. [DOI] [PMC free article] [PubMed] [Google Scholar]
- 49.Overbeek R, Fonstein M, D'Souza M, Pusch GD, Maltsev N. The use of gene clusters to infer functional coupling. Proc Natl Acad Sci U S A. 1999;96(6):2896–2901. doi: 10.1073/pnas.96.6.2896. [DOI] [PMC free article] [PubMed] [Google Scholar]
- 50.Dandekar T, Snel B, Huynen M, Bork P. Conservation of gene order: a fingerprint of proteins that physically interact. Trends Biochem Sci. 1998;23(9):324–328. doi: 10.1016/S0968-0004(98)01274-2. [DOI] [PubMed] [Google Scholar]
- 51.Price MN, Huang KH, Arkin AP, Alm EJ. Operon formation is driven by co-regulation and not by horizontal gene transfer. Genome Res. 2005;15(6):809–819. doi: 10.1101/gr.3368805. [DOI] [PMC free article] [PubMed] [Google Scholar]
- 52.Tatusov RL, Koonin EV, Lipman DJ. A genomic perspective on protein families. Science. 1997;278:631–637. doi: 10.1126/science.278.5338.631. [DOI] [PubMed] [Google Scholar]
- 53.Langille MG, Hsiao WW, Brinkman FS. Evaluation of genomic island predictors using a comparative genomics approach. BMC Bioinform. 2008;9:329. doi: 10.1186/1471-2105-9-329. [DOI] [PMC free article] [PubMed] [Google Scholar]
- 54.Langille MG, Brinkman FS. IslandViewer: an integrated interface for computational identification and visualization of genomic islands. Bioinformatics. 2009;25(5):664–665. doi: 10.1093/bioinformatics/btp030. [DOI] [PMC free article] [PubMed] [Google Scholar]
- 55.Rao HB, Zhu F, Yang GB, Li ZR, Chen YZ. Update of PROFEAT: a web server for computing structural and physicochemical features of proteins and peptides from amino acid sequence. Nucleic Acids Res. 2011;39(Web Server issue):W385–W390. doi: 10.1093/nar/gkr284. [DOI] [PMC free article] [PubMed] [Google Scholar]
- 56.Hall M, Frank E, Holmes G, Pfahringer B, Reutemann P, Witten IH. The WEKA Data Mining Software: An Update. SIGKDD Explor. 2009;11(1):10–18. doi: 10.1145/1656274.1656278. [DOI] [Google Scholar]
- 57.Witten IH, Eibe F, Hall MA. Data Mining: Practical machine learning tools and techniques. 3. Burlington, MA, USA: Elsevier; 2005. [Google Scholar]
- 58.Quinlan R. C4.5: Programs for Machine Learning. San Mateo, CA: Morgan Kaufmann Publishers; 1993. [Google Scholar]
- 59.Hastie T, Tibshirani R. Classification by Pairwise Coupling. Annu Stat. 1998;26(2):451–471. doi: 10.1214/aos/1028144844. [DOI] [Google Scholar]
- 60.Keerthi SS, Shevade SK, Bhattacharyya C, Murthy KRK. Improvements to Platt’s SMO Algorithm for SVM Classifier Design. Neural Comput. 2001;13(3):637–649. doi: 10.1162/089976601300014493. [DOI] [Google Scholar]
- 61.Platt J. Machines using Sequential Minimal Optimization. In: Schoelkopf B, Burges C, Smola A, editors. Advances in Kernel Methods - Support Vector Learning. Cambridge, MA, USA: The MIT Press; 1998. [Google Scholar]
- 62.Cooper GF, Herskovits E. UAI’91 Proceedings of the Seventh conference on Uncertainty in Artificial Intelligence. San francisco, CA, USA: Morgan Kaufmann Publishers Inc; 1991. A Bayesian method for constructing Bayesian belief networks from databases; pp. 86–94. [Google Scholar]
- 63.Cooper GF, Herskovits E. A Bayesian method for the induction of probabilistic networks from data. Mach Learn. 1992;9(4):309–347. [Google Scholar]
- 64.George HJ, Langley P. UAI’95 Eleventh Conference on Uncertainty in Artificial Intelligence. 1995. Estimating Continuous Distributions in Bayesian Classifiers, San Mateo; pp. 338–345. [Google Scholar]
- 65.Aha D, Kibler D. Instance-based learning algorithms. Mach Learn. 1991;6:37–66. [Google Scholar]
- 66.Cohen WW. Twelfth International Conference on Machine Learning. 1995. Fast Effective Rule Induction; pp. 115–123. [Google Scholar]
- 67.Friedman J, Hastie T, Tibshirani R. Additive Logistic Regression: a Statistical View of Boosting. Annu Stat. 2000;28(2):337–407. doi: 10.1214/aos/1016218223. [DOI] [Google Scholar]
- 68.Breiman L. Bagging predictors. Mach Learn. 1996;24(2):123–140. [Google Scholar]
- 69.Webb GI. MultiBoosting: a technique for combining boosting and wagging. Mach Learn. 2000;40(2):159–196. doi: 10.1023/A:1007659514849. [DOI] [Google Scholar]
- 70.Freund Y, Schapire RE. Thirteenth International Conference on Machine Learning. San Francisco. 1996. Experiments with a new boosting algorithm; pp. 148–156. [Google Scholar]
- 71.Kittler J, Hatef M, Duin RPW, Matas J. On combining classifiers. IEEE Trans Pattern Anal Mach Intell. 1998;20(3):226–239. doi: 10.1109/34.667881. [DOI] [Google Scholar]
- 72.Kuncheva LK. Combining Pattern Classifiers: Methods and Algorithms. Loboken, NJ: Wiley-Interscience; 2004. [Google Scholar]
- 73.Wolpert DH. Stacked generalization. Neural Netw. 1992;5:241–259. doi: 10.1016/S0893-6080(05)80023-1. [DOI] [Google Scholar]
- 74.Kohavi R. Proceedings of the Fourteenth International Joint Conference on Artificial Intelligence 1995. San Mateo: Morgan Kaufmann; 1995. A study of cross-validation and bootstrap for accuracy estimation and model selection; pp. 1137–1143. [Google Scholar]
- 75.Devijver PA, Kittler J. Pattern Recognition: A Statistical Approach. London: Prentice-Hall; 1982. [Google Scholar]
- 76.Peterson LE, Coleman MA. Machine learning-based receiver operating characteristic (ROC) curves for crisp and fuzzy classification of DNA microarrays in cancer research. International Journal of Approximate Reasoning. 2008;47(1):17–36. doi: 10.1016/j.ijar.2007.03.006. [DOI] [PMC free article] [PubMed] [Google Scholar]
- 77.Jolliffe IT. Principal Component Analysis. 2. NY: Springer; 2002. [Google Scholar]
- 78.Kononenko I. 14th International Joint Conference on Artificial Intelligence. 1995. On Biases in Estimating Multi-Valued Attributes; pp. 1034–1040. [Google Scholar]
- 79.Fayyad U, Irani K. Thirteenth International Joint Conference on Articial Intelligence: 1993. 1993. Multi-interval discretization of continuousvalued attributes for classification learning; pp. 1022–1027. [Google Scholar]
- 80.Breiman L. Random Forests. Mach Learn. 2001;45(1):5–32. doi: 10.1023/A:1010933404324. [DOI] [Google Scholar]
- 81.Breiman and Cutler’s Random Forests for Classification and Regression [http://CRAN.R-project.org/package=randomForest]
- 82.Livingston F. Implementation of Breimans Random Forest Machine Learning Algorithm. 2005. ECE591Q Machine Learning Journal Paper. [Google Scholar]
- 83.Provost F, Fawcett T, Kohavi R. Proceeding of the 15th International Conference on Machine Learning. San Francisco, CA: Morgan Kaufmann; 1998. The case against accuracy estimation for comparing induction algorithms; pp. 445–453. [Google Scholar]
- 84.Davis J. Proceedings of the 23th International Conference on Machine Learning: 2006; Pittsburgh, PA. 2006. The relationship between precision-recall and ROC curves. [Google Scholar]
- 85.Kalia A, Bessen DE. Natural selection and evolution of streptococcal virulence genes involved in tissue-specific adaptations. J Bacteriol. 2004;186(1):110–121. doi: 10.1128/JB.186.1.110-121.2004. [DOI] [PMC free article] [PubMed] [Google Scholar]
- 86.Wiles TJ, Norton JP, Smith SN, Lewis AJ, Mobley HL, Casjens SR, Mulvey MA. A phyletically rare gene promotes the niche-specific fitness of an E. coli pathogen during bacteremia. PLoS Pathog. 2013;9(2):e1003175. doi: 10.1371/journal.ppat.1003175. [DOI] [PMC free article] [PubMed] [Google Scholar]
- 87.Kohavi R, John GH. Wrappers for Feature Subset Selection. Artif Intell. 1997;97(1–2):273–324. doi: 10.1016/S0004-3702(97)00043-X. [DOI] [Google Scholar]
- 88.Blum A, Langley P. Selection of relevant features and examples in machine learning. Artif Intell. 1997;97:245–271. doi: 10.1016/S0004-3702(97)00063-5. [DOI] [Google Scholar]
- 89.Hall MA. Correlation-based Feature Subset Selection for Machine Learning. New Zealand: Hamilton; 1998. [Google Scholar]
- 90.Guyon I, Weston J, Barnhill S, Vapnik V. Gene selection for cancer classification using support vector machines. Mach Learn. 2002;46:389–422. doi: 10.1023/A:1012487302797. [DOI] [Google Scholar]
- 91.Lustgarten JL, Gopalakrishnan V, Grover H, Visweswaran S. AMIA Annu Symp Proc: 2008. 2008. Improving Classification Performance with Discretization on Biomedical Datasets; pp. 445–449. [PMC free article] [PubMed] [Google Scholar]
- 92.Liu H, Setiono R. Feature selection via discretization. Knowl Data Eng. 1997;9(4):642–645. doi: 10.1109/69.617056. [DOI] [Google Scholar]
- 93.Landini P, Zehnder AJ. The global regulatory hns gene negatively affects adhesion to solid surfaces by anaerobically grown Escherichia coli by modulating expression of flagellar genes and lipopolysaccharide production. J Bacteriol. 2002;184(6):1522–1529. doi: 10.1128/JB.184.6.1522-1529.2002. [DOI] [PMC free article] [PubMed] [Google Scholar]
- 94.Harrison JA, Pickard D, Higgins CF, Khan A, Chatfield SN, Ali T, Dorman CJ, Hormaeche CE, Dougan G. Role of hns in the virulence phenotype of pathogenic salmonellae. Mol Microbiol. 1994;13(1):133–140. doi: 10.1111/j.1365-2958.1994.tb00408.x. [DOI] [PubMed] [Google Scholar]
- 95.Tetko IV, Livingstone DJ, Luik AI. Neural-Network Studies 1. Comparison of Overfitting and Overtraining. J Chem Inf Comput Sci. 1995;35(5):826–833. doi: 10.1021/ci00027a006. [DOI] [Google Scholar]
- 96.Sima C, Attoor S, Brag-Neto U, Lowey J, Suh E, Dougherty ER. Impact of error estimation on feature selection. Pattern Recogn. 2005;38(12):2472–2482. doi: 10.1016/j.patcog.2005.03.026. [DOI] [Google Scholar]
- 97.Caruana R, Niculescu-Mizil A. Proceedings of the 23rd international conference on Machine learning 2006. 2006. An empirical comparison of supervised learning algorithms. [Google Scholar]
- 98.Freund Y. Boosting a weak learning algorithm by majority. Inform Comput. 1995;121(2):256–285. doi: 10.1006/inco.1995.1136. [DOI] [Google Scholar]
- 99.Legault BA, Lopez-Lopez A, Alba-Casado JC, Doolittle WF, Bolhuis H, Rodriguez-Valera F, Papke RT. Environmental genomics of “Haloquadratum walsbyi” in a saltern crystallizer indicates a large pool of accessory genes in an otherwise coherent species. BMC Genomics. 2006;7:171. doi: 10.1186/1471-2164-7-171. [DOI] [PMC free article] [PubMed] [Google Scholar]
- 100.Gill SR, Pop M, Deboy RT, Eckburg PB, Turnbaugh PJ, Samuel BS, Gordon JI, Relman DA, Fraser-Liggett CM, Nelson KE. Metagenomic analysis of the human distal gut microbiome. Science. 2006;312(5778):1355–1359. doi: 10.1126/science.1124234. [DOI] [PMC free article] [PubMed] [Google Scholar]
- 101.Venter JC, Remington K, Heidelberg JF, Halpern AL, Rusch D, Eisen JA, Wu D, Paulsen I, Nelson KE, Nelson W, Fouts DE, Levy S, Knap AH, Lomas MW, Nealson K, White O, Peterson J, Hoffman J, Parsons R, Baden-Tillson H, Pfannkoch C, Rogers YH, Smith HO. Environmental genome shotgun sequencing of the Sargasso Sea. Science. 2004;304(5667):66–74. doi: 10.1126/science.1093857. [DOI] [PubMed] [Google Scholar]
- 102.Edwards RA, Rodriguez-Brito B, Wegley L, Haynes M, Breitbart M, Peterson DM, Saar MO, Alexander S, Alexander EC, Jr, Rohwer F. Using pyrosequencing to shed light on deep mine microbial ecology. BMC Genomics. 2006;7:57. doi: 10.1186/1471-2164-7-57. [DOI] [PMC free article] [PubMed] [Google Scholar]
- 103.Galperin MY, Koonin EV. ‘Conserved hypothetical’ proteins: prioritization of targets for experimental study. Nucleic Acids Res. 2004;32(18):5452–5463. doi: 10.1093/nar/gkh885. [DOI] [PMC free article] [PubMed] [Google Scholar]
- 104.Braudo EE, Plashchina IG, Kobak VV, Golovnya RV, Zhuravleva IL, Krikunova NI. Interactions of flavor compounds with pectic substances. Food Nahrung. 2000;44(3):173–177. doi: 10.1002/1521-3803(20000501)44:3<173::AID-FOOD173>3.0.CO;2-X. [DOI] [PubMed] [Google Scholar]
- 105.Delangle A, Prouvost AF, Cogez V, Bohin JP, Lacroix JM, Cotte-Pattat NH. Characterization of the Erwinia chrysanthemi gan locus, involved in galactan catabolism. J Bacteriol. 2007;189(19):7053–7061. doi: 10.1128/JB.00845-07. [DOI] [PMC free article] [PubMed] [Google Scholar]
- 106.Mattinen L, Tshuikina M, Mae A, Pirhonen M. Identification and characterization of Nip, necrosis-inducing virulence protein of Erwinia carotovora subsp carotovora. Mol Plant Microbe Interact. 2004;17(12):1366–1375. doi: 10.1094/MPMI.2004.17.12.1366. [DOI] [PubMed] [Google Scholar]
- 107.Fischer E, Gunter K, Braun V. Involvement of Exbb and Tonb in Transport across the Outer-Membrane of Escherichia-Coli - Phenotypic Complementation of Exb Mutants by Overexpressed Tonb and Physical Stabilization of Tonb by Exbb. J Bacteriol. 1989;171(9):5127–5134. doi: 10.1128/jb.171.9.5127-5134.1989. [DOI] [PMC free article] [PubMed] [Google Scholar]
- 108.Wiggerich HG, Puhler A. The exbD2 gene as well as the iron-uptake genes tonB, exbB and exbD1 of Xanthomonas campestris pv. campestris are essential for the induction of a hypersensitive response on pepper (Capsicum annuum) Microbiol-Sgm. 2000;146:1053–1060. doi: 10.1099/00221287-146-5-1053. [DOI] [PubMed] [Google Scholar]
- 109.Bitter W, Tommassen J, Weisbeek PJ. Identification and Characterization of the Exbb, Exbd and Tonb Genes of Pseudomonas-Putida Wcs358 - Their Involvement in Ferric-Pseudobactin Transport. Mol Microbiol. 1993;7(1):117–130. doi: 10.1111/j.1365-2958.1993.tb01103.x. [DOI] [PubMed] [Google Scholar]
- 110.Watson RJ, Joyce SA, Spencer GV, Clarke DJ. The exbD gene of Photorhabdus temperata is required for full virulence in insects and symbiosis with the nematode Heterorhabditis. Mol Microbiol. 2005;56(3):763–773. doi: 10.1111/j.1365-2958.2005.04574.x. [DOI] [PubMed] [Google Scholar]
- 111.Bjarnason J, Southward CM, Surette MG. Genomic profiling of iron-responsive genes in Salmonella enterica serovar typhimurium by high-throughput screening of a random promoter library. J Bacteriol. 2003;185(16):4973–4982. doi: 10.1128/JB.185.16.4973-4982.2003. [DOI] [PMC free article] [PubMed] [Google Scholar]
- 112.Said-Salim B, Dunman PM, McAleese FM, Macapagal D, Murphy E, McNamara PJ, Arvidson S, Foster TJ, Projan SJ, Kreiswirth BN. Global regulation of Staphylococcus aureus genes by rot. J Bacteriol. 2003;185(2):610–619. doi: 10.1128/JB.185.2.610-619.2003. [DOI] [PMC free article] [PubMed] [Google Scholar]
- 113.De Maayer P, Chan WY, Venter SN, Toth IK, Birch PR, Joubert F, Coutinho TA. Genome sequence of Pantoea ananatis LMG20103, the causative agent of Eucalyptus blight and dieback. J Bacteriol. 2010;192(11):2936–2937. doi: 10.1128/JB.00060-10. [DOI] [PMC free article] [PubMed] [Google Scholar]
- 114.Cao H, Krishnan G, Goumnerov B, Tsongalis J, Tompkins R, Rahme LG. A quorum sensing-associated virulence gene of Pseudomonas aeruginosa encodes a LysR-like transcription regulator with a unique self-regulatory mechanism. Proc Natl Acad Sci U S A. 2001;98(25):14613–14618. doi: 10.1073/pnas.251465298. [DOI] [PMC free article] [PubMed] [Google Scholar]
- 115.Marraffini LA, Dedent AC, Schneewind O. Sortases and the art of anchoring proteins to the envelopes of gram-positive bacteria. Microbiol Mol Biol Rev. 2006;70(1):192–221. doi: 10.1128/MMBR.70.1.192-221.2006. [DOI] [PMC free article] [PubMed] [Google Scholar]
- 116.Strom MS, Nunn DN, Lory S. Posttranslational processing of type IV prepilin and homologs by PilD of Pseudomonas aeruginosa. Methods Enzymol. 1994;235:527–540. doi: 10.1016/0076-6879(94)35168-6. [DOI] [PubMed] [Google Scholar]
- 117.Korbel JO, Jensen LJ, von Mering C, Bork P. Analysis of genomic context: prediction of functional associations from conserved bidirectionally transcribed gene pairs. Nat Biotechnol. 2004;22(7):911–917. doi: 10.1038/nbt988. [DOI] [PubMed] [Google Scholar]
- 118.Davila Lopez M, Martinez Guerra JJ, Samuelsson T. Analysis of gene order conservation in eukaryotes identifies transcriptionally and functionally linked genes. PLoS One. 2010;5(5):e10654. doi: 10.1371/journal.pone.0010654. [DOI] [PMC free article] [PubMed] [Google Scholar]
- 119.Mattick JS. Type IV pili and twitching motility. Annu Rev Microbiol. 2002;56:289–314. doi: 10.1146/annurev.micro.56.012302.160938. [DOI] [PubMed] [Google Scholar]
- 120.Lybarger SR, Maddock JR. Polarity in action: asymmetric protein localization in bacteria. J Bacteriol. 2001;183(11):3261–3267. doi: 10.1128/JB.183.11.3261-3267.2001. [DOI] [PMC free article] [PubMed] [Google Scholar]
- 121.Bardy SL, Maddock JR. Polar localization of a soluble methyl-accepting protein of Pseudomonas aeruginosa. J Bacteriol. 2005;187(22):7840–7844. doi: 10.1128/JB.187.22.7840-7844.2005. [DOI] [PMC free article] [PubMed] [Google Scholar]
- 122.Yao J, Allen C. The plant pathogen Ralstonia solanacearum needs aerotaxis for normal biofilm formation and interactions with its tomato host. J Bacteriol. 2007;189(17):6415–6424. doi: 10.1128/JB.00398-07. [DOI] [PMC free article] [PubMed] [Google Scholar]
- 123.Hagman KE, Porcella SF, Popova TG, Norgard MV. Evidence for a methyl-accepting chemotaxis protein gene (mcp1) that encodes a putative sensory transducer in virulent Treponema pallidum. Infect Immun. 1997;65(5):1701–1709. doi: 10.1128/iai.65.5.1701-1709.1997. [DOI] [PMC free article] [PubMed] [Google Scholar]
- 124.Collmer A, Keen NT. The role of pectic enzymes in plant pathogenesis. Annu Rev Phytopathol. 1986;24:383–409. doi: 10.1146/annurev.py.24.090186.002123. [DOI] [Google Scholar]
- 125.Rivals I, Personnaz L, Taing L, Potier MC. Enrichment or depletion of a GO category within a class of genes: which test? Bioinformatics. 2007;23(4):401–407. doi: 10.1093/bioinformatics/btl633. [DOI] [PubMed] [Google Scholar]
- 126.Draghici S, Khatri P, Martins RP, Ostermeier GC, Krawetz SA. Global functional profiling of gene expression. Genomics. 2003;81(2):98–104. doi: 10.1016/S0888-7543(02)00021-6. [DOI] [PubMed] [Google Scholar]
Associated Data
This section collects any data citations, data availability statements, or supplementary materials included in this article.
Supplementary Materials
Additional file 1: List of individual protein-coding genes from Dd3937 (a) and WPP14 (b) assigned host-microbe interaction GO annotations corresponding to Table 2 . (ZIP 33 KB)
Additional file 2: (a) Strain information of all gamma-proteobacteria with complete or nearly complete genomes used in this study and their associations with various phenotypes of interest (as listed in Additional file 2: Table S1). (b) List of all non gamma-proteobacteria with complete or nearly complete genomes used in this study. (c) List of attribute categories used to generate summary taxonomic and phenotypic attributes based on sequence homology, the count of genomes in each category used as BLASTP search databases, and the number of proteins in Dickeya dadantii (Dd3937) and Pectobacterium carotovorum (WPP14) with hits to target organisms in those categories. (d) List of attributes used in the category of phenotypes of interest, including taxonomic groups and lifestyle statistics. (ZIP 223 KB)
Additional file 3: Functional genomics data sets used in this study. (a) Data sets generated from microarray or proteomics studies. (b) Binding sites prediction of 32 putative transcriptional factors that may be related with host-microbe interactions. (ZIP 34 KB)
Additional file 4: Description of selected supervised machine learning schemes. (DOCX 150 KB)
Additional file 5: (a) List of selected attributes with importance measurement score and subsets of attributes defined to be used in data decay analysis for Dickeya dadantii 3937 and Pectobacterium carotovorum WPP14, (b) probability score plot used to define a compact set of attributes for both strains. (ZIP 1 MB)
Additional file 6: (a) RP curve to compare strategies of data transformation for boosting classifier performance. (b) PR curve to compare classifier performance using five data sets partitioned according to GO terms for different aspects of host-microbe interaction (refer to Table 2). (ZIP 223 KB)
Additional file 7: The list of predicted host-microbe interaction factors. (a) List of 211 genes predicted to be host-microbe interaction factors for Dickeya dadantii 3937, (b) list of 216 genes predicted to be host-microbe interaction factors for Pectobacterium carotovorum WPP14. (c) list of top 300 genes that could not be confidently classified as host-microbe interaction factors for both Dickeya dadantii 3937 and Pectobacterium carotovorum WPP14. (ZIP 17 KB)