

Abstract
Aims
Cold stress has been shown to produce dramatic increases in 2-fluoro-2-deoxy-D-Glucose (18FDG) accumulation by brown adipose tissue (BAT) in rodents. However, neither the effects of other types of stress on 18FDG accumulation nor the effects of stressors on the accumulation of tracers of other aspects of energy metabolism have been evaluated. In this report we studied the effects of cold stress, burn injury, and cutaneous wounds on murine BAT at the macroscopic, microscopic, and metabolic level.
Main Methods
Glucose metabolism was studied with 18FDG, fatty acid accumulation was evaluated with trans-9(RS)-18F-fluoro-3,4(RS,RS)- methyleneheptadecanoic acid (FCPHA) and tricarboxcylic acid cycle (TCA) activity was evaluated with 3H acetate.
Key Findings
All three stressors produced dramatic changes in BAT at the macroscopic and microscopic level. Macroscopically, BAT from the stressed animals appeared to be a much darker brown in color. Microscopically BAT of stressed animals demonstrated significantly fewer lipid droplets and an overall decrease in lipid content. Accumulation of 18FDG by BAT was significantly (P <0.01) increased by all 3 treatments (Cold: ∼16 fold, burn ∼7 Fold and cutaneous wound ∼14 fold) whereas uptake of FDG by white fat was unchanged. This effect was also demonstrated non- invasively by μPET imaging. Although less prominent than with 18FDG, BAT uptake of FCPHA and acetate were also significantly increased by all three treatments. These findings suggest that in addition to cold stress, burn injury and cutaneous wounds produce BAT activation in mice.
Significance
This study demonstrates brown fat activated by several stressors leads to increased uptake of various substrates.
Keywords: Brown Fat, PET, Metabolism
Introduction
Brown adipose tissue (BAT) and white adipose tissue (WAT) are both found in mammals. The primary function of WAT is lipid storage whereas BAT is intimately involved in energy metabolism. BAT is especially abundant in newborns and in hibernating mammals (Cannon and Nedergaard 2004) where its primary function is to generate body heat by “non-shivering thermogenesis”. The mechanism of this process is believed to be related to uncoupling of substrate utilization and ATP production in the mitochondria with resulting dissipation of metabolic energy as heat (Sell et al. 2004).
Until recently, the interpretations of 18FDG-PET studies were confounded by the presence of focal areas of increased tracer accumulation, in the supraclavicular region, intercostal region, peri-adrenal region, axilla, and around the great vessels which were falsely ascribed to nodal disease. With the introduction of PET/CT, these findings were confirmed to represent focal areas of BAT and not nodal disease. These findings were shown to be most prominent in lean females during the cold months (Van Marken Lichtenbelt et al.2009; Cypess et al. 2009; Virtanen et al. 2009; Saito et al. 2009; Au-Yong et al. 2009).
Cold stress has also been shown to activate 18FDG uptake in rodents (Tatsumi et al. 2004), however, neither the effects of other types of stress on 18FDG accumulation nor the effects of stressors on the accumulation of tracers of other aspects of energy metabolism have been evaluated. BAT has also been considered to be important in insulin resistance which is a condition where there is the inability of insulin to lower glucose levels (Valverde and Benito 2005).
In the present report, we studied the effects of the cold stress, burn injury and cutaneous wounds to mice on BAT at the macroscopic level, microscopic level and the metabolic level [18FDG accumulation (glycolysis), FCPHA accumulation (fatty acid utilization) and 3H-acetate accumulation (TCA cycle activity)].
Overall, our findings indicated that cold stress, burn injury and cutaneous wounds have significant effects on BAT at the structural and functional levels.
Materials and Methods
Materials
18F labeled FDG was prepared by routine methods (Hamacher et al. 1986). Trans-9(RS)-18F-fluoro-3,4(RS,RS)- methyleneheptadecanoic acid (FCPHA) was prepared using a procedure developed in our laboratory (Shoup et al. 2005). 3H- Acetate, SOLVABLE™ and Ultima Gold™ were purchased from Perkin Elmer Inc. (Waltham MA).
Animal Preparation
Male CD-1 mice weighing ∼ 28 grams (Charles River, Wilmington MA) were use in these studies. After acclimatizing to the MGH animal facility for at least five days, groups of six animals were treated as follows:
Burn Injury
Full-thickness, non-lethal thermal injury (30 % total body surface area [TBSA]) was produced, as described previously (Zhang et al. 2005). Briefly, the mice were anesthetized with ether and their backs were shaved with animal hair clippers. Under ether anesthesia, the mice were placed in molds exposing 30% TBSA followed by emersion of the exposed area in a water bath at 90°C for 9 sec. The animals were immediately resuscitated with saline (15 ml/kg) by intraperitoneal injection. Sham control animals were treated similarly with the exception that the water bath at 90°C was replaced with room temperature water. After the procedure, the animals were caged individually and fasted 24 hrs at room temperature with free access to water prior to radiopharmaceutical administration.
Cold Stress
To produce cold stress, the mice were placed in a cold room at 4°C for 24 hours with overnight fasting with free access to water. The mice were housed three to a cage in wire mesh bottom cages and the radiopharmaceuticals were administered on the following morning.
Cutaneous Wounds
For this procedure, the mice were anesthetized with ether, their backs were shaved with animal hair clippers and a 1 cm2 section of skin was removed to the level of the fascia to produce a full thickness wound. After the procedure, the mice were housed individually in wire mesh bottom cages and fasted 24 hrs at room temperature prior to radiopharmaceutical administration.
Animal care was provided in accordance with the procedures outlined by the National Institutes [National Institutes of Health. Guide for Care and Use of Laboratory Animals (Department of Health and Human Services Publication 85-23). Bethesda, MD, National Institutes of Health, 1996]. The study was approved by the Subcommittee on Research Animal Care of the Massachusetts General Hospital.
Biodistribution Studies
The fasted animals were injected (without anesthesia) via tail vein with 18FDG (50.0 μCi), FCPHA (50.0 μCi) or 3H-acetate (5.0 μC). One hour after administration of 18FDG and FCPHA or 30 min after administration of 3H-acetate the animals were sacrificed, selected tissues were excised, weighed and biodistribution was determined by direct measurement of tissue radioactivity using a Wizard Gamma counter. Tissues containing 3H-acetate were added to I ml of SOLVABLE™ in a glass vile which was capped and heated at 60°C with shaking. The samples were then cooled and decolorized with 0.3 ml of 30% hydrogen peroxide. 10 ml of Ultima Gold™ was added to each sampler and radioactivity was measured with a Beckman LS6000 lC liquid scintillation counter. Radioactivity in aliquots of the injected doses was counted with the tissue samples to correct for radioactive decay. All results were expressed as % injected dose per gram of tissue (%ID/g, mean ± sem).
μPET Imaging
Additional groups of control and stressed animals were studied by 18FDG μPET. μPET imaging was performed with a P4 μPET camera (Concord Microsystems Inc. Knoxville, TN). One hour after intravenous injection of 18FDG (∼500.0 μCi) via tail vein without anesthesia, the mice were anesthetized, positioned and stabilized in the gantry of the PET camera and a 10 min image was acquired in list mode. The primary imaging characteristics of the P4 camera are in-plane and axial resolutions of ∼2 mm FWHM, 63 contiguous slices of 1.27 mm separation and a sensitivity of ∼650 cps/μCi. In all animals, the region from the head to the base of the tail was included in the 8.0 cm field of view of the camera. The PET images were reconstructed using an iterative algorithm (Ordered Subset Expectation Maximization, OSEM) and a ramp filter with a cut-off of 0.5. Data for attenuation correction was measured with a rotating point source containing 68Ge. All projection data were corrected for non-uniformity of detector response, dead time, random coincidences, and scattered radiation. The PET camera was cross-calibrated to a well scintillation counter by comparing the camera response from a uniform distribution of an 18F solution in a 5.0 cm cylindrical phantom with the response of a well counter to an aliquot of the same solution.
Histology
The BAT lobules and contiguous or nearby normal WAT tissues were excised from the posterior cervical-upper thoracic region and immersed in 10 % formalin. After 24 hours of fixation, the excised fat was examined, comparative changes were noted and lobe sizes were measured. Tissues were then block sectioned, inserted into cassettes, processed to paraffin blocks, microtome sectioned to 6 microns and stained with H&E (hematoxylin and eosin) for microscopic examination.
The H&E slides were evaluated microscopically for histological changes in BAT and adjacent WAT tissues. Lipid content (dissolved and removed by xylene during paraffin block processing) was represented by distinctive clear intra-cytoplasmic vacuoles. The lipid content was estimated as a percentage of “clear areas” relative to remaining areas of stained cellular components (nucleus and cytoplasm) and supporting connective tissue. A calibrated ocular grid was used on random fields and percentages were calculated as statistical averages. This method was utilized in lieu of fat stained frozen tissue sections which are cumbersome to evaluate and fraught with a host of staining artifacts. The method employed permitted equal or greater accuracy.
Measurement of BAT Uncoupling Protein-1 (UCP-) mRNA by quantitative polymerase chain reaction
RNA was extracted from the tissues using QUAZOL reagent (Gibco-BRL). Briefly, tissues were added to a screw-cap vial ½ full of Zircona beads (Biospec). The tissue and beads were placed in the BeadBeater for 2 minutes. The lysate was transferred into a 2 mL tube, and purified the RNA purified using the Qiagen RNeasy kit after chloroform treatment.
Primers were designed for mouse UCP1 and mouse β-actin (as a house-keeping gene) were provided by Invitrogen (California,USA). Real time RT-PCR for quantifying to quantify UCP1 transcript utilized an iCycle iQ Muticolor Real-Time PCR Detection System (Bio-Rad, Hercules, CA) and SYBR Green PCR Master Mix (Applied Biosystems, Foster City, CA). In order to normalize for variations in mRNA extraction and cDNA synthesis, expression of β-actin as a house-keeping gene was also measured. Thermal cycling conditions included an initial step at 94°C for 10 minutes, followed by 50 cycles at 94°C for 30 seconds, 60°C for 30 seconds, and 72°C for 30 seconds. The length of the PCR products for UCP1 and β-actin were 133 bp and 216 bp, respectively. Each sample was analyzed in triplicate and every experiment was repeated five times.
Quantitation of UCP1 transcript was performed using the comparative Ct method. This procedure allows relative quantitation of gene expression where the target gene Ct is compared with the reference gene Ct (Livak and Schmittgen 2001). The relative amount of target transcript is calculated as 2-ΔΔCt where –ΔΔCt represents the difference between ΔCtsample (calculated by subtracting the UCP1 Ct from β-actin Ct. and ΔCtcalibrator (calculated by subtracting the UCP1 Ct from β-actin in the sham sample).This calculation assumes that the efficiency of target and reference gene amplification are approximately equal.
Measurement of Rectal Temperatures
The rectal temperature of the various groups of mice was determined prior to injection of the radioisotope using a BAT-12 microprobe thermometer (PhysioTemp Instruments, Inc, Clifton, New Jersey). Briefly the animal was placed on a hard surface, the probe inserted, and the temperature recorded after it had stabilized.
Statistical Analysis
Statistical analysis was performed by one-way analysis of variance (ANOVA) and individual means were compared by Duncan's multiple range test. Differences with a p-value of less than 0.05 were considered to be statistically significant.
Results
Gross Description of Excised Fat
The BAT consisted of two symmetrical pyramidal lobes which straddled the axial midline. They were connected by a thin short string-like isthmus of connective tissue. The medial half of these lobes was a homogeneous dark color compared to the yellow-white color of the distal and more lateral half. The darker fat tissue was firm while the yellow-white fat was soft. These two colors of fat were separated by either a thin sharp or a thin fuzzy transitional zone. The dark fat of controls was tan-brown while the BAT of all injured mice (burned, cold stressed or wounded) was distinctly much darker brown in color (Figure 1).
Figure 1.
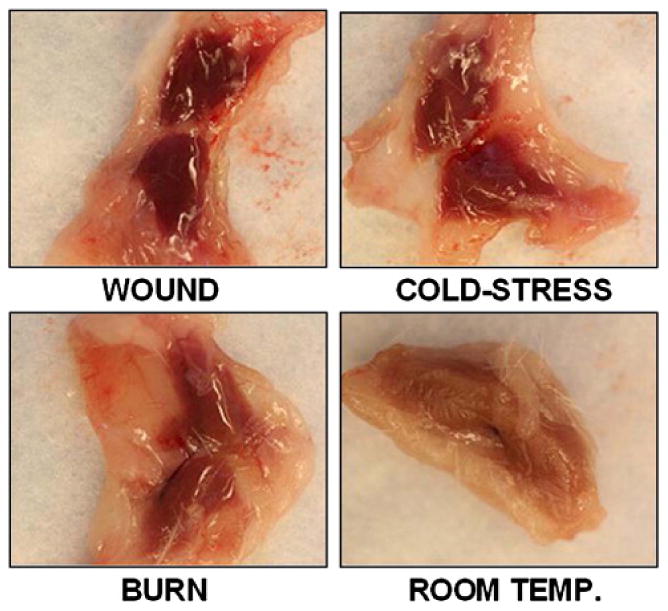
Macroscopic (gross) appearance of BAT from representative mice subjected to burn injury, cutaneous wound, cold stress and sham controls.
Microscopic Descriptions
Sham control animals
At the microscopic level, mature WAT cells were found to be round to polygonal and ∼50 μm in diameter. The cells contained a single large clear cytoplasmic vacuole (fat before xylene-paraffin processing), a pencil fine cellular membrane, no stainable cytoplasm; a crescent shaped nucleus flattened against the cell membrane and were arranged in a tight mosaic pattern.
BAT cells were smaller; 1/3 to ½ the diameter of WAT cells. Most cells contained multiple vacuoles mixed with variable amounts of stainable pink granular cytoplasm. Other BAT cells had single vacuoles with no stainable cytoplasm and had the appearance of smaller WAT cells. Nuclei composed of vesicular heterochromatin were central or paracentral in position. Capillaries and small blood vessels were more prominent than in WAT. In general, BAT had the appearance of a sea of bubbles embedded in a pink cytoplasmic matrix.
The junction between WAT and BAT was relatively distinct, however, small clusters of mature WAT cells were found in BAT lobules and small foci of BAT cells were found in WAT lobules. Identification of these cells was uncertain. Questions were raised regarding their genotype, the accuracy of the phenotype and whether these were metaplastic cells and in which differential direction they were destined. These cells were simply classified as “transitional fat cells” for lack of more information.
BAT of Injury Groups
The BAT from all animals with burn injury, cutaneous wounds or cold stress showed sheets of homogeneous pink cells with a notable loss of the abundant clear bubbly vacuoles found in control BAT. At higher magnification these cells showed abundant pink granular cytoplasm which contained many tiny clear vacuoles. The microscopic appearance of the junction of WAT and BAT lobules was similar to those found in the control mice with small numbers of transitional fat cells. Representative examples of H&E sections of WAT, BAT from control animals and BAT from the three treatment groups are shown in Figure 2.
Figure 2.
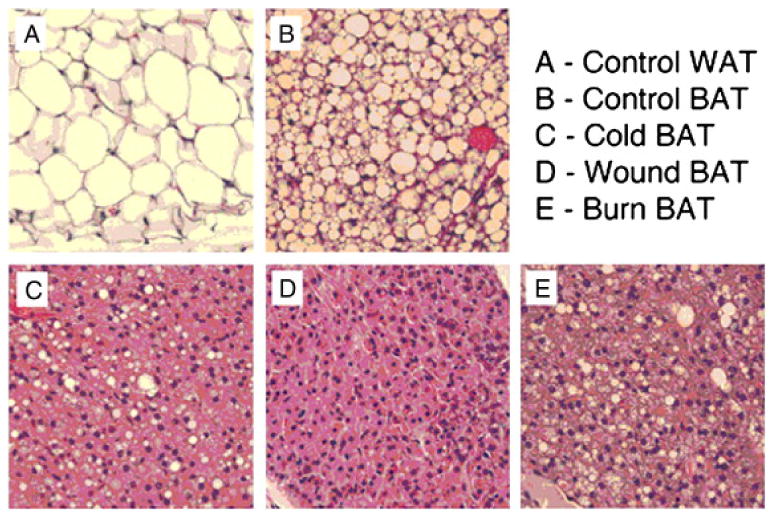
Representative H & E sections of WAT and BAT from sham control animals and BAT from mice subjected to burn injury, cutaneous wound and cold stress.
The % lipid content in these cells is shown in Figure 3. ANOVA revealed a highly significant effect of condition. F4,29 = 789.89; p<0.00001. The lipid content of WAT from sham treated animals was significantly greater than BAT from sham treated animals, burned animals, cold-stressed animal or animals with cutaneous wounds (p<0.0001). Lipid content of BAT from sham treated animals was greater than in any of the three treatment groups (p<0.0001). Lipid content of BAT from burned animals was greater than in animals with cold stress or cutaneous wound (p<0.01). Lipid content of BAT from cold-stressed animals was greater than in animals with cutaneous wound (p<0.05). In general, there was no definite evidence for expansion or reduction of either WAT or BAT lobules after injury.
Figure 3.
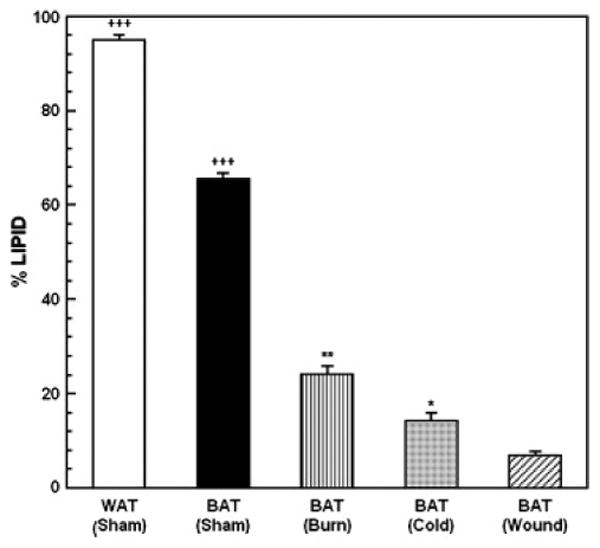
Percent lipid content of WAT and BAT from sham control animals and BAT from mice subjected to burn injury, cutaneous wound and cold stress. Each value is the mean ± sem for 6 animals. ***p<0.001 vs. all other groups, +++p<0.0001 vs. BAT in mice with burn injury, cold-stress and cutaneous wound, **p<0.01 vs. mice with cold-stress and cutaneous wound, *p<0.05 vs. mice with cutaneous wound.
Effect of Burn Injury, Cold stress and Cutaneous wound on UCP-1 mRNA expression in BAT
UCP-1 expression in BAT from sham controls and animals subjected to burn injury, cutaneous wound and cold stress is illustrated in Figure 4. Analysis of variance revealed a highly significant main effect of stress vs. sham treatment, F3,19; p<0.00001. Compared with sham treated animals UCP-1 expression was significantly (p<0.0001) elevated in animals subjected to the three stressors. The increases in UCP-1 expression produced by the cold stress and cutaneous wound were significantly (p<0.001) greater than that produced by burn injury. However the elevation of mRNA UCP-1 expression produced by cutaneous wound and cold were not significantly different.
Figure 4.
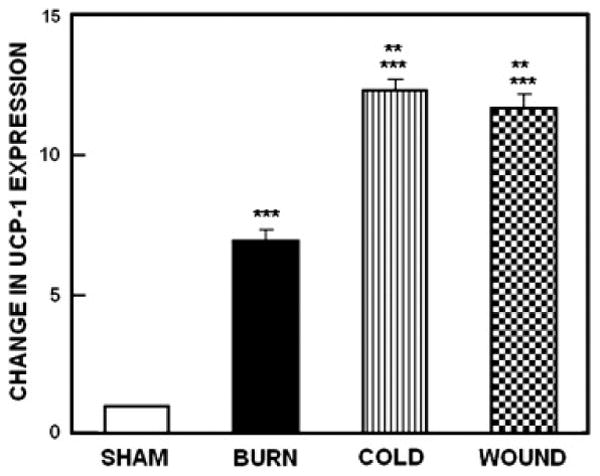
Expression of mRNA for UCP-1 from sham control animals and mice subjected to burn injury, cutaneous wound and cold stress. Each value is the mean ± sem for 5 animals. *p <0.0001 vs. sham treated control mice.
Effect of Burn Injury, Cold stress and Cutaneous Wound on Rectal Temperature
Burn injury increased the rectal temperature of the mice significantly (p < 0.001). while cold stress decreased the rectal temperatures (p < 0.01). Rectal temperatures of the cutaneous wound animals were not different from the shams. By ANOVA analysis, the burn and cold groups were different from the sham and cutaneous wound groups.
Effect of Burn Injury, Cold stress and Cutaneous Wound on BAT metabolism
As indicated in Figures 5-7, exposure to burn injury, cold stress or cutaneous wound increased BAT uptake of 18FDG (∼10-fold) (Figure 5), 18FCPHA (∼4-fold) (Figure 6) and 3H acetate (∼3-fold) (Figure 7). Similar changes in substrate uptake by WAT were not observed (data not shown).
Figure 5.
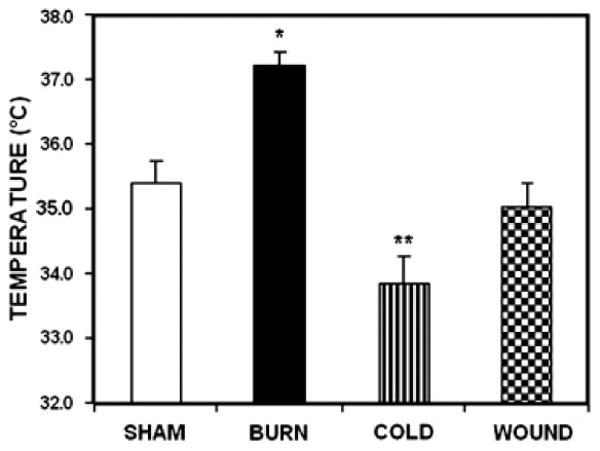
Effect of Burn Injury, Cold stress and Cutaneous Wound on Rectal Temperature. Each value is the mean ± SEM for 6 animals. *p <0.0001 vs. sham treated control mice.
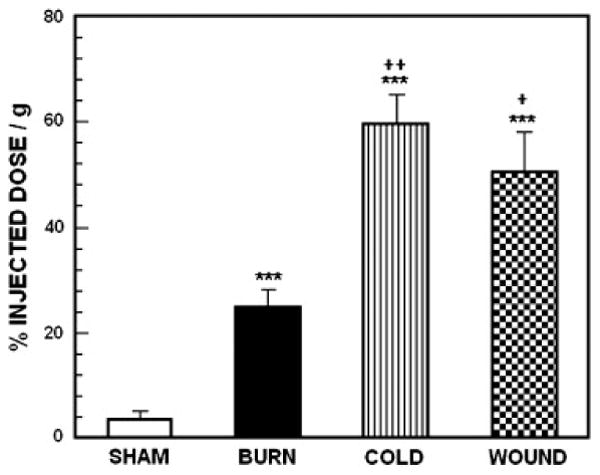
Figure 7.
Accumulation of 18F labeled FCPHA in BAT from sham control animals and mice subjected to burn injury, cutaneous wound and cold stress. Each value is the mean ± sem for 6 animals. . ***p<0.0001 vs. sham treated control mice, ++p<0.005 vs. mice with burn injury, + p<0.05 vs. mice with cutaneous wound.
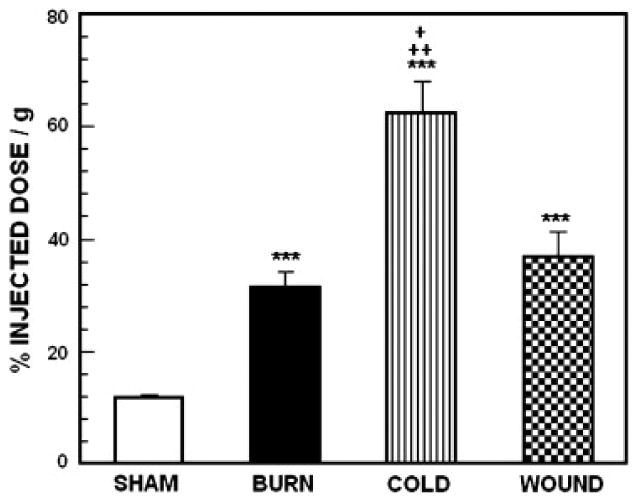
Figure 6.
Accumulation of 18F labeled FDG in BAT from sham control animals and mice subjected to burn injury, cutaneous wound and cold stress. Each value is the mean ± sem for 6 animals. ***p<0.0001 vs. sham treated control mice, ++p<0.005 vs. mice with burn injury, +p<0.05 vs. mice with burn injury.
For 18FDG, ANOVA revealed a highly significant main effect of treatment on tracer uptake by BAT, F3,23 = 23.94; p<0.0001. Compared with sham treated control mice, uptake was significantly increased by all three treatments (p<0.0001). Compared with burned animals, uptake was significantly increased in cold-stressed animals (p<0.005) and animal with cutaneous wounds (p<0.05). For 18FCPHA, the pattern of uptake across stressors was very similar to the pattern with 18FDG. For 18FCPHA, ANOVA revealed a highly significant main effect of treatment on tracer uptake by BAT, F3,23 = 28.11; p<0.0001. Compared with sham treated control mice, uptake was significantly increased by all three treatments (p<0.0001). Cold stressed mice had significantly higher uptake than either burned animals (p<005) or animal with cutaneous wounds (p<0.05). For 3H acetate, as with the other substrates, ANOVA revealed a highly significant main effect of treatment on tracer uptake by BAT, F3,23 = 17.14; p<0.0001. As with 18FDG and 18FCPHA, uptake was significantly increased by burn injury (p<0.0001), cold-stress (p<0.005) and cutaneous wound (p<0.0001). However there was no difference in uptake between stressors.
μPET Imaging
As illustrated in Figure 8 18F-FDG μPET imaging demonstrated intense focal uptake at sites of BAT after cold stress. Uptake in BAT was so intense that it was associated with significant reductions in uptake by all other tissues, including brain. Similar images were obtained for mice with burn injury and cutaneous wounds. No such areas of intense FDG uptake were observed in sham treated control mice.
Figure 8.

Accumulation of 3H labeled acetate in BAT from sham control animals and mice subjected to burn injury, cutaneous wound and cold stress. Each value is the mean ± sem for 6 animals. ***p<0.0001 vs. sham treated control mice, ***p<0.005 vs. sham treated control mice,
Discussion
Adipose tissue is an important endocrine regulator of glucose metabolism and energy homeostasis (Bukowiecki 1985). In rodents under physiological insulin stimulation, it has been reported that BAT contributes up to 10% of the total glucose turnover (Bukowiecki et al. 1982; Bokowiecki et al 1986).
In the present study, we examined the effects of burn injury, cold stress and cutaneous wound on the gross and microscopic characteristics of BAT and the effects of these stressors on the uptake of three tracers of energy metabolism [18FDG (glycolysis), 18FCPHA (fatty acid utilization), and 3H-acetate (TCA cycle activity)]. The BAT of all mice subjected to burn, cold stress and cutaneous wounds demonstrated definite gross and microscopic changes. This study demonstrated strong associations between the three stressors and BAT darkening, loss of lipid content, increase in stainable pink cytoplasm (assumed to be increased concentrations of mitochondria). Previous studies, at the electron microscopic level, have demonstrated that cold stress to rats leads to a reduction in fat droplet size and a 40% increase in mitochondrial diameter in BAT in 24 hrs (Tompson et al. 1969). The BAT of all mice subjected to burn, cold stress and cutaneous wounds also demonstrated significant increases in mRNA for UCP-1. In previous studies, UCP-1 mRNA expression has been shown to be stimulated by ∼6 fold after 24 hrs of cold exposure to mice (Sharara et al. 2010), similar to our findings.
These morphological and UCP-1 mRNA changes were associated with marked increased in BAT metabolism as demonstrated by the biodistribution studies with all three tracers of energy metabolism. The BAT of stressed mice had extremely high uptake of 18FDG per gram of tissue. This was demonstrated dramatically by μPET (Figure 8) where marked uptake of 18FDG by BAT was associated with significant reduction in uptake in all other tissues, including brain.
As illustrated by the kinetic model depicted in Figure 9, when 18FDG is injected, it is transported from plasma into cells according to the rate constant K1, transported back into plasma with the rate constant k2, phosphorylated with a rate constant k3 and dephosphorylated with a rate constant k4. Since it has been demonstrated that dephosphorylation of deoxyglucose is extremely low in BAT (Ferre et al. 1986), the differential equations described by the model can be solved to yield the following relationship for the rate of glucose metabolism (MRGlc, μmole/min/g):
Figure 9.
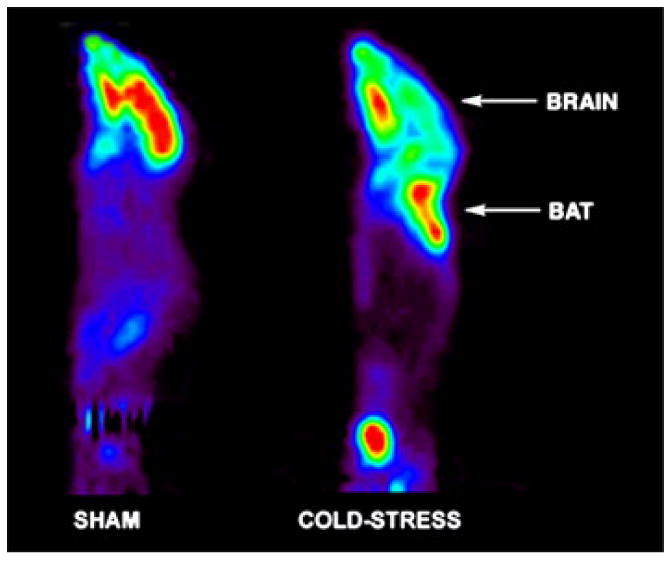
Representative μPET images of a mouse after cold-stress, illustrating intense 18FDG uptake in regions of BAT.
Where, Cp is the concentration 18FDG in plasma and LC is the “Lumped Constant”; a dimensionless parameter that corrects for differences in the kinetic behavior of 18FDG and endogenous glucose.
Since it has been shown that k3 is very high in activated BAT (k3 ≫k2) (Holness et al. 1991) and that the LC is not affected by stress conditions (Greco-Perotto et al. 1987), MRGlc is expected to be proportional to K1.which is primarily dependent on the concentration of glucose transporters and blood flow. Previous studies have demonstrated that the number of BAT associated glucose transporters is increased, Hill coefficient is increased and Kd is decreased by cold stress (Greco-Perotto et al. 1987), In addition, μ sphere measurements of blood flow to BAT have shown that flow is increased to up to 11 ml/min/g after cold-stress (Foster and Frydman 1978; Weber 2004). In contrast to the μ sphere results, studies of the effect of cold stress on blood flow to BAT with SPECT tracers (201Tl, 99mTc sestimibi and 99mTc tetrofosmin) revealed only modest increases in uptake (Baba et al. 2007; Fukuchi et al. 2003; Carter et al. 2005; Tatsumi et al. 2004). However, these results must be interpreted with caution since uptake and trapping of 99mTc sestimibi and 99mTc tetrofosmin is mediated by mitochondria (Piwanica-Worms et al. 1994) and uptake of 201Tl is affected by membrane potential (Higuchi et al. 2004) which is also affected by mitochondrial function. Thus the alterations in mitochondrial function that are manifested in BAT after cold-stress may make these tracers less than ideal markers of blood flow to BAT. Despite these results with SPECT tracers, the μ sphere measurements of blood flow and the observations about glucose transporters (Greco-Perotto et al. 1987; Foster and Frydman 1978) clearly establish K1 mediated effects as a dominant mechanism for the dramatic increase in FDG uptake by BAT after cold-stress. Although the effects observed after burn injury and cutaneous wounds are likely to be mediated by the same or similar mechanism these issues require further investigation with μ sphere measurements; these studies are currently in progress in our laboratory. Whether activated BAT may potentially be a significant glucose-clearing organ under stress conditions, was not evaluated in this study. This issue is currently an area of active investigation in our laboratory.
A kinetic model for tissue uptake of 18FCPHA has not as yet been established. However, studies in our laboratory with other fatty acid analogues that are also trapped at the first step of β-oxidation have revealed that a kinetic model very similar to the 18FDG model can be applied for data analysis (Elmaleh et al. 1994). Thus 18FCPHA uptake by BAT under stress conditions may be mediated by the same or similar mechanism(s) as 18FDG uptake. Although 18FCPHA uptake after stress achieved similar levels to 18FDG uptake under stress conditions the increase in 18FCPHA uptake produced by the three stressors was less dramatic than the increase in 18FDG uptake. This is most likely due to the higher baseline uptake of 18FCPHA in sham treated control animals. This is consistent with the importance of fatty acids in basal metabolism of BAT and a role of glucose both as a source of carbon for fatty acid synthesis and as a direct source of energy via its oxidation under stress conditions (Ferre et al. 1986; Holness et al. 1991).
The observed increase in acetate uptake under the stress conditions is consistent with increased TCA cycle flux initiated by increased glucose and fatty acid uptake. However, it should be noted that the stimulation by the three stresses was the smallest compared to 18FDG and 18FCPHA. This probably is related to the high rates of acetate uptake in the normal unstressed conditions because of the relative ease with which the acetate molecule can enter the TCA cycle flux.
The uptake of glucose by BAT is stimulated by insulin (Valverde and Benito 2005). In rodents under physiological insulin stimulation, it has been reported that BAT contributes up to 10% of the total glucose turnover (Cannon and Nedergaard 2004; Bukowiecki 1985; Bukowiecki et al. 1982; Bukowiecki et al. 1986). It has also been reported that BAT activated by cold stress is responsible for more than one-half of total bodily oxygen consumption in rodents (Cannon and Nedergaard 2004). Studies in our laboratory are currently directed to determine the role of the activated BAT in the increased oxygen consumption associated with burn injury.
BAT is also considered to be important in insulin resistance which is a condition where there is the inability of insulin to lower glucose levels (Valverde and Benito 2005). Burn injury has been shown to produce insulin resistance in patients with burn injury (Gauglitz et al. 2009), burned rats (Carter et al. 2004), burned mice (Zhang et al. 2005) and burned rabbits (this laboratory, manuscript in preparation). The mechanism for insulin resistance after burn injury appears to be related, at least in part, to increased phosphorylation of the key insulin signaling protein, IRS-1, produced by the activation of stress kinase enzymes in muscle and liver. These same pathways (IRS-1 and stress kinases) exist in BAT. One of the main functions of BAT is to produce heat (Cannon B and Nedergaard 2004). In the studies presented here, we did not find a consistent relationship between increased BAT metabolic activity, as assessed by uptake of substrates, and core rectal temperatures of the stressed animals. We did see an elevation of rectal temperatures in the burned animals compared to shams, confirming a previous report in burned rats (Strome et al. 1986). We also found that the cold stress reduced rectal temperatures in the animals compared to shams, confirming previous work (Connolly et al. 1982) who used the same cold stress (4°C, 24 hrs) Whether the increased substrate uptake of the three stresses observed in this study is associated with increased BAT temperature was not determined since this would have required the animals to be anesthetized so that a thermal probe could be surgically inserted directly into the BAT. Since anesthesia changes the uptake of 18FDG in particular, these BAT temperature measurements were not made.
The mechanism(s) for activation of BAT thermogenesis are assumed to be through the sympathetic nervous system (Bartness et al. 2010). Burn injury has been shown to elevate epinephrine and norepinephrine levels (Crum et al. 1988) as does cold exposure (Nakamoto 1990). In the present study, we did not measure epinephrine or norepinephrine levels in the stressed animals, however, Wahl and his coworkers demonstrated that anesthesia or exposure to cold increased 18FDG uptake in BAT of rats 14 fold or 4.9 fold in rats, compared to unstimulated controls (Tatsumi et al. 2004). This stimulation was significantly decreased to less than 30% of the control after propranolol or reserpine treatment. These data are consistent with the role of norepinephtrine and the involvement of the nerve terminals on BAT, and the role of adrenergic involvement in the models used in that study. The mechanism(s) by which the three stresses used in this study activated 18FDG uptake by BAT has been examined in preliminary studies (Carter et al. 2006). Adrenalectomy was performed on mice and after recovery, the animals were subjected to the same three stresses used here. Adrenalectomy did not affect the increased BAT uptake of 18FDG associated with the cutaneous wound, but reduced the effect of cold stress and completely abolished the effect of burn injury on BAT uptake of 18FDG. These findings suggest that adrenal factors play a role in cold and burn induced stimulation of 18FDG uptake by BAT , but that there may not be a direct involvement of adrenal factors in the increased uptake BAT 18FDG uptake caused by cutaneous wound.
In summary, our present studies suggest that three types of stress conditions, burn injury, cold stress, and cutaneous wound, activate BAT in mice. This activation was accompanied by macroscopic, microscopic and biochemical changes in BAT function. The detailed biochemical and molecular mechanism(s) mediating this activation and the significance of these changes definitely warrant further investigation.
Figure 10.
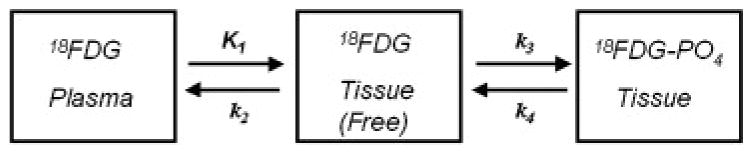
Kinetic model for 18FDG transport and metabolism. When 18FDG is injected, it is transported from plasma into cells according to the rate constant K1, transported back into plasma with rate constant k2, phosphorylated with rate constant k3 and dephosphorylated with rate constant k4. For BAT there is minimal dephosphorylation and k4 is close to zero.
Acknowledgments
This work was supported in part by grants from the National Institutes of Health (2P50 GM21700-27A) and Shriners Hospitals for Children.
Footnotes
Conflict of Interest Statement: The authors declare that there are no conflicts of interest.
References
- Au-Yong IT, Thorn N, Ganatra R, Perkins AC, Symonds ME. Brown adipose tissue and seasonal variation in humans. Diabetes. 2009;58(11):2583–87. doi: 10.2337/db09-0833. [DOI] [PMC free article] [PubMed] [Google Scholar]
- Baba S, Engles JM, Huso DL, Ishimori T, Wahl RL. Comparison of uptake of multiple clinical radiotracers into brown adipose tissue under cold-stimulated and nonstimulated conditions. J Nucl Med. 2007;48(10):1715–23. doi: 10.2967/jnumed.107.041715. [DOI] [PubMed] [Google Scholar]
- Bartness TJ, Vaughan CH, Song CK. Sympathetic and sensory innervation of brown adipose tissue. Int J Obes. 2010;34(Suppl 1):S36–42. doi: 10.1038/ijo.2010.182. [DOI] [PMC free article] [PubMed] [Google Scholar]
- Bukowiecki LJ, Collet AJ, Follea N, Guay G, Jahiah L. Brown adipose tissue hyperplasia: a fundamental mechanism of adaptation to cold and hyperphagia. Am J Physiol Endocrinol Metab. 1982;242:E353–58. doi: 10.1152/ajpendo.1982.242.6.E353. [DOI] [PubMed] [Google Scholar]
- Bukowiecki LJ. Regulation of energy expenditure in brown adipose tissue. Int J Obes. 1985;9(Suppl 2):31–41. [PubMed] [Google Scholar]
- Bukowiecki LJ, Geloen A, Collet AJ. Proliferation and differentiation of brown adipocytes from interstitial cells during cold acclimation. Am J Physiol. 1986;250(6 Pt 1):C880–887. doi: 10.1152/ajpcell.1986.250.6.C880. [DOI] [PubMed] [Google Scholar]
- Cannon B, Nedergaard J. Brown adipose tissue: function and physiological significance. Physiol Rev. 2004;84:277–359. doi: 10.1152/physrev.00015.2003. [DOI] [PubMed] [Google Scholar]
- Cannon B, Nedergaard J. Brown adipose tissue: function and physiological significance. Physiol Rev. 2004;84:277–359. doi: 10.1152/physrev.00015.2003. [DOI] [PubMed] [Google Scholar]
- Carter EA, Burks D, Fischman AJ, White M, Tompkins RG. Insulin resistance in thermally-injured rats is associated with post- receptor alterations in skeletal muscle, liver and adipose tissue. Int J Mol Med. 2004;14(4):653–58. [PubMed] [Google Scholar]
- Carter EA, Bonab AA, Pitman J, Babich JW, Kronauge JF, Tompkins RG, Fischman AJ. Metabolic substrates of brown adipose tissue metabolism. J Nucl Med. 2005;44:388P. [Google Scholar]
- Carter EA, McIntosh L, Cyr E, Tompkins R, Fischman A. Adrenalectomy suppresses FDG uptake by brown adipose tissue (BAT) after cold stress and acute burn, but not dermal wounds. J Nuc Med. 2006;47:344P. [Google Scholar]
- Crum R, Borrow B, Schackford S, Hansbrough J, Brown MR. The neurohormonal response to burn injury in patients resuscitated with hypertonic saline. J Trauma. 1988;28(8):1181–7. doi: 10.1097/00005373-198808000-00008. [DOI] [PubMed] [Google Scholar]
- Connolly E, Morrisey R, Carnie J. The effect of interscapular brown adipose tissue removal on body-weight and cold response in the mouse. Br J Nutr. 1986;47:653–58. doi: 10.1079/bjn19820077. [DOI] [PubMed] [Google Scholar]
- Cypess AM, Lehman S, Williams G, Tal I, Rodman D, Goldfine AB, Kuo FC, Palmer EL, Tseng YH, Doria A, Kolodny GM, Kahn CR. Identification and importance of brown adipose tissue in adult humans. N Engl J Med. 2009;360(15):1509–17. doi: 10.1056/NEJMoa0810780. [DOI] [PMC free article] [PubMed] [Google Scholar]
- Elmaleh DR, Livni E, Alpert NM, Strauss HW, Buxton R, Fischman AJ. Myocardial extraction of 1-[ 11C] betamethylheptadecanoic acid. J Nucl Med. 1994;35:496–503. [PubMed] [Google Scholar]
- Ferre P, Burnol AF, Leturque A, Terretaz J, Penicaud L, Jeanrenaud B, Girard J. Glucose utilization in vivo and insulin-sensitivity of rat brown adipose tissue in various physiological and pathological conditions. Biochem J. 1986;233(1):249–52. doi: 10.1042/bj2330249. [DOI] [PMC free article] [PubMed] [Google Scholar]
- Foster DO, Frydman ML. Nonshivering thermogenesis in the rat. II. Measurement of blood flow with microspheres point to brown adipose tissue as the dominant site of the calorigenesis induced by noradrenalin. Can J physiol Pharmacol. 1978;56:110–122. doi: 10.1139/y78-015. [DOI] [PubMed] [Google Scholar]
- Fukuchi K, Ono Y, Nakahata Y, Okada Y, Hayashida K, Ishida Y. Visualization of interscapular brown adipose tissue using 99mTc- tetrofosmin in pediatric patients. J Nucl Med. 2003;44(10):1582–85. [PubMed] [Google Scholar]
- Gauglitz GG, Herndon DN, Kulp GA, Meyer WJ, Jeschke M. Abnormal insulin sensitivity persists up to three years in pediatric patients post-burn. J Clin Endocrinol Metab. 2009;94(5):1656–64. doi: 10.1210/jc.2008-1947. [DOI] [PMC free article] [PubMed] [Google Scholar]
- Greco-Perotto R, Zaninetti D, Assimacopoulos-Jeannet F, Bobbioni E, Jeanrenaud B. Stimulatory effect of cold adaptation on glucose utilization by brown adipose tissue. Relationship with changes in the glucose transporter system. J Biol Chem. 1987;262(16):7732–36. [PubMed] [Google Scholar]
- Hamacher K, Coenen HH, Stocklin G. Efficient stereospecific synthesis of no-carrier-added 2-[18F]-fluoro- 2-deoxy-D-glucose using aminopolyether supported nucleophilic substitution. J Nucl Med. 1986;27(2):235–38. [PubMed] [Google Scholar]
- Higuchi T, Kinuya S, Taki J, Nakajima K, Ikeda M, Namura M, Tonami N. Brown adipose tissue: evaluation with 201Tl and 99mTc-sestamibi dual- tracer SPECT. Ann Nucl Med. 2004;18(6):547–49. doi: 10.1007/BF02984575. [DOI] [PubMed] [Google Scholar]
- Holness MJ, Liu YL, Beech JS, Sugden MC. Glucose utilization by interscapular brown adipose tissue in vivo during nutritional transitions in the rat. Biochem J. 1991;273(Pt 1):233–35. doi: 10.1042/bj2730233. [DOI] [PMC free article] [PubMed] [Google Scholar]
- Livak KJ, Schmittgen TD. Analysis of relative gene expression data using real-time quantitative PCR and the 2-ΔΔCT method. Methods. 2001;25:402–08. doi: 10.1006/meth.2001.1262. [DOI] [PubMed] [Google Scholar]
- Nakamoto M. Responses of sympathetic nervous system to cold exposure in vibration syndrome subjects and age-matched healthy controls. Int Arch Occup Environ Health. 1990;62(2):177–81. doi: 10.1007/BF00383595. [DOI] [PubMed] [Google Scholar]
- Piwnica-Worms DP, Kronauge JF, LeFurgey A, Backus M, Hockett D, Ingram P, Lieberman M, Holman BL, Jones AG, Davison A. Mitochondrial localization and characterization of 99Tc-SESTAMIBI in heart cells by electron probe X-ray microanalysis and 99Tc-NMR spectroscopy. Magn Reson Imaging. 1994;12(4):641–52. doi: 10.1016/0730-725x(94)92459-7. [DOI] [PubMed] [Google Scholar]
- Saito M, Okamatsu-Ogura Y, Matsushita M, Watanabe K, Nio-Kobayashi J, Yoneshiro T, Iwanaga T, Miyagawa M, Kameya T, Nakada K, Kawai Y, Tsujisaki M. High incidence of metabolically active brown adipose tissue in healthy adult humans: effects of cold exposure and adiposity. Diabetes. 2009;58(7):1526–31. doi: 10.2337/db09-0530. [DOI] [PMC free article] [PubMed] [Google Scholar]
- Sell H, Deshaies Y, Richard D. The brown adipocyte: update on its metabolic role. Int J Biochem Cell Biol. 2004;36(11):2098–2104. doi: 10.1016/j.biocel.2004.04.003. [DOI] [PubMed] [Google Scholar]
- Sharara-Chami R, Joachim M, Mulcahey M, Ebert S, Majzoub JA. Effect of epinetphrine deficiency on cold tolerance and brown adipose tissue. Mol Cell Endocrinol. 2010;328:34–9. doi: 10.1016/j.mce.2010.06.019. [DOI] [PubMed] [Google Scholar]
- Shoup TM, Elmaleh DR, Bonab AA, Fischman AJ. Evaluation of trans-9-18F-fluoro-3,4-Methyleneheptadecanoic acid as a PET tracer for myocardial fatty acid imaging. J Nucl Med. 2005;46(2):297–304. [PubMed] [Google Scholar]
- Strome D, Aulick L, Mason A, Pruitt B. Thermoreulatory and nonthermoregulatory heat production in burned rat. J Appl Physiol. 1986;61:686–93. doi: 10.1152/jappl.1986.61.2.688. [DOI] [PubMed] [Google Scholar]
- Tatsumi M, Engles JM, Ishimori T, Nicely O, Cohade C, Wahl RL. Intense 18F-FDG uptake in brown fat can be reduced pharmacologically. J Nucl Med. 2004;45(7):1189–93. [PubMed] [Google Scholar]
- Tompson JF, Habeck DA, Nance SL, Beetham KL. Ultrastructural and biochemical changes in borwn fat in cold-exposed rats. J Cell Biol. 1969;41:312–334. doi: 10.1083/jcb.41.1.312. [DOI] [PMC free article] [PubMed] [Google Scholar]
- Valverde AM, Benito M. The brown adipose cell: a unique model for understanding the molecular mechanism of insulin resistance. Mini Rev Med Chem. 2005;5(3):269–78. doi: 10.2174/1389557053175380. [DOI] [PubMed] [Google Scholar]
- Valverde AM, Benito M. The brown adipose cell: a unique model for understanding the molecular mechanism of insulin resistance. Mini Rev Med Chem. 2005;5(3):269–78. doi: 10.2174/1389557053175380. [DOI] [PubMed] [Google Scholar]
- Van Marken Lichtenbelt WD, Vanhommerig JW, Smulders NM, Drossaerts JM, Kemerink GJ, Bouvy ND, Schrauwen P, Teule GJ. Cold-activated brown adipose tissue in healthy men. N Engl J Med. 2009;360(15):1500–8. doi: 10.1056/NEJMoa0808718. [DOI] [PubMed] [Google Scholar]
- Virtanen KA, Lidell ME, Orava J, Heglind M, Westergren R, Niemi T, Taittonen M, Laine J, Savisto NJ, Enerback S, Nuutila P. Functional brown adipose tissue in healthy adults. N Engl J Med. 2009;360(15):1518–25. doi: 10.1056/NEJMoa0808949. [DOI] [PubMed] [Google Scholar]
- Weber WA. Brown adipose tissue and nuclear medicine imaging. J Nucl Med. 2004;45(7):1101–03. [PubMed] [Google Scholar]
- Zhang Q, Carter EA, Ma BY, White M, Fischman AJ, Tompkins RG. Molecular mechanism(s) of burn-induced insulin resistance in murine skeletal muscle: role of IRS phosphorylation. Life Sci. 2005;77(24):3068–77. doi: 10.1016/j.lfs.2005.02.034. [DOI] [PubMed] [Google Scholar]