

Abstract
The generation of reactive oxygen species (ROS) has been implicated in the pathogenesis of renal ischemia/reperfusion injury, and many other pathological conditions. DNA strand breaks caused by ROS lead to the activation of poly(ADP-ribose)polymerase-1 (PARP-1), the excessive activation of which can result in cell death. We have utilized a model in which 2,3,5-tris(glutathion-S-yl)hydroquinone (TGHQ), a nephrotoxic and nephrocarcinogenic metabolite of hydroquinone, causes ROS-dependent cell death in human renal proximal tubule epithelial cells (HK-2), to further elucidate the role of PARP-1 in ROS-dependent cell death. TGHQ-induced ROS generation, DNA strand breaks, hyperactivation of PARP-1, rapid depletion of nicotinamide adenine dinucleotide (NAD), elevations in intracellular Ca2+ concentrations, and subsequent nonapoptotic cell death in both a PARP- and Ca2+-dependent manner. Thus, inhibition of PARP-1 with PJ34 completely blocked TGHQ-mediated accumulation of poly(ADP-ribose) polymers and NAD consumption, and delayed HK-2 cell death. In contrast, chelation of intracellular Ca2+ with BAPTA completely abrogated TGHQ-induced cell death. Ca2+ chelation also attenuated PARP-1 hyperactivation. Conversely, inhibition of PARP-1 modulated TGHQ-mediated changes in Ca2+ homeostasis. Interestingly, PARP-1 hyperactivation was not accompanied by the translocation of apoptosis-inducing factor (AIF) from mitochondria to the nucleus, a process usually associated with PARP-dependent cell death. Thus, pathways coupling PARP-1 hyperactivation to cell death are likely to be context-dependent, and therapeutic strategies designed to target PARP-1 need to recognize such variability. Our studies provide new insights into PARP-1-mediated nonapoptotic cell death, during which PARP-1 hyperactivation and elevations in intracellular Ca2+ are reciprocally coupled to amplify ROS-induced nonapoptotic cell death.
Keywords: 2,3,5-tris(glutathion-S-yl)hydroquinone; HK-2 cells; reactive oxygen species; poly(ADP-ribose)polymerase-1; apoptosis-inducing factor; intracellular Ca2+
Mechanisms of cell death are usually classified into two pathways, apoptosis and necrosis/oncosis. Apoptosis is a genetically controlled process, requiring the coordinated suppression and expression of key genes, and is characterized by an orchestrated series of processes that can be separated into two general phases, the “commitment” phase and the “execution” phase. In addition, apoptosis requires energy, and usually involves the participation of individual, noncontiguous cells. It has generally been considered that oncosis/necrosis is a passive process, with the cell responding to external stress in an uncoordinated, random fashion, dependent upon the nature of the specific stress. However, it is now evident that mechanisms of cell death extend beyond the simple apoptosis/necrosis relationship to include regulated modes of cell death that do not readily fit either of the classic descriptors of cell death. Recognition of these other modes of regulated, nonapoptotic (classic definition) cell death has important implications for human health and disease (Degterev and Yuan, 2008).
Three modes of nonapoptotic, orchestrated cell death: (1) autophagic cell death, (2) necroptosis, and (3) poly(ADP-ribose)polymerase-1 (PARP-1)-mediated cell death (Degterev and Yuan, 2008), each have their own unique biochemical and morphological features. More importantly, each mode of nonapoptotic cell death plays important roles in pathophysiology. Autophagy has been observed in a number of disease models, including mouse models of heart ischemia/reperfusion injury (Matsui et al., 2007). Administration of the necroptosis inhibitor Nec-1, provides significant tissue protection and functional improvements in a variety of acute tissue injuries in mouse models of heart ischemia/reperfusion injury, by mechanisms that are clearly distinct from the inhibition of apoptosis (Smith et al., 2007). Excessive poly(ADP-ribosyl)ation in response to DNA damage can also lead to cell death in a number of situations, including stroke, traumatic brain injury, and ischemia/reperfusion injury of various organs (Andrabi et al., 2008). Thus, PARP-1 inhibitors can provide protection in rat models of ischemia/reperfusion injury (Martin et al., 2000), inflammatory diseases (Miesel et al., 1995), neurodegeneration (Cosi and Marien, 1999), and diabetes (Pieper et al., 1999a). Moreover, there appears to be a degree of overlap between these different modes of cell death, and particularly between the necroptotic and PARP-1-mediated processes.
The generation of ROS has been implicated in the pathogenesis of renal ischemia/reperfusion injury, and many other pathological conditions. DNA strand breaks caused by ROS lead to the activation of PARP, the excessive activation of which results in the depletion of both NAD and ATP (Pieper et al., 1999b). Inhibitors of PARP protect against hydrogen peroxide mediated cell death (Cristovao and Rueff, 1996). Deletion of PARP also protects against ischemic brain injury (Endres et al., 1997), myocardial ischemia (Zingarelli et al., 1998), inflammation elicited by a variety of mediators (Oliver et al., 1999; Szabo et al., 1997), and streptozocin-induced diabetes (Burkart et al., 1999; Pieper et al., 1999a). By extension, it has been predicted the PARP inhibitors may have therapeutic benefit (Virag and Szabo, 2002). Consistent with this hypothesis, PARP inhibition or gene deletion attenuates tissue injury associated with stroke, myocardial infarct, and diabetic pancreatic damage (Burkart et al., 1999; Endres et al., 1997; Zingarelli et al., 1998).
We recently reported that 2,3,5-tris(glutathion-S-yl)hydroquinone (TGHQ), a ROS-generating nephrotoxic and nephrocarcinogenic metabolite of hydroquinone (HQ) (Lau et al., 2001), caused apoptotic cell death in human promyelocytic leukemia (HL-60) cells (Zhang et al., 2012). Moreover, TGHQ-induced apoptosis of HL-60 cells was accompanied by the activation of PARP-1 and caspases, and by the nuclear translocation of apoptosis-inducing factor (AIF). We now show that TGHQ-induced cell death in human renal proximal tubule epithelial cells (HK-2) is nonapoptotic in nature. Moreover, although the cell death of HK-2 cells is PARP-dependent, it occurs in the absence of AIF translocation from the mitochondria to the nucleus. Thus, the mode of cell death induced by TGHQ and the roles of PARP activation may be different in different cell types. This is of direct relevance to pharmacological targeting of the PAR pathway for modulation of tissue damage, pointing to the importance of raising an awareness of potential tissue-specific effects that may be obtained with PARP inhibitors. Because prior studies have shown that oxidative stress can also disrupt intracellular Ca2+ ([Ca2+]i) homeostasis, leading to cell injury or even cell death (Bellomo et al., 1982; Richter and Kass, 1991), we also investigated the role of [Ca2+]i in HK-2 cell death. Our data reveal an intriguing interplay between PARP and [Ca2+]i, in that elevations in [Ca2+]i are coupled to PARP-1 hyperactivation, and that inhibition of PARP attenuates the [Ca2+]i response.
MATERIALS AND METHODS
Chemicals and reagents
TGHQ was synthesized and purified in our laboratory as previously described (Lau et al., 1988). TGHQ is nephrotoxic and nephrocarcinogenic in rats and therefore must be handled with protective clothing and in a ventilated hood. BAPTA-AM and PJ34 [N-(6-oxo-5,6-dihydro phenanthridin-2-yl)-N,N-dimethylacetamide], a selective PARP inhibitor, were obtained from Calbiochem (Gibbstown, NJ). Antibodies for phospho-histone H2AX (Ser139), H2AX, PARP, caspase-3, and cleaved caspase-3 were purchased from Cell Signaling Technology (Danvers, MA). The antibody for poly(ADP-ribose) was from Biomol International (Plymouth Meeting, PA). DAPI (4′,6-diamidino-2-phenylindole, dihydrochloride), H2DCFDA-AM (5-(and-6)-carboxy-2′,7′-dichlorodihydrofluorescein diacetate), and Fura-2-AM [5-oxazole-carboxylic-acid,2-(6-(bis(carboxymethyl)amino)-5-(2-(2-(bis(carboxymethyl)amino)-5-methyl-phenoxy-ethoxy)-2-benzofuranyl)-, pentapotassium salt] were purchased from Invitrogen (Carlsbad, CA). All other chemicals were purchased from Sigma (St Louis, MO).
Cell culture
HK-2 cells, an immortalized proximal tubule epithelial cell line from normal adult human kidney, were obtained from the American Type Culture Collection (Manassas, VA). The cells were cultured in Keratinocyte serum free medium (K-SFM) supplied with 0.05 mg/ml bovine pituitary extract and 5 ng/ml epidermal growth factor at 37°C in a humidified atmosphere of 5% CO2.
Assay of cell viability
To determine the viability of HK-2 cells after treatment with various agents, cells were seeded in 96-well plates at a density of 1 × 10⁴ cells/well, and grown to ∼80% confluence. Cells were then washed twice with Dulbecco's Modified Eagle's Medium (DMEM) without phenol red containing 25mM 4-(2-hydroxyethyl)-1-piperazineethanesulfonic acid (HEPES) and treated with 400μM TGHQ with or without inhibitors. Cell viability was assessed with the mitochondrial dehydrogenase activity assay according to the manufacturer's instructions (Promega, Madison, WI), in which a tetrazolium compound, 3-(4,5-dimethylthiazol-2-yl)-5-(3- carboxymethoxyphenyl)-2-(4-sulfophenyl)-2H-tetrazolium (MTS), is reduced into a formazan product. After incubation with TGHQ, cells were washed twice with DMEM/HEPES, and then 20 μl MTS solution were added to 100 μl DMEM/HEPES and incubated for 2 h at 37°C. The absorbance of the formazan at 490 nm was measured directly from 96-well plates using a microplate reader.
Measurement of ROS generation
Formation of ROS was measured via the reduction of nonfluorescent H2DCFDA-AM to fluorescent 2′,7′-dichlorofluorescein (DCF) with confocal microscopy. Cells were seeded on Delta T dishes (Bioptech, Butler, PA) at 1 × 10⁵ cells/dish and cultured for 24 h. Cells were incubated with 10μM H2DCFDA-AM for 30 min before exposure to TGHQ, and then washed with DMEM/HEPES and treated with TGHQ (400 and 800μM) in the presence or in the absence of PJ34 (10μM). Cells were imaged using a Zeiss LSM 510 confocal microscope (Carl Zeiss Microimaging Inc., Thornwood, NY) with a ×40 dipping lens. During the experiment, culture dishes were maintained at 37°C by attachment to a Delta TC3 temperature controller (BiopTechs, Butler, PA). Following exposure of cells to TGHQ, images were captured every 5 min for a total of 25 min. Changes in the fluorescence intensity of H2DCFDA-AM were analyzed by software available with the Zeiss confocal microscope.
Histone extraction
HK-2 cells were washed and lysed in ice-cold low-salt buffer (10 mM Tris·HCl [pH 7.4], 10mM NaCl, 2.5mM EDTA) with 0.25mM sucrose, 1% Triton X-100, 5mM sodium pyrophosphate, 10mM sodium glycerophosphate, 50mM NaF, 1mM Na3VO4, 1mM PMSF and complete protease inhibitor tablet. Histones were extracted with 0.25M HCl overnight at 4°C and then precipitated in 20% trichloroacetic acid on ice for 1 h. The pellet was washed with 0.25M HCl in acetone and finally with acetone only. Pellets were dried in air and subjected to Western blot analysis.
Western blot analysis
Approximately 1 × 10⁶ cells were lysed in buffer containing 20mM Tris·HCl (pH 7.4), 150mM NaCl, 1mM Na2EDTA, 1mM EGTA, 1% Triton X-100 as well as 5mM sodium pyrophosphate, 10mM sodium glycerophosphate, 50mM NaF, 1mM Na3VO4, 1mM PMSF and complete protease inhibitor tablet. Following sonication, cell lysates were centrifuged to remove cell debris. Protein concentrations were determined with detergent-compatible reagent (Bio-Rad Laboratories, Hercules, CA). Samples were incubated with sample buffer (125mM Tris·HCl [pH 6.8], 86mM 2-mercaptoethanol, 4% SDS, 10% glycerol [vol/vol], and 0.2 mg/ml bromophenol blue) for 5 min in 100°C, and then resolved in 10% SDS-polyacrylamide gels. After electrophoresis, proteins were transferred to polyvinylidene fluoride (PVDF) Immobilon-P membranes (Millipore, Billerica, MA). Membranes were stained with 0.2% Ponceau S to assure equal loading of samples. After blocking with 5% nonfat milk in Tris-buffered saline with 0.5% Tween 20 (TBS-T), membranes were incubated with primary antibody overnight at 4°C and then incubated with secondary antibody coupled with horseradish peroxidase for 1 h at room temperature. Immunoblots were developed with enhanced chemoluminescence (ECL) reaction (Amersham, Piscataway, NJ) and exposed to X-ray film.
Immunofluorescent staining
HK-2 cells were plated on cover slides in 6-well plates at a density of 2 × 10⁵ cells/well and grown for 48 h (∼80% confluence) before treatment. Cell monolayers were treated, rinsed twice with ice-cold phosphate buffered saline (PBS), and fixed with 4% para-formaldehyde for 15 min at room temperature. Cells were then washed three times with PBS and permeabilized with acetone for 10 min at −20°C. Subsequently, monolayers were blocked with blocking solution containing 10% goat serum and 1% bovine serum albumin (BSA) in PBS at room temperature for 1 h and washed with PBS three times. Cells were incubated with anti-phospho-H2AX in 1% BSA in PBS at 4°C overnight, washed three times with PBS, and then incubated with goat antirabbit IgG Alexa 488 (Molecular Probe/Invitrogen, Carlsbad, CA) in 1% BSA in PBS at room temperature for 1 h. Cells on the cover slides were washed three times in PBS and mounted for 20 min with Prolong gold antifade reagent with DAPI at room temperature and viewed under a fluorescent microscope.
Annexin-V/propidium iodide staining and flow cytometry
HK-2 cells were cultured on 100 mm2 dishes at 1 × 10⁶ cells/dish. Cells were treated with chemicals with or without inhibitors for 24 h after (∼80% confluence) seeding. Cells were then trypsinized and washed with PBS. Subsequently, cells were incubated in 100 μl binding buffer (10mM HEPES [pH 7.4], 140mM NaCl, and 2.5mM CaCl2) containing 20 μl Annexin V-FITC and 10 μg/ml propidium iodide (PI) for 15 min in the dark. Cells were analyzed immediately after incubation by flow cytometry.
Determination of total NAD content
Cells were seeded on 35 mm2 dishes at 2 × 10⁵ cells/dish and cultured for 48 h. Cells were pretreated with or without PJ34 (10μM) for 30 min before TGHQ treatment. Total intracellular NAD concentrations were extracted by addition of 1.0M HClO4 to dishes of cells on ice. Cell extracts were neutralized to pH 7.0 by addition of 2M KOH/0.66M KH2PO4. NAD concentrations were determined by enzymatic cycling assays as described (Jacobson and Jacobson, 1997).
Cellular ATP assay
HK-2 cells were seeded in opaque-walled 96-well plates at a density of 5000 cells/well and allowed to grow for 48 h. Cells were treated with test compound. At various time points, ATP content per well was determined using the CellTiter-Glo luminescent assay (Promega) according to the manufacturer's instructions. Luminescence was measured directly from 96-well plates using a microplate reader and differences expressed as means ± SEs (n = 3).
DNA fragmentation analysis
Apoptotic DNA fragmentation in HK-2 cells was determined using the Quick Apoptotic DNA Ladder Detection Kit (Invitrogen). Briefly, following pretreatment with PJ34 (10μM) for 30 min, cells were treated with 400μM TGHQ. Medium containing TGHQ was replaced by normal culture medium after 4-h TGHQ treatment. After 24-h incubation, cells were trypsinized, harvested by centrifugation and then washed with PBS. DNA fragments were extracted according to the manufacturer's instructions. Finally, DNA fragments were visualized following electrophoresis on a 1% agarose gel.
Live cell imaging of intracellular Ca2+
HK-2 cells were plated on collagen coated cover slides in 4-well plates at a density of 2 × 10⁴ cells/well and grown for 48 h (∼80% confluence) before measurement. Cells were rinsed once with DMEM without phenol red containing 25mM HEPES, and then loaded with the Ca2+-sensitive fluorescent indicator, Fura-2-AM (5μM), in DMEM/HEPES for 45 min at room temperature. Cells were rinsed once in DMEM/HEPES and incubated for an additional 20 min to allow for hydrolysis of the AM-ester. Cells were treated with various concentrations of TGHQ in the presence or in the absence of inhibitors. Cells were imaged with an Olympus IX70 microscope after alternating excitation at 340 and 380 nm by a 75 W Xenon lamp linked to a Delta Ram V illuminator (Photon Technologies Inc. (PTI), Monmouth Junction, NJ) and a gel optic line. Images of emitted fluorescence above 505 nm were recorded by an ICCD camera. The imaging system was under software control (ImageMaster, PTI). Images were collected after the indicated treatments and then fluorescence intensity of fold increase in Fura-2 were analyzed. Intracellular Ca2+ concentrations were calculated by ratiometric analysis of Fura-2 fluorescence.
Statistical analysis
Statistical differences between the treated and control groups were determined by Student's paired t-test. Differences between groups were assessed by one-way ANOVA using the SPSS software package for Windows. p < 0.05 was considered to be statistically significant.
RESULTS
TGHQ Induces Time- and Concentration-Dependent Increases in ROS Generation, DNA Strand Breaks, and Nonapoptotic Cell Death
TGHQ-induced cytotoxicity in HL-60 cells is dependent upon the formation of ROS (Zhang et al., 2012). The relative ability of TGHQ to generate ROS in HK-2 cells was therefore investigated using live cell imaging by confocal microscopy with a fluorescent ROS indicator, carboxy-H2DCFDA. A significant time- and concentration-dependent increase in fluorescence intensity was observed in HK-2 cells (Figs. 1A and 1B). At 800μM TGHQ, increased generation of ROS was observed as early as 5 min after exposure. However, at 400μM of TGHQ, there was a delay in the generation of fluorescence, perhaps reflective of the consumption of various reducing equivalents (GSH, NAD[P], etc.) prior to overwhelming the cellular antioxidant response.
Fig. 1.

TGHQ induces ROS generation and cell death in HK-2 cells. (A) Analysis of ROS was performed in the presence or absence of TGHQ. Cells were incubated with H2DCFDA-AM (10μM) for 30 min at 37°C, followed by treatment with different concentrations of TGHQ (400 or 800μM) and imaged by confocal microscopy. The scale bar represents 100 μm. An area of cells was selected and changes in fluorescence were recorded every 5 min for 25 min to determine the level of ROS. (B) The densitometric and statistical analysis of the image data. Data represent the mean ± standard deviation (n ≥ 3). *p < 0.05 compared with control group. (C) Cells were treated with different concentrations of TGHQ (200, 400, and 800μM) for different periods of time (1, 2, and 4 h) in the presence or absence of catalase (10 units/ml). Cell viability was determined by measuring mitochondrial dehydrogenase enzyme activity in actively respiring cells. Formazan formation relative to untreated cells (% control) represents cell viability after treatment. Data represent the mean ± standard deviation (n ≥ 3). *p < 0.05.
TGHQ also induced a time- and concentration-dependent decrease in HK-2 cell viability (Fig. 1C) determined by measuring mitochondrial dehydrogenase activity. We subsequently investigated whether TGHQ (400μM)-induced apoptotic and/or necrotic cell death in HK-2 cells, as determined by flow cytometry (Annexin-V/PI staining) and Western blot analysis (caspase 3 activation). As a positive control for apoptosis, cells were treated with 50μM cisplatin for 14 h. Flow cytometric analysis permitted the resolution of apoptotic cells (Annexin-V+/PI−) from necrotic cells (Annexin-V+/PI+ and Annexin-V−/PI+). In contrast to TGHQ-induced apoptotic cell death of HL-60 cells (Zhang et al., 2012), TGHQ-treated HK-2 cell cultures exhibited a very low number of Annexin-V+/PI− cells (Figs. 2A and 2B) and no cleaved caspase 3 was detected (Figs. 2C and 2D), indicating that there is no apoptotic HK-2 cell death associated with TGHQ treatment. In contrast, HK-2 cells treated with cisplatin for 14 h exhibited significant levels of apoptosis, as indicated by both caspase 3 cleavage (Figs. 2C and 2D) and Annexin-V+/PI− staining (Figs. 2A and 2B).
Fig. 2.

TGHQ mediates nonapoptotic cell death in HK-2 cells. (A) Flow cytometric analysis of necrotic and/or apoptotic cells was determined by Annexin-V/PI staining. Cells were exposed to cisplatin (50μM) for 14 h as a positive control or TGHQ (400μM) for various periods of time (1, 2, 4, and 6 h). (B) The statistical analysis from three independent biological experiments. Data represent the mean ± standard deviation (n ≥ 3). *p < 0.05 compared with control group. (C) Caspase 3 cleavage was not detected in cells treated with TGHQ. Cells were exposed to 50μM cisplatin for 14 h or various concentrations of TGHQ (200, 400, or 800μM) for various periods of time (1, 2, and 4 h). Western blot analysis was performed. The illustrated blot is typical of at least three independent experiments. (D) The densitometric and statistical analysis of the image data. Data represent the mean ± standard deviation (n ≥ 3). *p < 0.05 compared with control group.
ROS interact with DNA causing oxidative DNA base damage and DNA strand breaks. Histone H2AX S139 is rapidly phosphorylated (γ-H2AX) in the presence of DNA strand breaks (Mah et al., 2010). Therefore, TGHQ-treated HK-2 cells were monitored for γ-H2AX formation as a surrogate for the presence of DNA strand breaks. Western blot analysis revealed an increase in γ-H2AX within 15 min of TGHQ treatment (Figs. 3A and 3B), consistent with the generation of ROS (Fig. 1), reaching maximal levels between 2 and 4 h. Moreover, a significant increase in γ-H2AX foci formation was revealed by immunofluorescence staining of cells exposed to TGHQ (400μM) for 30 min (Figs. 3C and 3D). However, TGHQ-mediated H2AX phosphorylation was completely abrogated by the scavenging of ROS by catalase (Figs. 3A and 3B). The combined data suggest that TGHQ induces a persistent and gradual increase in ROS-dependent DNA damage.
Fig. 3.

TGHQ mediates DNA damage in HK-2 cells. (A) Immnuoblot analyses of phosphorylated H2AX and total H2AX. Cells were treated with 400μM TGHQ for various periods of time in the presence or in the absence of catalase (10 units/ml). Histones were acid-extracted and examined by Western blot analysis. The illustrated blot is typical of at least three independent experiments. (B) The densitometric and statistical analysis from three independent biological experiments. Data represent the mean ± standard deviation (n ≥ 3). *p < 0.05 compared with control group. (C) γ-H2AX foci formation in HK-2 cells in response to TGHQ. Cells were treated with 400μM TGHQ for 30 min. Untreated and treated cells were then fixed and immunostained with phospho-H2AX antibody for the direct analysis of γ-H2AX foci formation. The scale bar on the left panel represents 100 μm and the right panel scale bar represents 50 μm. (D) The densitometric and statistical analysis of the image data. Data represent the mean ± standard deviation (n ≥ 3). *p < 0.05 compared with control group.
TGHQ Mediates PARP-1 Hyperactivation and Intracellular NAD Depletion
TGHQ-induced HK-2 cell death is accompanied by the rapid generation of ROS and DNA strand breaks. PARP-1, an enzyme implicated in DNA damage and repair mechanisms, is immediately activated following genotoxic stress, catalyzing the synthesis of PAR. The ability of TGHQ to activate PARP-1 and promote the rapid accumulation of PAR in HK-2 cells was therefore investigated in HK-2 cells treated with TGHQ. TGHQ-treated cells exhibited a time- and concentration-dependent increase in PAR accumulation (Figs. 4A and 4B), consistent with the hyperactivation of PARP-1 in response to extreme DNA damage. PAR accumulation was evident at 10 min, and appeared to peak by 30–60 min. In contrast, detection of PARs in HL-60 cells occurs between 1 and 2 h (Zhang et al., 2012). PAR formation requires the consumption of NAD, and PARP-1 hyperactivation depletes intracellular NAD content in a number of cell lines (Carson et al., 1986; Stubberfield and Cohen, 1988). Because the redox states of the NAD and NADP pool contribute to the maintenance of an appropriate intracellular redox state (Ying, 2008), we subsequently examined the effect of TGHQ on NAD and NADP metabolism. Time- and dose-dependent responses of total NAD and NADH content were determined using enzymatic cycling assays following TGHQ treatment. As anticipated, TGHQ-induced a time- and dose-dependent depletion of total cellular NAD content in HK-2 cells (Fig. 4C).
Fig. 4.

TGHQ-mediated PARP-1 hyperactivation and intracellular NAD depletion, in the absence of AIF translocation, during nonapoptotic cell death of HK-2 cells. Cells were treated with 400μM TGHQ for various periods of time, as indicated, or treated with various concentrations of TGHQ for 20 min. (A) PAR accumulation was determined with a PAR antibody, SA-216. Equal loading was confirmed by Ponceau S staining (data not shown). The illustrated blot is typical of at least three independent experiments. (B) The densitometric and statistical analysis from three independent biological experiments. Data represent the mean ± standard deviation (n ≥ 3). *p < 0.05 compared with control group. (C) Total NAD and NADH content were determined using enzymatic cycling assays. Data represent the mean ± standard deviation (n ≥ 3). (D) AIF protein is retained in mitochondria in response to TGHQ. Cells were treated with 400μM TGHQ for various periods of time (0.5, 1, 2, and 4 h). The cytosolic, mitochondria, and nuclear fractions were recovered and examined with Western blot analysis using AIF antibody. COX IV, MEK, and histone H3 were used as mitochondria, cytosolic, and nuclear markers, respectively. The illustrated blot is typical of at least three independent experiments. (E) The densitometric and statistical analysis from three independent biological experiments. Data represent the mean ± standard deviation (n ≥ 3).
PARP-1 Hyperactivation does not Facilitate AIF Translocation During Nonapoptotic Cell Death of HK-2 Cells
The mitochondrial-nuclear redistribution of AIF is well defined in PARP-mediated cell death (Moubarak et al., 2007; Yu et al., 2002). Because TGHQ-induced cell death in HK-2 cells occurred concomitant with PARP hyperactivation and NAD depletion (Figs. 4A–C), we subsequently determined whether TGHQ stimulated AIF translocation. Cells were treated with TGHQ (400μM) for various periods of time (0.5, 1, 2, and 4 h). Intracellular fractions, including mitochondria, cytoplasm, and nuclei, were isolated and analyzed to determine the relative distribution of AIF (Figs. 4D and 4E). Western blot analysis revealed no changes in the subcellular localization of AIF, suggesting that TGHQ-mediated PARP-1 hyperactivation is not accompanied by the translocation of AIF from mitochondria to the nucleus, a process usually associated with PARP-1 hyperactivation.
TGHQ-Mediated HK-2 Cell Death is PARP-Dependent
PARP-1 hyperactivation has been coupled to cell death via the accompanying consumption of energy (ATP) and reducing equivalents (NAD). To determine whether PARP-1 hyperactivation and intracellular NAD loss contribute to TGHQ-mediated cytotoxicity, HK-2 cells were incubated with PJ34, a PARP inhibitor, prior to exposure to TGHQ. PJ34 pretreatment provided remarkable protection against TGHQ-induced cell death (Fig. 5A), with ∼90% cell survival under conditions (800μM, 2 h) where TGHQ treatment alone caused 85% cell death. Cell survival in HK-2 cells pretreated with PJ34 was accompanied by the complete abrogation of TGHQ-mediated PAR accumulation (Figs. 5B and 5C) and NAD depletion (Fig. 5D), and the significant attenuation of TGHQ-mediated ATP depletion (Fig. 5E). In addition, it was found that siRNA knockdown of PARP-1 produced an ∼80% decrease in PARP-1 protein levels with a concomitant increase in cell viability of 21%. Incomplete protection against TGHQ toxicity by this approach is likely due to the residual PARP-1 activity, as evidenced by the presence of PAR proteins under these conditions (Supplemental data, Supplementary fig. 1). Intriguingly, PJ34-stimulated cell survival occurred despite the continued generation of ROS (Fig. 6A). Consistent with the lack of effect of PJ34 on ROS generation, PJ34 also had no effect on DNA damage as assessed by γ-H2AX formation (Figs. 6B and 6C). Indeed, PJ34-stimulated cell survival appeared to occur in the face of increased amounts of γ-H2AX formation 4 h after TGHQ treatment, perhaps reflecting decreases in the ability of PARP-1 to assist in the repair of DNA strand breaks and the consequent persistence of γ-H2AX-tagged foci.
Fig. 5.

TGHQ-mediated HK-2 cell death is PARP-dependent. (A) Inhibition of PARP attenuates TGHQ-mediated cell death. Cells were pretreated with or without PJ34 (10μM) for 30 min, and then exposed to TGHQ. Left panel: cells were treated with different concentrations of TGHQ (200, 400, and 800μM) for 2 h. Right panel: cells were treated with 400μM TGHQ for various periods of time (1, 2, 3, and 4 h). Cell viability was determined with the MTS based assay. Data represent the mean ± standard deviation (n ≥ 3). *p < 0.05. (B) PJ34 inhibits PARP-1 hyperactivation. Cells were exposed to 400μM TGHQ for various periods of time (15, 30, and 60 min) with or without PJ34 pretreatment. PAR accumulation was determined with a PAR antibody, SA-216. The blot illustrated is typical of at least three independent experiments. (C) The densitometric and statistical analysis from three independent biological experiments. Data represent the mean ± standard deviation (n ≥ 3). *p < 0.05 compared with individual control group. (D) PARP-1 hyperactivation is necessary for NAD loss in response to TGHQ. Cells were exposed to 400μM TGHQ for various periods of time (15, 30, and 60 min) with or without PJ34 pretreatment. Total NAD content was determined using enzymatic cycling assays. Data represent the mean ± standard deviation (n ≥ 3). *p < 0.05. (E) PARP-1 hyperactivation is necessary for ATP loss in response to TGHQ. Cells were exposed to 400μM TGHQ for various periods of time points with or without PJ34 pretreatment. Total ATP content was determined. Data represent the mean ± standard deviation (n ≥ 3). *p < 0.05.
Fig. 6.
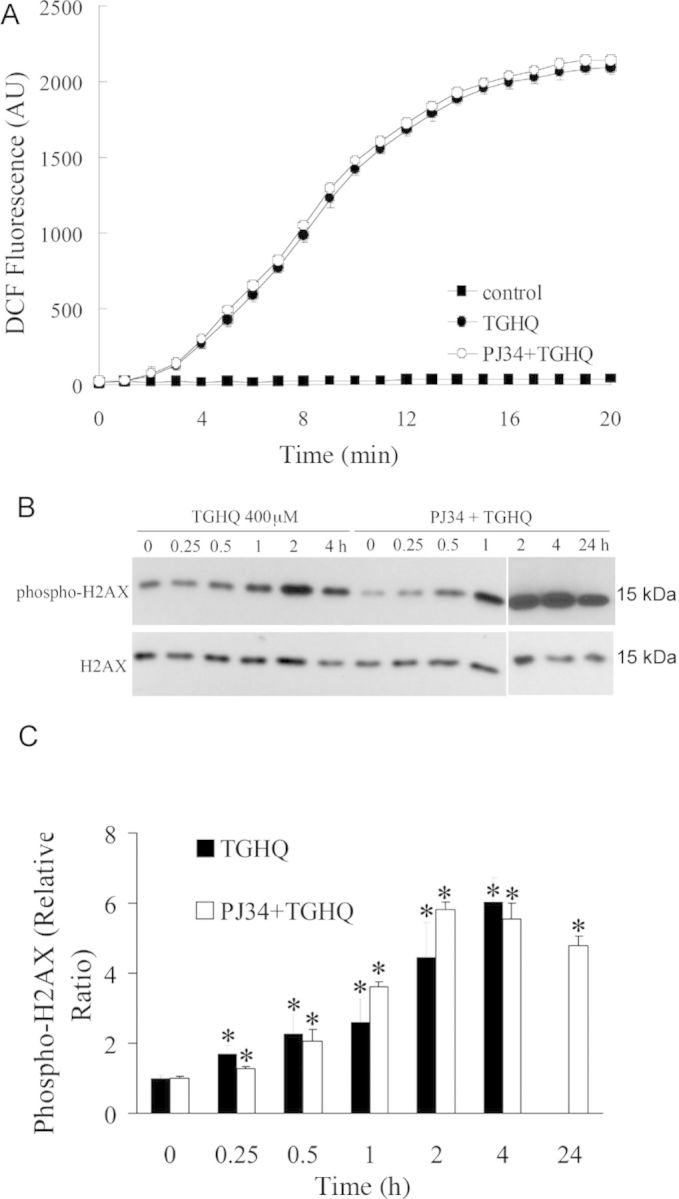
PARP inhibition by PJ34 has no effect on TGHQ-induced ROS production and DNA damage. (A) PJ34 does not influence TGHQ-mediated ROS generation. Cells were preincubated with H2DCFDA-AM (10μM) for 30 min, and then treated with 400μM TGHQ in the presence or absence of PJ34. Images were collected by confocal microscopy. An area of cells was selected, and changes in fluorescence were recorded every 1 min during treatment up to 20 min. Values represent the average of total cellular DCF fluorescence expressed as arbitrary units (AU). Data represent the mean ± standard deviation (n ≥ 3). (B) PJ34 does not influence TGHQ-mediated DNA damage. Cells were treated with 400μM TGHQ for different periods of time (0.25, 0.5, 1, 2, 4, and 24 h) in the presence or absence of PJ34. Histones were acid-extracted and examined with Western blot analysis. DNA strand breaks were determined using phospho-H2AX ser139 antibody (top panel). For the 24 h time point, medium containing TGHQ was replaced by normal culture medium after 4-h TGHQ treatment and the phosphorylation of H2AX was determined 24 h after initial TGHQ treatment. Equal loading was confirmed by immunoblot using histone H2AX antibody (bottom panel). The illustrated blot is typical of at least three independent experiments. (C) The densitometric and statistical analysis from three independent biological experiments. Data represent the mean ± standard deviation (n ≥ 3). *p < 0.05 compared with individual control group.
Inhibition of PARP Delays but does not Prevent TGHQ-Mediated Cell Death
In the ischemia/reperfusion model, administration of PARP inhibitors blocks NAD depletion, preserves cellular ATP, prevents necrosis, and commits cells to apoptosis (Fiorillo et al., 2003). We therefore next investigated whether PJ34 was capable of sustaining HK-2 cell survival beyond 4–6 h and whether or not PARP inhibition in TGHQ-treated HK-2 cells results in a similar switch in the mode of cell death, as seen during ischemia/reperfusion. Although ∼45% of HK-2 cells remained viable after 24 h following treatment with 200μM TGHQ, only ∼15% remained viable by 48 h (Fig. 7A). The higher dose resulted in almost 100% cell death by 24 h. Thus, inhibition of PARP with PJ34 only delays cell survival in response to TGHQ, even though PJ34 sustains cellular NAD concentrations for at least 24 h (Fig. 7B). The next question was whether the delay in cell death, caused by PARP inhibition, was also accompanied by a change in the mode of cell death. Apoptotic cell death was measured via a DNA fragmentation assay and again cisplatin (50μM) was used as a positive control. An increase in DNA fragmentation, reflected by the generation of oligonucleosomal ladders (Fig. 7C), confirmed the ability of cisplatin to induce apoptosis in HK-2 cells. However, cells exposed to TGHQ following PJ34 pretreatment showed no fragmented DNA compared with cisplatin treated cultures. In addition, no cleavage of caspase 3 was detected in TGHQ treated cells preincubated with PJ34, whereas cells treated with cisplatin contained significant amounts of cleaved caspase 3 (Figs. 7D and 7E). These data reveal that at least in HK-2 cells, prevention of PARP-mediated NAD depletion following ROS-induced DNA damage does not trigger a transition of cell death mode to apoptotic cell death.
Fig. 7.

Inhibition of PARP delays but does not prevent TGHQ-mediated cell death. (A) Cells were treated with different concentrations of TGHQ (200 and 400μM) in the presence or in the absence of PJ34. After 4 h treatment, medium containing TGHQ was replaced by normal culture medium. Cell viability was determined 24 or 48 h posttreatment with TGHQ. Data represent the mean ± standard deviation (n ≥ 3). *p < 0.05. (B) PARP-1 inhibition prevents long-term TGHQ-mediated depletions in NAD concentrations. Cells were treated with 400μM TGHQ in the presence or absence of PJ34. After 4 h exposure, medium containing TGHQ was replaced by normal culture medium. NAD content was determined at different time points as indicated (1, 2, 3, 4, 5, 6, 12, 18, and 24 h). Data represent the mean ± standard deviation (n ≥ 3). (C) PARP-1 inhibition does not alter the mode of TGHQ-induced cell death. Cells were treated with 50μM cisplatin for 14 h, or exposed to 400μM TGHQ in the presence of PJ34 for 4 h. Medium containing TGHQ was subsequently replaced by normal culture medium. Cells were collected 24 or 48 h posttreatment with TGHQ. Cellular DNA content was measured as described in the Materials and Methods section. (D) Western blot analysis was performed using cleaved caspase 3 antibody. The illustrated blot is typical of at least three independent experiments. (E) The densitometric and statistical analysis from three independent biological experiments. Data represent the mean ± standard deviation (n ≥ 3) compared with control group.
TGHQ Induces [Ca2+]i Elevation
We examined changes in [Ca2+]i in response to TGHQ with a cell permeable intracellular Ca2+ indicator, Fura-2-AM. Cells were loaded with 5μM Fura-2-AM for 45 min to allow for the dye to permeate cells. Cells were then incubated for an additional 20 min, in the presence or in the absence of 5μM BAPTA-AM. Following TGHQ addition, images were collected every 15 s for 1 h. Fold increases in fluorescence intensity were determined relative to basal [Ca2+]i levels. After exposure to TGHQ, HK-2 cells exhibited a time- and concentration-dependent increase in [Ca2+]i (Fig. 8). HK-2 cells exhibited an increase in Fura-2 fluorescence from 30 to 40 min, after which time [Ca2+]i continues to rise, with a 2- to 5-fold increase at 400μM TGHQ and 5- to 10-fold increases at 800μM TGHQ.
Fig. 8.

TGHQ induces intracellular Ca2+ elevation. Intracellular Ca2+ concentrations were measured in live cells via fluorescence microscopy using a cell permeable Ca2+ sensitive indicator Fura-2-AM. Results are displayed in graphic form to illustrate fold changes in Fura-2 fluorescence in cells after TGHQ treatment. Each line represents the change in Fura-2 fluorescent intensity of individual cells overtime; each graph represents one of at least three independent experiments. (B) The statistical analysis from three independent biological experiments. Data represent the mean ± standard error (n ≥ 3) compared with individual control group.
TGHQ-Induced Cell Death is Ca2+-Dependent
Disruptions in [Ca2+]i homeostasis have been coupled to cell death. To determine whether increases in [Ca2+]i levels contribute to TGHQ-mediated cytotoxicity, HK-2 cells were incubated with a cell permeable Ca2+ chelator BAPTA-AM, prior to exposure to TGHQ. BAPTA loading provided significant protection against TGHQ-induced cell death (Fig. 9A), with ∼100% cell survival under conditions (800μM, 2 h) where TGHQ treatment alone caused 85% cell death. Long-term cell survival was also examined. BAPTA-pretreated cells exhibited 90% viability at 24 h and 85% viability at 48 h, compared with 95% cell death in cells treated with TGHQ alone (Fig. 9B). However, unlike the PJ34-mediated transient cytoprotection, BAPTA-mediated protective effects are retained for at least 48 h. To examine whether Ca2+ is a required initiating factor in TGHQ-mediated cell death, HK-2 cells were exposed to various concentrations of TGHQ, and BAPTA was loaded 30 min before or at various times thereafter, up to 2 h (Fig. 9C). A time-dependent decrease in cell viability was observed with delayed addition of BAPTA, indicating that [Ca2+]i elevations are a critical initiating event in ROS-induced HK-2 cell death.
Fig. 9.

TGHQ-induced cell death is Ca2+-dependent. (A) Ca2+ chelation attenuates TGHQ-mediated cell death. Cells were pretreated with or without BAPTA-AM (5μM) for 30 min, and then exposed to TGHQ. Left panel: cells were treated with different concentrations of TGHQ (200, 400, and 800μM) for 2 h. Right panel: cells were treated with 400μM TGHQ for various periods of time (1, 2, 3, and 4 h). Cell viability was determined by measuring mitochondrial dehydrogenase enzyme activity in actively respiring cells. Data represent the mean ± standard deviation (n ≥ 3). *p < 0.05. (B) Ca2+ chelation almost completely prevents TGHQ-mediated cell death. Cells were treated with different concentrations of TGHQ (200 and 400μM) in the presence or in the absence of BAPTA-AM (5μM). After 4 h of exposure, medium containing TGHQ was replaced with normal culture medium. Cell viability was determined 24 or 48 h posttreatment with TGHQ. Data represent the mean ± standard deviation (n ≥ 3). *p < 0.05. (C) Ca2+ release is an initiating event in TGHQ-mediated cell death. Cells were treated with various concentration (200, 400, and 800μM) of TGHQ alone or together with 5μM BAPTA-AM which was pretreated (30 min), cotreated, or added to TGHQ-treated cells at various times afterward, as indicated (0.5, 1, and 2 h). Cell viability was determined with the MTS based assay 2 h posttreatment with TGHQ. Data represent the mean ± standard deviation (n ≥ 3).
To ensure that the cytoprotective effects of BAPTA were not related to an ability of BAPTA to scavenge ROS, live cell imaging using confocal fluorescence microscopy was used, and revealed that the increase in TGHQ-catalyzed ROS generation in HK-2 cells was unaffected by BAPTA-pretreatment (Fig. 10). HK-2 cells cotreated with BAPTA and TGHQ still exhibited increases in γ-H2AX (Fig. 11), although there was a delay in the time required to observe these increases in BAPTA treated cells. This likely reflects the ability of BAPTA to preserve cellular NAD levels (see below) and to sustain PARP-mediated DNA repair. These results indicate that increases in [Ca2+]i are coupled to a rapid decline in the ability to repair DNA damage.
Fig. 10.

BAPTA-mediated cytoprotection does not modulate TGHQ-mediated ROS generation. Cells were preincubated with 10μM H2DCFDA for 30 min, and then treated with 400μM TGHQ in the presence or absence of BAPTA-AM (5μM). Images were collected via confocal microscopy. An area of cells was selected and changes in fluorescence were recorded every 1 min during treatment up to 20 min. Values represent the average total cellular DCF fluorescence expressed as arbitrary units (AU). Data represent the mean ± standard deviation (n ≥ 3).
Fig. 11.

Effect of BAPTA on TGHQ-induced γ-H2AX formation. (A) Cells were treated with 400μM TGHQ for different periods of time (0.25, 0.5, 1, 2, and 4 h) in the presence or in the absence of BAPTA-AM (5μM). Histones were acid-extracted and examined with Western blot analysis. DNA strand breaks were determined using phospho-H2AX ser139 antibody (top panel). For the 24 h treatment sample, medium containing TGHQ was replaced by normal culture medium after 4 h TGHQ treatment and the phosphorylation of H2AX was determined 24 h after initial TGHQ treatment. Equal loading was confirmed by immunoblot using histone H2AX antibody (bottom panel). The illustrated blot is typical of at least three independent experiments. (B) The densitometric and statistical analysis from three independent biological experiments. Data represent the mean ± standard deviation (n ≥ 3) compared with individual control group.
Ca2+ Chelation Attenuates PAR Accumulation and NAD Depletion
TGHQ-induced cell death of HK-2 cells is PARP-dependent. The finding that Ca2+ chelation also protected against TGHQ-induced cell death suggests that PARP-1 activation and changes in [Ca2+]i are coupled. We therefore determined the influence of Ca2+ chelation on PARP-1 activation and intracellular NAD levels. Increases in PAR levels in TGHQ-treated cells could be detected between 15 and 120 min, with maximal levels at ∼45 min (Figs. 12A and 12B). PAR accumulation in HK-2 cells was accompanied by a parallel and rapid decline in NAD concentrations. Thus, within 1 h of exposure of HK-2 cells to TGHQ, NAD concentrations had declined to just 20% of control cells, and by 2 h were essentially zero (Fig. 12C). BAPTA loaded HK-2 cells exhibited much less PAR accumulation than cells treated with TGHQ alone, (Figs. 12A and 12B). The attenuation of PAR formation by BAPTA was accompanied by an initial (60 min) preservation of cellular NAD concentrations, which subsequently reached a nadir between 3 and 5 h, prior to returning to control levels by 12 h (Fig. 12C). The transient decline in NAD content in BAPTA-loaded HK-2 cells is apparently PARP-dependent, because inhibition of PARP with PJ34 abrogates the delayed consumption of NAD in a time-dependent manner. In BAPTA-loaded cells, intracellular NAD loss was completely prevented when PJ34 was added during the initial preservation period, as seen at 0, 0.5, and 1 h (Fig. 12C, right panel, gray bars). Subsequently, a time-dependent loss of cytoprotection was observed with the delayed addition of PJ34. These data suggest that the BAPTA-modulated NAD loss is also PARP-dependent.
Fig. 12.

Ca2+ chelation attenuates PAR accumulation and NAD depletion. (A) TGHQ-induced PAR accumulation is Ca2+ sensitive. Cells were pretreated with or without 5μM BAPTA-AM for 30 min, and then exposed to 400μM TGHQ for various periods of time (0.25, 0.5, 0.75, 1, 2, 3, and 4 h). PAR accumulation was determined by Western blot analysis. (B) The densitometric and statistical analysis from three independent biological experiments. Data represent the mean ± standard deviation (n ≥ 3) compared with individual control group. (C) Ca2+ chelation delays TGHQ-mediated NAD loss, which is also PARP-dependent. Left panel: cells were treated with 400μM TGHQ in the presence or in the absence of BAPTA-AM. After 4 h exposure, medium containing TGHQ was replaced by normal culture medium. NAD content was determined at different time points as indicated (1, 2, 3, 4, 5, 6, 12, 18, and 24 h). Right panel: BAPTA-AM pretreated (5μM, 30 min) cells were exposed to 400μM TGHQ. PJ34 was added to TGHQ-treated cells at various times afterward as indicated (0, 0.5, 1, 2, 3, and 4 h). NAD content was measured 4 h after initial TGHQ treatment. Grey bars represent initial preservation period. *p < 0.05.
TGHQ-Induced Poly(ADP-ribosylation) Alters [Ca2+]i
Next, we further examined the possible connection between PARP-1 hyperactivation and [Ca2+]i in response to TGHQ. After exposure to 400μM TGHQ, cells exhibited a 2- to 5-fold increase in Fura-2 fluorescence from 30 to 40 min (Fig. 13). Interestingly, the rise in [Ca2+]i was inhibited in the presence of PJ34. These data suggest a role for poly(ADP-ribosylation) in the modulation of intracellular Ca2+ release after TGHQ exposure, and that PARP-1 and [Ca2+]i are coupled in a cycle that results in fatal amplification of the PARP-1 and [Ca2+]i responses.
Fig. 13.

TGHQ-induced intracellular elevations in Ca2+ concentrations are PJ34 sensitive. (A) Analysis of intracellular Ca2+ concentration was performed using the cell permeable Ca2+ sensitive indicator Fura-2-AM. Cells were loaded with Fura-2-AM (5μM) for 45 min, and incubated for an additional 20 min to allow for hydrolysis of the AM-ester. Cells were then exposed to 400μM TGHQ in the presence or in the absence of PJ34 (10μM). Images were collected every 15 s for 1 h, as indicated. These results are displayed in graphic form to illustrate fold changes in Fura-2 fluorescence in cells after TGHQ treatment. Each line represents the change in Fura-2 fluorescent intensity of individual cells overtime; each graph represents one of at least three independent experiments. (B) The statistical analysis from three independent biological experiments. Data represent the mean ± standard error (n ≥ 3) compared with control group.
DISCUSSION
TGHQ, a ROS-generating nephrotoxic and nephrocarcinogenic metabolite of hydroquinone (HQ), targets the kidney due to the high concentration of γ-glutamyl transpeptidase on the brush border of proximal tubular epithelial cells. Processing by γ-GT and aminopeptidase(s) is required for the uptake of the corresponding cysteine conjugates into cells. In vivo, the abundance of these enzymes ensures they are not rate limiting. In contrast, the activity of these enzymes in cell culture is significantly lower than in vivo, and this limits uptake of these redox active conjugates into cells. Consequently, the amount of TGHQ required to induce cytotoxicity in vitro is higher than that required to cause toxicity in vivo. We have shown that TGHQ, a redox active metabolite of HQ, caused a time- and concentration-dependent decrease in HK-2 cell viability (Fig. 1C) in a ROS-dependent manner, in the absence of hallmarks of apoptosis (Fig. 2). Cell death was associated with DNA damage (Fig. 3) and was PARP-1-dependent (Figs. 4 and 5). PARP-1 is an abundant nuclear protein functioning as a DNA nick-sensor enzyme. Upon binding to DNA breaks, activated PARP cleaves NAD+ into nicotinamide and ADP-ribose and polymerizes the latter onto nuclear acceptor proteins including histones, transcription factors, and PARP itself (Virag and Szabo, 2002). When the DNA damage is mild, this physiological machinery repairs the injury. However, when DNA-damage is extensive, cells cannot repair the injury. In this case, disproportionate activation of PARP-1 depletes the cellular pools of NAD+ (Figs. 4 and 5) and ATP (Fig. 5), driving cell death.
In the majority of cases where PARP-1 hyperactivation contributes to cell death, the generation of PAR triggers the nuclear translocation of AIF, resulting in DNA condensation and fragmentation, in an apparently caspase-independent fashion (Kang et al., 2004; Yu et al., 2006). Although HK-2 cell death is PARP-dependent and caspase-independent (Figs. 2 and 5), PARP-1 hyperactivation was not accompanied by the translocation of AIF from the mitochondria to the nucleus. Hence, the pathways coupling PARP hyperactivation to cell death are clearly context-dependent. Excessive PARylation cycles or specific PAR-dependent pathways may signal cell death in a complex, cell type-, and stimulus-dependent manner (Burkle and Virag, 2013) and therapeutic strategies designed to target PARP-1 need to recognize such variability.
Although the inhibition of PARP-1 protected HK-2 cells from TGHQ-induced cell death, the cytoprotection occurred in the presence of an increase in γ-H2AX (Fig. 6), a marker of DNA strand breaks. Thus, when PARP is inhibited, the ability to either recognize the DNA damage, and/or to recruit DNA repair proteins to the sites of damage, might be impaired. Consistent with this view, PAR formation is totally abrogated in PARP-inhibited HK-2 cells (Figs. 5B and 5C) with a concomitant preservation of NAD+ concentrations (Fig. 5D). How do HK-2 cells respond to an increase in DNA strand breaks when the DNA repair machinery is compromised? In the ischemia/reperfusion model, administration of PARP inhibitors blocks NAD+ depletion, preserves cellular ATP, prevents necrosis and commits cells to a caspase-dependent apoptotic pathway (Fiorillo et al., 2006). However, energy collapse is not the de facto cause of cell death during PARP-1 hyperactivation (Fossati et al., 2007). In our studies, although NAD concentrations were preserved and ATP collapse was significantly attenuated in PARP-inhibited HK-2 cells, a transition to apoptotic cell death did not occur (Figs. 5E and 7C). Even though HK-2 cells clearly possess the machinery to engage apoptosis (Fig. 7C), inhibition of PARP in HK-2 cells only seems to delay the cell death.
Disruption of cellular Ca2+ homeostasis can frequently contribute to cell death. TGHQ-induced HK-2 cell death also occurs in a Ca2+-dependent manner (Fig. 9). When increases in [Ca2+]i are directly blocked via BAPTA-AM pretreatment, cell death was prevented. In a model of oxidative stress-induced cytotoxicity, Virag et al. (1999) have demonstrated that a calcium signal was required for the activation of PARP-1. Our results also reveal that PARP-1 hyperactivation and NAD depletion are coupled to increases in [Ca2+]i (Fig. 13). This is also in line with previous findings of others demonstrating the same phenomenon with a different PARP inhibitor and also with PARP-1 KO cells (Virag et al. 1998). Moreover, ROS-induced, PARP-1-mediated cell death requires Ca2+ as a cofactor. Ca2+ chelation with BAPTA not only attenuated PAR accumulation (Figs. 12A and 12B) but also altered the pattern of NAD depletion (Fig. 12C). In vitro studies on poly(ADP-ribosylation) suggest that Ca2+ is required for the activation of PARP-1 auto(ADP-ribosyl)ation (Kun et al., 2004). In addition, Ca2+ can hyperactivate PARP-1 in the absence of DNA strand breaks (Homburg et al., 2000). We speculate that ROS-induced elevations in [Ca2+]i might directly regulate PARP-1 activity. Thus, BAPTA protects cells against TGHQ-mediated cytotoxicity by reducing intracellular free Ca2+ and preventing hyperactivation of PARP-1. More importantly, BAPTA did not completely inhibit PARP-1 activation (Fig. 12A), which would be important for the ability of the residual PARP-1 activity to sufficiently repair ROS-mediated DNA strand breaks. Furthermore, increases in Ca2+ levels can apparently inhibit poly(ADP-ribose) glycohydrolase activity by up to 50% (Tanuma et al., 1986). Decreases in poly(ADP-ribose) glycohydrolase activity will disrupt the normal turnover of PAR, resulting in PARP-1 self-inhibition. Therefore, BAPTA-mediated cytoprotection may be a consequence of the maintenance of PARG function, releasing PARP-1 self-inhibition, and sustaining levels of DNA repair necessary for cell survival.
Interestingly, in the model of TGHQ-induced HK-2 cell toxicity, inhibition of PARP-1 by PJ34 prevented the increase in [Ca2+]i (Fig. 13), thus PARP-1 also acted upstream of elevation of [Ca2+]i, indicating that not only calcium signaling activates PARP-1 but that PARP-1 reciprocates by also regulating calcium redistribution following intense oxidative stress. Similarly, in a model of hydrogen peroxide-induced cytotoxicity, Blenn et al. (2011) identified TRPM2 as a critical player by which PARP-1 and PARG regulate the flow of calcium from the extracellular compartment into the cytoplasm. PARG generates ADP-ribose that serves as the signal for TRPM2 activation and downstream events in oxidant-induced cell death (Blenn et al., 2011). The complex manner in which intracellular Ca2+ homeostasis is maintained, particularly by the multiple channels, uniporters, exchangers, and ATP-dependent pumps that modulate the import, export, and intracellular redistribution of Ca2+ (Graier et al., 2007), likely contributes to the recognition of Ca2+ as a key contributor to cell injury and cell death, while the precise regulatory mechanisms by which [Ca2+]i promote cell death remain debatable. Further studies are required to determine the reciprocal relationship between PARP activation and elevations in [Ca2+]i.
In summary, we report that [Ca2+]i and PARP-1 hyperactivation are inter-dependent in our model of ROS-dependent cell death in HK-2 cells. Thus, increases in [Ca2+]i contribute to PARP-1 activation, and activation of PARP-1 can act in a reciprocal fashion to elevate [Ca2+]i. Increases in [Ca2+]i likely amplify TGHQ-induced PARP-1 activation, leading to PARP-1 hyperactivation, creating a feed-forward loop whereby the possible generation of free ADP-ribose promotes extracellular Ca2+ influx. PARP-1-dependent cell death has been implicated in broad and diverse disease conditions, including Parkinson's disease, heart attack, diabetes, and ischemia reperfusion injury. Our studies should therefore provide a better understanding of the mechanisms of PARP-1-dependent cell death, and assist in identifying novel targets for therapeutic intervention for those broad and diverse conditions of PARP-1 related diseases.
SUPPLEMENTARY DATA
Supplementary data are available online at http://toxsci.oxfordjournals.org.
FUNDING
National Institute of Environmental Health Sciences to the Southwest Environmental Health Sciences Center (P30ES006694).
Supplementary Material
Acknowledgments
We thank Dr Scott Boitano for assistance with calcium imaging.
Footnotes
These authors contributed equally.
REFERENCES
- Andrabi S. A., Dawson T. M., Dawson V. L. Mitochondrial and nuclear cross talk in cell death: Parthanatos. Ann. N. Y. Acad. Sci. 2008;1147:233–241. doi: 10.1196/annals.1427.014. [DOI] [PMC free article] [PubMed] [Google Scholar]
- Bellomo G., Jewell S. A., Thor H., Orrenius S. Regulation of intracellular calcium compartmentation: Studies with isolated hepatocytes and t-butyl hydroperoxide. Proc. Natl. Acad. Sci. U.S.A. 1982;79:6842–6846. doi: 10.1073/pnas.79.22.6842. [DOI] [PMC free article] [PubMed] [Google Scholar]
- Blenn C., Wyrsch P., Bader J., Bollhalder M., Althaus F. R. Poly(ADP-ribose)glycohydrolase is an upstream regulator of Ca2+ fluxes in oxidative cell death. Cell. Mol. Life Sci. 2011;68:1455–1466. doi: 10.1007/s00018-010-0533-1. [DOI] [PMC free article] [PubMed] [Google Scholar]
- Burkart V., Wang Z. Q., Radons J., Heller B., Herceg Z., Stingl L., Wagner E. F., Kolb H. Mice lacking the poly(ADP-ribose) polymerase gene are resistant to pancreatic beta-cell destruction and diabetes development induced by streptozocin. Nat. Med. 1999;5:314–319. doi: 10.1038/6535. [DOI] [PubMed] [Google Scholar]
- Burkle A., Virag L. Poly(ADP-ribose): PARadigms and PARadoxes. Mol. Aspects Med. 2013;24:1046–1065. doi: 10.1016/j.mam.2012.12.010. [DOI] [PubMed] [Google Scholar]
- Carson D. A., Seto S., Wasson D. B., Carrera C. J. DNA strand breaks, NAD metabolism, and programmed cell death. Exp. Cell Res. 1986;164:273–281. doi: 10.1016/0014-4827(86)90028-5. [DOI] [PubMed] [Google Scholar]
- Cosi C., Marien M. Implication of poly (ADP-ribose) polymerase (PARP) in neurodegeneration and brain energy metabolism. Decreases in mouse brain NAD+ and ATP caused by MPTP are prevented by the PARP inhibitor benzamide. Ann. N. Y. Acad. Sci. 1999;890:227–239. doi: 10.1111/j.1749-6632.1999.tb07998.x. [DOI] [PubMed] [Google Scholar]
- Cristovao L., Rueff J. Effect of a poly(ADP-ribose) polymerase inhibitor on DNA breakage and cytotoxicity induced by hydrogen peroxide and gamma-radiation. Teratog., Carcinog. Mutagen. 1996;16:219–227. doi: 10.1002/(SICI)1520-6866(1996)16:4<219::AID-TCM3>3.0.CO;2-L. [DOI] [PubMed] [Google Scholar]
- Degterev A., Yuan J. Expansion and evolution of cell death programmes. Nat. Rev. Mol. Cell Biol. 2008;9:378–390. doi: 10.1038/nrm2393. [DOI] [PubMed] [Google Scholar]
- Endres M., Wang Z. Q., Namura S., Waeber C., Moskowitz M. A. Ischemic brain injury is mediated by the activation of poly(ADP-ribose)polymerase. J. Cereb. Blood Flow Metab. 1997;17:1143–1151. doi: 10.1097/00004647-199711000-00002. [DOI] [PubMed] [Google Scholar]
- Fiorillo C., Ponziani V., Giannini L., Cecchi C., Celli A., Nassi N., Lanzilao L., Caporale R., Nassi P. Protective effects of the PARP-1 inhibitor PJ34 in hypoxic-reoxygenated cardiomyoblasts. Cell. Mol. Life Sci. 2006;63:3061–3071. doi: 10.1007/s00018-006-6345-7. [DOI] [PMC free article] [PubMed] [Google Scholar]
- Fiorillo C., Ponziani V., Giannini L., Cecchi C., Celli A., Nediani C., Perna A. M., Liguori P., Nassi N., Formigli L. Beneficial effects of poly (ADP-ribose) polymerase inhibition against the reperfusion injury in heart transplantation. Free Radic. Res. 2003;37:331–339. doi: 10.1080/1071576021000055262. [DOI] [PubMed] [Google Scholar]
- Fossati S., Cipriani G., Moroni F., Chiarugi A. Neither energy collapse nor transcription underlie in vitro neurotoxicity of poly(ADP-ribose) polymerase hyper-activation. Neurochem. Int. 2007;50:203–210. doi: 10.1016/j.neuint.2006.08.009. [DOI] [PubMed] [Google Scholar]
- Graier W. F., Frieden M., Malli R. Mitochondria and Ca(2+) signaling: Old guests, new functions. Pflugers Arch. 2007;455:375–396. doi: 10.1007/s00424-007-0296-1. [DOI] [PMC free article] [PubMed] [Google Scholar]
- Homburg S., Visochek L., Moran N., Dantzer F., Priel E., Asculai E., Schwartz D., Rotter V., Dekel N., Cohen-Armon M. A fast signal-induced activation of poly(ADP-ribose) polymerase: A novel downstream target of phospholipase c. J. Cell Biol. 2000;150:293–307. doi: 10.1083/jcb.150.2.293. [DOI] [PMC free article] [PubMed] [Google Scholar]
- Jacobson E. L., Jacobson M. K. Tissue NAD as a biochemical measure of niacin status in humans. Methods Enzymol. 1997;280:221–230. doi: 10.1016/s0076-6879(97)80113-9. [DOI] [PubMed] [Google Scholar]
- Kang Y. H., Yi M. J., Kim M. J., Park M. T., Bae S., Kang C. M., Cho C. K., Park I. C., Park M. J., Rhee C. H., et al. Caspase-independent cell death by arsenic trioxide in human cervical cancer cells: Reactive oxygen species-mediated poly(ADP-ribose) polymerase-1 activation signals apoptosis-inducing factor release from mitochondria. Cancer Res. 2004;64:8960–8967. doi: 10.1158/0008-5472.CAN-04-1830. [DOI] [PubMed] [Google Scholar]
- Kun E., Kirsten E., Mendeleyev J., Ordahl C. P. Regulation of the enzymatic catalysis of poly(ADP-ribose) polymerase by dsDNA, polyamines, Mg2+, Ca2+, histones H1 and H3, and ATP. Biochemistry. 2004;43:210–216. doi: 10.1021/bi0301791. [DOI] [PubMed] [Google Scholar]
- Lau S. S., Hill B. A., Highet R. J., Monks T. J. Sequential oxidation and glutathione addition to 1,4-benzoquinone: Correlation of toxicity with increased glutathione substitution. Mol. Pharmacol. 1988;34:829–836. [PubMed] [Google Scholar]
- Lau S. S., Monks T. J., Everitt J. I., Kleymenova E., Walker C. L. Carcinogenicity of a nephrotoxic metabolite of the “nongenotoxic” carcinogen hydroquinone. Chem. Res. Toxicol. 2001;14:25–33. doi: 10.1021/tx000161g. [DOI] [PubMed] [Google Scholar]
- Mah L. J., El-Osta A., Karagiannis T. C. gammaH2AX: A sensitive molecular marker of DNA damage and repair. Leukemia. 2010;24:679–686. doi: 10.1038/leu.2010.6. [DOI] [PubMed] [Google Scholar]
- Martin D. R., Lewington A. J., Hammerman M. R., Padanilam B. J. Inhibition of poly(ADP-ribose) polymerase attenuates ischemic renal injury in rats. Am. J. Physiol. Regul. Integr. Comp. Physiol. 2000;279:R1834–R1840. doi: 10.1152/ajpregu.2000.279.5.R1834. [DOI] [PubMed] [Google Scholar]
- Matsui Y., Takagi H., Qu X., Abdellatif M., Sakoda H., Asano T., Levine B., Sadoshima J. Distinct roles of autophagy in the heart during ischemia and reperfusion: Roles of AMP-activated protein kinase and Beclin 1 in mediating autophagy. Circ. Res. 2007;100:914–922. doi: 10.1161/01.RES.0000261924.76669.36. [DOI] [PubMed] [Google Scholar]
- Miesel R., Kurpisz M., Kroger H. Modulation of inflammatory arthritis by inhibition of poly(ADP ribose) polymerase. Inflammation. 1995;19:379–387. doi: 10.1007/BF01534394. [DOI] [PubMed] [Google Scholar]
- Moubarak R. S., Yuste V. J., Artus C., Bouharrour A., Greer P. A., Menissier-de Murcia J., Susin S. A. Sequential activation of poly(ADP-ribose) polymerase 1, calpains, and Bax is essential in apoptosis-inducing factor-mediated programmed necrosis. Mol. Cell. Biol. 2007;27:4844–4862. doi: 10.1128/MCB.02141-06. [DOI] [PMC free article] [PubMed] [Google Scholar]
- Oliver F. J., Menissier-de Murcia J., Nacci C., Decker P., Andriantsitohaina R., Muller S., de la Rubia G., Stoclet J. C., de Murcia G. Resistance to endotoxic shock as a consequence of defective NF-kappaB activation in poly (ADP-ribose) polymerase-1 deficient mice. EMBO J. 1999;18:4446–4454. doi: 10.1093/emboj/18.16.4446. [DOI] [PMC free article] [PubMed] [Google Scholar]
- Pieper A. A., Brat D. J., Krug D. K., Watkins C. C., Gupta A., Blackshaw S., Verma A., Wang Z. Q., Snyder S. H. Poly(ADP-ribose) polymerase-deficient mice are protected from streptozotocin-induced diabetes. Proc. Natl. Acad. Sci. U.S.A. 1999a;96:3059–3064. doi: 10.1073/pnas.96.6.3059. [DOI] [PMC free article] [PubMed] [Google Scholar]
- Pieper A. A., Verma A., Zhang J., Snyder S. H. Poly (ADP-ribose) polymerase, nitric oxide and cell death. Trends Pharmacol. Sci. 1999b;20:171–181. doi: 10.1016/s0165-6147(99)01292-4. [DOI] [PubMed] [Google Scholar]
- Richter C., Kass G. E. Oxidative stress in mitochondria: Its relationship to cellular Ca2+ homeostasis, cell death, proliferation, and differentiation. Chem. Biol. Interact. 1991;77:1–23. doi: 10.1016/0009-2797(91)90002-o. [DOI] [PubMed] [Google Scholar]
- Smith C. C., Davidson S. M., Lim S. Y., Simpkin J. C., Hothersall J. S., Yellon D. M. Necrostatin: A potentially novel cardioprotective agent? Cardiovasc. Drugs Ther. 2007;21:227–233. doi: 10.1007/s10557-007-6035-1. [DOI] [PubMed] [Google Scholar]
- Stubberfield C. R., Cohen G. M. NAD+ depletion and cytotoxicity in isolated hepatocytes. Biochem. Pharmacol. 1988;37:3967–3974. doi: 10.1016/0006-2952(88)90081-0. [DOI] [PubMed] [Google Scholar]
- Szabo C., Lim L. H., Cuzzocrea S., Getting S. J., Zingarelli B., Flower R. J., Salzman A. L., Perretti M. Inhibition of poly (ADP-ribose) synthetase attenuates neutrophil recruitment and exerts antiinflammatory effects. J. Exp. Med. 1997;186:1041–1049. doi: 10.1084/jem.186.7.1041. [DOI] [PMC free article] [PubMed] [Google Scholar]
- Tanuma S., Kawashima K., Endo H. Purification and properties of an (ADP-ribose)n glycohydrolase from guinea pig liver nuclei. J. Biol. Chem. 1986;261:965–969. [PubMed] [Google Scholar]
- Virag L., Salzman A.L., Szabo C. Poly(ADP-ribose) synthetase activation mediates mitochondrial injury during oxidant-induced cell death. J. Immunol. 1998;161:3753–3759. [PubMed] [Google Scholar]
- Virag L., Scott G. S., Antal-Szalmas P., O’Connor M., Ohshima H., Szabo C. Requirement of intracellular calcium mobilization for peroxynitrite-induced poly(ADP-ribose) synthetase activation and cytotoxicity. Mol. Pharmacol. 1999;56:824–833. [PubMed] [Google Scholar]
- Virag L., Szabo C. The therapeutic potential of poly(ADP-ribose) polymerase inhibitors. Pharmacol. Rev. 2002;54:375–429. doi: 10.1124/pr.54.3.375. [DOI] [PubMed] [Google Scholar]
- Ying W. NAD+/NADH and NADP+/NADPH in cellular functions and cell death: Regulation and biological consequences. Antioxid. Redox Signal. 2008;10:179–206. doi: 10.1089/ars.2007.1672. [DOI] [PubMed] [Google Scholar]
- Yu S. W., Andrabi S. A., Wang H., Kim N. S., Poirier G. G., Dawson T. M., Dawson V. L. Apoptosis-inducing factor mediates poly(ADP-ribose) (PAR) polymer-induced cell death. Proc. Natl. Acad. Sci. U.S.A. 2006;103:18314–18319. doi: 10.1073/pnas.0606528103. [DOI] [PMC free article] [PubMed] [Google Scholar]
- Yu S. W., Wang H., Poitras M. F., Coombs C., Bowers W. J., Federoff H. J., Poirier G. G., Dawson T. M., Dawson V. L. Mediation of poly(ADP-ribose) polymerase-1-dependent cell death by apoptosis-inducing factor. Science. 2002;297:259–263. doi: 10.1126/science.1072221. [DOI] [PubMed] [Google Scholar]
- Zhang F., Lau S. S., Monks T. J. A dual role for poly(ADP-ribose) polymerase-1 during caspase-dependent apoptosis. Toxicol. Sci. 2012;128:103–114. doi: 10.1093/toxsci/kfs142. [DOI] [PMC free article] [PubMed] [Google Scholar]
- Zingarelli B., Salzman A. L., Szabo C. Genetic disruption of poly (ADP-ribose) synthetase inhibits the expression of P-selectin and intercellular adhesion molecule-1 in myocardial ischemia/reperfusion injury. Circ. Res. 1998;83:85–94. doi: 10.1161/01.res.83.1.85. [DOI] [PubMed] [Google Scholar]
Associated Data
This section collects any data citations, data availability statements, or supplementary materials included in this article.