Significance
New data reveal that in the past three decades, China has become a major contributor to science and technology. Four factors favor China’s continuing rise in science: a large population and human capital base, a labor market favoring academic meritocracy, a large diaspora of Chinese-origin scientists, and a centralized government willing to invest in science. These factors may serve as an example to other nations aspiring to advance their standing in science. However, China’s science also faces potential difficulties due to political interference and scientific fraud.
Keywords: Chinese science, science education, international competitiveness
Abstract
In the past three decades, China has become a major contributor to science and technology. China now employs an increasingly large labor force of scientists and engineers at relatively high earnings and produces more science and engineering degrees than the United States at all levels, particularly bachelor’s. China’s research and development expenditure has been rising. Research output in China has been sharply increasing since 2002, making China the second largest producer of scientific papers after the United States. The quality of research by Chinese scientists has also been improving steadily. However, China’s rise in science also faces serious difficulties, partly attributable to its rigid, top–down administrative system, with allegations of scientific misconduct trending upward.
Historically, the world center of science has shifted several times, from Renaissance Italy to England to France and to Germany, before crossing the Atlantic Ocean to the United States in the early twentieth century, where it has remained for the past nine decades (1). Comprising only about 5% of the world’s population, the United States currently accounts for 35–75% of the world’s total scientific activities, depending on what measures one uses (1). Will America’s dominance in science last? Two recent reports by the National Academy of Sciences, the National Academy of Engineering, and the Institute of Medicine, have raised concerns that the United States may soon lose its scientific leadership role and suffer negative economic consequences (2, 3).
Those who worry that America might lose its place at the center of world science are concerned not only about the possible decline of science in the United States but also about the rise of possible rivals, particularly China. In the past three decades, China has become a major player in world science. This is surprising, given China’s relative unimportance to science as it evolved in the West over the past several centuries. Even as recently as 1997–2001, China still produced only 1% of the 1% top-cited publications (4). However, a combination of economic and social changes in China over the past four decades has strengthened China’s science and technology role.
China has experienced rapid, sustained economic growth since its economic reform began in 1978. Net of inflation, the annualized growth rate was 7.7% between 1978 and 2010 (5) (Fig. S1). This economic growth has been accompanied by a massive expansion in higher education. In 1982, only 0.8% of Chinese ages 25–29 y had attained postsecondary education. This figure rose to 3.3% in 1990, 6.7% in 2000, and 20.6% in 2010 (6–9) (Table S1). These same two factors—economic growth and educational expansion—were central to the rise of science in the United States in the twentieth century, and thus one might expect them to bring about a parallel change in China (1–3).
In this article, we present the latest data on various aspects of science in China since the 1980s. These include science and engineering (S/E) labor force size, S/E degrees, government policies and investments, and scientific output and impact. For ease of interpretation, we compare China to the United States, and in a few instances to other countries. The data we have analyzed all indicate that China has become a major contributor to science and technology. We close the article with an interpretation of the data and a discussion of the widespread perception of scientific corruption and fraud in China.
S/E Labor Force
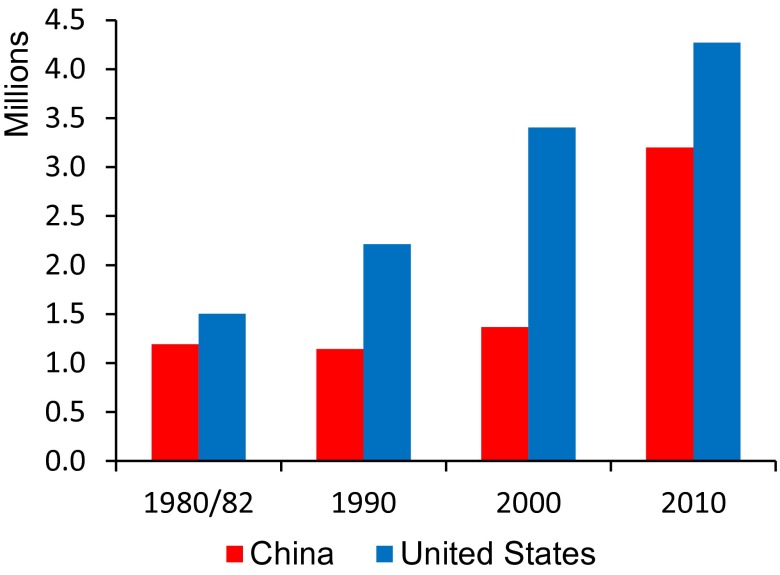
Drawing on population census data, we first report our estimates of the size of the S/E labor force in China from 1982 through 2010 and compare the figures to those in the United States. These estimates were based on Chinese and US census data, supplemented by recent data from the American Community Survey (ACS) (10). We define “scientist” as someone with at least a college education and working in an S/E occupation (1). Our definition includes physical scientists, life scientists, mathematical scientists, and engineers but excludes social scientists (Table S2). Fig. 1 shows an upward trend in the size of the S/E labor force for both countries (Fig. S2 in log scale). In 1982, the Chinese S/E labor force was 1.2 million, about 80% the size of the American S/E labor force (at 1.5 million in 1980). By 2010, China had 3.2 million scientists and engineers, compared with 4.3 million in the United States. The overall growth was similar in the two countries. Given China’s much larger population size, however, scientists and engineers constitute a much smaller share of the labor force there, at 0.4% in 2010 than in the United States at 3.1% in 2010 (Table S3).
Fig. 1.
Labor force in S/E, 1980/1982–2010. In the 1980/82 category, 1980 represents the United States, and 1982 represents China.
The bulk of China’s growth occurred between 2000 and 2010 (Fig. S3). As we will discuss later, this is attributable to a large expansion of higher education that began in 1999. Engineers make up a much larger share of the total S/E labor force in China than in the United States. In 2010, there were 2.4 million engineers in China, compared with 1.4 million in the United States. Net of engineers, China’s scientific labor force of about 160,000 remained much smaller than the ∼690,000 scientists in the United States (Table S3). Historically, women occupied a larger share of the S/E labor force in China than in the United States. However, due to a steady increase in US women’s representation in S/E over the period (1, 11), the proportion of women among scientists and engineers in the two countries had converged by 2010 (around 25%), although women constituted a higher proportion among engineers in China (25%) than in the United States (13%) (Table S3).
Earnings returns to higher education have increased in the general American labor force (12, 13). Some economists have attributed this trend to the growing importance of technology in the US economy (12, 14). Past research has documented, however, that the earnings of American scientists have stagnated and lost ground in comparison with those of other high-status professionals such as doctors and lawyers (1, 13, 14). Because expected earnings affect youths’ career choices, the relatively unfavorable labor market outcomes of American scientists may discourage talented youths from pursuing scientific careers (1). Is this also the case in China?
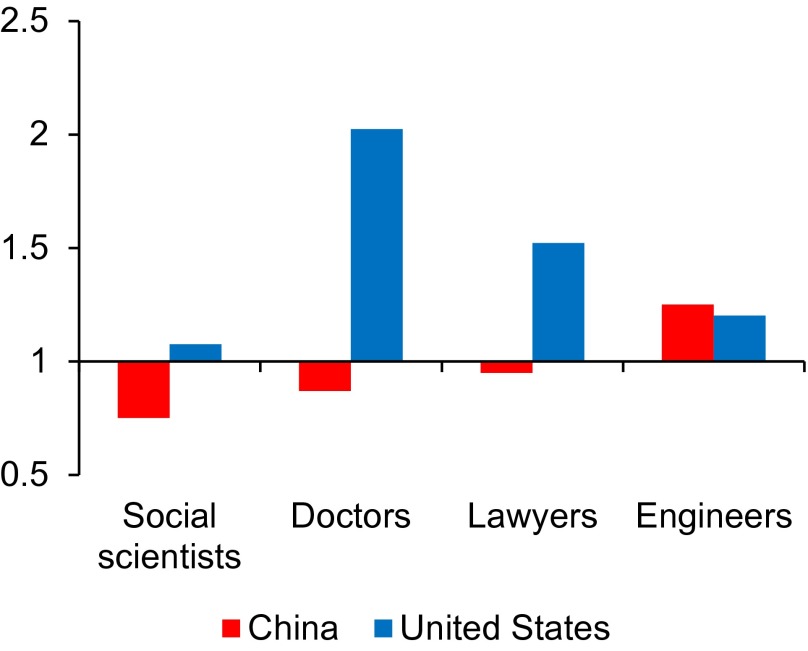
To answer this question, we compare the earnings of scientists to those of four other high-status professionals—social scientists, medical doctors, lawyers, and engineers—in both China and the United States. The data analyzed came from the 2005 minicensus survey in China (15) and the 2006–2008 ACS. We present summary results from a regression analysis adjusting for standard human capital and labor supply factors (Table S4). Fig. 2 shows the estimated earnings ratios of selected other professionals compared with scientists. Except for engineers, Chinese scientists have an earnings advantage relative to these professionals, whereas American scientists face a disadvantage. Engineers in both countries enjoy about a 25% premium over scientists. In China, scientists earn 25% more than social scientists, 13% more than medical doctors, and 5% more than lawyers, whereas American scientists earn 7% less than social scientists, 50% less than medical doctors, and 34% less than lawyers. These results indicate that the financial incentives for working in science are stronger in China than in the United States. When talented youth face alternative career options, everything else being equal, more Chinese would be attracted to science than Americans.
Fig. 2.
Earning ratios compared with scientists, mid-2000s.
S/E Degrees
Chinese culture recognizes merit through education, regardless of one’s social origin (16–18). In modern China, the demand for higher education has always far exceeded the supply, which has been limited by inadequate physical facilities and teaching faculty. After much political debate, the government decided in 1998 to expand China’s higher education system (18). Not only did the number of higher education institutions more than double from 1,022 in 1998 to 2,263 in 2008, but all previously existing institutions were also restructured, upgraded, and enlarged to accommodate this policy (19) (Table S5).
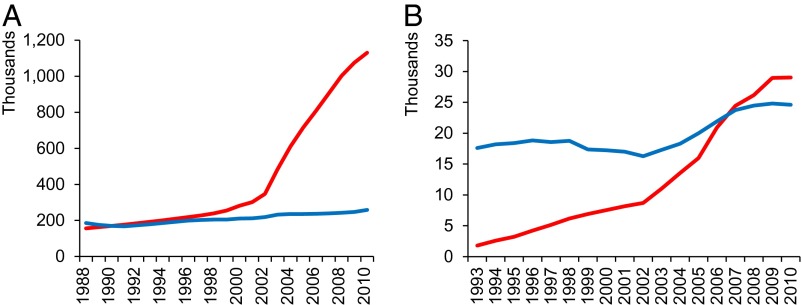
As a result, China is now the world’s distant leader in bachelor’s degrees in S/E, with 1.1 million in 2010, more than four times the US figure. This large disparity reflects not only China’s dramatic expansion in higher education since 1999 but also a much higher percentage of students majoring in S/E in China, around 44% in 2010, compared with 16% in the United States (20, 21) (Table S6). In Fig. 3A, we present the divergent trends in the production of S/E degrees at the bachelor’s level in the two countries (Fig. S4A in log scale). The figure shows an increasingly larger gap between China and the United States from 1998 to the present. Of course, China’s population is much larger, around 1.3 billion, than that of the United States, which is around 300 million. Adjusting for population size differences, the two countries now have similar proportions of graduates with S/E bachelor’s degrees. The main focus here is on trends, which point to China’s rapid increase.
Fig. 3.
(A) The number of bachelor's degrees awarded from 1988 to 2010. (B) The number of doctoral degrees awarded from 1993 to 2010. The red line is for China and the blue line is for the United States.
China’s massive production of scientists and engineers is not limited to the bachelor’s level. Its growth in S/E doctoral degrees has been comparably dramatic. In Fig. 3B, we present the trends in S/E doctoral degrees awarded between 1993 and 2010 for both China and the United States (Fig. S4B in log scale). In 1993, China’s number of degrees was only 10% that for the United States, but by 2010 China exceeded the United States by 18%.
China’s rapid increase in the quantity of S/E degrees inevitably invites questions about their quality. Are the scientists and engineers being graduated en masse by newly created or restructured Chinese educational institutions as good as US-trained professionals (22)? Unfortunately, we have no appropriate data with which to address this question. There is evidence, however, shown below, that performance by Chinese scientists has improved over the period during which degree production increased so dramatically. Thus, we concur with a prediction made by Freeman, an economist, in 2009 that over time the “quality [of Chinese education] will undoubtedly improve” (23).
The quality of China’s science education, at least at the bachelor’s level, can also be seen in the increasingly large number of Chinese graduate students in American S/E programs; a threefold increase from 15,000 in 1987 to 43,000 in 2010 (20, 24–26) (Tables S7 and S8). The number of S/E doctoral degrees awarded by US universities to Chinese citizens peaked at 4,300 in 2007, making China the largest foreign supplier of US doctoral recipients (27) (Table S9).
Government Policies and Investments
A country’s economy and science affect each other in mutually dependent, dynamic, and positively reinforcing ways (1–3). On the one hand, much of today’s economic growth is driven by technological advances (2, 3, 12, 14, 28). Keenly aware of this, China’s government policymakers have pushed technological development as the basis for upgrading China’s industry (29) and making China more competitive in the global market (30). On the other hand, a country’s economic prowess provides the foundation for its scientific strength (1, 4, 31). One important property of science as a social institution is that its product, scientific knowledge, is a public good, which anyone can use without loss of value.
For these two reasons—economic role and public good—most policymakers believe that governments should spend public funds to support science. Indeed, virtually all governments in the world invest in science as a national strategy. Thus, it is not surprising that the Chinese government, having access to centralized resources, has repeatedly formulated state policies to promote Chinese science.
The Chinese government’s proscience policy after the Cultural Revolution began in 1977, with Deng Xiaoping’s announcement that the State Science and Technology Commission would be restored and College Entrance Examinations resumed. A government document released in 1982 further declared, “Economic development should rely on science and technology; Science and technology should be oriented to serving economic development” (32). In 1986, the National Natural Science Foundation of China was established, modeled after the National Science Foundation of the United States. This was followed by the 863 Program, or State High-Tech Development Plan, intended to stimulate the development of advanced technologies. For institutions of higher education, the government launched Project 211 in 1995 to upgrade the research capabilities of roughly 100 universities, costing approximately US$2.2 billion in the first phase from 1996 to 2000 (33). Project 211 was followed in 1998 by an even more ambitious program, Project 985, dedicated to building world-class, elite universities in China. The government provided generous funding and increased this over time for those select universities supported by Project 985. Peking University and Tsinghua University, for example, each received about US$300 million in the first phase, in 1999–2001, with the funding level more than doubled in 10 y (34).
Knowing that capital investment alone would not make Chinese science strong, the Chinese government has also tried to attract talent from aboard by targeting overseas Chinese-born scientists, especially those working in the United States. Two programs were designed to encourage them to return to China. The Changjiang Scholars Program, which began in 1998, first offered the scientists incentives that were mostly on a short-term visiting basis. Then, in 2008, the government launched the Thousand Talent Program called “The Recruitment Program of Global Experts” with the explicit goal of raiding first-tier foreign research institutions for senior-level scientists. Recruitment packages typically include a high salary, research funds and space, and a standard tax-free relocation allowance in the amount of US$160,449 (35). Aided in part by a global financial crisis, the program attracted numerous overseas Chinese scientists back to China. Even as the number of students studying abroad continued to increase, the ratio of returnees to exits rose from 30.56% in 2007 to 38.54% in 2008, and again to 47.23% in 2009 (36). By April 2012, the program had attracted 2,263 scientists to work in China (37).
Some of the returning scientists were so prominent that the US science community was taken by surprise. Three of these were the biological scientists Yi Rao, Yigong Shi, and Xiaodong Wang. Rao left his named chair professor position at Northwestern University at age 45 to return to Peking University in 2007 (38). Shi quit his named chair position at Princeton University at age 42 to return to Tsinghua University in 2008 (39). This was followed in 2009 by the return of Xiaodong Wang, the first Chinese American scientist who grew up in China after the Communist Revolution to be elected to the National Academy of Sciences, to head the National Institute of Biological Sciences, Beijing (40, 41). American media reacted to these losses with concern. In the New York Times, LaFraniere declared that “the return of Dr. Shi and some other high-profile scientists is a sign that China is succeeding more quickly than many experts expected at narrowing the gap that separates it from technologically advanced nations” (39).
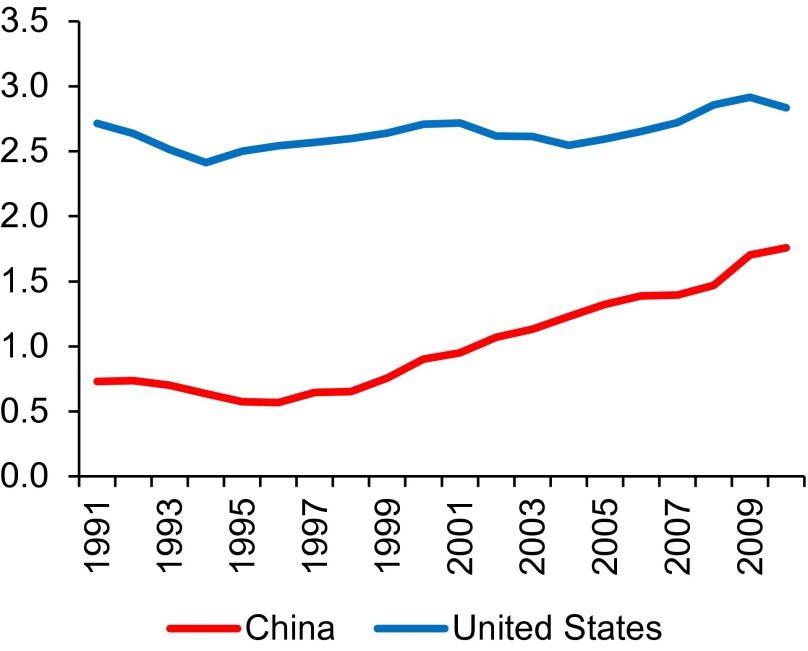
The Organisation for Economic Co-operation and Development has been tracking research and development (R&D) gross expenditures in different countries. According to their estimates, the ratio of China’s R&D expenditure to that of the United States increased sharply, from 5% in 1991 to 44% in 2010 (42). China’s steady growth in R&D expenditure, at 20% per year (43), has resulted from both the increase in gross domestic product (GDP) and the increase in the share of GDP spent on R&D. In Fig. 4, we present the most recent data on the share of GDP spent on R&D, separately for China and the United States. Whereas the trend has stagnated in the United States, it has moved steadily upward in China, more than doubling from 0.7% in 1991 to 1.8% in 2010, albeit still at a much lower level than in the United States’ 2.8% in 2010 (Table S10).
Fig. 4.
Gross expenditures for R&D as share of GDP, 1991–2010.
Scientific Output and Impact
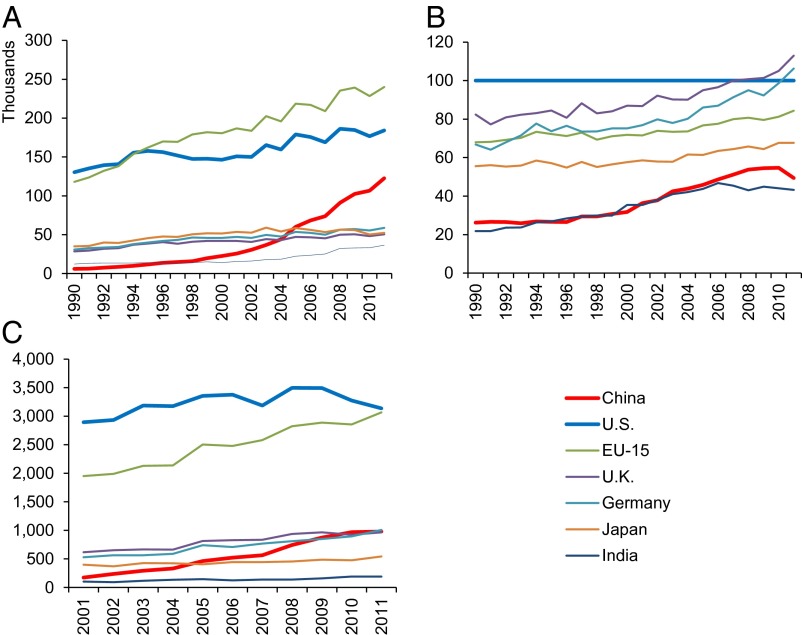
Have the Chinese government’s efforts to upgrade science worked? One concrete way of determining this is to assess changes in China’s output of scientific articles and their impact. For lack of better data, we rely on Thomson Reuters’ InCites and Essential Science Indicators (ESI) databases for S/E publications produced in China, the United States, the United Kingdom, the European Union (EU-15), Germany, Japan, and India, and their citation counts (Table S11). Because Thomson Reuters does not track Chinese-language publications, and the Chinese scientific community began a major shift to publishing in English language journals in the 1990s, the Thomson Reuters data overestimate the increase of scientific output for China. With this limitation in mind, we constructed trend series for (i) the total number of articles between 1990 and 2011, shown in Fig. 5A (Fig. S5A in log scale; Fig. S6A for GDP-adjusted); (ii) average times cited per article per year for articles published between 1990 and 2011, shown in Fig. 5B (Fig. S5B in log scale; Fig. S6B for GDP-adjusted); and (iii) number of top 1% highly cited articles between 2001 and 2011, shown in Fig. 5C.
Fig. 5.
(A) Total number of articles in S/E, 1990–2011. (B) Average times cited per article compared with the United States (%), 1990–2011. (C) Number of highly cited articles in S/E, 2001–2011.
Fig. 5A shows that China is by far the fastest-growing country in terms of article productivity between 1990 and 2011. Growing at an annual rate of 15.4%, China’s total number of S/E articles increased 20 times, from 6,104 in 1990 to 122,672 in 2011. In comparison with other countries, China overtook the United Kingdom in 2004, and Japan and Germany in 2005, and has since remained second only to the United States. By 2011, China’s article output was two-thirds that of the United States, and more than half of the total production by all EU-15 countries combined.
China’s ascendancy in total scientific output has also been accompanied by a substantial improvement in quality. To measure quality, we use data from Thomson Reuters’ Web of Knowledge on the number of citations per article up to 2011. Papers produced in China generated on average 8.4 citations in 1990–1994, but this number increased to 10.7 in 2000–2004, despite a shorter exposure of more recent papers. To adjust for unequal exposure for citation over time, we use US data as the benchmark against which we compare China and other countries in Fig. 5B. Relative to the United States, China has steadily improved in average citation counts over the past two decades, with the China:US ratio rising from 26% in 1990 to 55% in 2010. Although the figure also shows that even for the latest period, citations of Chinese papers remained far below those produced in the United States, the United Kingdom, and Germany, China has significantly narrowed its gap with other countries in producing the top 1% highly cited articles (shown in Fig. 5C), surpassing Japan in 2005 and reaching parity with Germany and the United Kingdom around 2009. The China:US ratio in number of highly cited articles climbed sharply from 6% in 2001 to 31% in 2011. Patent applications from China have also increased sharply since 2000 (44) (Fig. S7).
Despite China’s rapid increases in both total productivity (Fig. 5A) and high-quality productivity (Fig. 5C), China’s current productivity levels are not out of expectation given the large and increasing size of its total economy. In the SI Text (shown in Fig. S6 A and B), we compare China’s relative productivity, adjusting for economy size, to those of the United States and other countries. The figures show that China’s relative productivity still increased substantially throughout the period even after we adjust for its rapid growth in total economy. In addition, we find that China, along with India, has still lagged behind the other countries in relative productivity, in terms of both total number of publications (Fig. S6A) and most-cited publications (Fig. S6B), the latter gap being more pronounced.
China’s contribution to world science varies by major field. Measured by publication counts, China’s physical sciences are the most competitive, biological sciences being the least competitive. In 2011, for example, the China:US ratio of article production was 98% in physical sciences, 77% in engineering, 62% in mathematical sciences, and 34% in biological sciences. There were also marked differences at the subfield level. China became the world publication count leader in material science in 2005 and in chemistry in 2008. By 2011, the China:US ratio in article productivity had risen to 169% in material science and 127% in chemistry. In contrast, the United States still leads China by large margins in immunology, molecular biology, and genetics, with the China:US ratios in these specialty areas in 2011 at 16% and 25%, respectively.
China’s Challenges
Although China has succeeded in becoming a major contributor to science and technology, China’s science still faces two major difficulties. First, as in almost all industries in China, the government plays a crucial role in science. In the United States and many other countries, public funding for science is dispensed through a peer-review system. In contrast, executive branches of the Chinese government, such as the Ministry of Science and Technology and 985 universities, decide what research projects are funded (43). This practice could easily lead to misallocation of research funds, as decisions for funding may be influenced by extraneous, or functionally irrelevant, factors such as social networks or political patronage rather than scientific merit. Even if the government succeeds in preventing misdeeds among officials, it still faces difficulties evaluating the true merits of scientific contributions. When the government evaluates scientists and research institutions, it tends to use standardized and mechanistic methods, such as counting the number of publications and citations in top journals (45).
Second, in China, scientific corruption and fraud appear to have risen. We stated earlier that social status as a top scientist is highly valued, but that evaluation of science is mainly administrative. This combination tempts some Chinese scientists to cheat the system by providing false evidence of scientific achievement that government officials may easily overlook (45). In fact, scientific fraud and corruption have become so rampant in China in recent years that Shimin Fang (with the pen name of Fang Zhouzi), a science writer devoted to discovering and exposing such cases, is now a household name in China. Fang received the John Maddox Prize awarded by Nature and the Kohn Foundation in 2012 for his work in China fighting “padded CVs, fraudulent and plagiarized articles, bogus medicines and medical procedures carried out without clinical evidence” (46). “Faked research is endemic in China,” Fang was quoted as saying in a headline of a news article about him (47). Indeed, his Web site has exposed numerous serious cases of scientific misconduct (SI Text, section 12). Consistent with Fang’s claim, Science recently reported on an academic black market in China in which some scientists trade authorship of Science Citation Index papers through shady agencies (48).
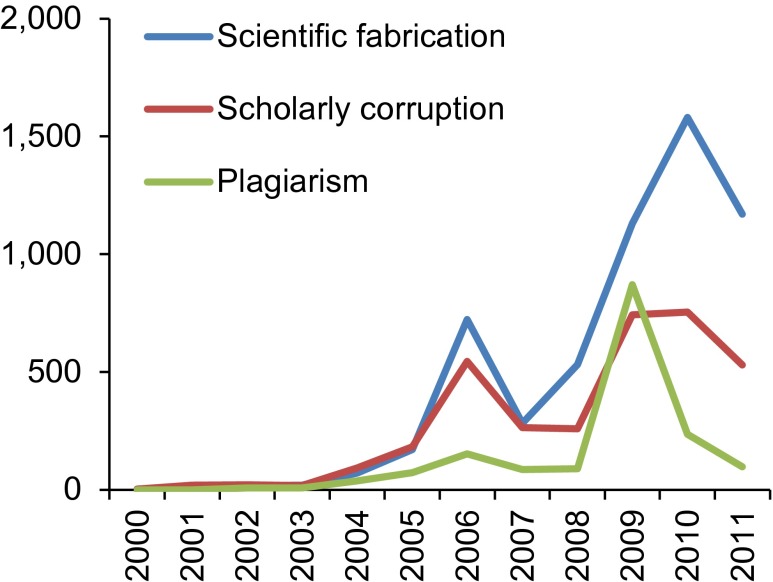
Has the incidence of scientific fraud increased over time? This is hard to answer empirically. In the online SI Text, we provide a list of recent, confirmed, and well-known cases of scientific fraud (SI Text, section 12). Some scientific frauds in the past may have gone unnoticed. For empirical evidence, we focus on the public’s attention to scholarly and scientific corruption. Fig. 6 shows the trend data from Google News (https://news.google.com.hk; SI Text, section 12) on the number of Web pages each year containing each of three key words (in Chinese): “scientific fabrication” (ke xue zao jia), “plagiarism” (lun wen chao xi), and “scholarly corruption” (xue shu fu bai) (Fig. S8 in log scale). As the figure shows, the number of pages containing these words has increased dramatically since 2006. In 2011, the counts were 1,170 for scientific fabrication, 530 for scholarly corruption, and 98 for plagiarism. These numbers were respectively 6.8 times, 2.9 times, and 1.3 times the counts in 2005.
Fig. 6.
Number of results in Google News search.
Conclusion
In the past three decades, China has become a major contributor to science and technology. Four factors favor China’s continuing rise in science: a large population and human capital base, a labor market favoring academic meritocracy, a large diaspora of Chinese-origin scientists, and a centralized government willing to invest in science. Globalization has made it easier to conduct research in all countries, including China, by providing such benefits as open access to library resources, easy communication with world-class researchers across geographic boundaries, and availability of computing power and scientific equipment. Two key factors in this increasingly globalized world are economic resources and human resources. China has both and has made good use of them in its development of science.
Today’s science is global. Healthy competition for scientific excellence across the globe is beneficial to science overall. The days when there was only a single world center of science may soon exist only as legacies of the past. Today’s world of science may be characterized as having multiple centers of scientific excellence across the globe. When science in China and other fast-developing countries improves, it greatly expands the scale of science and thus speeds up scientific discoveries, benefitting the entire human race. For this reason, the rise of China as a major contributor to science and technology will prove to be a significant event whose impact on both China and the world in the long term should be studied more closely.
Supplementary Material
Acknowledgments
The authors thank Feng Nailin and Li Xiru (National Bureau of Statistics of China) for meeting our request for S/E labor force data from the China population censuses, and to Thomson Reuters for providing special tabulations from its InCites and ESI databases. Capable research assistance was provided by Jingwei Hu, Yongai Jin, Cindy Glovinsky, and Chris Near. Research for the article was supported by internal funding from the University of Michigan, Peking University, and Renmin University of China (all Y.X.).
Footnotes
The authors declare no conflict of interest.
This article contains supporting information online at www.pnas.org/lookup/suppl/doi:10.1073/pnas.1407709111/-/DCSupplemental.
References
- 1.Xie Y, Killewald A. Is American Science in Decline? Cambridge, MA: Harvard Univ Press; 2012. [Google Scholar]
- 2.National Academy of Sciences, National Academy of Engineering, and Institute of Medicine . Rising above the Gathering Storm: Energizing and Employing America for a Brighter Economic Future. Washington: National Academies Press; 2007. [Google Scholar]
- 3.National Academy of Sciences, National Academy of Engineering, and Institute of Medicine . Rising above the Gathering Storm: Rapidly Approaching Category 5. Washington: National Academies Press; 2010. [PubMed] [Google Scholar]
- 4.King DA. The scientific impact of nations. Nature. 2004;430(6997):311–316. doi: 10.1038/430311a. [DOI] [PubMed] [Google Scholar]
- 5. Heston A, Summers R, and Aten B (1912) Penn World Table Version 7.1 (Center for International Comparisons of Production, Income and Prices, University of Pennsylvania, Philadelphia)
- 6.National Bureau of Statistics of China 1995. 1982 Population Census of China (Results of Computer Tabulation) (Statistical Publishing House, Beijing). Chinese.
- 7.National Bureau of Statistics of China 1993. Tabulation on the 1990 Population Census of the People’s Republic of China (China Statistics Press, Beijing). Chinese.
- 8.National Bureau of Statistics of China 2002. Tabulation on the 2000 Population Census of the People’s Republic of China (China Statistics Press, Beijing). Chinese.
- 9.National Bureau of Statistics of China 2012. Tabulation on the 2010 Population Census of People’s Republic of China (China Statistics Press, Beijing). Chinese.
- 10.Ruggles S, et al. 2010. Integrated Public Use Microdata Series: Version 5.0 (University of Minnesota, Minneapolis)
- 11.Xie Y, Shauman K. Women in Science: Career Processes and Outcomes. Cambridge, MA: Harvard Univ Press; 2003. [Google Scholar]
- 12.Goldin C, Katz L. The Race Between Education and Technology. Cambridge, MA: The Belknap Press of Harvard Univ Press; 2008. [Google Scholar]
- 13.Xie Y, Killewald A, Near C. Between- and within-occupation inequality: The case of high-status professions. In: MacLean A, Grusky D, editors. Living in a High Inequality Regime. New York: Russell Sage Foundation; [Google Scholar]
- 14.Lemieux T. The changing nature of wage inequality. J Popul Econ. 2008;21(1):21–48. [Google Scholar]
- 15.National Bureau of Statistics of China 2006. Communiqué on Major Data of 1% National Population Sample Survey in 2005. Available at www.stats.gov.cn/english/NewsEvents/200603/t20060322_25744.html. Accessed May 24, 2014.
- 16.Xie Y. Understanding inequality in China. Chinese Journal of Sociology. 2010;30(3):1–20. doi: 10.1177/2057150X16654059. Chinese. [DOI] [PMC free article] [PubMed] [Google Scholar]
- 17.Stevenson H, Stigler J. The Learning Gap: Why Our Schools Are Failing and What We Can Learn from Japanese and Chinese Education. New York: Summit Books; 1992. [Google Scholar]
- 18.Wan Y. Expansion of Chinese higher education since 1998: Its causes and outcomes. Asia Pac Educ Rev. 2006;7(1):19–32. [Google Scholar]
- 19. Ministry of Education of the People’s Republic of China, 1997–2010 Educational Statistics. Available at www.moe.edu.cn/publicfiles/business/htmlfiles/moe/s6200/index.html. Accessed September 4, 2012. Chinese.
- 20.National Science Board 2010. Science and Engineering Indicators: 2010 (National Science Foundation, Arlington, VA)
- 21. Ministry of Education of the People’s Republic of China (1998–2011) Educational Statistics Yearbook of China (People's Education Press, Beijing). Chinese.
- 22.Gereffi G, Wadhwa V, Rissing B, Ong R. Getting the numbers right: International engineering education in the United States, China, and India. Journal of Engineering Education. 2008;97(1):13–25. [Google Scholar]
- 23.Freeman R. 2009. What does global expansion higher education mean for the US? (National Bureau of Economic Research, Chicago), Working Paper 14962.
- 24.National Science Board 2004. Science and Engineering Indicators: 2004 (National Science Foundation, Arlington, VA)
- 25.National Science Board 2008. Science and Engineering Indicators: 2008 (National Science Foundation, Arlington, VA)
- 26.National Science Board 2012. Science and Engineering Indicators: 2012 (National Science Foundation, Arlington, VA)
- 27.National Science Foundation, National Center for Science and Engineering Statistics 2012. Doctorate Recipients from U.S. Universities: 2011 (National Science Foundation, Arlington, VA)
- 28.Solow R. Technical change and the aggregate production function. Rev Econ Stat. 1957;39(XXXIX):312–320. [Google Scholar]
- 29.Ernst D. Innovation Offshoring: Asia’s Emerging Role in Global Innovation Networks. Honolulu: East-West Center; 2006. [Google Scholar]
- 30.Fan P. Innovation, globalization, and catch-up latecomers: Cases of Chinese telecom firms. Environ Plann A. 2011;43(4):830–849. [Google Scholar]
- 31.Ben-David J. The Scientist’s Role in Society: A Comparative Study. Chicago: The Univ of Chicago Press; 1971. [Google Scholar]
- 32.State Science and Technology Commission of the People’s Republic of China 1998. Guide to China’s Science and Technology Policy (Scientific and Technical Documentation Press, Beijing). Chinese.
- 33. People’s Daily Online (March 26, 2008) Over 10 billion yuan to be invested in “211 Project.” People’s Daily Online. Available at http://english.people.com.cn/90001/6381319.html. Accessed April 15, 2013.
- 34.Editorial Office of China Education Yearbook 2000. China Education Yearbook (People’s Education Press, Beijing). Chinese.
- 35.Organization Department of the Central Committee of the Communist Party of China 2008. Interim procedure of introducing overseas high-level talents (Organization Department of the Central Committee of the Communist Party of China, Beijing), Document No. 28. Chinese.
- 36.Wang H, Miao L. Annual Report on the Development of Chinese Returnees No.2. Beijing: Social Sciences Academic Press; 2013. Chinese. [Google Scholar]
- 37. Zhang Y (April 28, 2012) Thousand talent program brings more pros. China Daily. Available at www.chinadaily.com.cn/bizchina/2012-04/28/content_15168335.htm. Accessed April 15, 2013.
- 38. Cai R (2009) Yi Rao: A critical constructer. China Newsweek 48:60–62. Chinese.
- 39. LaFraniere S (January 6, 2010) Fighting trend, China is luring scientists home. New York Times. Available at www.nytimes.com/2010/01/07/world/asia/07scholar.html?pagewanted=all. Accessed April 15, 2013.
- 40. Wang X (August 5, 2004) Building word-class BT research center. China Economic Herald, Section B02. Chinese.
- 41.Xin H. 2009. Help wanted: 2000 leading to inject a spirit of innovation. Science 325(5940):534–535.
- 42.Organisation for Economic Co-operation and Development 2012. Main science and technology indicators. OECD Science, Technology and R&D Statistics (database). Available at http://stats.oecd.org/Index.aspx?DataSetCode=MSTI_PUB. Accessed May 24, 2014.
- 43.Shi Y, Rao Y. China’s research culture. Science. 2010;329(5996):1128. doi: 10.1126/science.1196916. [DOI] [PubMed] [Google Scholar]
- 44.World Intellectual Property Organization 2013. WIPO statistics database. Available at http://ipstatsdb.wipo.org/ipstatv2/ipstats/patentsSearch. Accessed December 30, 2013.
- 45.Qiu J. Publish or perish in China. Nature. 2010;463(7278):142–143. doi: 10.1038/463142a. [DOI] [PubMed] [Google Scholar]
- 46. Nature (2012) John Maddox prize. Nature 491(7423):160. [DOI] [PubMed]
- 47. White J (November 19, 2012) Fraud fighter: Faked research is endemic in China. New Scientist. Available at www.newscientist.com/article/mg21628910.300-fraud-fighter-faked-research-is-endemic-in-china.html. Accessed April 15, 2013.
- 48.Hvistendahl M. 2013. China's publication bazaar. Science 342(6162):1035–1039.
Associated Data
This section collects any data citations, data availability statements, or supplementary materials included in this article.


