

Abstract
Alterations in the phosphorylation and/or degradation of insulin receptor substrate 1 (IRS-1) produced by burn injury may be responsible, at least in part, for burn-induced insulin resistance. In particular, following burn injury, reductions in glucose uptake by skeletal muscle may be secondary to altered abundance and/or phosphorylation of IRS-1. In this report, we performed in vitro studies with 293 cells transfected with IRS-1. These studies demonstrated that there is a dramatic change in the phosphorylation pattern of Tyr, Ser, and Thr residues in IRS-1 as a function of insulin levels. Specifically, Ser and Thr residues in the C-terminal region were phosphorylated only at high insulin levels. SILAC (stable isotope labeling with amino acids in cell culture) followed by sequencing of C-terminal IRS-1 fragments by tandem mass spectrometry demonstrated that there is significant protein cleavage at these sites. These findings suggest that one of the biological roles of the C-terminal region of IRS-1 may be negative modulation of the finely coordinated insulin signaling system. Clearly, this could represent an important factor in insulin resistance and identification of inhibitors of the kinases that are responsible for the phosphorylation could foster new lines of research for the development of drugs for treating insulin resistance.
Keywords: IRS-1, phosphorylation, degradation, kinase, MS/MS, SILAC
Introduction
The maintenance of glucose levels represents one of the most tightly regulated systems in the body. All cells require glucose, but glucose is only available from what is ingested or produced by the liver. Since glucose cannot be stored in significant amount except as glycogen in liver and muscle, glucose transport into the cell by specific transporter proteins is critical for cell function. Insulin plays a major role in the maintenance of normal glucose levels. Thus, when blood glucose levels rise, insulin secretion is stimulated and this results in increased uptake of by skeletal muscle via glucose transporter proteins and decreased glucose production by the liver. There appears to be several key proteins in the insulin/glucose regulatory cascade; including insulin receptor substrate 1 (IRS-1). When levels of insulin and glucose are abnormally high in the fasting state, a condition called insulin resistance exists.
Hyperglycemia and glucose intolerance are frequently associated with the metabolic response to major trauma. Following injury [1,2], burn shock [3,4] or systemic infection [5,6], oral and intravenous glucose tolerance tests have demonstrated delayed disposal of glucose from plasma into tissues. This “diabetes of injury” could be explained if there was an insulin deficiency, and several studies [7,8,9] have shown that early after trauma (“ebb phase”) insulin concentrations are reduced even in the face of hyperglycemia. After resuscitation of trauma patients (“flow phase”), beta cell responsiveness to glucose administration normalizes and plasma insulin levels are appropriate or even higher than expected [10,11]. However, despite this appropriate acute insulin response to glucose administration, glucose intolerance, and hyperglycemia continue. This finding suggests that some of the tissues in trauma patients are relatively insensitive to the effects of insulin.
Although the number of investigations addressing the mechanism(s) of insulin resistance in trauma patients has been limited, one important study [12] using the euglycemic insulin clamp technique demonstrated: (i) the maximal rate of glucose disposal is reduced in trauma patients; (ii) the metabolic clearance rate of insulin is almost twice normal in these patients; and (iii) post-trauma insulin resistance appears to occur in peripheral tissues; particularly skeletal muscle, and is consistent with a post-receptor effect. Unfortunately, the procedures used in this study were not capable of independently accessing the contributions of glucose transport, phosphorylation, and subsequent intracellular metabolism of glucose. In another study,[13] it was demonstrated that burn injury to rats results in impaired insulin-stimulated transport of [3H]2-deoxyglucose into soleus muscle strips in vitro. These investigators also demonstrated that insulin stimulated phosphoinositide 3-kinase (PI 3-kinase) activity that is pivotal for glucose transport in muscle by glucose transporter 4 (GLUT 4), is decreased by burn injury to rats as measured by its IRS-1 associated activity. These data are consistent with alterations in post-receptor signaling following burn injury, which results in burn induced insulin resistance.
There are numerous reports that describe insulin resistance in burn patients and animal models [14, 15, 16, 17,18, 19,20,21,22,23,24,25, 26,27,28,29,30,31,32,33,34], which is defined as elevated insulin levels in the presence of normal or elevated glucose levels. Direct measurements show that liver and skeletal muscle are resistant tissues [35]. Lipolysis is not attenuated in trauma patients after glucose administration [36]. Although the precise mechanism for insulin resistance produced by burns or other stressors is unknown, it is likely that insulin binding to membrane receptors is unchanged and postreceptor mechanism(s) are of greater importance [37].
Alterations in cytokine levels, (such as TNF, IL-1, and IL-6) in burn patients and animal models of burn injury have been reported by our laboratory and other investigators [38]. Infusion of endotoxin, TNF, and IL-1 can produce alterations in glucose metabolism and insulin resistance in vivo [39,40]. In addition, it has also been shown that endotoxin [41] and IL-6 [42] can produce insulin resistance in isolated hepatocyte cultures. Another study [43] showed that IL-6 inhibits the stimulation of glucokinase by insulin in the isolated hepatocytes. Cortisol, glucagon and epinephrine, can also produce insulin resistance [44]. These molecules oppose the actions of insulin and are termed counter-regulatory hormones. Since these counter-regulatory hormones are elevated, at least initially, after burn injury, it has been proposed that they may play a part in burn induced insulin resistance. The levels of cytokines and counter-regulatory hormones are dramatically altered in burn patients and animal models [45,46,47,48]. It also has been demonstrated that TNF suppresses insulin-induced tyrosine phosphorylation of insulin receptor, and inhibits signaling from the insulin receptor [49,50]. Furthermore, the insulin resistance produced in spontaneously obese rats can be overcome by pretreatment of the animals with antibodies to TNF [51].
Dynamic and stress dependent multi-site phosphorylations of IRS-1 tyrosine, serine and threonine residues have been described to have both positive and negative insulin effects. Tyrosine phosphorylation, in the N- or C-terminal regions of IRS-1 are generally considered to be positive post-translational modifications (PTM) in insulin signaling pathways. In contrast, phosphorylations of serine and threonine residues at the C-terminal region are usually considered to be negative PTMs, however, some positive effects of serine phosphorylations have been reported. A number of IRS-1 phosphorylation sites have been identified with different approaches such as: radiolabeling with [γ- 32p] ATP [52,53,54,55,56], immunoblotting with anti-phosphopeptide antibodies [57,58,59,60,61,62,63,64,65,66], studies with mutated IRS-1 [67,68,69] and on- or off-line HPLC interfaced with MALDI-TOF or ESI-TOF [70,71,72,73,74]. The large variation and poor reproducibility of reported phosphorylation sites can be explained by: method sensitivities, enzymatic and chemical stabilities of the phosphorylated sites and stimuli dosages/timing. Proposed mechanisms for impairment of the insulin signaling system by phosphorylations of serine and threonine residues include: feedback inhibition, cooperative interactions, uncoupling of the protein signaling network [75,76,77,78,79] and ubiquitin-proteasome degradation [80,81,82,83,84,85,86]. It is fair to state that, to date, the ability of insulin to alter phosphorylations patterns of IRS-1 is poorly understood. However, since negative biological effects IRS-1 c-terminal phosphorylations may provide clues for exploring the mechanism of insulin resistance [87,88,89,90,91], after burn injury [92,93,94,95], evaluation of this issue has become a major focus of our laboratory.
In this report, we used nano-LC interfaced with tandem mass spectrometry to pin-point IRS-1 phosphorylation sites in a well-defined in vitro system. An N-terminal specific mAb, raised in our laboratory, was used for studying the phosphorylation pattern of IRS-1 after treatment with varying concentrations of insulin. Stable isotope labeling by amino acids in cell culture (SILAC) measurements indicated that at least 50% of IRS-1 was degraded in our studies (insulin: 1 μM, 10 min). Thus, the phosphorylation sites and SILAC results predicted that multiple fragmentations may occur in the middle of the C-terminus of IRS-1. In order to capture these informative IRS-1 fragments, a commercially available C-terminal specific mAb was used in conjunction with SDS-PAGE. MS/MS sequence data unambiguously confirmed (for the first time), the two predicted IRS-1 fragments with apparent MW's of ∼80 kDa and ∼65 kDa, on SDS-PAGE. The multiple cleavages at the C-terminus of IRS-1 were attributed to phosphorylations at Thr475, Thr477 (80 kDa) and Ser641 (65 kDa) by sequence analysis. These results may provide pharmaceutical targets for producing drugs that inhibit sequence specific Ser/Thr kinases. These reagents could, normalize the metabolic alterations such as abnormal cytokine release and altered protein catabolism that are associated with insulin resistance in critically ill patients with burn injuries.
Materials and Methods
Chemicals
Acetonitrile (ACN, LC-MS Chromasolv), formic acid (FA), glacial acetic acid, LC-MS grade water, [Glu1]-Fibrinopeptide B and 2-mercaptoethanol were obtained from Sigma Chemical Co. (St. Louis, MO). SDS-PAGE ready gels (7.5% Tris-HCl), Laemmli sample buffer (Cat # 161-0737) and Coomassie brilliant blue R-250 (Cat # 161-0436) were obtained from BIO-RAD. Trypsin profile IGD kits (Cat # PP0100) were obtained from Sigma. Anti-IRS-1 monoclonal antibody (Cat # 05-699) and recombinant IRS-1 were purchased from Upstate (Charlottesville, VA). Insulin, Potassium Bisperoxo (bipyridine) oxovanadate, Calyculin A (Discodermia calyx) and SILAC phosphoprotein identification kits (Cat # SP10001) were products of In vitrogene (Carlsbad, California). Protein G agarose beads was purchased from Pierce (Rockford, IL).
Preparation of monoclonal antibodies to IRS-1
Monoclonal antibodies were generated using traditional methods. Briefly, BALB-C mice were immunized with 5 to 100 μg of protein in 25 to 50 μL of Freud's Complete Adjuvant (Sigma) in 4 to 6 subcutaneous sites. The material used for immunization was a GST fusion protein containing 150 amino acids from the N-terminus of IRS-1 (MASPPESDGFSDVRKVGYLRKPKSMHKRFFVLRAASEAGGPARLEYYENE KKWRHKSSAPKRSIPLESCFNINKRADSKNKHLVALYTRDEHFAIAADSE AEQDSWYQALLQLHNRAKGHHDGAAALGAGGGGGSCSGSSGLGEAGEDLS). The same immunogen (in 25 to 50 μL of Freund's incomplete adjuvant) was used for “booster” injections (4-6 subcutaneous sites) in the animals at two week intervals. Once suitable blood titers were obtained, spleen cells where harvested and fused [PEG method] with SP 2/0 myeloma cells to generate hybridomas secreting monoclonal antibodies recognizing IRS-1 protein. These procedures, as well as all animal handling protocols, were reviewed and approved by the local animal studies review board. The animals were housed and handled in the institution's AAALAC accredited facilities. Three mAb (3D10, 4C6 and 5G7) were protein G purified and stored (0.1 M bicarbonate buffer, pH = 9.2) at –70°C. Screening of these antibodies was performed against recombinant IRS-1, and selected by both the highest tryptic peptide coverage and MS/MS sequence scores.
Transfection of 293 Mammalian Cells with Recombinant IRS-1
An appropriate plasmid was prepared by sub-cloning of IRS-1 tagged plasmids PCMVIRS transfected into DH5α competent E. coli (Invitrogen). The transformed E. coli were incubated on Luria Broth plates with ampicillin. Single colonies were picked and incubated in Luria Broth medium with ampicillin and the plasmids were purified using the Purelink Hipure Plasmid DNA purification maxiprep system (Invitrogen). Mammalian 293 cells, supplied from the American Type Culture Collection, were transfected with the recombinant IRS-1 tagged plasmid using a liposome reagent (In vitrogen) and Opti-MEM medium (Gibco) to deliver the plasmid DNA into the cells. IRS-1 expression was checked by Western blot. Anti IRS-1 (mouse) monoclonal primary antibody (Sigma) and Cell Signaling anti-mouse IgG HRP-linked secondary antibody (GE Healthcare) as well as anti-IRS-1 primary (rabbit) (Upstate) and Cell Signaling anti-Rabbit IgG HRP-linked secondary antibody (GE Healthcare) were used to probe the blots.
Insulin stimulation
Mammalian 293 cells transfected with recombinant IRS-1 were grown to confluence and placed in serum-free Dulbecco's modified Eagle's medium (DMEM) for 2 hrs. The cells were then treated with insulin (0, 50, 100, 150, 250, 500, 750 and1000 nM) for 10 min. Twelve culture plates for each insulin concentration were used for phosphorylation studies. After insulin treatment, the medium was aspirated, and the cells were lysed in Reporter lysis buffer with phosphatase cocktail inhibitors containing 50 nM Potassium Bisperoxo(bipyridine)oxovanadate and 5 nM Calyculin A (Discodermia calyx) at 4°C. SILAC was performed at an insulin concentration of 1 μM for 10 min according to the SILAC phosphoprotein identification kit protocol (In vitrogene, SP10001) with [U-13C6]-L-lysine and [U-13C6]-L-arginine.
Immunoprecipitations of human IRS-1 and its C-terminal fragments
Intact IRS-1 was immnunoprecipitated with selected N-terminal specific mAb (5G7, 5 μg) and prewashed protein G agarose beads (50 μL packed vol). The reaction mixtures were gently stirring in PBS (200 μL) at 4°C for 1 hr and excess mAb was removed with PBS (1 mL × 3). Cell lysates (containing human IRS-1, with total proteins ∼2.5 mg/mL, 3 ml for each IP) were centrifuged at 14,000 × g for 2 min, and filtered (0.22 μm) at 4°C. The processed cell lysates and washed immunobeads were gently stirring at 4°C for 2 hrs. The immunocomplex beads were centrifuged at 14,000 × g for 15 sec and washed with PBS (1 mL × 3, for 2 min each). IRS-1 was released and cysteine residues were alkylated with Laemmli sample buffer (with 5% 2-mercaptonal, 50 μL) for 5 min at 95°C and then 1 hr at room temperature under stirring. The reaction mixtures were separated by SDS-PAGE (7.5% Tris-HCl, Ready gels), IRS-1 bands stained with Coomassie brilliant blue R-250 were excised and in-gel trypsin digestion was performed (0.2 μg trypsin in 70 μL reaction buffer, 37oC, over night).
Fragments of IRS-1 C-terminal were immunoprecipitated with mAb raised to the first C-terminal 14 amino acid residues if IRS-1, (05-699, clone 1M92-7, Upstate) using the methods described above.
Nano-LC interfaced with Q-TOF tandem mass spectrometry
The phosphorylated peptides induced with various insulin dosages were analyzed by nano-LC coupled to a Q-TOF hybrid mass spectrometer from Micromass; equipped with an in-house fabricated electrospary (PicoTip emitter, FS360-20-10-D-20-C7, New Objective) and operated in the positive ion mode. Chromatographic separation was achieved using a C18 PepMap300 column (5 μm, 75 μm I.D. × 15 cm length, LC Packings). HPLC gradient elution (160 nL/min) was performed with mobile phase A (water: 98%, acetonitrile: 2% formic acid: 0.1%) and mobile phase B (acetonitrile / 0.1% formic acid) starting with 2% B, 2 min isocratic, up to 80% B over 25 min (linear gradient), 10 min of isocratic elution with 80% B, and a return to 2% B over 5 min. The column was reconditioned with starting mobile phase for 30 min before the next analysis. Five μL of digested peptide mixture was trapped and desalted with a μ-Precolumn Cartridge (PepMap C18, 5 μm, 300 μm I.D. × 5 mm, LC Packings) for 2 min at a flowrate of 15 μL/min. [Glu1]-fibrinopeptide B (100 fmol/uL constant infusion, Sigma) was used for mass calibration. Optimized Q-TOF conditions were: ESI capillary voltage 3500 V, cone voltage 35 V, source temperature 80°C. Quadrupole-1 was set to bandwidth bypass mode and the TOF analyzer was scanned over m/z 400 to 1200 with 1 second integration time (mass resolution was 5500 FWHM at a mass of 785.84). Data were recorded in continum DDA mode under CE 5V. Phosphorylated peptides were manually checked in order to reduce false positive discoveries.
Results and Discussion
Screenings of the three anti-IRS-1 mAbs (3D10, 4C6 and 5G7) were performed based on each mAb's immunoprecipitated IRS-1 sequence coverage as well as sequence scores obtained with Q-TOF tandem mass spectrometry (Table 1). A total of 11 tryptic peptides of human IRS-1 expressed in the cell line were found to have satisfactory MS/MS scores using PepSeq of MassLynx V4.1 software. Since reproducability of the sequencing results (Table 1) indicated that mAb (5G7) was the best choice, it was used for the in vitro studies of insulin effects.
Table 1. Screening Results for 3 Monoclonal Antibodies (MS/MS scores were obtained from MassLynx 4.1).
| Tryptic ID | Sequences | Charge | MS Theory | 3D10 | 4C6 | 5G7 |
|---|---|---|---|---|---|---|
| T19 | 82-HLVALYTR-89 | 2 | 971.56 | 88 | ||
| T23 | 162-EVWQVILKPK-171 | 2 | 1238.74 | 191 | ||
| T28 | 197-LNSEAAAVVLQLMNIR-227 | 2 | 1740.96 | 56 | ||
| T45-46 | 365-LHPPLNHSRSIPMPASR-381 | 2 | 1909.01 | 31 | ||
| T51 | 444-SVTPDSLGHTPPAR-457 | 2 | 1434.73 | 166 | ||
| T63 | 581-SYPEEGLEMHPLER-594 | 2 | 1685.77 | 53 | ||
| T66-67 | 627-KGSGDYMPMSPK-638 | 2 | 1296.58 | 25 | ||
| T68 | 639-SVSAPQQIINPIR-651 | 2 | 1421.80 | 173 | 154 | |
| T92 | 952-AAWQESTGVEMGR-964 | 2 | 1420.64 | 91 | 165 | |
| T96 | 999-QSYVDTSPAAPVSYADMR-1016 | 2 | 1956.89 | 37 | 58 | |
| T97 | 1017-TGIAAEEVSLPR-1028 | 2 | 1241.66 | 58 | 145 | 188 |
A total of 260 IRS-1 tryptic peptides, both doubly and triply charged under electrospray ionization, were located within the Q-TOF mass survey window (from m/z 400 to 1200). The chromatographic elution time window was about 30 min with the nano-LC gradient conditions that were employed; it was impossible to chromatographically separate the digested IRS-1 peptide mixture at the single peptide level since many of the tryptic peptides that were eluted overlapped. In other words, at any given retention time, several peptides may be recognized by the mass survey. To overcome these problems, 6 precursor ions which can be selected for MS/MS sequence analysis from a single MS survey scan (precursor ion charge state recognitions under ESI) were selected to provide secondary mass resolution as supplementation to the chromatographic separation. False positive precursor ions attributable to contaminations were eliminated by MS/MS sequence analysis. The nano-LC Q-TOF settings described above do have false negative discoveries; these missed precursor ions may be due to their week hydrophobic properties (escaping from the trapping C18 column that was used for desalting), week ionizations and/or chemical alternations in predictable peptide structures. However, the positively identified precursor ions under our experimental conditions represent desirable candidate peptides for phosphorylation studies at the proteomic level. Thus, unambiguously discovered peptides were selected as relative MS fingerprints for IRS-1 protein expression and post-translational modification analysis in the insulin treatment studies. A representative nano-LC chromatogram of in-gel trypsin digested IRS-1 is shown in Figure 1.
Figure 1.
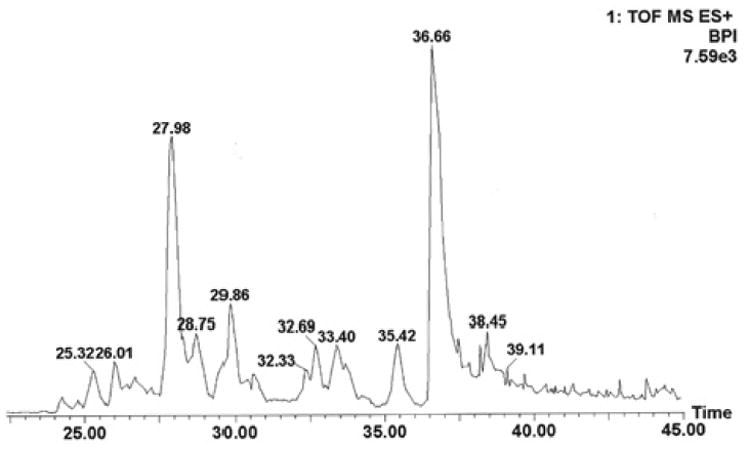
Nano-LC base peak ion chromatogram of human IRS-1 tryptic peptides. Column: C18 PepMap 300 column (5 μm, 75 μm I.D. × 15 cm length). Flow rate: 160 nL/min. Desalting column: μ-Precolumn Cartridge (PepMap C18, 5 μm, 300 μm I.D. × 5 mm, LC Packings) for 2 min at a flowrate of 15 μL/min. Gradient conditions are described in the text.
The in vitro IRS-1 phosphorylation pattern as a function of increasing insulin concentration is shown in Table 2. The phosphorylated sequence sites were assigned by 79.97 Da mass differences between phosphorylated b or y ions and corresponding non-phosphorylated ions at the 50 mDa mass accuracy of their centroid MS/MS spectra. Typical MS/MS sequences of insulin dependent phosphorylation sites pSer641 and pThr1017 of IRS-1 are shown in Figures 2 and 3.
Table 2. Effect of Insulin Concentration on Human IRS-1 Phosphorylation Pattern.
| Insulin nM | 0 | 50 | 100 | 150 | 250 | 500 | 750 | 1000 |
|---|---|---|---|---|---|---|---|---|
|
| ||||||||
| pSer323 | pSer308 | pSer323 | pSer308 | pSer323 | pSer641 | pSer641 | pSer641 | |
| pThr305 | pThr305 | pSer1132 | pSer641 | pSer486 | pThr475 | pThr475 | pThr475 | |
| pTyr1001 | pTyr1001 | pThr1116 | pSer641 | pThr1017 | pThr1017 | pThr477 | ||
| sites | pTyr1012 | pTyr1012 | pTyr558 | pTyr558 | pTyr558 | pTyr558 | pThr1017 | |
| pTyr1001 | pTyr1001 | |||||||
| pTyr1012 | pTyr1012 | |||||||
Figure 2.
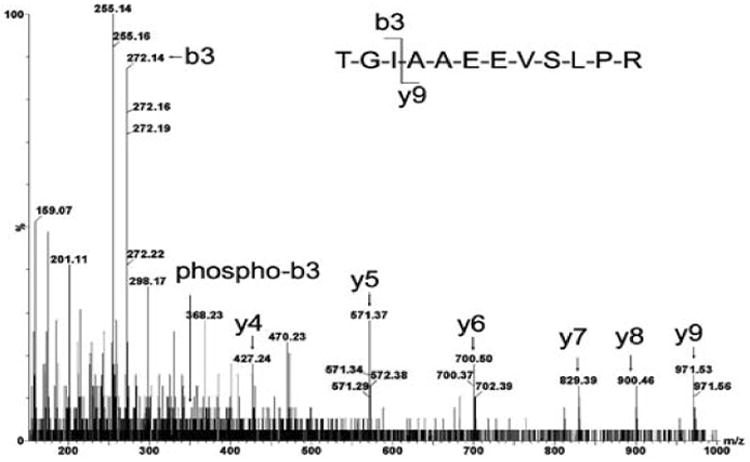
MS/MS sequence analysis of pThr1017 peptide detected with DDA: doubly charged, [M+2H]2+ (m/z= 621.84), 1017-TGIAAEEVSLPR-1028 1017 Thr-Gly-Ile, non-phosphorylated b3 ion (m/z = 272.16) and corresponding phosphorylated b3 ion (m/z = 352.13) were observed after insulin stimulation.
Figure 3.
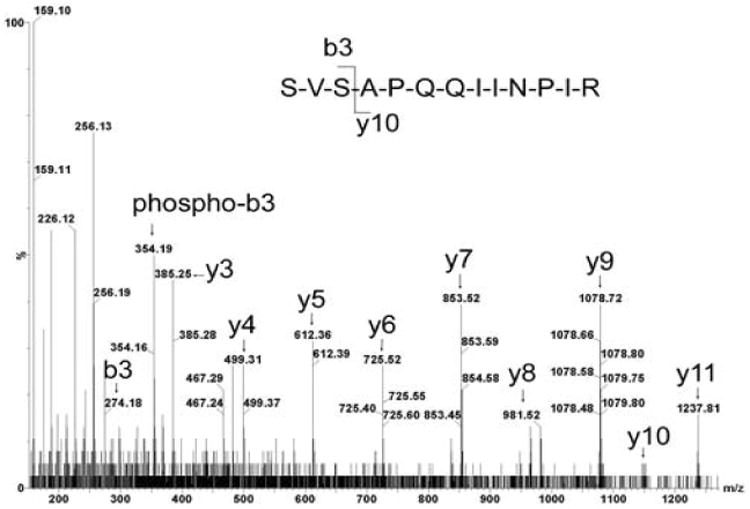
MS/MS sequence analysis of pSer641 peptide detected with DDA: doubly charged, [M+2H]2+ (m/z= 711.91), 639-SVSAPQQIINPIR-651 639Ser-Val, b2 ion (m/z = 187.12). No corresponding phosphorylated 639Ser b2 ion was observed (expected: m/z = 267.09). 639Ser-Val-Ser641, b3 ion (m/z= 274.14), phosphorylated b3 ion (m/z = 354.17), indicated phosphorylation at Ser641 in control IRS-1.
The striking insulin dependent phosphorylation pattern indicates that pThr475, pThr477 and pSer641 were induced by high levels of insulin. These phosphorylated sites provided the first clue for understanding the negative effects of insulin (possibly via the ubiquitin-proteosome pathway) and suggested a possible mechanism for insulin resistance. SIALIC was used to study IRS-1 degradation at these phosphorylation sites at high insulin dosages (1 μM, 10 min). Tryptic peptide T23 without phosphorylation (162-EVWQVILKPK-171) labeled with heavy isotopes (insulin stimulation) and light isotopes (without insulin) was used as a mass marker to evaluate IRS-1 phosphorylation under varying insulin conditions. Relative peak areas of precursor peptides indicated that at least 50% of IRS-1 was rapidly degraded. The critical question is whether IRS-1 degradation is trigged at the three phosphorylated sites(x0003f) To address this question, two major C-terminal fragments at the cleavage sites pThr475, pThr477 and pSer641 must be obtained if there was 50% degradation. The predicated C-terminal fragment cleaved at sites pThr475 pThr477 is expected at 80,673 Da and the second fragment cleaved at site pSer641 is expected at 64,441 Da. When C-terminal specific mAb (05-699, 5 μg) was used in the insulin stimulation studies, SDS-PAGE showed that the IRS-1 band was reduced by ∼50% with 1000 nM insulin (for 10 min) as compared with the control; in agreement with the SILAC result. The multiple bands between 50 kDa (IgG heavy chain) and 100 kDa (dimer of IgG heavy chain; 2-mercaptoethanol is not sufficient for complete reduction of all disulfide bonds, Figure 4) were excised, digested and subjected to nano-LC Q-TOF sequence analysis. Sequencing confirmed that the human IRS-1 bands in Figure 4 were slightly lower in MW than rat IRS-1 standard (about 165 kDa). The fragment band represented by band #1 (∼ 80 kDa estimated from SDS-PAGE) was confirmed with two human IRS-1 sequences: 639-SVSAPQQIINPIR-651 and 1017-TGIAAEEVSLPR-1028. Also, the cleavage site precursor ion (472-GPSPTLPTAPNGHYILSR-487) was no longer detected. The fragment represented by band #4 (∼ 65 kDa from SDS-PAGE) was confirmed only with 1017-TGIAAEEVSLPR-1028, whereas, the precursor ion (639-SVPSAPQQIINPIR-651) corresponding to this cleavage was missed from our MS survey list. These three observations confirm an inhibitory mechanism at high insulin conditions; stressed cells treated with high concentrations of insulin activate unknown kinases to phosphorylate threonine and serine residues located in the middle of the C-terminus of IRS-1 and the multiple phosphorylated sites may trigger the ubiquitin-proteosome pathway. The C-terminus of IRS-1 cleaved around pThr475 and pThr 477 afforded the fragment with MW ∼ 80 kDa, while the fragment with MW ∼65 kDa was related to pSer641. The observations that serine phosphorylation decreases insulin-stimulated tyrosine phosphorylation of IRS-1 [96] and proteolytic turnover of the protein [97] suggest that IRS-1 function is modulated by both positive (N-terminal) and negative (C-terminal) mechanisms. Negative modulation is associated with serine phosphorylation at the N-terminus of the protein; with the C-terminal boundary at residue 574 [98]. Ser/Thr kinases, such as mTOR/S6k and Akt1, may be involved in C-terminal cleavages triggered by multisite phosphorylations. In contrast, positive signaling effects at low insulin levels were associated with pSer308, pThr305 and pTyr1012. Phosphorylated Tyr1012 may be one of the downstream SH2 domain binding sites, since it possesses the characteristic YADM sequence. Thus, sequence specific Ser/Thr kinases might be pharmaceutical targets for modulating insulin resistance.
Figure 4.

SDS-PAGE of fragmented human IRS-1:Insulin: 1000 nM, 10 min. C-terminal mAb: 05-699 (5 μg), protein G beads: 50 μL (packed). Immunobeads were prepared at 4°C for 1 hour and washed with chilled PBS (1 mL × 3). Six cell culture plates were evaluated for each insulin concentration. Cell lysates were filtered through 0.22 μm membranes. Immunoprecipitation were performed at 4°C for 2 hours and excess proteins were removed with three PBS washes. Ready gels (7.5%, Bio-RAD, 30 μL per well) were used used for separation and protein bands were stained with Coomassie brilliant blue R-250. Left lane: Rat IRS-1 as MW marker. Middle lane: 15 μL of IP mixtures. Right lane: 30 μL of IP mixtures. Human IRS-1 bands from the in vitro experiments corresponded to a slightly lower molecular weight compared with standard rat IRS-1 band. Fragment band #1 (∼ 80 kDa) was confirmed with two sequences: 639-SVSAPQQIINPIR-651 and 1017-TGIAAEEVSLPR-1028 and fragment band #4 (∼ 65 kDa) was confirmed with 1017-TGIAAEEVSLPR-1028
Conclusions
The observed effects of insulin concentration on phosphporylation pattern of IRS-1, could represent an important factor in insulin resistance. C-terminal cleavages may be produced at specific phosphorylated Ser/Thr sites. Also, 2 major C-terminal fragments (sequenced with tandem MS), point to the left boundary of the C-terminus as an important region for negative modulatory effects. In the future, identification of inhibitors of the kinases that are responsible for the phosphorylations could foster new lines of research for the development of drugs for treating insulin resistance (99).
Abbreviations
- ESI
electrospray ionization
- DDA
data dependent acquisition
- IRS-1
insulin receptor substrate-1
- PTM
post translational modification
- Q-TOF
tandem quadrupole time-of-fight mass spectrometry
- SILAC
stable isotope labeling by amino acids in cell culture
References
- 1.Carey LC, Lowery BD, Cloutier CT. Blood sugar and insulin response of humans in shock. Ann Surg. 1970;172:342–350. doi: 10.1097/00000658-197009000-00004. [DOI] [PMC free article] [PubMed] [Google Scholar]
- 2.Thomsen V. Studies in trauma and carbohydrate metabolism with special reference to the existence of traumatic diabetes. Acta Med Scand. 1938;96:1–416. [Google Scholar]
- 3.Allison SP, Hinton P, Chamberlain MJ. Intravenous glucose-tolerance, insulin, and free-fatty-acid levels in burned patients. Lancet. 1968;2:1113–1116. doi: 10.1016/s0140-6736(68)91581-x. [DOI] [PubMed] [Google Scholar]
- 4.Taylor FHL, Levenson SM, Adams MA. Abnormal carbohydrate metabolism in human thermal burns. N Engl J Med. 1944;231:437–445. [Google Scholar]
- 5.Rayfield EJ, Curnow RT, George DT, Beisel WR. Impaired carbohydrate metabolism during a mild viral illness. N Engl J Med. 1973;289:618–621. doi: 10.1056/NEJM197309202891207. [DOI] [PubMed] [Google Scholar]
- 6.Williams JL, Dick GF. Decreased dextrose tolerance in acute infectious disease. Arch Intern Med. 1932;50:801–818. [Google Scholar]
- 7.Carey LC, Lowery BD, Cloutier CT. Blood sugar and insulin response of humans in shock. Ann Surg. 1970;172:342–350. doi: 10.1097/00000658-197009000-00004. [DOI] [PMC free article] [PubMed] [Google Scholar]
- 8.Allison SP, Hinton P, Chamberlain MJ. Intravenous glucose-tolerance, insulin, and free-fatty-acid levels in burned patients. Lancet. 1968;2:1113–1116. doi: 10.1016/s0140-6736(68)91581-x. [DOI] [PubMed] [Google Scholar]
- 9.Wilmore DW, Mason AD, Pruitt BA. Insulin response to glucose in hypermetabolic burn patients. Ann Surg. 1976;183:314–320. doi: 10.1097/00000658-197603000-00018. [DOI] [PMC free article] [PubMed] [Google Scholar]
- 10.Allison SP, Hinton P, Chamberlain MJ. Intravenous glucose-tolerance, insulin, and free-fatty-acid levels in burned patients. Lancet. 1968;2:1113–1116. doi: 10.1016/s0140-6736(68)91581-x. [DOI] [PubMed] [Google Scholar]
- 11.Wilmore DW, Mason AD, Pruitt BA. Insulin response to glucose in hypermetabolic burn patients. Ann Surg. 1976;183:314–320. doi: 10.1097/00000658-197603000-00018. [DOI] [PMC free article] [PubMed] [Google Scholar]
- 12.Wilmore DW, Aulick HL, Goodwin CW. Glucose metabolism after severe injury. Acta Chir Scand Supp. 1980;498:43–47. [PubMed] [Google Scholar]
- 13.Ikezu T, Okamoto T, et al. Analysis of thermal injury-induced insulin resistance in rodents. Implication of postreceptor mechanisms. J Biol Chem. 1997;272:25289–25295. doi: 10.1074/jbc.272.40.25289. [DOI] [PubMed] [Google Scholar]
- 14.Mizock BA. Alterations in carbohydrate metabolism during stress: a review of the literature. Am J Med. 1995;98:75–84. doi: 10.1016/S0002-9343(99)80083-7. [DOI] [PubMed] [Google Scholar]
- 15.Grecos GP, Abbott WC, Schiller WR, Long CL, Birkhahn RH, Blakemore WS. The effect of major thermal injury and carbohydrate-free intake on serum triglycerides, insulin and 3-methylhistidine excretion. Ann Surg. 1984;200:632–637. doi: 10.1097/00000658-198411000-00013. [DOI] [PMC free article] [PubMed] [Google Scholar]
- 16.Thomas R, Aikawa N, Burke JF. Insulin resistance in peripheral tissues after a burn injury. Surgery. 1979;86:742–747. [PubMed] [Google Scholar]
- 17.Turinsky J, Patterson SA. Proximity of a burn wound as a new factor in considerations of postburn insulin resistance. J Surgical Res. 1979;26:171–174. doi: 10.1016/0022-4804(79)90096-9. [DOI] [PubMed] [Google Scholar]
- 18.Woolfson AMJ, Heatley RV, Allison SP. Insulin to inhibit protein catabolism after injury. N Engl J Med. 1979;300:14–17. doi: 10.1056/NEJM197901043000104. [DOI] [PubMed] [Google Scholar]
- 19.Wilmore DW, Mason AD, Pruitt BA. Insulin response to glucose in hypermetabolic burn patients. Ann Surg. 1976;183:314–320. doi: 10.1097/00000658-197603000-00018. [DOI] [PMC free article] [PubMed] [Google Scholar]
- 20.Wolfe RR, Drukot MJ, Wolfe MH. Effect of thermal injury on energy metabolism, substrate kinetics and hormonal concentrations. Circ Shock. 1982;9:383–394. [PubMed] [Google Scholar]
- 21.Hinton PS, Allison SP, Littlejohn S, Lloyd J. Insulin and glucose to reduce catabolic response to injury in burned patients. Lancet. 1971;1:767–769. doi: 10.1016/s0140-6736(71)91213-x. [DOI] [PubMed] [Google Scholar]
- 22.Allison SP, Hinton P, Chamberlain MJ. Intravenous glucose-tolerance, insulin, and free fatty-acid levels in burned patients. Lancet. 1968;2:113–116. doi: 10.1016/s0140-6736(68)91581-x. [DOI] [PubMed] [Google Scholar]
- 23.Wolfe RR, Durkot MJ, Allsop JR, Burke JF. Glucose metabolism in severely burned patients. Metab Clin Exp. 1979;28:1031–1039. doi: 10.1016/0026-0495(79)90007-6. [DOI] [PubMed] [Google Scholar]
- 24.Jahoor F, Herndon DN, Wolfe RR. Role of insulin and glucagon in the response of glucose and alanine kinetics in burn-injured patients. J Clin Invest. 1986;78:807–814. doi: 10.1172/JCI112644. [DOI] [PMC free article] [PubMed] [Google Scholar]
- 25.Jahoor F, Herndon DN, Wolfe RR. Role of insulin and glucagon in the response of glucose and alanine kinetics in burn-injured patients. J Clin Invest. 1986;78:807–814. doi: 10.1172/JCI112644. [DOI] [PMC free article] [PubMed] [Google Scholar]
- 26.Jahoor F, Shangraw RE, Miyoshi H, Wallfish H, Herndon DN, Wolfe RR. Role of insulin and glucose oxidation in mediation the protein catabolism of burns and sepsis. Am J Physiol. 1989;257:E323–E331. doi: 10.1152/ajpendo.1989.257.3.E323. [DOI] [PubMed] [Google Scholar]
- 27.Black PR, Brooks DC, Bessey PQ, Wolfe RR, Wilmore DW. Mechanism of insulin resistance following injury. Ann Surg. 1982;196:420–435. doi: 10.1097/00000658-198210000-00005. [DOI] [PMC free article] [PubMed] [Google Scholar]
- 28.Frayn KN. Effects of burn injury on insulin secretion and sensitivity to insulin in the rat in vivo. Eur J Clin Invest. 1975;5:331–337. doi: 10.1111/j.1365-2362.1975.tb00462.x. [DOI] [PubMed] [Google Scholar]
- 29.Allsop JR, Wolfe RR, Burke JF. Glucose kinetics and responsiveness to insulin in the rat injured by burn. Surg Gyn Obstetrics. 1978;147:565–573. [PubMed] [Google Scholar]
- 30.Frayn KN, Le Marchand-Brustel Y, Freychet P. Studies on the mechanism of insulin resistance after injury in the mouse. Diabetologia. 1978;14:337–341. doi: 10.1007/BF01223026. [DOI] [PubMed] [Google Scholar]
- 31.Turinsky J, Saba TM, Scovil WA, Chesnut T. Dynamics of insulin secretion and resistance after burns. J Trauma. 1977;17:344–350. doi: 10.1097/00005373-197705000-00002. [DOI] [PubMed] [Google Scholar]
- 32.Turinsky J. Glucose metabolism in the region recovering from burn injury: effect of insulin on 2-deoxyglucose uptake in vivo. Endocrinology. 1983;113:1370–1376. doi: 10.1210/endo-113-4-1370. [DOI] [PubMed] [Google Scholar]
- 33.Wogensen L, Jensen M, Svensson P, Worsaae H, Welinder B, Nerup J. Pancreatic beta-cell function and interleukin-1 beta in plasma during the acute phase response in patients with major burn injuries. Europ J Clin Invest. 1993;23:311–319. doi: 10.1111/j.1365-2362.1993.tb00780.x. [DOI] [PubMed] [Google Scholar]
- 34.Black PR, Brooks DC, Bessey PQ, Wolfe RR, Wilmore DW. Mechanisms of insulin resistance following injury. Ann Surg. 1982;196:420–35. doi: 10.1097/00000658-198210000-00005. [DOI] [PMC free article] [PubMed] [Google Scholar]
- 35.Wilmore DW, Mason AD, Pruitt BA. Insulin response to glucose in hypermetabolic burn patients. Ann Surg. 1976;183:314–320. doi: 10.1097/00000658-197603000-00018. [DOI] [PMC free article] [PubMed] [Google Scholar]
- 36.Wolfe RR, Drukot MJ, Wolfe MH. Effect of thermal injury on energy metabolism, substrate kinetics and hormonal concentrations. Circ Shock. 1982;9:383–394. [PubMed] [Google Scholar]
- 37.Mizock BA. Alterations in carbohydrate metabolism during stress: a review of the literature. Am J Med. 1995;98:75–84. doi: 10.1016/S0002-9343(99)80083-7. [DOI] [PubMed] [Google Scholar]
- 38.Mester MM, Carter EA, Tompkins RG, Gelfand JA, Dinarello CA, Burke JF, Clark BD. Thermal injury induces very early production of interleukin-1 alpha in the rat by mechanisms other than endotoxemia. Surgery. 1994;115:588–96. [PubMed] [Google Scholar]
- 39.Lang CH, Dobrescu C, Burke JF. Tumor necrosis factor impairs insulin action on peripheral glucose disposal and hepatic glucose output. Endocrinology. 1992;130:43–52. doi: 10.1210/endo.130.1.1727716. [DOI] [PubMed] [Google Scholar]
- 40.Ling PR, Bristrian BR, Mendez B, Igtfan NW. Effects of systemic infusion of endotoxin, tumor necrosis factor, and interleukin-1 on glucose metabolism in the rat: relationship to endogenous glucose production and peripheral tissue glucose uptake. Metabolism. 1994;43:279–284. doi: 10.1016/0026-0495(94)90093-0. [DOI] [PubMed] [Google Scholar]
- 41.Portoles MT, Pagan R, Ainaga MJ, Diaz-Laviada I, Municio AM. Lipopolysaccharide-induced insulin resistance in monolayers of cultured hepatocytes. Br J Exp Path. 1989;70:199–205. [PMC free article] [PubMed] [Google Scholar]
- 42.Christ B. Inhibition by recombinant human interleukin-6 of the glucagon-dependent induction of phosphopyruvate carboxykinase gene expression in cultured rat hepatocytes: regulation of gene transcription and messenger RNA degradation. Hepatology. 1994;20:1577–1583. doi: 10.1002/hep.1840200629. [DOI] [PubMed] [Google Scholar]
- 43.Christ B. Inhibition by recombinant human interleukin-6 of the glucagon-dependent induction of phosphopyruvate carboxykinase gene expression in cultured rat hepatocytes: regulation of gene transcription and messenger RNA degradation. Hepatology. 1994;20:1577–1583. doi: 10.1002/hep.1840200629. [DOI] [PubMed] [Google Scholar]
- 44.Cryer PE. Hypoglycemia: the limiting factor in the management of IDDM. Diabetes. 1994;43:1378–1389. doi: 10.2337/diab.43.11.1378. [DOI] [PubMed] [Google Scholar]
- 45.deBandt JP, Chollet-Martin S, Hernvann A, Lioret N, du Roure LD, Lim SK, Vaubau-dole M, Guiechot J, Saizy R, Giboudeau J. Cytokine response to burn injury: relationship with protein metabolism. J Trauma. 1994;36:624–628. doi: 10.1097/00005373-199405000-00004. [DOI] [PubMed] [Google Scholar]
- 46.Frayn KN, Le Marchand-Brustel Y, Freychet P. Studies on the mechanism of insulin resistance after injury in the mouse. Diabetologia. 1978;14:337–341. doi: 10.1007/BF01223026. [DOI] [PubMed] [Google Scholar]
- 47.Burke JF, Wolfe RR, Mullanye J, Matthews DE, Bier DM. Glucose requirements following burn injury. Ann Surg. 1979;190:274–283. doi: 10.1097/00000658-197909000-00002. [DOI] [PMC free article] [PubMed] [Google Scholar]
- 48.Cryer PE. Hypoglycemia: the limiting factor in the management of IDDM. Diabetes. 1994;43:1378–1389. doi: 10.2337/diab.43.11.1378. [DOI] [PubMed] [Google Scholar]
- 49.Feinstein R, Kanetyh H, Papa MZ, Lunenfield B, Karazik A. Tumor necrosis factor alpha suppresses insulin-induced tyrosine phosphorylation of insulin receptor and its substrates. J Biol Chem. 1993;268:26055–26058. [PubMed] [Google Scholar]
- 50.Hotamisligil GS, Murray DL, Choy LN, Spiegelman BM. Tumor necrosis factor inhibits signaling from the insulin receptor. PNAS. 1994;91:4854–4858. doi: 10.1073/pnas.91.11.4854. [DOI] [PMC free article] [PubMed] [Google Scholar]
- 51.Hotamisligil GS. Reduced tyrosine kinase activity of the insulin receptor in obesity-diabetes: central role of tumor necrosis factor. J Clin Invest. 1994;94:1543–1549. doi: 10.1172/JCI117495. [DOI] [PMC free article] [PubMed] [Google Scholar]
- 52.Sun XJ, Crimmins DL, Myers MG, Miralpeix M, White MF. Pleiotropic insulin signals are engaged by multisite phosphorylation of IRS-1. Mol Cell Biol. 1993;13:7418–7428. doi: 10.1128/mcb.13.12.7418. [DOI] [PMC free article] [PubMed] [Google Scholar]
- 53.Liberman Z, Eldar-Finkelman H. Serine 332 phosphorylation of insulin receptor substrate-1 by glycogen synthase kinase-3 attenuates insulin signaling. J Biol Chem. 2005;280:4422–4428. doi: 10.1074/jbc.M410610200. [DOI] [PubMed] [Google Scholar]
- 54.Fea KD, Roth RA. Protein kinase C modulation of insulin receptor substrate-1 tyrosine phosphorylation requires serine 612. Biochem. 1997;36:12930–12947. doi: 10.1021/bi971157f. [DOI] [PubMed] [Google Scholar]
- 55.Goodyear LJ, Giorgino F, Sherman LA, Carey J, Smith RJ, Dohm GL. Insulin receptor phosphorylation, insulin receptor substrate-1 phosphorylation, and phosphatidylinositol 3-kinase activity are decreased in intact skeletal muscle strips from obese subjects. J Clin Invest. 1995;95:2195–2204. doi: 10.1172/JCI117909. [DOI] [PMC free article] [PubMed] [Google Scholar]
- 56.Tanasijevic MJ, Myers MG, Thoma RS, Crimmins DL, White MF, Sacks DB. Phosphorylation of the insulin receptor substrate IRS-1 by casein kinase II. J Biol Chem. 1993;268:18157–18166. [PubMed] [Google Scholar]
- 57.Giraud J, Hass M, Feener EP, Copps KD, Dong X, Dunn SL, White MF. Phosphorylation of IRS1 at Ser-522 inhibits insulin signaling. Mol Endocrinol. 2007;21:2294–2302. doi: 10.1210/me.2007-0159. [DOI] [PubMed] [Google Scholar]
- 58.Luo M, Langlais P, Yi Z, Lefort N, Filippis EAD, Hwang H, Christ-Roberts CY, Mandarino LJ. Phosphorylation of human insulin receptor substrate-1 at serine 629 plays a positive role in insulin signaling. Endocrinol. 2007;148:4895–4905. doi: 10.1210/en.2007-0049. [DOI] [PMC free article] [PubMed] [Google Scholar]
- 59.Scioscia M, Gumaa K, Kunjara S, Paine MA, Selvaggi LE, Rodeck CH, Rademacher TW. Insulin resistance in human preeclamptic placenta is mediated by serine phosphorylation of insulin receptor substrate−1 and −;2. J Clin Endocribnol. 2006;91:709–717. doi: 10.1210/jc.2005-1965. [DOI] [PubMed] [Google Scholar]
- 60.Nawaratne R, Gray A, Jogensen CH, Downes CP, Siddle K, Sethi JK. Regulation of insulin receptor substrate 1 pleckstrin homology domain by protein kinase C: role of serine 24 phosphorylation. Mol Endocrinol. 2006;20:1838–1852. doi: 10.1210/me.2005-0536. [DOI] [PMC free article] [PubMed] [Google Scholar]
- 61.Danielsson A, Ost A, Nystrom FH, Strafors P. Attenuation of insulin-stimulated insulin receptor substrate-1 serine 307 phosphorylation in insulin resistance of type 2 diabetes. J Biol Chem. 2005;280:34389–34392. doi: 10.1074/jbc.C500230200. [DOI] [PubMed] [Google Scholar]
- 62.Li Y, Soos TJ, Li X, Wu J, DeGennaro M, Sun X, Littman DR, Birnbaum MJ, Polajiewicz RD. Protein kinase C Theta inhibits insulin signaling by phosphorylation IRS1 at Ser1101. J Biol Chem. 2004;279:45304–45307. doi: 10.1074/jbc.C400186200. [DOI] [PubMed] [Google Scholar]
- 63.Gao Z, Zuberi A, Quon MJ, Dong Z, Ye J. Aspirin inhibits serine phosphorylation of insulin receptor substrate 1 in tumor necrosis factor-treated cell through targeting multiple serine kinase. J Biol Chem. 2003;278:24944–24950. doi: 10.1074/jbc.M300423200. [DOI] [PubMed] [Google Scholar]
- 64.Hers I, Bell CJ, Poole AW, Jiang D, Denton RM, Schaefer E, Tavare JM. Reciprocal feedback regulation of insulin receptor and insulin receptor substrate tyrosine phosphorylation by phosphoinositide 3-kinase in primary adipocytes. Biochem J. 2002;368:875–884. doi: 10.1042/BJ20020903. [DOI] [PMC free article] [PubMed] [Google Scholar]
- 65.Yu C, Chen Y, Cline GW, Zhang D, Zong H, Wang Y, Bergeron R, Kim JK, Cushman SW, Cooney GJ, Atcheson B, White MF, Kraegen EW, Shulman GI. Mechanism by white fatty acids inhibit insulin activation of insulin receptor substrate-1 (IRS-1)-associated phosphatidylinositol 3-kinase activity in muscle. J Biol Chem. 2002;277:50230–50236. doi: 10.1074/jbc.M200958200. [DOI] [PubMed] [Google Scholar]
- 66.Amoui M, Craddock BP, Miller WT. Differential phosphorylation of IRS-1 by insulin and insulin-like growth factor 1 receptors in Chinese hamster ovary cells. J Endocrinol. 2001;171:153–162. doi: 10.1677/joe.0.1710153. [DOI] [PubMed] [Google Scholar]
- 67.Gual P, Gremeaux T, Gonzalez T, Marchand-Brustel YL, Tanti JF. MAP kinase and mTOR mediate insulin-induced phosphorylation of insulin receptor substrate-1 on serine residues 307, 612 and 632. Diabetologia. 2003;46:1532–1542. doi: 10.1007/s00125-003-1223-4. [DOI] [PubMed] [Google Scholar]
- 68.Werner ED, Lee J, Hansen L, Yuan M. Insulin resistance due to phosphorylation of insulin receptor substrate-1 at serine 302. J Biol Chem. 2004;279:35298–35305. doi: 10.1074/jbc.M405203200. [DOI] [PubMed] [Google Scholar]
- 69.Sommerfeld MR, Metzger S, Stosik M, Tennagels N, Eckel J. In vitro phosphorylation of insulin receptor substrate 1 by protein kinase C-zeta: Functional analysis and identification of novel phosphorylation sites. Biochem. 2004;43:5888–5901. doi: 10.1021/bi049640v. [DOI] [PubMed] [Google Scholar]
- 70.Lehr S, Kotzka J, Herkner A, Sikmann A, Meyer HE, Krone W, Muller-Wieland D. Identification of major tyrosine phosphorylation sites in the human insulin receptor substrate Gab-1 by insulin kinase receptor kinase in vitro. Biochem. 2000;39:10898–10907. doi: 10.1021/bi000982k. [DOI] [PubMed] [Google Scholar]
- 71.Luo M, Reyna S, Wang L, Yi Z, Carroll C, Dong LQ, Langlais P, Weintraub ST, Mandarino LJ. Identification of insulin receptor substrate 1 serine/threonine phosphorylation sites using mass spectrometry analysis: Regulatory role of serine 1223. Endocrinol. 2005;146:4410–4416. doi: 10.1210/en.2005-0260. [DOI] [PubMed] [Google Scholar]
- 72.Yi Z, Luo M, Carroll CA, Weintraub ST, Mandarino LJ. Identification of phosphorylation sites in insulin receptor substrate-1 by hypothesis-driven high-performance liquid chromatography-electrospray ionization tandem mass spectrometry. Anal Chem. 2005;77:5693–5699. doi: 10.1021/ac050760y. [DOI] [PubMed] [Google Scholar]
- 73.Yi Z, Luo M, Mandarino LJ, Reyna SM, Carroll CA, Weintraub ST. Quantification of phosphorylation of insulin receptor substrate-1 by HPLC-ESI-MS/MS. J Am Soc Mass Spectrom. 2006;17:562–567. doi: 10.1016/j.jasms.2005.12.010. [DOI] [PubMed] [Google Scholar]
- 74.Beck A, Moeschel K, Deeg M, Haring HU, Voelter W, Schleicher ED, Lehmann R. Identification of an in vitro insulin receptor substrate-1 phosphorylation site by negative-ion mLC/ES-API-CID-MS hybrid scan technique. J Am Soc Mass Spectrom. 2003;14:401–405. doi: 10.1016/s1044-0305(03)00122-3. [DOI] [PubMed] [Google Scholar]
- 75.Gual P, Marchand-Brustel YL, Tanti JF. Positive and negative regulation of insulin signaling through IRS-1 phosphorylation. Biochimie. 2005;87:99–109. doi: 10.1016/j.biochi.2004.10.019. [DOI] [PubMed] [Google Scholar]
- 76.Zick Y. Ser/Thr phosphorylation of IRS proteins: A molecular basis for insulin resistance. doi: 10.1126/stke.2682005pe4. www.stke.org/cgi/content/full/sigtrans;2005/268/pe4. [DOI] [PubMed]
- 77.Liu YF, Herschkovitz A, Boura-Halfon S, Ronen D, Paz K, Leroith D, Zick Y. Serine phosphorylation proximal to its ohosphotyrosine binding domain inhibits insulin receptor substrate 1 function and promotes insulin resistance. Mol Cell Biol. 2004;24:9668–9681. doi: 10.1128/MCB.24.21.9668-9681.2004. [DOI] [PMC free article] [PubMed] [Google Scholar]
- 78.Zick Y. Insulin resistance: a phosphorylation-based uncoupling of insulin signaling. Trends Cell Biol. 2001;11:437–441. doi: 10.1016/s0962-8924(01)02129-8. [DOI] [PubMed] [Google Scholar]
- 79.Bouzakri K, Karlsson HKR, Vestergaard H, Madsbad S, Christiansen E, Zierath JR. IRS-1 serine phosphorylation and insulin resistance in skeletal muscle from pancreas transplant recipients. Diabetes. 2006;55:785–791. doi: 10.2337/diabetes.55.03.06.db05-0796. [DOI] [PubMed] [Google Scholar]
- 80.Sugita H, Fujimoto M, Yasukawa T, Shimizu N, Sugita M, Yasuhara S, Martyn JM, Kaneki M. Inducible nitric-oxide synthase and NO donor induce insulin receptor substrate-1 degradation in skeletal muscle cells. J Biol Chem. 2005;280:14203–14211. doi: 10.1074/jbc.M411226200. [DOI] [PubMed] [Google Scholar]
- 81.Usui I, Imamura T, Huang J, Satoh H, Shenoy SK, Lefkowitz RJ, Hupfeld CJ, Olefsky JM. β-Arrestin-1 competitively inhibits insulin-induced ubiquitination and degradation of insulin receptor substrate 1. Mol Cell Biol. 2004;24:8929–8937. doi: 10.1128/MCB.24.20.8929-8937.2004. [DOI] [PMC free article] [PubMed] [Google Scholar]
- 82.Pederson T, Kramer DL, Rondinone CM. Serine/Threonine phosphorylation of IRS1 triggers its degradation, possible regulation by tyrosine phosphorylation. Diabetes. 2001;50:24–31. doi: 10.2337/diabetes.50.1.24. [DOI] [PubMed] [Google Scholar]
- 83.Potashnik R, Bloch-Damti A, Bashan N, Rudich A. IRS1 degradation and increased serine phosphorylation cannot predict the degree of metabolic insulin resistance induced by oxidative stress. Diabetologia. 2003;46:639–648. doi: 10.1007/s00125-003-1097-5. [DOI] [PubMed] [Google Scholar]
- 84.Lee AV, Gooch JL, Oesterreich S, Guler RL, Yee D. Insulin-like growth factor I – induced degradation of insulin receptor substrate1 is mediated by the 26S proteasome and blocked by phosphatidylinositol 3′-kinase inhibition. Mol Cell Biol. 2000;20:1489–1507. doi: 10.1128/mcb.20.5.1489-1496.2000. [DOI] [PMC free article] [PubMed] [Google Scholar]
- 85.Sun XJ, Goldberg JL, Qiao LY, Mitchell JJ. Insulin-induced insulin receptor substrate-1 degradation is mediated by the proteasome degradation pathway. Diabetes. 1999;48:1359–1364. doi: 10.2337/diabetes.48.7.1359. [DOI] [PubMed] [Google Scholar]
- 86.Zhande R, Michell JJ, Wu J, Sun XJ. Molecular mechanism of insulin-induced defradation of insulin receptor substrate 1. Mol Cell Biol. 2002;22:1016–1026. doi: 10.1128/MCB.22.4.1016-1026.2002. [DOI] [PMC free article] [PubMed] [Google Scholar]
- 87.White MF. Insulin signaling in health and disease. Science. 2003;302:1710–1711. doi: 10.1126/science.1092952. [DOI] [PubMed] [Google Scholar]
- 88.White MF. IRS proteins and the common path to diabetes. Am J Physiol Endocrinol Metab. 2002;283:E413–E422. doi: 10.1152/ajpendo.00514.2001. [DOI] [PubMed] [Google Scholar]
- 89.Taniguchi CM, Emanuelli B, Kahn CR. Critical nodes in signaling pathways: insights into insulin action. Nat Reviews, Mol Cell Biol. 2006;7:85–96. doi: 10.1038/nrm1837. [DOI] [PubMed] [Google Scholar]
- 90.Thirone AC, Huang C, Klip A. Tissue-spicific roles of IRS proteins in insulin signaling and glucose transport. Trends Endocrinol Metab. 2006;17:72–78. doi: 10.1016/j.tem.2006.01.005. [DOI] [PubMed] [Google Scholar]
- 91.Youngren JF. Regulation of insulin receptor function. Cell Mol Life Sci. 2007;64:873–891. doi: 10.1007/s00018-007-6359-9. [DOI] [PMC free article] [PubMed] [Google Scholar]
- 92.Zhang Q, Carter EA, Ma BY, White M, Fischman AJ, Tompkins RG. Molecular mechanism(s) of burn-induced insulin resistance in murine skeletal muscle: role of IRS phosphorylation. Life Sci. 2005;77:3068–3077. doi: 10.1016/j.lfs.2005.02.034. [DOI] [PubMed] [Google Scholar]
- 93.Carter EA, Burks D, Fischman AJ, White M, Tompkins RG. Insulin resistance in thermally-injured rats is associated with post-receptor alteration inskeletal muscle, liver and adipose tissue. International J Mol Med. 2004;14:653–658. [PubMed] [Google Scholar]
- 94.Lu XM, Lu M, Tompkins RG, Fischman AJ. Site-specific detection of S-nitrosylated PKBα/Akt1 from rat solues muscle using CapLC-Q-TOFmicro mass spectrometry. J Mass Spectrom. 2005;40:1140–1148. doi: 10.1002/jms.885. [DOI] [PubMed] [Google Scholar]
- 95.Lu XM, Lu M, Fischman AJ, Tompkins RG. A new approach for sequencing human IRS1 phosphotyrsine-containing peptides using CapLC-Q-TOFmicro. J Mass Spectrom. 2005;40:599–607. doi: 10.1002/jms.826. [DOI] [PubMed] [Google Scholar]
- 96.Tanti JF, Gremeaux T, van Obberghen E, Le Marchand-Brustel Y. Serine/threonine phosphorylation of insulin receptor substrate 1 modulate insulin receptor signaling. J Biol Chem. 1994;269:6051–6057. [PubMed] [Google Scholar]
- 97.Haruta T, Uno T, Kawahara J, Takano A, Egawa K, Sharma PM, Olefsky JM, Kobayashi M. A rapamycin-serine pathway down-regulates insulin signaling via phosphorylation and proteasomal degradation of insulin receptor substrate-1. Mol Endocrinol. 2000;14:783–794. doi: 10.1210/mend.14.6.0446. [DOI] [PubMed] [Google Scholar]
- 98.Xu X, Sarikas A, Dias-Santagata DC, Dolios G, Lafontant PJ, Tsai SC, Zhu W, Nakajima H, Nakajima HO, Field LJ, Wang R, Pan ZQ. The CUL7 E3 ubiquitin ligase targets insulin receptor substrate 1 for ubiquitin-dependent degradation. Mol Cell. 2008;30:403–414. doi: 10.1016/j.molcel.2008.03.009. [DOI] [PMC free article] [PubMed] [Google Scholar]
- 99.Wing SS. The UPS in diabetes and obesity. BMC Biochem. 2008;9:S6. doi: 10.1186/1471-2091-9-S1-S6. [DOI] [PMC free article] [PubMed] [Google Scholar]