

Abstract
Blood pressure (BP) is a heritable, quantitative trait with intraindividual variability and susceptibility to measurement error. Genetic studies of BP generally use single-visit measurements and thus cannot remove variability occurring over months or years. We leveraged the idea that averaging BP measured across time would improve phenotypic accuracy and thereby increase statistical power to detect genetic associations. We studied systolic BP (SBP), diastolic BP (DBP), mean arterial pressure (MAP), and pulse pressure (PP) averaged over multiple years in 46,629 individuals of European ancestry. We identified 39 trait-variant associations across 19 independent loci (p < 5 × 10⁻⁸); five associations (in four loci) uniquely identified by our LTA analyses included those of SBP and MAP at 2p23 (rs1275988, near KCNK3), DBP at 2q11.2 (rs7599598, in FER1L5), and PP at 6p21 (rs10948071, near CRIP3) and 7p13 (rs2949837, near IGFBP3). Replication analyses conducted in cohorts with single-visit BP data showed positive replication of associations and a nominal association (p < 0.05). We estimated a 20% gain in statistical power with long-term average (LTA) as compared to single-visit BP association studies. Using LTA analysis, we identified genetic loci influencing BP. LTA might be one way of increasing the power of genetic associations for continuous traits in extant samples for other phenotypes that are measured serially over time.
Introduction
Blood pressure (BP) is a quantitative trait that varies both within subjects, according to diurnal patterns and longer-term changes (across weeks or months because of changes in environmental and physiologic influences), and between subjects, according to environmental factors and genetic determinants. Measurement error adds a third source of variability to BP quantification. These sources of variability present a challenge for the detection of genetic associations with BP given that the genetic component is a relatively small portion of overall variability. As it stands, the known genetic determinants of complex quantitative traits, such as BP, are common polymorphisms with small allelic effects that require very large sample sizes for detection. However, if measurement errors could be reduced, the statistical power could be improved. Hypertension is an important major cardiovascular risk factor affecting approximately one-third of the adult population globally and estimated to contribute to 13.5 million deaths yearly.1 Therefore, further improvements in methods for signal detection in BP genetic association studies are important.
Most epidemiologic and genetic association studies of BP use single-visit, or “visit 1” (V1), measurements of BP.2–5 The standard protocol is to take multiple measurements at a single point in time, discard the highest (first) value, and average the rest to account for the “white-coat effect.”6 Although these V1 BP traits have proved valuable, they might be unrepresentative of an individual’s BP norm as might be assessed from multiple BP measurements for an individual across years. The use of such longitudinal phenotype data, also known as repeated measures, might alleviate some of the effects of measurement error and similar sources underlying continuous traits, such as BP. Simple averaging of repeated measurements presents a straightforward opportunity to reduce phenotypic variability and thereby increase power to detect associations while utilizing existing sample sizes. The utility of such long-term average (LTA) procedures to study BP genetic association has not been assessed. In this investigation, we quantitatively explored the nature and degree of improvement of genetic associations by LTA analyses of BP traits.
We performed genome-wide association studies (GWASs) of LTA BP traits within multiple longitudinal community-based cohorts in which BP traits have been measured at multiple visits over several years of follow-up.7 For comparison, we also conducted parallel GWASs of V1 BP in these same cohorts. We identified four loci associated with BP traits in the LTA analyses; we also conducted replication analyses by using independent samples with V1 BP measurements and showed definitive replication of two loci and nominal association at a third locus. We compared the results of the LTA discovery analyses to the corresponding V1 findings for the number of loci detected and the characteristics of SNP associations within the detected loci.
Material and Methods
Study Subjects
For the discovery analyses, the phenotype and genotype data of 46,629 individuals from eight participating longitudinal population studies collaborating with the Cohorts for Heart and Aging Research in Genomic Epidemiology (CHARGE) Consortium,7 the Age, Gene/Environment Susceptibility (AGES) Reykjavik Study, the Atherosclerosis Risk in Communities (ARIC) Study, the Cardiovascular Health Study (CHS), the Framingham Heart Study (FHS), the Rotterdam Study (RS), the Women’s Genome Health Study (WGHS), the Multi-Ethnic Study of Atherosclerosis (MESA), and Coronary Artery Risk Development in Young Adults (CARDIA) were analyzed for LTA BP and V1 BP trait genome-wide associations after adjustment for covariates. Only individuals of European ancestry, as confirmed by principal-component analysis of genetic ancestry, were included in this analysis. For the replication analyses, V1 BP data from 34,433 individuals across 17 cohorts participating in the Global BP Genetics (GBPG) Consortium and 5,056 individuals in the Peking University – University of Michigan Study of Atherosclerosis (PUUMA) were analyzed by identical methods.5 All participants gave written informed consent for participation in their respective studies and the conduct of genetic research, and the studies in which the subjects were enrolled were approved by their respective institutional review boards. Detailed information on each participating study is provided in the Supplemental Data, available online.
BP Phenotypes
BP in each study was measured according to protocols described in the cohort descriptions in the Supplemental Data. The traits analyzed were systolic BP (SBP), diastolic BP (DBP), mean arterial pressure (MAP), and pulse pressure (PP) as continuous traits. PP was defined as SBP minus DBP, and MAP was defined as two-thirds DBP plus one-third SBP. BP at each visit was corrected for antihypertensive medication use by the addition of 10 mmHg to the observed SBP value and 5 mmHg to the observed DBP value. These adjustments were also implemented prior to the calculation of estimated off-treatment MAP and PP. To obtain the LTA BP traits, we averaged repeated BP measurements for study participants; individuals with two, three, or four repeated BP measures at least 1 year apart and within a 15-year timespan were included in our analyses. For the ARIC cohort, we removed outliers greater than 4 SD units from the mean at each visit, but we did not remove outliers from the other cohorts. Follow-up measurements beyond 15 years were not included in this analysis; individuals with only one BP measurement were also excluded. At each study visit, we performed linear regression, including adjustment for age, age-squared, gender, body mass index, and study-specific corrections for population substructure (based on principal-component analysis) to generate visit-specific BP residuals. These residual values were subsequently averaged over all available visits, and the final averaged residual was the LTA trait analyzed (termed LTA SBP, LTA DBP, LTA MAP, and LTA PP). In the analyses of V1 BP traits, BP values at the earliest visit among those included in this study were analyzed. To facilitate comparisons of the LTA and V1 analyses, we conducted the V1 analyses in the same individuals included in the LTA analyses. We adjusted V1 BP traits for antihypertensive medication use and performed linear regression by using covariate adjustment in a manner identical to what has been done in prior V1 BP association analyses.4
Genotyping and Quality Control
Each study in the discovery LTA and V1 analyses genotyped samples by using high-density SNP marker platforms (Affymetrix SNP6.0 in ARIC, CARDIA, and MESA; Affymetrix 500K in the FHS; Illumina 370K in the AGES Reykjavik Study, CHS, and WGHS; and Illumina 550K in the RS). Genotypes were imputed to a set of approximately 2.5 million HapMap SNPs with the use of HapMap Phase II CEU individuals (Utah residents with ancestry from northern and western Europe from the CEPH collection) as a reference and either MACH (ARIC, AGES Reykjavik Study, FHS, MESA, RS, and WGHS), BEAGLE (CARDIA), or BIMBAM (CHS) software. Similar methods were used in the replication cohorts. Further details of SNP genotyping and quality-control measures used for each cohort have been previously published.2,4,5
Statistical Association and Meta-analysis
Individual SNP association statistics were calculated for each SNP meeting quality-control criteria via linear regression for LTA and V1 BP traits. In each cohort, except in the FHS, association analysis was performed with PLINK8 with linear regression under an additive genetic model. In the FHS, family structure was modeled with a linear mixed-effects model implemented in R.9 Regression coefficients and corresponding SEs for each SNP and trait were meta-analyzed by inverse-variance-weighted meta-analysis to provide the primary findings. Genomic control10 was applied to individual study results and to the final meta-analysis results to control effects possibly due to population stratification or cryptic relatedness. The statistical-significance threshold was set at the p value of 5.0 × 10⁻⁸. For loci where variants showed significant associations, we examined the linkage-disequilibrium (LD) patterns with SNAP;11 we assumed that loci with r2 < 0.3 were effectively independent associations.
Replication Analyses Using V1 BP Traits
For replication analyses, we carried forward the five trait-locus associations that we identified in our discovery LTA analyses but that were not found in single-visit BP data in European-ancestry individuals from GBPG and Chinese-ancestry individuals from PUUMA. Details on the cohorts used for reproducibility analyses are provided in the Supplemental Data. There are no sufficiently sized replication cohorts with LTA traits to our knowledge, and we elected to include as many samples as possible in a meta-analysis to increase power for the discovery analysis. Because the follow-up association testing performed in the GBPG Consortium and PUUMA participants was based on V1 data rather than trait averages, as in our LTA discovery analyses, this experiment does not constitute a true statistical “replication analysis” but rather a biological one that might be partly underpowered. We used a Bonferroni correction for the number of SNP-trait associations tested for each of the four BP traits. To assess associations close to a genome-wide significance threshold (p < 5 × 10⁻⁸), but not yet meeting this criterion, we used V1 BP traits to test all LTA-analysis SNPs with p < 5.0 × 10⁻⁷ in the GBPG Consortium V1 data.
Simulation of Statistical Power
We conducted computer simulations to evaluate the change in statistical power to detect associations by using LTA versus V1 BP traits as a function of sample size and effect size. The genome-wide significance level was set to p < 5 × 10⁻⁸. We simulated phenotypic data across four visits, as well as SNP data with different allele frequencies and different effect sizes. Phenotype data were simulated from a multivariate normal distribution with correlation structures based upon those observed in the ARIC Study. Next, we simulated genotype for a single SNP by setting the minor allele frequency to 0.05, 0.1, 0.2, 0.3, or 0.4 and then randomly drawing genotypes as 0, 1, or 2, with probabilities p2, 2pq, or q2, respectively, by assuming Hardy-Weinberg equilibrium. We tested three scenarios in these simulation tests: (1) in V1, we took simulated SBP measurements from V1 only and ignored the following three visits and regressed SBP onto each SNP; (2) in LTA, we averaged the four visits and performed a linear regression of SBP onto each SNP; (3) in a third analysis, using generalized estimating equations (GEEs), we included data from all four visits in a model with an exchangeable correlation structure between the visits. In initial experiments, assuming a sample size of 1,000, we repeated our simulations 10,000 times (with independent sampling of both phenotype and genotype data from their distributions) and computed the proportion of times when a SNP was significantly associated with the trait. To estimate power in a more representative case, such as for the ARIC cohort, we assumed a sample size of 10,000 and repeated the simulations.
Analysis of Signal Enrichment by LTA in Comparison with V1 BP Trait Associations
Using the LTA and V1 association results on the same 46,553 individuals, we used the Kolmogorov-Smirnov (K-S) statistic to compare each region’s –log10 p values meeting criteria for genome-wide significance (p < 5 × 10⁻⁸) to evaluate whether LTA results showed departure of the association statistics from the distribution of corresponding V1 association statistics. This analysis was performed to compare LTA SBP with V1 SBP and to compare LTA DBP with V1 DBP. Regions with at least one SNP marker with p < 5 × 10⁻⁸ in either LTA or V1 analyses were selected for enrichment analysis. Regions were defined by the lead SNP and by the LD-pruned list of SNPs in the region (r2 > 0.3).
Analysis of Expression Quantitative Trait Loci
For the purpose of annotating our findings, we searched for primary SNPs identified in our LTA analyses and LD proxies against a collected database of expression SNP (eSNP) results from several tissues. Using SNAP,11 we identified alias rsIDs for rs445925. SNAP also helped us identify four further proxy SNPs (rs72654473, rs80125357, rs7412, and rs283810) in LD (r2 > 0.5) in four HapMap builds. SNP rsIDs were searched for primary SNPs and LD proxies against a collected database of eSNP results.12–60 The collected eSNP results met criteria for statistical thresholds for association with gene transcript levels, as described in the original papers, for several tissues. mRNA quantitative trait loci (QTLs) were also queried for gluteal and abdominal adipose.12
Additional expression QTL (eQTL) data were integrated from online sources, including ScanDB, the Broad Institute GTex browser, and the Prichard Lab (see Web Resources). Data on cerebellum, parietal lobe, and liver eQTLs were downloaded from ScanDB; cis-eQTLs were limited to those with p < 1.0 × 10⁻⁶, and trans-eQTLs were limited to those with p < 5.0 × 10⁻⁸. The top 1,000 eQTL results were downloaded (on November 26, 2013) from the GTex Browser at the Broad Institute for nine tissues: thyroid, leg skin (sun exposed), tibial nerve, tibial artery, skeletal muscle, lung, heart (left ventricle), whole blood, and subcutaneous adipose.14 All GTex results had associations with p < 8.4 × 10⁻⁷.
Results
Longitudinal Analysis of BP
The discovery analyses of LTA BP traits were conducted in a sample size of 46,629 individuals, whose characteristics, including age, sex, and trait summaries, are summarized in Table 1. Our overall study design is shown in Figure S1. By requiring each study participant included in the LTA analyses to have two or more BP measurements, we excluded a total of 8,887 individuals with data at V1 only across the cohorts (Table S1) and consequently analyzed 46,553 individuals for both the LTA and V1 analyses reported. Information on the specific visits included in the LTA analyses is provided in Table S2. Phenotypic correlations were performed in the ARIC cohort on the average LTA and V1 residuals we analyzed (Figure 1) and showed r > 0.7 (the V1 measurement was included in the LTA measurement, and thus correlation was expected).
Table 1.
Summary of Discovery Cohorts, Sample Sizes, and Visits for the LTA Analyses
| Cohort | No. of Visits | No. of Individuals | Age at First Visit in Years (SD) | Age at Last Visit in Years (SD) | Mean BMI in kg/m2(SD) | Mean SBP in mmHg (SD) | Mean DBP in mmHg (SD) | Antihypertensive Therapy at First Visit | Antihypertensive Therapy at Last Visit |
|---|---|---|---|---|---|---|---|---|---|
| AGES Reykjavik Study | 2 | 526 | 66.0 (7.0) | 78.5 (5.9) | 26.2 (3.9) | 141.4 (18.8) | 82.1 (8.7) | 24% | 65% |
| ARIC Study | 4 | 7,310 | 54.3 (5.7) | 63.1 (5.6) | 27.0 (4.9) | 118.5 (17.0) | 71.7 (10.0) | 26% | 40% |
| CARDIA | 4 | 1,671 | 32.6 (3.3) | 45.8 (3.4) | 25.6 (5.1) | 106.3 (11.4) | 67.8 (9.5) | 0.9% | 11% |
| CHS | 4 | 3,159 | 72.4 (5.4) | 75.3 (5.4) | 26.3 (4.5) | 138.7 (22.5) | 72.2 (11.9) | 35% | 41% |
| FHS original cohort | 4 | 660 | 74.4 (4.5) | 85.6 (4.0) | 26.7 (4.6) | 148.1 (23.5) | 72.9 (11.3) | 49% | 60% |
| FHS offspring | 4 | 3,235 | 50.7 (9.8) | 61.0 (9.5) | 26.8 (4.9) | 127.4 (20.0) | 79.7 (10.6) | 15% | 32% |
| MESA | 4 | 2,414 | 62.7 (10.2) | 66.9 (10.2) | 27.7 (5.1) | 123.5 (20.5) | 70.1 (9.9) | 33% | 45% |
| RS 1 | 4 | 4,710 | 67.9 (8.2) | 75.5 (6.2) | 26.3 (3.6) | 140.4 (22.8) | 74.9 (11.7) | 22% | 37% |
| RS 2 | 4 | 1,535 | 63.7 (2.3) | 67.9 (7.2) | 27.2 (4.1) | 143.4 (21.6) | 79.7 (11.1) | 21% | 30% |
| WGHS | 3 | 21,409 | 54.7 (7.0) | 65.2 (6.8) | 25.9 (4.9) | 124.8 (15.4) | 77.3 (9.7) | 13% | 43% |
Abbreviations are as follows: AGES, Age, Gene/Environment Susceptibility; ARIC, Atherosclerosis Risk in Communities; BMI, body mass index; CARDIA, Coronary Artery Risk Development in Young Adults; CHS, Cardiovascular Health Study; DBP, diastolic blood pressure; FHS, Framingham Heart Study; MESA, Multi-Ethnic Study of Atherosclerosis; RS, Rotterdam Study; SBP, systolic blood pressure; and WGHS, Women’s Genome Health Study.
Figure 1.
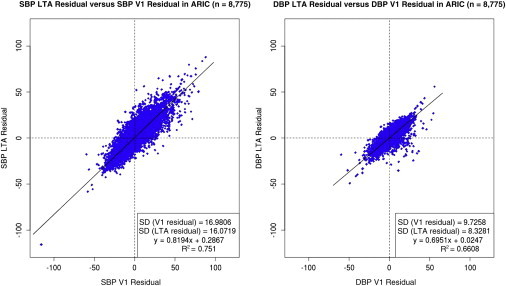
LTA versus V1 SBP and DBP Residuals in the ARIC Cohort
The final averaged residuals for LTA SBP and LTA DBP (n = 8,778) are plotted on the y axis against the corresponding V1 SBP and V1 DBP residuals on the x axis.
Meta-analysis of GWASs for LTA BP Traits for Discovery of Genetic Associations
When individual cohort results were combined via inverse-variance-weighted meta-analysis, 488 SNP-trait associations at 19 independent loci (r2 < 0.3 between SNPs) reached genome-wide significance (p < 5 × 10⁻⁸) (Table 2). Quantile-quantile p value plots are shown in Figure S2, and genomic-control inflation factors (λGC) ranged from 1.055 to 1.095 for the LTA traits (Table S3) and were comparable for V1 SBP (1.076) and V1 DBP (1.066). The −log10 p value genome-wide association plots for SBP and DBP are shown in Figure 2, and those for MAP and PP are shown in Figure S3. In total, there were 39 trait-locus combinations with at least one genome-wide significant association. We identified 13 loci associated with LTA SBP, ten loci associated with LTA DBP, 11 loci associated with LTA MAP, and five loci associated with LTA PP (all are summarized in Table 2). The complete set of SNPs identified is provided in Table S4. For the purpose of annotating the associations identified in our analyses, index SNPs and proxies were checked for eQTL associations. Some SNPs showed associations with expression levels, including with genes with known BP roles (e.g., AGT [MIM 106150] and NPR3 [MIM 108962]). The loci identified in this analysis, but not previously described, did not show new eQTL associations, suggesting that mechanisms of effect are not mediated through regulation of gene expression. The full results are summarized in Table S5.
Table 2.
Summary of LTA Discovery Analyses for Loci with SNP-Trait Association p Values < 5 × 10⁻⁸
| SNP ID | Allele | Chr | Position | In Gene | Closest Gene | Genes in LD Block | Beta | SE | p Value |
|---|---|---|---|---|---|---|---|---|---|
| LTA DBP | |||||||||
| rs13306561 | a | 1 | 11,788,391 | MTHFR | MTHFR | NPPA-AS1, CLCN6, MTHFR, NPPA | 0.48 | 0.07 | 2.08 × 10⁻¹⁰ |
| rs2004776 | t | 1 | 228,915,325 | AGT | AGT | AGT | 0.35 | 0.06 | 3.20 × 10⁻⁸ |
| rs7599598a | a | 2 | 96,715,567 | FER1L5 | FER1L5 | FER1L5 | −0.31 | 0.05 | 2.91 × 10⁻⁸ |
| rs198823 | t | 6 | 26,230,912 | NA | HIST1H2BC | HIST1H1T, HIST1H4A, HIST1H2BB, HIST1H3C, HIST1H3A, HIST1H2BC, TRIM38, HFE, HIST1H2AB, HIST1H2AC, HIST1H3B, HIST1H4B, HIST1H4C, HIST1H1A, HIST1H1C | −0.33 | 0.06 | 6.57 × 10⁻⁹ |
| rs12258967 | c | 10 | 18,767,965 | CACNB2 | CACNB2 | CACNB2 | 0.35 | 0.06 | 2.48 × 10⁻⁹ |
| rs12244842 | t | 10 | 63,109,192 | C10orf107 | C10orf107 | C10orf107 | −0.38 | 0.06 | 7.05 × 10⁻⁹ |
| rs2681472 | a | 12 | 88,533,090 | ATP2B1 | ATP2B1 | ATP2B1, LOC338758 | 0.52 | 0.07 | 4.01 × 10⁻¹³ |
| rs3184504 | t | 12 | 110,368,991 | SH2B3 | SH2B3 | TRAFD1, PTPN11, RPL6, ALDH2, ATXN2, TMEM116, ERP29, MAPKAPK5, ADAM1, SH2B3, C12orf51, C12orf47, NAA25, ACAD10, BRAP | 0.39 | 0.05 | 6.08 × 10⁻¹³ |
| rs1133323 | t | 15 | 72,999,278 | NA | COX5A | CSK, CPLX3, COX5A, SCAMP2, C15orf17, MPI, ULK3, LMAN1L, MIR4513 | −0.33 | 0.05 | 2.66 × 10⁻⁹ |
| rs6092743 | a | 20 | 57,133,765 | NA | C20orf174 | NA | 0.50 | 0.08 | 1.11 × 10⁻⁸ |
| LTA SBP | |||||||||
| rs880315 | t | 1 | 10,719,453 | CASZ1 | CASZ1 | MTOR, C1orf127, TARDBP, EXOSC10, C1orf187, FBXO2, FBXO6, MAD2L2, MTHFR, FBXO44, SRM, PTCHD2, MASP2, UBIAD1, CASZ1, ANGPTL7, AGTRAP | −0.71 | 0.10 | 7.98 × 10⁻¹² |
| rs13306561 | a | 1 | 11,788,391 | MTHFR | MTHFR | NPPB, NPPA-AS1, CLCN6, MTHFR, NPPA | 0.88 | 0.12 | 6.38 × 10⁻¹² |
| rs1275988a | t | 2 | 26,767,868 | NA | KCNK3 | KCNK3 | −0.60 | 0.09 | 2.61 × 10⁻¹⁰ |
| rs6712094 | a | 2 | 164,751,706 | NA | GRB14 | NA | 0.60 | 0.10 | 9.89 × 10⁻⁹ |
| rs7733331 | t | 5 | 32,864,603 | NA | C5orf23 | NPR3 | −0.55 | 0.09 | 5.38 × 10⁻⁹ |
| rs12705390 | a | 7 | 106,198,013 | NA | PIK3CG | NA | 0.63 | 0.11 | 3.17 × 10⁻⁸ |
| rs12258967 | c | 10 | 18,767,965 | CACNB2 | CACNB2 | CACNB2 | 0.63 | 0.10 | 4.53 × 10⁻¹⁰ |
| rs7070797 | a | 10 | 63,221,779 | NA | C10orf107 | C10orf107 | −0.74 | 0.13 | 4.30 × 10⁻⁸ |
| rs2681472 | a | 12 | 88,533,090 | ATP2B1 | ATP2B1 | ATP2B1, LOC338758 | 0.95 | 0.12 | 1.04 × 10⁻¹⁴ |
| rs4766578 | a | 12 | 110,388,754 | ATXN2 | ATXN2 | TRAFD1, PTPN11, RPL6, ALDH2, ATXN2, TMEM116, ERP29, MAPKAPK5, ADAM1, SH2B3, C12orf51, C12orf47, NAA25, ACAD10, BRAP | −0.56 | 0.09 | 2.82 × 10⁻⁹ |
| rs35444 | a | 12 | 114,036,820 | NA | TBX3 | NA | 0.55 | 0.09 | 1.47 × 10⁻⁸ |
| rs11072518 | t | 15 | 73,021,663 | NA | COX5A | CSK, CPLX3, COX5A, SCAMP2, C15orf17, CYP1A2, MPI, ULK3, LMAN1L, MIR4513 | 0.57 | 0.09 | 6.54 × 10⁻⁹ |
| rs6092743 | a | 20 | 57,133,765 | NA | C20orf174 | NA | 0.84 | 0.14 | 2.25 × 10⁻⁸ |
| LTA MAP | |||||||||
| rs880315 | t | 1 | 10,719,453 | CASZ1 | CASZ1 | CASZ1 | −0.46 | 0.07 | 5.49 × 10⁻¹¹ |
| rs13306561 | a | 1 | 11,788,391 | MTHFR | MTHFR | NPPB, NPPA-AS1, CLCN6, MTHFR, NPPA | 0.61 | 0.08 | 1.83 × 10⁻¹² |
| rs2004776 | t | 1 | 228,915,325 | AGT | AGT | AGT | 0.42 | 0.07 | 1.18 × 10⁻⁸ |
| rs1275988a | t | 2 | 26,767,868 | NA | KCNK3 | KCNK3 | −0.39 | 0.06 | 1.51 × 10⁻⁹ |
| rs12258967 | c | 10 | 18,767,965 | CACNB2 | CACNB2 | CACNB2 | 0.45 | 0.07 | 4.98 × 10⁻¹¹ |
| rs2166122 | t | 10 | 63,193,080 | C10orf107 | C10orf107 | C10orf107 | −0.48 | 0.08 | 1.88 × 10⁻⁹ |
| rs2681472 | a | 12 | 88,533,090 | ATP2B1 | ATP2B1 | ATP2B1, LOC338758 | 0.69 | 0.08 | 1.77 × 10⁻¹⁶ |
| rs3184504 | t | 12 | 110,368,991 | SH2B3 | SH2B3 | CUX2, FAM109A, TRAFD1, PTPN11, RPL6, ALDH2, ATXN2, TMEM116, ERP29, MAPKAPK5, ADAM1, SH2B3, C12orf51, C12orf47, NAA25, ACAD10, BRAP | 0.45 | 0.06 | 1.68 × 10⁻¹² |
| rs35444 | a | 12 | 114,036,820 | NA | TBX3 | NA | 0.36 | 0.06 | 3.20 × 10⁻⁸ |
| rs11072518 | t | 15 | 73,021,663 | NA | COX5A | CSK, CPLX3, COX5A, SCAMP2, C15orf17, CYP1A2, MPI, ULK3, LMAN1L, MIR4513 | 0.43 | 0.06 | 8.95 × 10⁻¹¹ |
| rs6092743 | a | 20 | 57,133,765 | NA | C20orf174 | NA | 0.64 | 0.10 | 3.60 × 10⁻¹⁰ |
| LTA PP | |||||||||
| rs880315 | t | 1 | 10,719,453 | CASZ1 | CASZ1 | CASZ1 | −0.42 | 0.07 | 5.45 × 10⁻⁹ |
| rs7650227 | t | 3 | 41,769,941 | ULK4 | ULK4 | ULK4 | 0.50 | 0.08 | 2.84 × 10⁻⁹ |
| rs10948071a | t | 6 | 43,388,691 | NA | CRIP3 | CRIP3, SLC22A7, ZNF318 | −0.38 | 0.07 | 9.06 × 10⁻⁹ |
| rs2949837a | a | 7 | 45,960,903 | NA | IGFBP3 | NA | 0.40 | 0.07 | 2.94 × 10⁻⁸ |
| rs12705390 | a | 7 | 106,198,013 | NA | PIK3CG | NA | 0.59 | 0.08 | 5.40 × 10⁻¹⁴ |
Abbreviations are as follows: Chr, chromosome; DBP, diastolic blood pressure; LTA, long-term average; MAP, mean arterial pressure; NA, not available; PP, pulse pressure; and SBP, systolic blood pressure.
BP-associated loci found in our LTA analyses.
Figure 2.
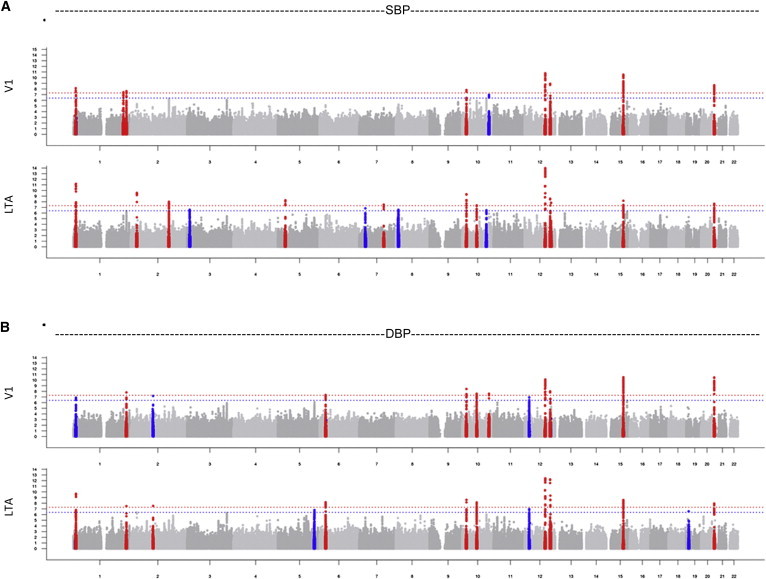
GWASs: –Log p Plots for LTA and V1 SBP and DBP Analyses
GWAS –log p plots compare (A) LTA SBP and V1 SBP and (B) LTA DBP and V1 DBP. Regions containing one or more SNPs with p < 5 × 10⁻⁸ are in red, and suggestive associations (p < 5 × 10⁻⁷) are shown in blue.
Replication Studies
For follow-up, we focused on the five SNP-trait associations that we identified in the LTA analyses but that had not been identified in prior studies of V1 BP (Table 3). We conducted replication analyses of independent samples not studied in the discovery work by using pooled V1 data from 23 GBPG Consortium cohorts—for a total sample size of 34,433 individuals of European ancestry5—and 5,605 Han Chinese individuals from PUUMA. Clinical summaries have been previously published for the GBPG Consortium. 5 Clinical summaries for PUUMA are provided in Table S6. We tested the lead SNP from each region identified in our LTA analyses for its association with each corresponding V1 trait and corrected for the number of regions tested (the p value threshold was 0.05 / 1 = 0.05 for LTA SBP, LTA DBP, and LTA MAP and 0.05 / 2 = 0.025 for LTA PP). The GBPG Consortium and PUUMA results were combined in a fixed-effects meta-analysis and demonstrated significant association between chromosomal region 2p23 (KCNK3 [MIM 603220]) and both MAP (p = 0.0091) and SBP (p = 0.0079) and between chromosomal region 6p21 (CRIP3) and PP (p = 0.0041), all of which met the Bonferroni-corrected threshold (Table 4). A nominal association (p < 0.05) was noted between region 7p13 (IGFBP3 [MIM 146732]) and PP (Table 4). In the individual replication groups, we observed positive replication for two SNP-trait associations in the GBPG Consortium V1 replication analyses (p = 0.030 between chromosomal region 2p23 [KCNK3] and SBP and p = 0.0067 between region 6p21 [CRIP3] and PP). In two of the remaining loci, there was a nonsignificant trend (p < 0.10) of association (between 2p23 [KCNK3] and MAP and between 7p13 [IGFBP3] and PP). In the PUUMA study, replication was observed for the association between chromosome region 2p23 (KCNK3) and MAP (p = 0.0079). Plots of the –log p value for these regions are shown in Figure S6.
Table 3.
Loci with SNP-Trait Association p Values < 5 × 10⁻⁸ from LTA Discovery Analyses
| Trait | SNP ID | Allele | Locus | Position | Closest Gene | Beta | SE | p Value |
|---|---|---|---|---|---|---|---|---|
| LTA DBP | rs7599598 | a | 2q11 | 96715567 | FER1L5 | −0.31 | 0.05 | 2.91 × 10⁻⁸ |
| LTA SBP | rs1275988 | t | 2p23 | 26767868 | KCNK3 | −0.60 | 0.09 | 2.61 × 10⁻¹⁰ |
| LTA MAP | rs1275988 | t | 2p23 | 26767868 | KCNK3 | −0.39 | 0.06 | 1.51 × 10⁻⁹ |
| LTA PP | rs10948071 | t | 6p21 | 43388691 | CRIP3 | −0.38 | 0.07 | 9.06 × 10⁻⁹ |
| LTA PP | rs2949837 | a | 7p13 | 45960903 | IGFBP3 | 0.40 | 0.07 | 2.94 × 10⁻⁸ |
Abbreviations are as follows: DBP, diastolic blood pressure; MAP, mean arterial pressure; LTA, long-term average; PP, pulse pressure; and SBP, systolic blood pressure.
Table 4.
Reproducibility-Analysis Association Results in the GBPG Consortium and PUUMA V1 BP Analyses
| Trait | SNP ID | Closest Gene |
GBPG Consortium V1 BP Association Results |
PUUMA V1 BP Association Results |
Meta-analysis of GBPG Consortium and PUUMA V1 BP Association Results |
||||||
|---|---|---|---|---|---|---|---|---|---|---|---|
| Beta | SE | p Value | Beta | SE | p Value | Beta | SE | p Value | |||
| V1 DBP | rs7599598 | FER1L5 | −0.04 | 0.08 | 6.14 × 10⁻¹ | 0.001 | 0.21 | 9.95 × 10⁻¹ | −0.03 | 0.07 | 6.40 × 10⁻¹ |
| V1 SBP | rs1275988a | KCNK3 | −0.26 | 0.12 | 2.98 × 10⁻² | −0.79 | 0.39 | 4.54 × 10⁻² | −0.30 | 0.11 | 7.93 × 10⁻³ |
| V1 MAP | rs1275988a | KCNK3 | −0.16 | 0.08 | 5.68 × 10⁻² | −0.72 | 0.27 | 7.85 × 10⁻³ | −0.21 | 0.08 | 9.08 × 10⁻³ |
| V1 PP | rs10948071a | CRIP3 | −0.24 | 0.09 | 6.69 × 10⁻³ | −0.25 | 0.27 | 3.56 × 10⁻¹ | −0.24 | 0.08 | 4.17 × 10⁻³ |
| V1 PP | rs2949837 | IGFBP3 | 0.15 | 0.09 | 9.96 × 10⁻² | 0.34 | 0.26 | 1.94 × 10⁻¹ | 0.17 | 0.09 | 4.68 × 10⁻² |
Abbreviations are as follows: BP, blood pressure; DBP, diastolic blood pressure; GBPG, Global Blood Pressure Genetics; MAP, mean arterial pressure; PP, pulse pressure; PUUMA, Peking University – University of Michigan Study of Atherosclerosis; SBP, systolic blood pressure; and V1, visit 1.
Loci meeting a Bonferroni-corrected replication threshold.
To assess overall rates of replication, including for known signals, in the GBPG Consortium V1 data, we assessed the associations for all SNPs where the LTA association analyses provided p < 5.0 × 10⁻⁷ (213 SNPs for LTA SBP, 186 SNPs for LTA DBP, 273 SNPs for LTA MAP, and 225 SNPs for LTA PP). In the analysis of these top SNPs, we reproduced associations (p < 5 × 10⁻⁷) in the GBPG Consortium V1 data for 13/16 DBP-associated loci, 14/18 SBP-associated loci, 15/18 MAP-associated loci, and seven PP-associated loci (Table S7). Restricting testing to the loci with genome-wide significant association results in the LTA analyses and association p values < 5 × 10⁻⁸ resulted in reproduction of associations at 11/13 SBP-associated loci, 8/10 DBP-associated loci, 9/11 MAP-associated loci, and 4/4 PP-associated loci (Table S7). Thus, the overall replication rates in this analysis were 83% (49/59) and 84% (32/38) for p < 5 × 10⁻⁷ and p < 5 × 10⁻⁸, respectively.
Comparing LTA and V1 BP Association Patterns to Evaluate the Impact of LTA
Using exactly the same samples and genotypes as in the discovery LTA analyses, we conducted a secondary analysis of V1 BP traits for the purpose of characterizing the difference between LTA BP and V1 BP associations. Overall, we identified more loci meeting genome-wide significance thresholds in the LTA analyses than in the V1 analyses. In the LTA analyses, we observed 488 SNP-trait associations with p < 5 × 10⁻⁸ in 19 loci (117 for LTA SBP, 96 for LTA DBP, 155 for LTA MAP, and 120 for LTA PP); in the corresponding V1 analyses, we observed 402 SNP-trait associations with p < 5 × 10⁻⁸ (122 for V1 SBP, 126 for V1 DBP, 153 for V1 MAP, and 1 for V1 PP) (Figure S4). At the p value threshold of 5 × 10⁻⁷, we identified 897 SNP-trait associations in the LTA analyses (213 for LTA SBP, 186 for LTA DBP, 273 for LTA MAP, and 225 for LTA PP) and 570 SNP-trait associations in the V1 analyses (163 for V1 SBP, 182 for V1 DBP, 222 for V1 MAP, and 3 for V1 PP) (Table S8). Overall, these data show that the LTA analyses yielded a greater number of significant associations. The V1 results in the same samples as the LTA analyses are shown for the top LTA loci in Table 5; they show a large degree of concordance in both analyses but a greater yield from the LTA analyses.
Table 5.
The LTA Lead SNPs Were Investigated in the V1 Analysis of the Same Cohorts and Study Participants
| SNP ID | Allele | Chr | Position | Closest Gene |
LTA BP Results in Discovery Samples |
V1 BP Results in LTA Discovery Samples |
LTA-V1 Differences |
|||||||
|---|---|---|---|---|---|---|---|---|---|---|---|---|---|---|
| Trait | Beta | SE | p Value | Trait | Beta | SE | p Value | Δ Beta | Δ p Value | |||||
| rs880315 | t | 1 | 10,719,453 | CASZ1 | LTA SBP | −0.71 | 0.10 | 7.98 × 10⁻¹² | V1 SBP | −0.68 | 0.11 | 7.20 × 10⁻⁹ | 3.05 × 10⁻² | −7.19 × 10⁻⁹ |
| rs13306561 | a | 1 | 11,788,391 | MTHFR | LTA SBP | 0.88 | 0.12 | 6.38 × 10⁻¹² | V1 SBP | 0.76 | 0.14 | 1.11 × 10⁻⁷ | −1.21 × 10⁻¹ | −1.11 × 10⁻⁷ |
| rs1275988 | t | 2 | 26,767,868 | KCNK3 | LTA SBP | −0.60 | 0.09 | 2.61 × 10⁻¹⁰ | V1 SBP | −0.47 | 0.10 | 1.38 × 10⁻⁵ | 1.33 × 10⁻¹ | −1.38 × 10⁻⁵ |
| rs6712094 | a | 2 | 164,751,706 | GRB14 | LTA SBP | 0.60 | 0.10 | 9.89 × 10⁻⁹ | V1 SBP | 0.58 | 0.11 | 5.22 × 10⁻⁷ | −1.49 × 10⁻² | −5.12 × 10⁻⁷ |
| rs7733331 | t | 5 | 32,864,603 | C5orf23 | LTA SBP | −0.55 | 0.09 | 5.38 × 10⁻⁹ | V1 SBP | −0.41 | 0.10 | 1.41 × 10⁻⁴ | 1.46 × 10⁻¹ | −1.41 × 10⁻⁴ |
| rs12705390 | a | 7 | 106,198,013 | PIK3CG | LTA SBP | 0.63 | 0.11 | 3.17 × 10⁻⁸ | V1 SBP | 0.54 | 0.12 | 2.63 × 10⁻⁵ | −8.91 × 10⁻² | −2.62 × 10⁻⁵ |
| rs12258967 | c | 10 | 18,767,965 | CACNB2 | LTA SBP | 0.63 | 0.10 | 4.53 × 10⁻¹⁰ | V1 SBP | 0.64 | 0.11 | 1.53 × 10⁻⁸ | 1.04 × 10⁻² | −1.48 × 10⁻⁸ |
| rs7070797 | a | 10 | 63,221,779 | C10orf107 | LTA SBP | −0.74 | 0.13 | 4.30 × 10⁻⁸ | V1 SBP | −0.73 | 0.14 | 1.17 × 10⁻⁶ | 1.58 × 10⁻² | −1.12 × 10⁻⁶ |
| rs2681472 | a | 12 | 88,533,090 | ATP2B1 | LTA SBP | 0.95 | 0.12 | 1.04 × 10⁻¹⁴ | V1 SBP | 0.93 | 0.13 | 1.69 × 10⁻¹¹ | −1.65 × 10⁻² | −1.69 × 10⁻¹¹ |
| rs4766578 | a | 12 | 110,388,754 | ATXN2 | LTA SBP | −0.56 | 0.09 | 2.82 × 10⁻⁹ | V1 SBP | −0.65 | 0.10 | 1.18 × 10⁻⁹ | −9.01 × 10⁻² | 1.64 × 10⁻⁹ |
| rs35444 | a | 12 | 114,036,820 | TBX3 | LTA SBP | 0.55 | 0.09 | 1.47 × 10⁻⁸ | V1 SBP | 0.51 | 0.11 | 2.63 × 10⁻⁶ | −3.03 × 10⁻² | −2.61 × 10⁻⁶ |
| rs11072518 | t | 15 | 73,021,663 | COX5A | LTA SBP | 0.57 | 0.09 | 6.54 × 10⁻⁹ | V1 SBP | 0.73 | 0.11 | 2.93 × 10⁻¹¹ | 1.61 × 10⁻¹ | 6.52 × 10⁻⁹ |
| rs6092743 | a | 20 | 57,133,765 | C20orf174 | LTA SBP | 0.84 | 0.14 | 2.25 × 10⁻⁸ | V1 SBP | 1.01 | 0.16 | 2.18 × 10⁻⁹ | 1.66 × 10⁻¹ | 2.03 × 10⁻⁸ |
| rs13306561 | a | 1 | 11,788,391 | MTHFR | LTA DBP | 0.48 | 0.07 | 2.08 × 10⁻¹⁰ | V1 DBP | 0.48 | 0.09 | 1.28 × 10⁻⁷ | 2.50 × 10⁻³ | −1.28 × 10⁻⁷ |
| rs2004776 | t | 1 | 228,915,325 | AGT | LTA DBP | 0.35 | 0.06 | 3.20 × 10⁻⁸ | V1 DBP | 0.44 | 0.07 | 1.53 × 10⁻⁸ | 8.31 × 10⁻² | 1.67 × 10⁻⁸ |
| rs7599598 | a | 2 | 96,715,567 | FER1L5 | LTA DBP | −0.31 | 0.05 | 2.91 × 10⁻⁸ | V1 DBP | −0.37 | 0.07 | 6.54 × 10⁻⁸ | −5.75 × 10⁻² | −3.63 × 10⁻⁸ |
| rs198823 | t | 6 | 26,230,912 | HFE | LTA DBP | −0.33 | 0.06 | 6.57 × 10⁻⁹ | V1 DBP | −0.32 | 0.07 | 4.52 × 10⁻⁶ | 1.51 × 10⁻² | −4.51 × 10⁻⁶ |
| rs12258967 | c | 10 | 18,767,965 | CACNB2 | LTA DBP | 0.35 | 0.06 | 2.48 × 10⁻⁹ | V1 DBP | 0.43 | 0.07 | 3.71 × 10⁻⁹ | 7.05 × 10⁻² | −1.23 × 10⁻⁹ |
| rs12244842 | t | 10 | 63,109,192 | C10orf107 | LTA DBP | −0.38 | 0.06 | 7.05 × 10⁻⁹ | V1 DBP | −0.43 | 0.08 | 6.15 × 10⁻⁸ | −4.89 × 10⁻² | −5.45 × 10⁻⁸ |
| rs2681472 | a | 12 | 88,533,090 | ATP2B1 | LTA DBP | 0.52 | 0.07 | 4.01 × 10⁻¹³ | V1 DBP | 0.58 | 0.09 | 8.68 × 10⁻¹¹ | 5.52 × 10⁻² | −8.64 × 10⁻¹¹ |
| rs3184504 | t | 12 | 110,368,991 | SH2B3 | LTA DBP | 0.39 | 0.05 | 6.08 × 10⁻¹³ | V1 DBP | 0.39 | 0.07 | 1.26 × 10⁻⁸ | −7.50 × 10⁻³ | −1.26 × 10⁻⁸ |
| rs1133323 | t | 15 | 72,999,278 | COX5A | LTA DBP | −0.33 | 0.05 | 2.66 × 10⁻⁹ | V1 DBP | −0.42 | 0.07 | 4.89 × 10⁻¹⁰ | −9.57 × 10⁻² | 2.17 × 10⁻⁹ |
| rs6092743 | a | 20 | 57,133,765 | C20orf174 | LTA DBP | 0.50 | 0.08 | 1.11 × 10⁻⁸ | V1 DBP | 0.71 | 0.10 | 3.37 × 10⁻¹¹ | 2.04 × 10⁻¹ | 1.11 × 10⁻⁸ |
| rs880315 | t | 1 | 10,719,453 | CASZ1 | LTA MAP | −0.46 | 0.07 | 5.49 × 10⁻¹¹ | V1 MAP | −0.43 | 0.08 | 1.47 × 10⁻⁷ | 2.86 × 10⁻² | −1.47 × 10⁻⁷ |
| rs13306561 | a | 1 | 11,788,391 | MTHFR | LTA MAP | 0.61 | 0.08 | 1.83 × 10⁻¹² | V1 MAP | 0.57 | 0.10 | 1.48 × 10⁻⁸ | −3.94 × 10⁻² | −1.48 × 10⁻⁸ |
| rs2004776 | t | 1 | 228,915,325 | AGT | LTA MAP | 0.42 | 0.07 | 1.18 × 10⁻⁸ | V1 MAP | 0.51 | 0.08 | 2.45 × 10⁻⁹ | 8.91 × 10⁻² | 9.33 × 10⁻⁹ |
| rs1275988 | t | 2 | 26,767,868 | KCNK3 | LTA MAP | −0.39 | 0.06 | 1.51 × 10⁻⁹ | V1 MAP | −0.34 | 0.07 | 7.06 × 10⁻⁶ | 4.63 × 10⁻² | −7.06 × 10⁻⁶ |
| rs12258967 | c | 10 | 18,767,965 | CACNB2 | LTA MAP | 0.45 | 0.07 | 4.98 × 10⁻¹¹ | V1 MAP | 0.50 | 0.08 | 5.57 × 10⁻¹⁰ | 4.52 × 10⁻² | −5.07 × 10⁻¹⁰ |
| rs2166122 | t | 10 | 63,193,080 | C10orf107 | LTA MAP | −0.48 | 0.08 | 1.88 × 10⁻⁹ | V1 MAP | −0.50 | 0.09 | 4.76 × 10⁻⁸ | −2.38 × 10⁻² | −4.57 × 10⁻⁸ |
| rs2681472 | a | 12 | 88,533,090 | ATP2B1 | LTA MAP | 0.69 | 0.08 | 1.77 × 10⁻¹⁶ | V1 MAP | 0.70 | 0.09 | 1.70 × 10⁻¹² | 9.17 × 10⁻³ | −1.70 × 10⁻¹² |
| rs3184504 | t | 12 | 110,368,991 | SH2B3 | LTA MAP | 0.45 | 0.06 | 1.68 × 10⁻¹² | V1 MAP | 0.47 | 0.07 | 3.71 × 10⁻¹⁰ | 2.50 × 10⁻² | −3.69 × 10⁻¹⁰ |
| rs35444 | a | 12 | 114,036,820 | TBX3 | LTA MAP | 0.36 | 0.06 | 3.20 × 10⁻⁸ | V1 MAP | 0.38 | 0.08 | 8.38 × 10⁻⁷ | 2.16 × 10⁻² | −8.06 × 10⁻⁷ |
| rs11072518 | t | 15 | 73,021,663 | COX5A | LTA MAP | 0.43 | 0.06 | 8.95 × 10⁻¹¹ | V1 MAP | 0.55 | 0.07 | 1.86 × 10⁻¹² | 1.15 × 10⁻¹ | 8.76 × 10⁻¹¹ |
| rs6092743 | a | 20 | 57,133,765 | C20orf174 | LTA MAP | 0.64 | 0.10 | 3.60 × 10⁻¹⁰ | V1 MAP | 0.81 | 0.11 | 1.12 × 10⁻¹¹ | 1.69 × 10⁻¹ | 3.49 × 10⁻¹⁰ |
| rs880315 | t | 1 | 10,719,453 | CASZ1 | LTA PP | −0.42 | 0.07 | 5.45 × 10⁻⁹ | V1 PP | −0.38 | 0.08 | 3.31 × 10⁻⁶ | 4.46 × 10⁻² | −3.31 × 10⁻⁶ |
| rs7650227 | t | 3 | 41,769,941 | ULK4 | LTA PP | 0.50 | 0.08 | 2.84 × 10⁻⁹ | V1 PP | 0.43 | 0.09 | 4.38 × 10⁻⁶ | −6.71 × 10⁻² | −4.38 × 10⁻⁶ |
| rs10948071 | t | 6 | 43,388,691 | CRIP3 | LTA PP | −0.38 | 0.07 | 9.06 × 10⁻⁹ | V1 PP | −0.29 | 0.07 | 1.11 × 10⁻⁴ | 9.49 × 10⁻² | −1.11 × 10⁻⁴ |
| rs2949837 | a | 7 | 45,960,903 | IGFBP3 | LTA PP | 0.40 | 0.07 | 2.94 × 10⁻⁸ | V1 PP | 0.36 | 0.08 | 6.88 × 10⁻⁶ | −3.79 × 10⁻² | −6.85 × 10⁻⁶ |
| rs12705390 | a | 7 | 106,198,013 | PIK3CG | LTA PP | 0.59 | 0.08 | 5.40 × 10⁻¹⁴ | V1 PP | 0.43 | 0.09 | 1.20 × 10⁻⁶ | −1.59 × 10⁻¹ | −1.20 × 10⁻⁶ |
Abbreviations are as follows: BP, blood pressure; Chr, chromosome; DBP, diastolic blood pressure; MAP, mean arterial pressure; LTA, long-term average; PP, pulse pressure; SBP, systolic blood pressure; and V1, visit 1.
To further evaluate the impact of LTA, we performed additional comparisons between the LTA and V1 BP association statistics by focusing on SBP and DBP results only. Comparisons of beta estimates, SEs, and chi-square values demonstrated the impact of averaging on the SE of the phenotypic estimate (Figure S5). Correlations between the genome-wide LTA and V1 association statistics were high; the correlations of standardized effect estimates were r2 = 0.82 for SBP and r2 = 0.80 for DBP. When restricted to the sentinel SNP-trait associations for SBP (13 SNPs) and DBP (ten SNPs), the correlations of the beta estimates were higher at r2 = 0.99 for both SBP and DBP.
In comparisons of the LTA and V1 association results, the p values for LTA SBP and LTA DBP summary results were generally lower than the corresponding V1 results (Table 5). However, in some regions, the association p values were lower in the V1 analyses, demonstrating that LTA might not enrich association signals in all genomic regions. We assessed the distribution of the lead LTA-identified SNPs (p < 5 × 10⁻⁸) across all loci by comparing the number of SNPs found at the tails of the ranked p value distribution for each trait in the LTA and V1 analyses. In each of the four traits, there was substantial enrichment of signals at the tails of the p value distribution in the LTA analyses (Table S9).
To study the general magnitude of the effect of LTA on the statistical power to detect SNP associations, we carried out a set of simulation experiments. Correlations of SBP and DBP across the four visits included in the ARIC analysis ranged from r = 0.60 to r = 0.73 (Table S10A). Using unstructured correlation structures resulted in similar estimates (data not shown). The simulations showed that LTA increases power by about 20% in most cases (Tables S10B and S10C). It can be a much larger increase if the initial power is very low. GEEs do not improve power over LTA by any significant amount. By comparison, our LTA results are largely consistent with the simulation results.
The simulation results are corroborated by the comparison of our LTA and V1 results: compared with V1 analyses, LTA analyses identified 17 additional trait-locus associations (two with DBP, seven with SBP, three with MAP, and five with PP, for a total of nine additional independent loci).
Enrichment Analysis
To further examine the extent of signal enrichment by LTA and to characterize regions with a lack of enrichment by LTA, we conducted a number of analyses. First, we plotted the V1 and LTA association statistics for all regions identified by either the LTA or the V1 analyses. Chromosomal region 12q21 (ATP2B1), which shows the strongest GWAS association signal for BP to date, and region 2p23 (KCNK3), which demonstrated enrichment of the association signal in our study, are shown in Figure 3; all other loci are shown in Figure S7. We also aligned LTA and V1 results for each region and calculated the K-S statistic for each region (Figures S8 and S9) and found that evidence of enrichment by the LTA procedure was specific to 21 trait-locus associations and that a significant lack of enrichment, or stronger V1 association signal, was a clear pattern noted at eight other trait-locus associations. One region showed mixed effects: some SNP associations were enriched by LTA, and some were significantly stronger in the V1 analyses (chromosomal region 3p22, ULK4). In 15 regions, the results were not significantly enriched in either the LTA or the V1 analyses (Table S11). Specifically, we identified enrichment by LTA in six regions for SBP (chromosome 1 near MTHFR [MIM 607093], chromosome 2 near KCNK3, chromosome 2 near GRB14 [MIM 601524], chromosome 5 near C5orf23, chromosome 7 near PIK3CG [MIM 601232], and chromosome 10 near C10orf107); in four regions for DBP (chromosome 1 in MTHFR, chromosome 5 near EBF1 [MIM 164343], chromosome 6 near HFE [MIM 613609], and chromosome 12 in SH2B3 [MIM 605093]); in four regions for MAP (chromosome 1 in CASZ1 [MIM 609895], chromosome 1 in MTHFR, chromosome 2 near KCNK3, and chromosome 12 in ATP2B1 [MIM 108731]); and in three regions for PP (chromosome 6 near CRIP3, chromosome 7 near IGFBP3, and chromosome 7 near PIK3CG).
Figure 3.
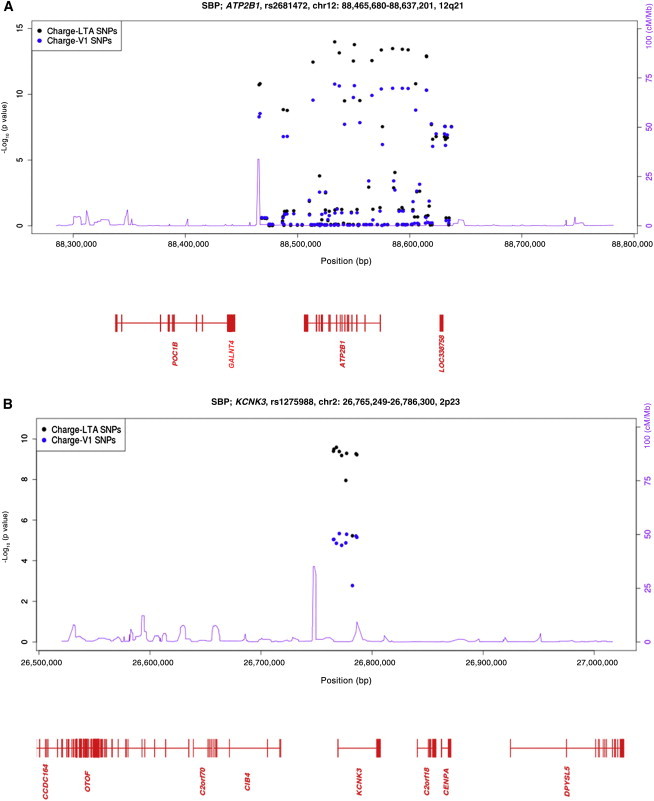
–Log p Values of Association Tests for ATP2B1 in Chromosomal Region 12q21 Demonstrate Enrichment by LTA
Plots of –log p values of association tests for LTA SBP are shown for (A) the 12q21 ATP2B1 region, known to be robustly associated with BP, and (B) the 2p23 KCNK3 region, which was identified in this study. Both regions demonstrated enrichment of the association signal by LTA. The results of the LTA SBP analysis are plotted in black, and the results of the corresponding V1 SBP analysis of the same individuals are plotted in blue.
Discussion
This study was designed to assess the effect of utilizing LTA of BP traits, from longitudinal measures, to detect genetic associations. The motivation for our analyses was to use a procedure that would reduce measurement errors and other variation sources that lower the statistical power of the analysis. In our LTA analyses, we discovered 39 trait-variant associations and uniquely identified four loci (2p23 [near KCNK3] for SBP and MAP, 2q11.2 [in FER1L5] for DBP, 6p21 [near CRIP3] for PP, and 7p13 [near IGFBP3] for PP). Replication testing in 34,433 independent European-ancestry samples and 5,600 Chinese-ancestry samples with V1 BP data definitively confirmed these associations at two (KCNK3 andCRIP3) of the four discovered loci, and these were carried forward to replication analyses. At IGFBP3, we found a nominal association not meeting statistical significance after adjustment for multiple-hypothesis testing. When we compared LTA and V1 associations in the same group of individuals, we observed that in some loci, the p values of LTA traits were two orders of magnitude lower than the corresponding V1 BP traits. Overall, we demonstrated enrichment of association signals with LTA by detecting a larger number of SNPs and loci. Through computer simulations, we estimated this increase in statistical power by LTA to be ∼20%, consistent with the results of our analyses of BP data.
Several sources of variability of BP affect the ability to detect genetic associations. First, there is physiologic, intraindividual variability following both diurnal patterns and longer-term and less predictable patterns as a result of individual-specific factors, such as changes in dietary intake of sodium. Second, there is variation in BP measurement as a result of imprecise measurement techniques and biases such as digit preference.61 Noise in the measurement of a quantitative trait adversely affects power to detect association signals, essentially by increasing the variance of the trait, and the study of BP in particular has been a notable example in which phenotypic imprecision has hampered our ability to detect alleles.62 Examples of this impact are also available in clinical pathology, where the variance for analysis measurements can be high for specific analyses, and when up to 20% of the variance derives from intraindividual variation and measurement error, this can result in a 15%–20% loss in power to detect statistical associations.63 Averaging has been studied in a number of epidemiologic applications, to BP and other continuous traits characterized by variability, where it can improve parameter estimation.64–67
We examined the statistical properties of the LTA procedure, and although it is a relatively simple procedure, there are several important implications of our results. First, LTA is expected to describe a more accurate estimate of an individual’s long-term BP value. We averaged two, three, or four visits—not the maximum number of available measurements, which could have been up to 15 visits in some cohorts—in order to keep phenotypic SEs generally comparable across the cohorts we studied. Other age-related trends, such as changes in body mass index (BMI), were accounted for in the visit-specific adjustment of BP traits by BMI at the corresponding visit. In published V1 BP association studies, finding associations for DBP has been more challenging, and there have generally been fewer findings for DBP than for SBP. Our results show a similar trend.
The overall improvement in power with LTA has important implications for study design in genetic association studies. For traits with few extraneous sources of “noise,” such as height, weight, or blood analyses measured with standardized clinical assays (such as lipid and hematology traits), GWASs have generally been fruitful in that they yield many positive associations explaining up to ∼10% of the phenotypic variance of these continuous traits. In the case of traits with many and varied sources of noise, such as BP, measures to improve phenotypic accuracy help identify additional loci. Typically, increasing sample size is the key strategy to increase statistical power, and this has been done widely in GWASs to detect associations with modest effect sizes. However, in the GWAS and meta-analysis approach, inclusion of additional cohorts to a meta-analysis might increase potential phenotypic and genetic variability, which cannot be adequately corrected for in the analysis. Our results demonstrate that trait averaging is a practical way to increase statistical power for quantitative phenotypes with substantial variability, such as BP, in population cohorts with longitudinal BP data. One surprising finding was that some of the associations identified in the V1 analyses were not detected in the LTA analyses, and in specific regions, the V1 analyses yielded stronger significance. A statistical hypothesis for this finding is regression to the mean, or winner’s curse, in the LTA analyses. Biologic hypotheses include possible physiologic intraindividual sources of variation, such as the known circadian pattern of BP, or variation of clinical relevance for which mechanisms are not known.68 As such, we recommend utilizing LTA to improve the precision of highly variable continuous traits for which measurement error or uncertainty is known. Further, we recommend considering concurrent analysis of LTA and single measurement of traits and an evaluation of any of the differences between the two sets of results for possible insights into the mechanism of the genetic association.
LTA can also capture additional useful information. LTA BP is a clinically relevant phenotype and is associated with cardiovascular disease (CVD) events and target organ damage, an intermediate phenotype for subsequent CVD events.64,69 Although single “casual” BP measurements in a population predict CVD,70 LTA BP, also referred to as “usual” BP, has been shown to be an important predictor of risk for future CVD events beyond single-measurement BP levels.71 In the clinical setting, treatment for high BP is typically recommended on the basis of repeated observations of elevated BP rather than a single elevated BP measurement, given the known variability and the finding that casual BP measurements might not reliably predict hypertension.61,72–75 Although precision of the BP estimate is improved, as we have demonstrated here, LTA has the potential to discard information and thus diminish signals by averaging as well. BP variability is also associated with CVD risk, and the finding of decreased association of signals previously linked to CVD risk (such as the 10p12 locus2) in the LTA analyses suggests that the relationship between our findings and CVD risk might be imparted through different mechanisms. This hypothesis would need to be formally tested through further hypothesis-driven laboratory experiments.
For the purposes of testing replication of our LTA findings, we conducted follow-up analyses in a set of GBPG Consortium and PUUMA cohorts not analyzed in the LTA analyses. However, these analyses were conducted with V1 BP results rather than LTA BP phenotypes. Also, the GBPG Consortium included a larger number of cohorts (17) in the replication testing than in the LTA discovery phase, increasing the potential variation in effect size across samples. Regardless, we confirmed association with V1 BP traits in three of our four regions tested for replication in samples of diverse ethnicity. The traits we report are highly correlated, and we take the set of associations we identified as determinants of BP traits in the general population. We compared the results of the analyses of LTA SBP and LTA DBP to the published findings of the International Consortium for Blood Pressure (ICBP), which is currently the largest GWAS and meta-analysis in individuals of European ancestry (n = 69,395).2 At a significance threshold of p < 5 × 10⁻⁸ in the analyses of LTA SBP and LTA DBP, we found 19 loci uniquely identified in the ICBP analysis (but not in our LTA analyses), ten loci identified by both the ICBP and LTA BP analyses, and six loci uniquely identified in the LTA BP analyses. Because the ICBP analysis also included the majority of the cohorts in our LTA analyses, concordance of many loci was expected.
We identified four loci in the LTA discovery analyses. We found an intergenic variant in high LD with SNPs extending into KCNK3 (also known as TASK1), which encodes a potassium channel, to be associated with LTA SBP and LTA MAP. Exome sequencing studies have shown that rare missense alleles in KCNK3 cause familial forms of pulmonary hypertension.76 Mice null for Task1 show lower SBP and have a defect in adrenal gland depolarization and fail to suppress aldosterone in response to increased dietary sodium load.77 We analyzed the data presented in a previously published report of MAP measured invasively in four Task1-null mice and six wild-type littermate mice78 in an unpaired t test (unequal variance was assumed) and found p = 0.0034. MAP in the Task1-null mice was approximately 9 mmHg lower (SD ± 2.4 mmHg). In FER1L5, which was associated with LTA DBP, we identified a nonsynonymous SNP (exon 21: c.2044A>G [p.Thr682Ala]) in our GWAS analysis. FER1L5 encodes Fer-1-like 5, identified in C. elegans, and its function has not been defined. Two loci, near CRIP3 (chromosomal region 6p21) and IGFBP3 (chromosomal region 7p13), were associated with LTA PP. The index SNP associated with LTA PP in the CRIP3 region was highly correlated with a nonsynonymous SNP (exon 8: c.563T>C [p.Ile188Thr]) in cysteine-rich protein 3 (CRIP3), whose vascular function has not been defined. The insulin-like growth factors (IGFs) and their binding proteins, of which IGFBP3 is one, regulate cellular proliferation and apoptosis, and IGF1 stimulates aortic elastin production during development.79 The lead SNP associated with LTA PP was in LD with SNPs extending across the gene, suggesting a possible functional variant within the gene or gene regulatory region, although a lack of an eQTL finding makes the latter less likely. IGFBP3 is expressed in the endothelium, and mice null for this gene show decreased retinal vessel growth.80 Serum levels of IGFBP3 are associated with measures of aortic stiffness, of which PP is an indicator,81 and a GWAS of circulating IGFBP3 amounts in plasma showed an association with IGFBP3 SNPs we identified.82 Circulating amounts of IGFBP3 are also related to SBP.83 Consequently, these genes identified by LTA analysis are highly plausible biological candidates for BP regulation.
The limitations of this study include loss of sample size due to the exclusion of individuals with data at only one visit. In the longitudinal cohorts studied here, the proportion lost to follow-up was low. However, bias might have also been introduced through studying only those individuals willing or able to participate at multiple exam cycles. In the discovery analyses, we used European-ancestry samples. Ethnic differences in interindividual variability in BP across years have not been not well defined, and we did not have an opportunity to evaluate this in our study. Although we gained phenotypic precision with LTA, we might have also lost information. BP tracking over time could be more precisely estimated with the use of more sophisticated statistical approaches rather than a crude average.66,67,84–90 As we demonstrated in our LTA and V1 direct comparisons, there is overall enrichment with LTA. However, in some specific regions, V1 analysis yields stronger results, as assessed by lower p values. The proportion of individuals treated with antihypertensive medication increased between the first and last visits in each cohort by varying amounts, potentially adding to the LTA analyses variability that we did not completely account for, although we did employ a standard correction method for antihypertensive medication use at each visit to attempt to correct for this. Finally, although we adjusted for age and age-squared, there might have been other age-dependent effects, particularly the known change in DBP that typically occurs in the fifth decade of life91 and across which our averages were obtained in many cases, which might explain the lower yield with LTA for DBP than for SBP. Consequently, there might be value in conducting parallel V1 and LTA analyses to identify BP-associated loci that are subsequently followed up and validated by independent biological studies.
In summary, we have evaluated the utility of averaging repeated BP measurements for the purposes of detecting genetic association. Alternate approaches to the study of BP phenotypes are needed, and we have demonstrated that LTA is useful for improving signal detection. Using LTA of BP traits, we identified and validated common variants at several known loci and at loci not previously known to be associated with BP, and we have shown that trait-averaging methods have important implications for study design of genetic analyses of quantitative traits and ultimately for improved hypothesis generation from GWASs.
Consortia
The members of the Global Blood Pressure Genetics Consortium are Christopher Newton-Cheh, Toby Johnson, Vesela Gateva, Martin D. Tobin, Murielle Bochud, Lachlan Coin, Samer S. Najjar, Jing Hua Zhao, Simon C. Heath, Susana Eyheramendy, Konstantinos Papadakis, Benjamin F. Voight, Laura J. Scott, Feng Zhang, Martin Farrall, Toshiko Tanaka, Chris Wallace, John C. Chambers, Kay-Tee Khaw, Peter Nilsson, Pim van der Harst, Silvia Polidoro, Diederick E. Grobbee, N. Charlotte Onland-Moret, Michiel L. Bots, Louise V. Wain, Katherine S. Elliott, Alexander Teumer, Jian’an Luan, Gavin Lucas, Johanna Kuusisto, Paul R. Burton, David Hadley, Wendy L. McArdle, Morris Brown, Anna Dominiczak, Stephen J. Newhouse, Nilesh J. Samani, John Webster, Eleftheria Zeggini, Jacques S. Beckmann, Sven Bergmann, Noha Lim, Kijoung Song, Peter Vollenweider, Gerard Waeber, Dawn M. Waterworth, Xin Yuan, Leif Groop, Marju Orho-Melander, Alessandra Allione, Alessandra Di Gregorio, Simonetta Guarrera, Salvatore Panico, Fulvio Ricceri, Valeria Romanazzi, Carlotta Sacerdote, Paolo Vineis, Inês Barroso, Manjinder S. Sandhu, Robert N. Luben, Gabriel J. Crawford, Pekka Jousilahti, Markus Perola, Michael Boehnke, Lori L. Bonnycastle, Francis S. Collins, Anne U. Jackson, Karen L. Mohlke, Heather M. Stringham, Timo T. Valle, Cristen J. Willer, Richard N. Bergman, Mario A. Morken, Angela Döring, Christian Gieger, Thomas Illig, Thomas Meitinger, Elin Org, Arne Pfeufer, H. Erich Wichmann, Sekar Kathiresan, Jaume Marrugat, Christopher J. O’Donnell, Stephen M. Schwartz, David S. Siscovick, Isaac Subirana, Nelson B. Freimer, Anna-Liisa Hartikainen, Mark I. McCarthy, Paul F. O’Reilly, Leena Peltonen, Anneli Pouta, Paul E. de Jong, Harold Snieder, Wiek H. van Gilst, Robert Clarke, Anuj Goel, Anders Hamsten, John F. Peden, Udo Seedorf, Ann-Christine Syvänen, Giovanni Tognoni, Edward G. Lakatta, Serena Sanna, Paul Scheet, David Schlessinger, Angelo Scuteri, Marcus Dörr, Florian Ernst, Stephan B. Felix, Georg Homuth, Roberto Lorbeer, Thorsten Reffelmann, Rainer Rettig, Uwe Völker, Pilar Galan, Ivo G. Gut, Serge Hercberg, G. Mark Lathrop, Diana Zeleneka, Panos Deloukas, Nicole Soranzo, Frances M. Williams, Guangju Zhai, Veikko Salomaa, Markku Laakso, Roberto Elosua, Nita G. Forouhi, Henry Völzke, Cuno S. Uiterwaal, Yvonne T van der Schouw, Mattijs E. Numans, Giuseppe Matullo, Gerjan Navis, Göran Berglund, Sheila A. Bingham, Jaspal S. Kooner, Andrew D. Paterson, John M. Connell, Stefania Bandinelli, Luigi Ferrucci, Hugh Watkins, Tim D. Spector, Jaakko Tuomilehto, David Altshuler, David P. Strachan, Maris Laan, Pierre Meneton, Nicholas J. Wareham, Manuela Uda, Marjo-Riitta Jarvelin, Vincent Mooser, Olle Melander, Ruth J.F. Loos, Paul Elliott, Gonçalo R. Abecasis, Mark Caulfield, and Patricia B. Munroe.
Acknowledgments
We thank all study participants, study personnel, and funding agencies. Full acknowledgments and funding information are provided in the Supplemental Data.
Contributor Information
Santhi K. Ganesh, Email: sganesh@umich.edu.
Aravinda Chakravarti, Email: aravinda@jhmi.edu.
Global Blood Pressure Genetics Consortium:
Christopher Newton-Cheh, Toby Johnson, Vesela Gateva, Martin D. Tobin, Murielle Bochud, Lachlan Coin, Samer S. Najjar, Jing Hua Zhao, Simon C. Heath, Susana Eyheramendy, Konstantinos Papadakis, Benjamin F. Voight, Laura J. Scott, Feng Zhang, Martin Farrall, Toshiko Tanaka, Chris Wallace, John C. Chambers, Kay-Tee Khaw, Peter Nilsson, Pim van der Harst, Silvia Polidoro, Diederick E. Grobbee, N. Charlotte Onland-Moret, Michiel L. Bots, Louise V. Wain, Katherine S. Elliott, Alexander Teumer, Jian’an Luan, Gavin Lucas, Johanna Kuusisto, Paul R. Burton, David Hadley, Wendy L. McArdle, Morris Brown, Anna Dominiczak, Stephen J. Newhouse, Nilesh J. Samani, John Webster, Eleftheria Zeggini, Jacques S. Beckmann, Sven Bergmann, Noha Lim, Kijoung Song, Peter Vollenweider, Gerard Waeber, Dawn M. Waterworth, Xin Yuan, Leif Groop, Marju Orho-Melander, Alessandra Allione, Alessandra Di Gregorio, Simonetta Guarrera, Salvatore Panico, Fulvio Ricceri, Valeria Romanazzi, Carlotta Sacerdote, Paolo Vineis, Inês Barroso, Manjinder S. Sandhu, Robert N. Luben, Gabriel J. Crawford, Pekka Jousilahti, Markus Perola, Michael Boehnke, Lori L. Bonnycastle, Francis S. Collins, Anne U. Jackson, Karen L. Mohlke, Heather M. Stringham, Timo T. Valle, Cristen J. Willer, Richard N. Bergman, Mario A. Morken, Angela Döring, Christian Gieger, Thomas Illig, Thomas Meitinger, Elin Org, Arne Pfeufer, H. Erich Wichmann, Sekar Kathiresan, Jaume Marrugat, Christopher J. O’Donnell, Stephen M. Schwartz, David S. Siscovick, Isaac Subirana, Nelson B. Freimer, Anna-Liisa Hartikainen, Mark I. McCarthy, Paul F. O’Reilly, Leena Peltonen, Anneli Pouta, Paul E. de Jong, Harold Snieder, Wiek H. van Gilst, Robert Clarke, Anuj Goel, Anders Hamsten, John F. Peden, Udo Seedorf, Ann-Christine Syvänen, Giovanni Tognoni, Edward G. Lakatta, Serena Sanna, Paul Scheet, David Schlessinger, Angelo Scuteri, Marcus Dörr, Florian Ernst, Stephan B. Felix, Georg Homuth, Roberto Lorbeer, Thorsten Reffelmann, Rainer Rettig, Uwe Völker, Pilar Galan, Ivo G. Gut, Serge Hercberg, G. Mark Lathrop, Diana Zeleneka, Panos Deloukas, Nicole Soranzo, Frances M. Williams, Guangju Zhai, Veikko Salomaa, Markku Laakso, Roberto Elosua, Nita G. Forouhi, Henry Völzke, Cuno S. Uiterwaal, Yvonne T van der Schouw, Mattijs E. Numans, Giuseppe Matullo, Gerjan Navis, Göran Berglund, Sheila A. Bingham, Jaspal S. Kooner, Andrew D. Paterson, John M. Connell, Stefania Bandinelli, Luigi Ferrucci, Hugh Watkins, Tim D. Spector, Jaakko Tuomilehto, David Altshuler, David P. Strachan, Maris Laan, Pierre Meneton, Nicholas J. Wareham, Manuela Uda, Marjo-Riitta Jarvelin, Vincent Mooser, Olle Melander, Ruth J.F. Loos, Paul Elliott, Gonçalo R. Abecasis, Mark Caulfield, and Patricia B. Munroe
Supplemental Data
Web Resources
The URLs for data presented herein are as follows:
eQTL resources from the Pritchard lab, http://eqtl.uchicago.edu/Home.html
Framingham SNP Health Association Resource (SHARe), http://www.ncbi.nlm.nih.gov/projects/gap/cgi-bin/study.cgi?study_id=phs000007.v2.p1
Online Mendelian Inheritance in Man (OMIM), http://www.omim.org
References
- 1.Lewington S., Clarke R., Qizilbash N., Peto R., Collins R., Prospective Studies Collaboration Age-specific relevance of usual blood pressure to vascular mortality: a meta-analysis of individual data for one million adults in 61 prospective studies. Lancet. 2002;360:1903–1913. doi: 10.1016/s0140-6736(02)11911-8. [DOI] [PubMed] [Google Scholar]
- 2.Ehret G.B., Munroe P.B., Rice K.M., Bochud M., Johnson A.D., Chasman D.I., Smith A.V., Tobin M.D., Verwoert G.C., Hwang S.J., International Consortium for Blood Pressure Genome-Wide Association Studies. CARDIoGRAM consortium. CKDGen Consortium. KidneyGen Consortium. EchoGen consortium. CHARGE-HF consortium Genetic variants in novel pathways influence blood pressure and cardiovascular disease risk. Nature. 2011;478:103–109. doi: 10.1038/nature10405. [DOI] [PMC free article] [PubMed] [Google Scholar]
- 3.Ganesh S.K., Tragante V., Guo W., Guo Y., Lanktree M.B., Smith E.N., Johnson T., Castillo B.A., Barnard J., Baumert J., CARDIOGRAM, METASTROKE. LifeLines Cohort Study Loci influencing blood pressure identified using a cardiovascular gene-centric array. Hum. Mol. Genet. 2013;22:1663–1678. doi: 10.1093/hmg/dds555. [DOI] [PMC free article] [PubMed] [Google Scholar]
- 4.Levy D., Ehret G.B., Rice K., Verwoert G.C., Launer L.J., Dehghan A., Glazer N.L., Morrison A.C., Johnson A.D., Aspelund T. Genome-wide association study of blood pressure and hypertension. Nat. Genet. 2009;41:677–687. doi: 10.1038/ng.384. [DOI] [PMC free article] [PubMed] [Google Scholar]
- 5.Newton-Cheh C., Johnson T., Gateva V., Tobin M.D., Bochud M., Coin L., Najjar S.S., Zhao J.H., Heath S.C., Eyheramendy S., Wellcome Trust Case Control Consortium Genome-wide association study identifies eight loci associated with blood pressure. Nat. Genet. 2009;41:666–676. doi: 10.1038/ng.361. [DOI] [PMC free article] [PubMed] [Google Scholar]
- 6.Chobanian A.V., Bakris G.L., Black H.R., Cushman W.C., Green L.A., Izzo J.L., Jr., Jones D.W., Materson B.J., Oparil S., Wright J.T., Jr., Roccella E.J., National Heart, Lung, and Blood Institute Joint National Committee on Prevention, Detection, Evaluation, and Treatment of High Blood Pressure. National High Blood Pressure Education Program Coordinating Committee The Seventh Report of the Joint National Committee on Prevention, Detection, Evaluation, and Treatment of High Blood Pressure: the JNC 7 report. J. Am. Med. Assoc. 2003;289:2560–2572. doi: 10.1001/jama.289.19.2560. [DOI] [PubMed] [Google Scholar]
- 7.Psaty B.M., O’Donnell C.J., Gudnason V., Lunetta K.L., Folsom A.R., Rotter J.I., Uitterlinden A.G., Harris T.B., Witteman J.C., Boerwinkle E., CHARGE Consortium Cohorts for Heart and Aging Research in Genomic Epidemiology (CHARGE) Consortium: Design of prospective meta-analyses of genome-wide association studies from 5 cohorts. Circ Cardiovasc Genet. 2009;2:73–80. doi: 10.1161/CIRCGENETICS.108.829747. [DOI] [PMC free article] [PubMed] [Google Scholar]
- 8.Purcell S., Neale B., Todd-Brown K., Thomas L., Ferreira M.A., Bender D., Maller J., Sklar P., de Bakker P.I., Daly M.J., Sham P.C. PLINK: a tool set for whole-genome association and population-based linkage analyses. Am. J. Hum. Genet. 2007;81:559–575. doi: 10.1086/519795. [DOI] [PMC free article] [PubMed] [Google Scholar]
- 9.Chen M.H., Yang Q. GWAF: an R package for genome-wide association analyses with family data. Bioinformatics. 2010;26:580–581. doi: 10.1093/bioinformatics/btp710. [DOI] [PMC free article] [PubMed] [Google Scholar]
- 10.Devlin B., Roeder K. Genomic control for association studies. Biometrics. 1999;55:997–1004. doi: 10.1111/j.0006-341x.1999.00997.x. [DOI] [PubMed] [Google Scholar]
- 11.Johnson A.D., Handsaker R.E., Pulit S.L., Nizzari M.M., O’Donnell C.J., de Bakker P.I. SNAP: a web-based tool for identification and annotation of proxy SNPs using HapMap. Bioinformatics. 2008;24:2938–2939. doi: 10.1093/bioinformatics/btn564. [DOI] [PMC free article] [PubMed] [Google Scholar]
- 12.Rantalainen M., Herrera B.M., Nicholson G., Bowden R., Wills Q.F., Min J.L., Neville M.J., Barrett A., Allen M., Rayner N.W. MicroRNA expression in abdominal and gluteal adipose tissue is associated with mRNA expression levels and partly genetically driven. PLoS ONE. 2011;6:e27338. doi: 10.1371/journal.pone.0027338. [DOI] [PMC free article] [PubMed] [Google Scholar]
- 13.Lin H., Dolmatova E.V., Morley M.P., Lunetta K.L., McManus D.D., Magnani J.W., Margulies K.B., Hakonarson H., del Monte F., Benjamin E.J. Gene expression and genetic variation in human atria. Heart Rhythm. 2014;11:266–271. doi: 10.1016/j.hrthm.2013.10.051. [DOI] [PMC free article] [PubMed] [Google Scholar]
- 14.Consortium G.T., GTEx Consortium The Genotype-Tissue Expression (GTEx) project. Nat. Genet. 2013;45:580–585. doi: 10.1038/ng.2653. [DOI] [PMC free article] [PubMed] [Google Scholar]
- 15.Qiu W., Cho M.H., Riley J.H., Anderson W.H., Singh D., Bakke P., Gulsvik A., Litonjua A.A., Lomas D.A., Crapo J.D., ECLIPSE Investigators Genetics of sputum gene expression in chronic obstructive pulmonary disease. PLoS ONE. 2011;6:e24395. doi: 10.1371/journal.pone.0024395. [DOI] [PMC free article] [PubMed] [Google Scholar]
- 16.Gutierrez-Arcelus M., Lappalainen T., Montgomery S.B., Buil A., Ongen H., Yurovsky A., Bryois J., Giger T., Romano L., Planchon A. Passive and active DNA methylation and the interplay with genetic variation in gene regulation. Elife. 2013;2:e00523. doi: 10.7554/eLife.00523. [DOI] [PMC free article] [PubMed] [Google Scholar]
- 17.Dimas A.S., Deutsch S., Stranger B.E., Montgomery S.B., Borel C., Attar-Cohen H., Ingle C., Beazley C., Gutierrez Arcelus M., Sekowska M. Common regulatory variation impacts gene expression in a cell type-dependent manner. Science. 2009;325:1246–1250. doi: 10.1126/science.1174148. [DOI] [PMC free article] [PubMed] [Google Scholar]
- 18.Grundberg E., Small K.S., Hedman A.K., Nica A.C., Buil A., Keildson S., Bell J.T., Yang T.P., Meduri E., Barrett A., Multiple Tissue Human Expression Resource (MuTHER) Consortium Mapping cis- and trans-regulatory effects across multiple tissues in twins. Nat. Genet. 2012;44:1084–1089. doi: 10.1038/ng.2394. [DOI] [PMC free article] [PubMed] [Google Scholar]
- 19.Ding J., Gudjonsson J.E., Liang L., Stuart P.E., Li Y., Chen W., Weichenthal M., Ellinghaus E., Franke A., Cookson W. Gene expression in skin and lymphoblastoid cells: Refined statistical method reveals extensive overlap in cis-eQTL signals. Am. J. Hum. Genet. 2010;87:779–789. doi: 10.1016/j.ajhg.2010.10.024. [DOI] [PMC free article] [PubMed] [Google Scholar]
- 20.Gao C., Tignor N.L., Salit J., Strulovici-Barel Y., Hackett N.R., Crystal R.G., Mezey J.G. HEFT: eQTL analysis of many thousands of expressed genes while simultaneously controlling for hidden factors. Bioinformatics. 2014;30:369–376. doi: 10.1093/bioinformatics/btt690. [DOI] [PMC free article] [PubMed] [Google Scholar]
- 21.Hao K., Bossé Y., Nickle D.C., Paré P.D., Postma D.S., Laviolette M., Sandford A., Hackett T.L., Daley D., Hogg J.C. Lung eQTLs to help reveal the molecular underpinnings of asthma. PLoS Genet. 2012;8:e1003029. doi: 10.1371/journal.pgen.1003029. [DOI] [PMC free article] [PubMed] [Google Scholar]
- 22.Quigley D.A., Fiorito E., Nord S., Van Loo P., Alnæs G.G., Fleischer T., Tost J., Moen Vollan H.K., Tramm T., Overgaard J. The 5p12 breast cancer susceptibility locus affects MRPS30 expression in estrogen-receptor positive tumors. Mol. Oncol. 2014;8:273–284. doi: 10.1016/j.molonc.2013.11.008. [DOI] [PMC free article] [PubMed] [Google Scholar]
- 23.Keildson S., Fadista J., Ladenvall C., Hedman A.K., Elgzyri T., Small K.S., Grundberg E., Nica A.C., Glass D., Richards J.B., MAGIC Consortium. DIAGRAM Consortium. MuTHER Consortium Expression of phosphofructokinase in skeletal muscle is influenced by genetic variation and associated with insulin sensitivity. Diabetes. 2014;63:1154–1165. doi: 10.2337/db13-1301. [DOI] [PMC free article] [PubMed] [Google Scholar]
- 24.Kabakchiev B., Silverberg M.S. Expression quantitative trait loci analysis identifies associations between genotype and gene expression in human intestine. Gastroenterology. 2013;144:1488–1496.e1–e3. doi: 10.1053/j.gastro.2013.03.001. [DOI] [PMC free article] [PubMed] [Google Scholar]
- 25.Grundberg E., Kwan T., Ge B., Lam K.C., Koka V., Kindmark A., Mallmin H., Dias J., Verlaan D.J., Ouimet M. Population genomics in a disease targeted primary cell model. Genome Res. 2009;19:1942–1952. doi: 10.1101/gr.095224.109. [DOI] [PMC free article] [PubMed] [Google Scholar]
- 26.Schröder A., Klein K., Winter S., Schwab M., Bonin M., Zell A., Zanger U.M. Genomics of ADME gene expression: mapping expression quantitative trait loci relevant for absorption, distribution, metabolism and excretion of drugs in human liver. Pharmacogenomics J. 2013;13:12–20. doi: 10.1038/tpj.2011.44. [DOI] [PMC free article] [PubMed] [Google Scholar]
- 27.Innocenti F., Cooper G.M., Stanaway I.B., Gamazon E.R., Smith J.D., Mirkov S., Ramirez J., Liu W., Lin Y.S., Moloney C. Identification, replication, and functional fine-mapping of expression quantitative trait loci in primary human liver tissue. PLoS Genet. 2011;7:e1002078. doi: 10.1371/journal.pgen.1002078. [DOI] [PMC free article] [PubMed] [Google Scholar]
- 28.Greenawalt D.M., Dobrin R., Chudin E., Hatoum I.J., Suver C., Beaulaurier J., Zhang B., Castro V., Zhu J., Sieberts S.K. A survey of the genetics of stomach, liver, and adipose gene expression from a morbidly obese cohort. Genome Res. 2011;21:1008–1016. doi: 10.1101/gr.112821.110. [DOI] [PMC free article] [PubMed] [Google Scholar]
- 29.Schadt E.E., Molony C., Chudin E., Hao K., Yang X., Lum P.Y., Kasarskis A., Zhang B., Wang S., Suver C. Mapping the genetic architecture of gene expression in human liver. PLoS Biol. 2008;6:e107. doi: 10.1371/journal.pbio.0060107. [DOI] [PMC free article] [PubMed] [Google Scholar]
- 30.Zhang B., Gaiteri C., Bodea L.G., Wang Z., McElwee J., Podtelezhnikov A.A., Zhang C., Xie T., Tran L., Dobrin R. Integrated systems approach identifies genetic nodes and networks in late-onset Alzheimer’s disease. Cell. 2013;153:707–720. doi: 10.1016/j.cell.2013.03.030. [DOI] [PMC free article] [PubMed] [Google Scholar]
- 31.Gamazon E.R., Badner J.A., Cheng L., Zhang C., Zhang D., Cox N.J., Gershon E.S., Kelsoe J.R., Greenwood T.A., Nievergelt C.M. Enrichment of cis-regulatory gene expression SNPs and methylation quantitative trait loci among bipolar disorder susceptibility variants. Mol. Psychiatry. 2013;18:340–346. doi: 10.1038/mp.2011.174. [DOI] [PMC free article] [PubMed] [Google Scholar]
- 32.Zou F., Chai H.S., Younkin C.S., Allen M., Crook J., Pankratz V.S., Carrasquillo M.M., Rowley C.N., Nair A.A., Middha S., Alzheimer’s Disease Genetics Consortium Brain expression genome-wide association study (eGWAS) identifies human disease-associated variants. PLoS Genet. 2012;8:e1002707. doi: 10.1371/journal.pgen.1002707. [DOI] [PMC free article] [PubMed] [Google Scholar]
- 33.Kim S., Cho H., Lee D., Webster M.J. Association between SNPs and gene expression in multiple regions of the human brain. Transcult. Psychiatry. 2012;2:e113. doi: 10.1038/tp.2012.42. [DOI] [PMC free article] [PubMed] [Google Scholar]
- 34.Gibbs J.R., van der Brug M.P., Hernandez D.G., Traynor B.J., Nalls M.A., Lai S.L., Arepalli S., Dillman A., Rafferty I.P., Troncoso J. Abundant quantitative trait loci exist for DNA methylation and gene expression in human brain. PLoS Genet. 2010;6:e1000952. doi: 10.1371/journal.pgen.1000952. [DOI] [PMC free article] [PubMed] [Google Scholar]
- 35.Liu C., Cheng L., Badner J.A., Zhang D., Craig D.W., Redman M., Gershon E.S. Whole-genome association mapping of gene expression in the human prefrontal cortex. Mol. Psychiatry. 2010;15:779–784. doi: 10.1038/mp.2009.128. [DOI] [PMC free article] [PubMed] [Google Scholar]
- 36.Colantuoni C., Lipska B.K., Ye T., Hyde T.M., Tao R., Leek J.T., Colantuoni E.A., Elkahloun A.G., Herman M.M., Weinberger D.R., Kleinman J.E. Temporal dynamics and genetic control of transcription in the human prefrontal cortex. Nature. 2011;478:519–523. doi: 10.1038/nature10524. [DOI] [PMC free article] [PubMed] [Google Scholar]
- 37.Webster J.A., Gibbs J.R., Clarke J., Ray M., Zhang W., Holmans P., Rohrer K., Zhao A., Marlowe L., Kaleem M., NACC-Neuropathology Group Genetic control of human brain transcript expression in Alzheimer disease. Am. J. Hum. Genet. 2009;84:445–458. doi: 10.1016/j.ajhg.2009.03.011. [DOI] [PMC free article] [PubMed] [Google Scholar]
- 38.Heinzen E.L., Ge D., Cronin K.D., Maia J.M., Shianna K.V., Gabriel W.N., Welsh-Bohmer K.A., Hulette C.M., Denny T.N., Goldstein D.B. Tissue-specific genetic control of splicing: implications for the study of complex traits. PLoS Biol. 2008;6:e1. doi: 10.1371/journal.pbio.1000001. [DOI] [PMC free article] [PubMed] [Google Scholar]
- 39.Li Q., Seo J.H., Stranger B., McKenna A., Pe’er I., Laframboise T., Brown M., Tyekucheva S., Freedman M.L. Integrative eQTL-based analyses reveal the biology of breast cancer risk loci. Cell. 2013;152:633–641. doi: 10.1016/j.cell.2012.12.034. [DOI] [PMC free article] [PubMed] [Google Scholar]
- 40.Kompass K.S., Witte J.S. Co-regulatory expression quantitative trait loci mapping: method and application to endometrial cancer. BMC Med. Genomics. 2011;4:6. doi: 10.1186/1755-8794-4-6. [DOI] [PMC free article] [PubMed] [Google Scholar]
- 41.Emilsson V., Thorleifsson G., Zhang B., Leonardson A.S., Zink F., Zhu J., Carlson S., Helgason A., Walters G.B., Gunnarsdottir S. Genetics of gene expression and its effect on disease. Nature. 2008;452:423–428. doi: 10.1038/nature06758. [DOI] [PubMed] [Google Scholar]
- 42.Zhernakova D.V., de Klerk E., Westra H.J., Mastrokolias A., Amini S., Ariyurek Y., Jansen R., Penninx B.W., Hottenga J.J., Willemsen G. DeepSAGE reveals genetic variants associated with alternative polyadenylation and expression of coding and non-coding transcripts. PLoS Genet. 2013;9:e1003594. doi: 10.1371/journal.pgen.1003594. [DOI] [PMC free article] [PubMed] [Google Scholar]
- 43.Westra H.J., Peters M.J., Esko T., Yaghootkar H., Schurmann C., Kettunen J., Christiansen M.W., Fairfax B.P., Schramm K., Powell J.E. Systematic identification of trans eQTLs as putative drivers of known disease associations. Nat. Genet. 2013;45:1238–1243. doi: 10.1038/ng.2756. [DOI] [PMC free article] [PubMed] [Google Scholar]
- 44.Sasayama D., Hori H., Nakamura S., Miyata R., Teraishi T., Hattori K., Ota M., Yamamoto N., Higuchi T., Amano N., Kunugi H. Identification of single nucleotide polymorphisms regulating peripheral blood mRNA expression with genome-wide significance: an eQTL study in the Japanese population. PLoS ONE. 2013;8:e54967. doi: 10.1371/journal.pone.0054967. [DOI] [PMC free article] [PubMed] [Google Scholar]
- 45.Mehta D., Heim K., Herder C., Carstensen M., Eckstein G., Schurmann C., Homuth G., Nauck M., Völker U., Roden M. Impact of common regulatory single-nucleotide variants on gene expression profiles in whole blood. Eur. J. Hum. Genet. 2013;21:48–54. doi: 10.1038/ejhg.2012.106. [DOI] [PMC free article] [PubMed] [Google Scholar]
- 46.Liang L., Morar N., Dixon A.L., Lathrop G.M., Abecasis G.R., Moffatt M.F., Cookson W.O. A cross-platform analysis of 14,177 expression quantitative trait loci derived from lymphoblastoid cell lines. Genome Res. 2013;23:716–726. doi: 10.1101/gr.142521.112. [DOI] [PMC free article] [PubMed] [Google Scholar]
- 47.Landmark-Høyvik H., Dumeaux V., Nebdal D., Lund E., Tost J., Kamatani Y., Renault V., Børresen-Dale A.L., Kristensen V., Edvardsen H. Genome-wide association study in breast cancer survivors reveals SNPs associated with gene expression of genes belonging to MHC class I and II. Genomics. 2013;102:278–287. doi: 10.1016/j.ygeno.2013.07.006. [DOI] [PubMed] [Google Scholar]
- 48.Kwan T., Benovoy D., Dias C., Gurd S., Provencher C., Beaulieu P., Hudson T.J., Sladek R., Majewski J. Genome-wide analysis of transcript isoform variation in humans. Nat. Genet. 2008;40:225–231. doi: 10.1038/ng.2007.57. [DOI] [PubMed] [Google Scholar]
- 49.Idaghdour Y., Czika W., Shianna K.V., Lee S.H., Visscher P.M., Martin H.C., Miclaus K., Jadallah S.J., Goldstein D.B., Wolfinger R.D., Gibson G. Geographical genomics of human leukocyte gene expression variation in southern Morocco. Nat. Genet. 2010;42:62–67. doi: 10.1038/ng.495. [DOI] [PMC free article] [PubMed] [Google Scholar]
- 50.Heap G.A., Trynka G., Jansen R.C., Bruinenberg M., Swertz M.A., Dinesen L.C., Hunt K.A., Wijmenga C., Vanheel D.A., Franke L. Complex nature of SNP genotype effects on gene expression in primary human leucocytes. BMC Med. Genomics. 2009;2:1. doi: 10.1186/1755-8794-2-1. [DOI] [PMC free article] [PubMed] [Google Scholar]
- 51.Göring H.H., Curran J.E., Johnson M.P., Dyer T.D., Charlesworth J., Cole S.A., Jowett J.B., Abraham L.J., Rainwater D.L., Comuzzie A.G. Discovery of expression QTLs using large-scale transcriptional profiling in human lymphocytes. Nat. Genet. 2007;39:1208–1216. doi: 10.1038/ng2119. [DOI] [PubMed] [Google Scholar]
- 52.Fehrmann R.S., Jansen R.C., Veldink J.H., Westra H.J., Arends D., Bonder M.J., Fu J., Deelen P., Groen H.J., Smolonska A. Trans-eQTLs reveal that independent genetic variants associated with a complex phenotype converge on intermediate genes, with a major role for the HLA. PLoS Genet. 2011;7:e1002197. doi: 10.1371/journal.pgen.1002197. [DOI] [PMC free article] [PubMed] [Google Scholar]
- 53.Dixon A.L., Liang L., Moffatt M.F., Chen W., Heath S., Wong K.C., Taylor J., Burnett E., Gut I., Farrall M. A genome-wide association study of global gene expression. Nat. Genet. 2007;39:1202–1207. doi: 10.1038/ng2109. [DOI] [PubMed] [Google Scholar]
- 54.Cusanovich D.A., Billstrand C., Zhou X., Chavarria C., De Leon S., Michelini K., Pai A.A., Ober C., Gilad Y. The combination of a genome-wide association study of lymphocyte count and analysis of gene expression data reveals novel asthma candidate genes. Hum. Mol. Genet. 2012;21:2111–2123. doi: 10.1093/hmg/dds021. [DOI] [PMC free article] [PubMed] [Google Scholar]
- 55.Benton M.C., Lea R.A., Macartney-Coxson D., Carless M.A., Göring H.H., Bellis C., Hanna M., Eccles D., Chambers G.K., Curran J.E. Mapping eQTLs in the Norfolk Island genetic isolate identifies candidate genes for CVD risk traits. Am. J. Hum. Genet. 2013;93:1087–1099. doi: 10.1016/j.ajhg.2013.11.004. [DOI] [PMC free article] [PubMed] [Google Scholar]
- 56.Battle A., Mostafavi S., Zhu X., Potash J.B., Weissman M.M., McCormick C., Haudenschild C.D., Beckman K.B., Shi J., Mei R. Characterizing the genetic basis of transcriptome diversity through RNA-sequencing of 922 individuals. Genome Res. 2014;24:14–24. doi: 10.1101/gr.155192.113. [DOI] [PMC free article] [PubMed] [Google Scholar]
- 57.Zeller T., Wild P., Szymczak S., Rotival M., Schillert A., Castagne R., Maouche S., Germain M., Lackner K., Rossmann H. Genetics and beyond—the transcriptome of human monocytes and disease susceptibility. PLoS ONE. 2010;5:e10693. doi: 10.1371/journal.pone.0010693. [DOI] [PMC free article] [PubMed] [Google Scholar]
- 58.van Eijk K.R., de Jong S., Boks M.P., Langeveld T., Colas F., Veldink J.H., de Kovel C.G., Janson E., Strengman E., Langfelder P. Genetic analysis of DNA methylation and gene expression levels in whole blood of healthy human subjects. BMC Genomics. 2012;13:636. doi: 10.1186/1471-2164-13-636. [DOI] [PMC free article] [PubMed] [Google Scholar]
- 59.Stranger B.E., Nica A.C., Forrest M.S., Dimas A., Bird C.P., Beazley C., Ingle C.E., Dunning M., Flicek P., Koller D. Population genomics of human gene expression. Nat. Genet. 2007;39:1217–1224. doi: 10.1038/ng2142. [DOI] [PMC free article] [PubMed] [Google Scholar]
- 60.Murphy A., Chu J.H., Xu M., Carey V.J., Lazarus R., Liu A., Szefler S.J., Strunk R., Demuth K., Castro M. Mapping of numerous disease-associated expression polymorphisms in primary peripheral blood CD4+ lymphocytes. Hum. Mol. Genet. 2010;19:4745–4757. doi: 10.1093/hmg/ddq392. [DOI] [PMC free article] [PubMed] [Google Scholar]
- 61.Variability of blood pressure and the results of screening in the hypertension detection and follow-up program. J. Chronic Dis. 1978;31:651–667. doi: 10.1016/0021-9681(78)90069-3. [DOI] [PubMed] [Google Scholar]
- 62.Wellcome Trust Case Control Consortium Genome-wide association study of 14,000 cases of seven common diseases and 3,000 shared controls. Nature. 2007;447:661–678. doi: 10.1038/nature05911. [DOI] [PMC free article] [PubMed] [Google Scholar]
- 63.Chasman D.I., Paré G., Ridker P.M. Population-based genomewide genetic analysis of common clinical chemistry analytes. Clin. Chem. 2009;55:39–51. doi: 10.1373/clinchem.2008.107243. [DOI] [PubMed] [Google Scholar]
- 64.Wang T.D., Sheu W.H. From casual blood pressure measurement to long-term blood pressure burden: better elucidation of the association between versatile blood pressures and cardiovascular events. Hypertens. Res. 2011;34:49–51. doi: 10.1038/hr.2010.204. [DOI] [PubMed] [Google Scholar]
- 65.Rosner B., Willett W.C., Spiegelman D. Correction of logistic regression relative risk estimates and confidence intervals for systematic within-person measurement error. Stat. Med. 1989;8:1051–1069. doi: 10.1002/sim.4780080905. discussion 1071–1073. [DOI] [PubMed] [Google Scholar]
- 66.Gillman M.W., Rosner B., Evans D.A., Keough M.E., Smith L.A., Taylor J.O., Hennekens C.H. Use of multiple visits to increase blood pressure tracking correlations in childhood. Pediatrics. 1991;87:708–711. [PubMed] [Google Scholar]
- 67.Zinner S.H., Margolius H.S., Rosner B., Kass E.H. Stability of blood pressure rank and urinary kallikrein concentration in childhood: an eight-year follow-up. Circulation. 1978;58:908–915. doi: 10.1161/01.cir.58.5.908. [DOI] [PubMed] [Google Scholar]
- 68.Rossignol P., Cridlig J., Lehert P., Kessler M., Zannad F. Visit-to-visit blood pressure variability is a strong predictor of cardiovascular events in hemodialysis: insights from FOSIDIAL. Hypertension. 2012;60:339–346. doi: 10.1161/HYPERTENSIONAHA.111.190397. [DOI] [PubMed] [Google Scholar]
- 69.Wilson P.W., Hoeg J.M., D’Agostino R.B., Silbershatz H., Belanger A.M., Poehlmann H., O’Leary D., Wolf P.A. Cumulative effects of high cholesterol levels, high blood pressure, and cigarette smoking on carotid stenosis. N. Engl. J. Med. 1997;337:516–522. doi: 10.1056/NEJM199708213370802. [DOI] [PubMed] [Google Scholar]
- 70.Kannel W.B., Gordon T., Schwartz M.J. Systolic versus diastolic blood pressure and risk of coronary heart disease. The Framingham study. Am. J. Cardiol. 1971;27:335–346. doi: 10.1016/0002-9149(71)90428-0. [DOI] [PubMed] [Google Scholar]
- 71.Vasan R.S., Massaro J.M., Wilson P.W., Seshadri S., Wolf P.A., Levy D., D’Agostino R.B., Framingham Heart Study Antecedent blood pressure and risk of cardiovascular disease: the Framingham Heart Study. Circulation. 2002;105:48–53. doi: 10.1161/hc0102.101774. [DOI] [PubMed] [Google Scholar]
- 72.Carey R.M., Reid R.A., Ayers C.R., Lynch S.S., McLain W.L., 3rd, Vaughan E.D., Jr. The Charlottesville Blood-Pressure Survey. Value of repeated blood-pressure measurements. J. Am. Med. Assoc. 1976;236:847–851. [PubMed] [Google Scholar]
- 73.Blood pressure studies in 14 communities. A two-stage screen for hypertension. J. Am. Med. Assoc. 1977;237:2385–2391. doi: 10.1001/jama.1977.03270490025018. [DOI] [PubMed] [Google Scholar]
- 74.Rosner B., Polk B.F. The implications of blood pressure variability for clinical and screening purposes. J. Chronic Dis. 1979;32:451–461. doi: 10.1016/0021-9681(79)90105-x. [DOI] [PubMed] [Google Scholar]
- 75.Rosner B., Polk B.F. The instability of blood pressure variability over time. J. Chronic Dis. 1981;34:135–139. doi: 10.1016/0021-9681(81)90023-0. [DOI] [PubMed] [Google Scholar]
- 76.Ma L., Roman-Campos D., Austin E.D., Eyries M., Sampson K.S., Soubrier F., Germain M., Trégouët D.A., Borczuk A., Rosenzweig E.B. A novel channelopathy in pulmonary arterial hypertension. N. Engl. J. Med. 2013;369:351–361. doi: 10.1056/NEJMoa1211097. [DOI] [PMC free article] [PubMed] [Google Scholar]
- 77.Davies L.A., Hu C., Guagliardo N.A., Sen N., Chen X., Talley E.M., Carey R.M., Bayliss D.A., Barrett P.Q. TASK channel deletion in mice causes primary hyperaldosteronism. Proc. Natl. Acad. Sci. USA. 2008;105:2203–2208. doi: 10.1073/pnas.0712000105. [DOI] [PMC free article] [PubMed] [Google Scholar]
- 78.Muhammad S., Aller M.I., Maser-Gluth C., Schwaninger M., Wisden W. Expression of the kcnk3 potassium channel gene lessens the injury from cerebral ischemia, most likely by a general influence on blood pressure. Neuroscience. 2010;167:758–764. doi: 10.1016/j.neuroscience.2010.02.024. [DOI] [PubMed] [Google Scholar]
- 79.Wolfe B.L., Rich C.B., Goud H.D., Terpstra A.J., Bashir M., Rosenbloom J., Sonenshein G.E., Foster J.A. Insulin-like growth factor-I regulates transcription of the elastin gene. J. Biol. Chem. 1993;268:12418–12426. [PubMed] [Google Scholar]
- 80.Lofqvist C., Chen J., Connor K.M., Smith A.C., Aderman C.M., Liu N., Pintar J.E., Ludwig T., Hellstrom A., Smith L.E. IGFBP3 suppresses retinopathy through suppression of oxygen-induced vessel loss and promotion of vascular regrowth. Proc. Natl. Acad. Sci. USA. 2007;104:10589–10594. doi: 10.1073/pnas.0702031104. [DOI] [PMC free article] [PubMed] [Google Scholar]
- 81.Zachariah J.P., Xanthakis V., Larson M.G., Vita J.A., Sullivan L.M., Smith H.M., Safa R., Peng X., Hamburg N., Levy D. Circulating vascular growth factors and central hemodynamic load in the community. Hypertension. 2012;59:773–779. doi: 10.1161/HYPERTENSIONAHA.111.179242. [DOI] [PMC free article] [PubMed] [Google Scholar]
- 82.Kaplan R.C., Petersen A.K., Chen M.H., Teumer A., Glazer N.L., Döring A., Lam C.S., Friedrich N., Newman A., Müller M. A genome-wide association study identifies novel loci associated with circulating IGF-I and IGFBP-3. Hum. Mol. Genet. 2011;20:1241–1251. doi: 10.1093/hmg/ddq560. [DOI] [PMC free article] [PubMed] [Google Scholar]
- 83.Lam C.S., Chen M.H., Lacey S.M., Yang Q., Sullivan L.M., Xanthakis V., Safa R., Smith H.M., Peng X., Sawyer D.B., Vasan R.S. Circulating insulin-like growth factor-1 and its binding protein-3: metabolic and genetic correlates in the community. Arterioscler. Thromb. Vasc. Biol. 2010;30:1479–1484. doi: 10.1161/ATVBAHA.110.203943. [DOI] [PMC free article] [PubMed] [Google Scholar]
- 84.Beckett L.A., Rosner B., Roche A.F., Guo S. Serial changes in blood pressure from adolescence into adulthood. Am. J. Epidemiol. 1992;135:1166–1177. doi: 10.1093/oxfordjournals.aje.a116217. [DOI] [PubMed] [Google Scholar]
- 85.Chen X., Wang Y. Tracking of blood pressure from childhood to adulthood: a systematic review and meta-regression analysis. Circulation. 2008;117:3171–3180. doi: 10.1161/CIRCULATIONAHA.107.730366. [DOI] [PMC free article] [PubMed] [Google Scholar]
- 86.Chen X., Wang Y., Appel L.J., Mi J. Impacts of measurement protocols on blood pressure tracking from childhood into adulthood: a metaregression analysis. Hypertension. 2008;51:642–649. doi: 10.1161/HYPERTENSIONAHA.107.102145. [DOI] [PubMed] [Google Scholar]
- 87.Cook N.R., Rosner B.A., Chen W., Srinivasan S.R., Berenson G.S. Using the area under the curve to reduce measurement error in predicting young adult blood pressure from childhood measures. Stat. Med. 2004;23:3421–3435. doi: 10.1002/sim.1921. [DOI] [PubMed] [Google Scholar]
- 88.Gillman M.W., Cook N.R., Rosner B., Evans D.A., Keough M.E., Taylor J.O., Hennekens C.H. Assessing the validity of childhood blood pressure screening: unbiased estimates of sensitivity, specificity, and predictive values. Epidemiology. 1992;3:40–46. doi: 10.1097/00001648-199201000-00008. [DOI] [PubMed] [Google Scholar]
- 89.Kollias A., Pantsiotou K., Karpettas N., Roussias L., Stergiou G.S. Tracking of blood pressure from childhood to adolescence in a Greek cohort. Eur. J. Public Health. 2012;22:389–393. doi: 10.1093/eurpub/ckr082. [DOI] [PubMed] [Google Scholar]
- 90.Sundström J., Sullivan L., D’Agostino R.B., Levy D., Kannel W.B., Vasan R.S. Relations of serum uric acid to longitudinal blood pressure tracking and hypertension incidence. Hypertension. 2005;45:28–33. doi: 10.1161/01.HYP.0000150784.92944.9a. [DOI] [PubMed] [Google Scholar]
- 91.Franklin S.S., Gustin W., 4th, Wong N.D., Larson M.G., Weber M.A., Kannel W.B., Levy D. Hemodynamic patterns of age-related changes in blood pressure. The Framingham Heart Study. Circulation. 1997;96:308–315. doi: 10.1161/01.cir.96.1.308. [DOI] [PubMed] [Google Scholar]
Associated Data
This section collects any data citations, data availability statements, or supplementary materials included in this article.